Embed Size (px)
Citation preview
WP/16/35
Private Sector Activity in Hong Kong SAR and the Fed: Transmission Effects through the Currency Board
by Joong Shik Kang
© 2016 International Monetary Fund WP/16/35
IMF Working Paper
Asia and Pacific Department
Private Sector Activity in Hong Kong SAR and the Fed: Transmission Effects through the Currency Board
Prepared by Joong Shik Kang1
Authorized for distribution by James Alexander Daniel
February 2016
Abstract
As the U.S. Fed begins to increase the Federal Funds rate, interest rates in Hong Kong SAR will rise in tandem under the Currency Board system. While domestic economic activity in Hong Kong SAR remained resilient in previous rate hike cycles, there is a concern that the impact of higher interest rates would be larger this time due to historic high levels of leverage in both household and corporate sectors. However, macroprudential measures have contained the debt service burden among new borrowers and leverage quality of corporate sector is healthier than its peers in the region. Empirical estimations of aggregate consumption and corporate investment show that private domestic demand is likely to remain robust with the anticipated gradual increase in interest rates over the next few years and taking into account the buffers in the system.
JEL Classification Numbers: E21; E22; F62
Keywords: Liftoff; Consumption; Investment; Leverage: Interest Rates
Author’s E-Mail Address: [email protected]
1 We would like to thank Malhar Nabar and seminar participants at HKMA for valuable comments.
IMF Working Papers describe research in progress by the author(s) and are published to elicit comments and to encourage debate. The views expressed in IMF Working Papers are those of the author(s) and do not necessarily represent the views of the IMF, its Executive Board, or IMF management.
Contents Page
I. Introduction ............................................................................................................................3
II. Past Episodes of Fed Tightening in the era of Hong Kong SAR’s Currency Board .............4
III. Current Economic Setup in Hong Kong SAR .....................................................................6
IV. Empirical Estimation ...........................................................................................................9
V. Conclusion ..........................................................................................................................13 Figures 1. Expected Pace of Policy Rates ..............................................................................................4 2. Short-term Money Market Rates ...........................................................................................5 3. Short-term Government Bond Rates ......................................................................................5 4. Long-term Government Bond Rates ......................................................................................5 5. Benchmarket Lending Rates .................................................................................................5 6. Short-term Money Market Rates in Previous Upcycles ........................................................5 7. Benchmarket Lending Rates in Previous Upcycles ...............................................................5 8. GDP Growth ..........................................................................................................................6 9. Growth in Private Domestic Demand ...................................................................................6 10. Household and Croporate Debt ............................................................................................6 11. Leverage Ratio Comparison ................................................................................................8 12. Short-term-to-Long-term Debt Ratio Comparison ..............................................................8 13. Corporate Debt by Leverage Ratio Comparison .................................................................8 14. Corporate Debt by Interest Coverage Ratio Comparison ....................................................8 15. Corporate Debt by Interest Coverage Ratio in Hong Kong SAR ........................................9 16. Stress Test: Debt of Firms of Interest Coverage Ratio Less than One ................................9 References ...............................................................................................................................14
3
I. INTRODUCTION
Hong Kong SAR’s economy has operated with short-term interest rates near zero and long yields at near-historic lows for the past seven years after the U.S. Fed lowered its federal funds rate to near zero with the onset of the global financial crisis. Since Hong Kong SAR launched the Linked Exchange Rate System (LERS) in October 1983, the Hong Kong dollar has been officially linked to the U.S. dollar at the rate of 7.8 Hong Kong dollars to one U.S. dollar. Under this Currency Board system, interest rates adjust to inflows or outflows of funds. The monetary base increases and contracts with capital inflow and outflow, respectively, and this expansion or contraction of the monetary base causes interest rates for the domestic currency to fall or rise respectively, while the exchange rate remains stable.
Interest rates in Hong Kong SAR are expected to rise for the first time in about a decade as the U.S. Fed begins to increase the Federal Funds rate. On December 16, 2015, the Fed increased the target range for the Federal Funds rate by a quarter percentage point to 0.25‒0.50 percent, lifting it from the 0-0.25 percent range it has occupied since December 2008. Accordingly, the Hong Kong Monetary Authority (HKMA) also raised the base rate—the interest rate forming the foundation upon which the discount rates for repurchase transactions through the discount window are computed—by 25 basis points to 0.75 percent on December 17, 2015. Fed officials stated that they expect to increase the Federal Funds rate gradually over next years by carefully monitoring progress of actual inflation toward its inflation goal.
With overall economic activity already relatively subdued in recent years, there is a concern whether the anticipated interest hike would be an additional large drag on growth. GDP growth in Hong Kong SAR slowed to below 3 percent in 2014 and 2015 as external demand has weakened gradually, reflecting the global trade slowdown. Domestic demand remains relatively robust, in particular private consumption on the back of a tight labor market. Would the anticipated rate hike slow economic activity further in Hong Kong SAR, in particular private domestic demand? More specifically, we seek to answer the following questions:
How has private sector activity evolved during the previous rate hike cycles?
What are the main determinants for private consumption and corporate investment?
Would the impact be larger this time due to historic high level of leverage in both household and corporate sectors?
To better understand the potential impact of rate hikes on private domestic demand, we will trace private sector activity during the previous rate hike cycles (Section II) and consider the implications of higher private sector leverage in the current juncture together with various buffers in place (Section III). Then we estimate aggregate private consumption by explicitly controlling for the debt-servicing burden of households to capture the potential impact of higher mortgage payment costs on households’ consumption. We will move to firm-level

4
data on listed companies to estimate the standard neoclassical investment model to capture the potential impact of higher financing costs on firms’ investment (Section IV). The main findings are as follows:
Overall economic activity around the previous Fed tightening cycles remained robust on average, with only modest slowdown in domestic demand;
Private sector leverage has increased to historic level in both households and corporate, but various strong buffers are in place that will likely contain the impact of higher interest rates;
Higher mortgage payment burden is expected to have only limited impact on private consumption as nominal income of households would also rise under tight labor market conditions; and
Higher financing cost will also have only modest impact on corporate investment, unless accompanied by significant deterioration of demand outlook.
II. PAST EPISODES OF FED TIGHTENING IN THE ERA OF HONG KONG SAR’S CURRENCY
BOARD
There have been six rate-hike cycles of the U.S. Fed since 1983 when the currency board system was established in Hong Kong SAR. Over these six cycles, the Fed has increased the policy rate by about 2¾ percent over about 1¼ years on average. The pace of the latest rate hike starting in June 2004 was the slowest with 4¼ percentage point increase over two years. However, the pace is expected to be even slower this time. The targets for appropriate federal funds rates by FOMC participants, known as the "dot plot," suggest that the target policy rate would increase by about 1 percentage point a year over the next three years (Figure 1).
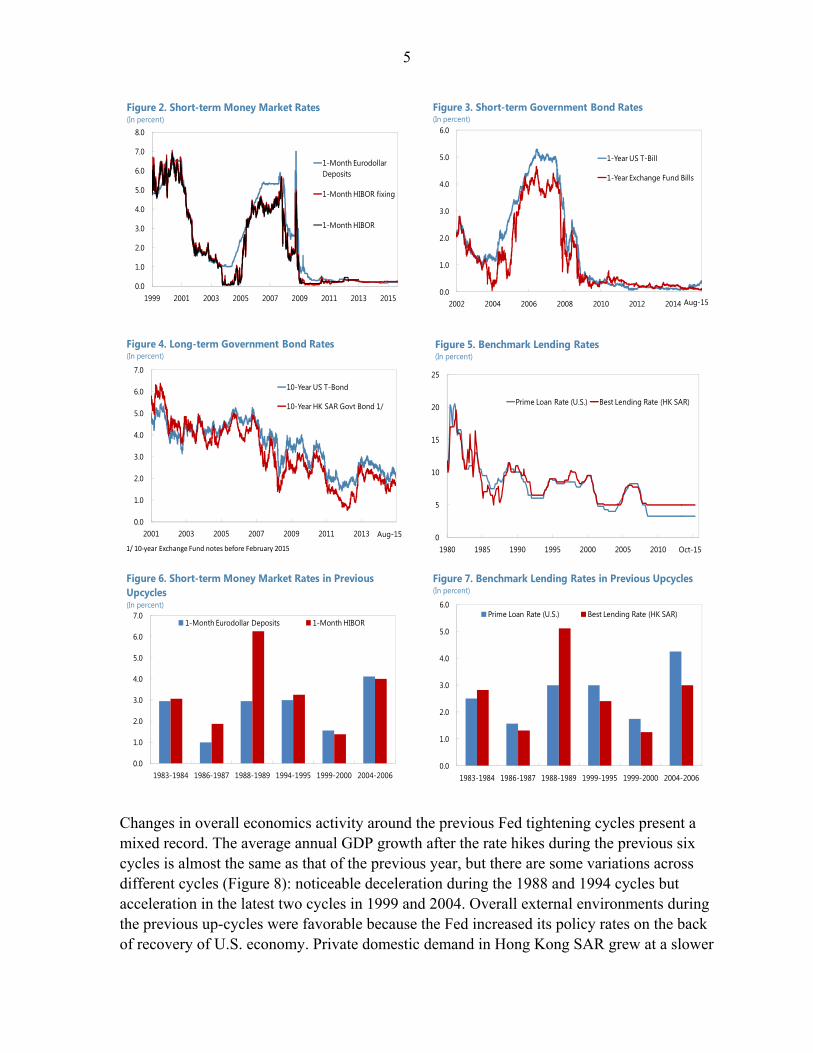
Various interest rates in Hong Kong SAR would increase accordingly, as were the cases during the previous cycles as the HKMA needs to increase its policy rates in line with Fed rate hike to maintain the Linked Exchange Rate System (LERS: currency board arrangement vis-à-vis the U.S. Dollar). Not surprisingly, various interest rates in Hong Kong SAR have traced the corresponding rates in the U.S. very closely over the past decades, from short-term money market rates to long-term lending rates (Figures 2-5). The paces of rate hikes during the previous up-cycles have also been close to those in the U.S (Figures 6–7).
0.0
0.5
1.0
1.5
2.0
2.5
3.0
3.5
4.0
4.5
2016 2017 2018 2016 2017 2018
U.S. 1/ H.K. SAR
Lower boundMedianUpper bound
1/ Based on the Fed's dot plot as of Dec. 2015
Figure 1. Expected Pace of Policy Rates(In percent)
5
Changes in overall economics activity around the previous Fed tightening cycles present a mixed record. The average annual GDP growth after the rate hikes during the previous six cycles is almost the same as that of the previous year, but there are some variations across different cycles (Figure 8): noticeable deceleration during the 1988 and 1994 cycles but acceleration in the latest two cycles in 1999 and 2004. Overall external environments during the previous up-cycles were favorable because the Fed increased its policy rates on the back of recovery of U.S. economy. Private domestic demand in Hong Kong SAR grew at a slower
0.0
1.0
2.0
3.0
4.0
5.0
6.0
7.0
8.0
1999 2001 2003 2005 2007 2009 2011 2013 2015
1-Month Eurodollar Deposits
1-Month HIBOR fixing
1-Month HIBOR
Figure 2. Short-term Money Market Rates (In percent)
Sources: Haver Analytics, IMF staffs estimate
0.0
1.0
2.0
3.0
4.0
5.0
6.0
2002 2004 2006 2008 2010 2012 2014
1-Year US T-Bill
1-Year Exchange Fund Bills
Figure 3. Short-term Government Bond Rates(In percent)
Sources: Haver Analytics, IMF staffs estimate.Aug-15
0.0
1.0
2.0
3.0
4.0
5.0
6.0
7.0
2001 2003 2005 2007 2009 2011 2013
10-Year US T-Bond
10-Year HK SAR Govt Bond 1/
1/ 10-year Exchange Fund notes before February 2015
Figure 4. Long-term Government Bond Rates(In percent)
Aug-15 0
5
10
15
20
25
1980 1985 1990 1995 2000 2005 2010 2015
Prime Loan Rate (U.S.) Best Lending Rate (HK SAR)
Oct-15
Figure 5. Benchmark Lending Rates(In percent)
0.0
1.0
2.0
3.0
4.0
5.0
6.0
7.0
1983-1984 1986-1987 1988-1989 1994-1995 1999-2000 2004-2006
1-Month Eurodollar Deposits 1-Month HIBOR
Figure 6. Short-term Money Market Rates in Previous Upcycles(In percent)
Sources: Segoe UI - Size 18
0.0
1.0
2.0
3.0
4.0
5.0
6.0
1983-1984 1986-1987 1988-1989 1999-1995 1999-2000 2004-2006
Prime Loan Rate (U.S.) Best Lending Rate (HK SAR)
Figure 7. Benchmark Lending Rates in Previous Upcycles(In percent)
Sources: Segoe UI - Size 18

6
pace in the aftermath of the U.S. rate hikes, but remained resilient. Private consumption, which slowed somewhat right after the rate hike, recovered quickly from the second year. Investment growth slowed a bit but continued to grow at robust pace after the rate hikes (Figure 9).
III. CURRENT ECONOMIC SETUP IN HONG KONG SAR
High leverage
There is rising concern that this time could be different because private sector leverage is higher than during the previous episodes. On the back of quintupled housing prices over the last 12 years, the stock of household debt has risen to historic highs, close to 70 percent of GDP, of which about two-thirds is residential mortgage debt (Figure 10). The HKMA’s estimate of the income-gearing ratio also increased further to more than 70 percent, well above its long-term average of about 50 percent.2 A stress test by the HKMA indicates that this ratio would rise to more than 90 percent if mortgage interest rates increase by 300 bps
2 The income-gearing ratio compared the amount of mortgage payment for a typical 50 m2 flat (under a 20-year mortgage scheme with a 70 percent loan-to-value ratio) to the median income of households living in private housing. The income-gearing ratio is not the same as a borrower’s actual debt-servicing ratio, which is subject to a maximum cap by the HKMA prudential measures. See HKMA (2015) for more details.
0
2
4
6
8
10
12
14
16
18
20
1983 1986 1988 1994 1999 2004
Before liftoff
After liftoff
Figure 8. GDP Growth(In percent, 4 quarters)
0.0
1.0
2.0
3.0
4.0
5.0
6.0
7.0
8.0
9.0
Before liftoff First year after liftoff Second year after liftoff
Private consumption
Investment (excl. inventories)
1/ Median of previous 6 rate-hike episodes.
Figure 9. Growth in Private Domestic Demand(In percent, 4 quarters, median 1/)

7
and the HKMA’s debt-service index of new mortgages would also rise to more than 65 percent from the current level of less than 50.
Corporate sector leverage has also increased significantly over the past years on the back of extended period of low interest rate. The total stock of bank lending to corporates has increased to about 130 percent of GDP as of 2015Q2, from about 75 percent in early 2000s. Corporate bond issuance has also increased as funding costs have been low, similar to other countries in the region. Bond markets in emerging Asia, including Hong Kong SAR, have expanded rapidly after the global financial crisis partly due to investors searching for higher yields in a low interest rate environment, with the total amount of new issuance of nonbank corporate debt securities having increased by about seven-fold as of 2014 compared to 2007 (HKMA, 2015)
Various buffers
However, the economy has accumulated significant buffers in tandem with the robust credit growth and the build-up of leverage. Several rounds of macro-prudential measures—tightening loan-to-value ratio limits, and stress-testing requirement for debt servicing ratio at loan origination stage with 300 bps hike stress —have contained the debt service burden among new borrowers. Accordingly, new borrowers’ debt service relative to disposable income has declined from 41 percent in August 2010 to 35 percent in 2014. Furthermore, the number of owner-occupied households with mortgages or loans has contracted by nearly one-fourth since the global financial crisis, with only one-third of households currently carrying mortgages. Banks are also well capitalized in excess of Basel III levels and have increased their reliance on stable funding sources with ample liquidity.
In addition, household debt service burden is expected to rise at a very modest pace as well. Household debt servicing-to-income ratio would rise by about 5 percentage points with each 100 bps increase in interest rate. However, as households’ income would also rise with the projected continued recovery of the economy, debt servicing burden would not rise sharply in the near term. Mortgage payment-to-income ratio actually declined by 5-10 percent following the previous Fed rate hikes in 1994 and 1999, respectively, while it increased by only about 10 percentage points in 2004-05 when the policy rate rose by more than 4 percent. In addition, as discussed above, the pace of interest rate increase is likely to be more gradual this time compared to previous up-cycles, so households could adjust to rising debt servicing burden more smoothly.
Various indicators also suggest that leverage quality of corporate sector is healthier than its peers in the region, implying that high leverage would not be a significant drag on investment.3 Cross-country analysis based on listed company data suggest that leverage ratio
3 See the April 2014 Regional Economic Outlook: Asia and Pacific, chapter 2 for more detailed analysis across the region.

8
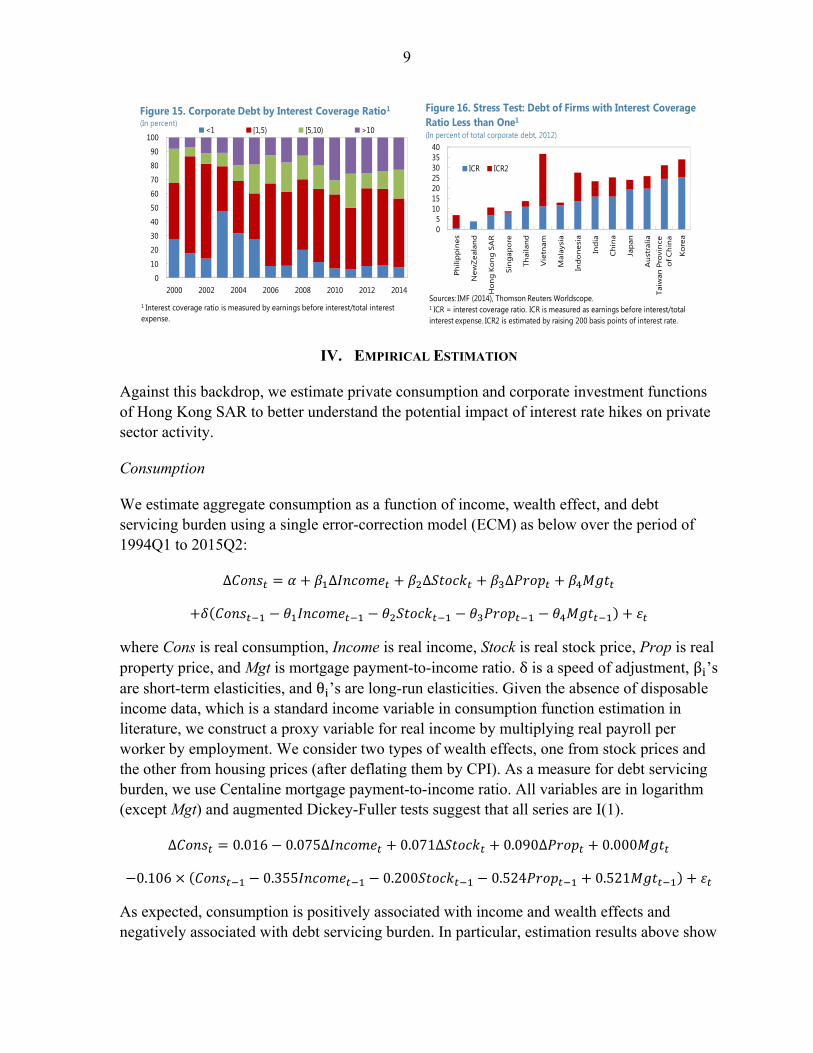
of nonfinancial corporate in Hong Kong SAR is the lowest in the region (Figure 11). Median short-term to long-term debt ratio is among the lowest in the region, implying overall favorable maturity conditions of Hong Kong SAR companies (Figure 12). In terms of corporate debt concentration, less than 10 percent of the total debt stock is owed by firms with leverage ratio of more than 2, implying that relatively healthier firms are currently carrying most of corporate debt in Hong Kong SAR (Figure 13). In line with this, less than 10 percent of total debt is owed by “stressed” companies for whom the interest coverage ratio is less than 1 (Figures 14–15).4 To further gauge the vulnerabilities associated with a prospective rise in interest rates, an illustrative “stress test” on individual firms’ balance sheets is performed by assuming that average borrowing costs rise by 200 bps. Even under this scenario, just above 10 percent of total debt would be owed by “stressed” companies, of which interest coverage ratio is less than 1, highlighting the resilience of Hong Kong SAR corporates against a potential increase in interest rates (Figure 16).
4 Interest coverage ratio is measured as earnings before interest divided by total interest expense.
0.00.51.01.52.02.53.03.5
Aus
tral
ia
Chi
na
Hon
g Ko
ng S
AR
Indi
a
Indo
nesi
a
Japa
n
Kore
a
Mal
aysi
a
New
Zeal
and
Phili
ppin
es
Sing
apor
e
Taiw
an
Thai
land
Vie
tnam
2007 2012
Taiw
anPr
ovin
ce
of C
hina
Figure 11. Leverage Ratio Comparison1
(Total debt weighted average, 2007 and 2012)
Sources: IMF (2014), Thomson Reuters Worldscope.1 Leverage ratior is measured by total debt/common equity.
02468
1012
Au
stra
lia
Ch
ina
Ho
ng
Ko
ng
SA
R
Ind
ia
Ind
on
esia
Jap
an
Kore
a
Mal
aysi
a
New
Zea
lan
d
Phili
pp
ines
Sin
gap
ore
Taiw
an
Thai
lan
d
Vie
tnam
2007 2012
Taiw
anPr
ovi
nce
o
f Ch
ina
Figure 12. Short-term to Long-term Debt Ratio Comparison1
(Median, 25th and 75th )
Sources: IMF (2014), Thomson Reuters Worldscrope.1 Short-term-to-long-term debt ratio is calculated as short-term debt and current portion of long-term debt/long-term debt. The lines inside the bars indicate median.
0102030405060708090
100
Indi
a
Vie
tnam
Japa
n
Chi
na
Kore
a
Phili
ppin
es
Thai
land
Indo
nesi
a
Mal
aysi
a
Sing
apor
e
New
Zeal
and
Aus
tral
ia
Hon
g Ko
ng S
AR
<1 [1,2) [2,3) >=3
Taiw
anPr
ovin
ce
of C
hina
Figure 13. Corporate Debt by Leverage Ratio1
(In percent of total corporate debt, 2012)
Sources: IMF (2014), Thomson Reuters Worldscope.1Leverage ratio is measured as total debt/common equity.
0102030405060708090
100
Phili
ppin
es
Hon
gKon
g
Sing
apor
e
Mal
aysi
a
Thai
land
New
Zeal
and
Vie
tnam
Chi
na
Indi
a
Japa
n
Indo
nesi
a
Aus
tral
ia
Kore
a
<1 [1,5) [5,10) >=10
Taiw
anPr
ovin
ce
of C
hina
Hon
gKo
ng S
AR
Figure 14. Corporate Debt by Interest Coverage Ratio1
(In percent of total corporate debt, 2012)
Sources: IMF (2014), Thomson Reuters Worldscope.1 Interest coverage ratio is measured by earnings before interest/total interest expense.
9
IV. EMPIRICAL ESTIMATION
Against this backdrop, we estimate private consumption and corporate investment functions of Hong Kong SAR to better understand the potential impact of interest rate hikes on private sector activity.
Consumption
We estimate aggregate consumption as a function of income, wealth effect, and debt servicing burden using a single error-correction model (ECM) as below over the period of 1994Q1 to 2015Q2:
∆ ∆ ∆ ∆
where Cons is real consumption, Income is real income, Stock is real stock price, Prop is real property price, and Mgt is mortgage payment-to-income ratio. δ is a speed of adjustment, β ’s are short-term elasticities, and θ ’s are long-run elasticities. Given the absence of disposable income data, which is a standard income variable in consumption function estimation in literature, we construct a proxy variable for real income by multiplying real payroll per worker by employment. We consider two types of wealth effects, one from stock prices and the other from housing prices (after deflating them by CPI). As a measure for debt servicing burden, we use Centaline mortgage payment-to-income ratio. All variables are in logarithm (except Mgt) and augmented Dickey-Fuller tests suggest that all series are I(1).
∆ 0.016 0.075∆ 0.071∆ 0.090∆ 0.000
0.106 0.355 0.200 0.524 0.521
As expected, consumption is positively associated with income and wealth effects and negatively associated with debt servicing burden. In particular, estimation results above show
0
10
20
30
40
50
60
70
80
90
100
2000 2002 2004 2006 2008 2010 2012 2014
<1 [1,5) [5,10) >10
1 Interest coverage ratio is measured by earnings before interest/total interest expense.
Figure 15. Corporate Debt by Interest Coverage Ratio1
(In percent)
05
10152025303540
Phili
pp
ines
New
Zea
lan
d
Ho
ng
Ko
ng
SA
R
Sin
gap
ore
Thai
lan
d
Vie
tnam
Mal
aysi
a
Ind
on
esia
Ind
ia
Ch
ina
Jap
an
Au
stra
lia
Ko
rea
ICR ICR2
Taiw
anPr
ovi
nce
o
f Ch
ina
Figure 16. Stress Test: Debt of Firms with Interest Coverage Ratio Less than One1
(In percent of total corporate debt, 2012)
Sources: IMF (2014), Thomson Reuters Worldscope.1 ICR = interest coverage ratio. ICR is measured as earnings before interest/total interest expense. ICR2 is estimated by raising 200 basis points of interest rate.
10
that coefficient estimates, both in the long run and short run, have expected signs (except short-term response to real income, but statistically not significant) and are statistically significant. As noted above, a 100 bps increase in mortgage rates would mechanically raise households’ mortgage payment-to-income ratio by about 5 percentage points, assuming that there is no income growth at all. An estimate of about 0.5 for a long-run elasticity of consumption against debt service-to-income ratio implies that aggregate consumption would decline by about 2½ percent if other asset prices rose only at the rate of inflation.
However, the actual impact on private consumption would be smaller than above estimates as nominal income of households would also rise in tandem on the back of tight labor market conditions. If nominal income grows at about 5½ percent, in line with nominal GDP growth for 2016 in the IMF’s WEO baseline, households’ debt service-to-income ratio would rise by less than 2 percent against 100 bps increase in mortgage rates. With inflation about 3 percent a year, real income would also rise by about 2½ percent a year. In sum, the above estimation results imply that the effect of higher interest rate through higher debt servicing burden would be offset by the income effect, so private consumption would continue to rise at modest pace despite increases in interest rates. These results are in line with actual private consumption patterns during the previous rate hike episodes, as discussed above.
Investment
To understand firms’ investment behavior, we estimate the standard neoclassical investment model with firm-level data, which relates investment to expectations of future profitability, cash flow, leverage as well as lagged investment.
Since Hayashi’s (1982) result that investment should depend only on Tobin’s Q (which captures the expectations of future profitability), the Q ratio has been at the center of the empirical investment literature. The potential role of financial frictions motivated the subsequent work on the cash-flow effect. As summarized in Hubbard (1998), many empirical studies have found that cash flow has a significant effect on investment, even if Tobin’s Q is included as an explanatory variable. This finding has been interpreted by Fazzari, Hubbard, and Petersen (1988) and others as evidence of financing constraints facing firms. Furthermore, Eberly, Rebelo, and Vincent (2012) show analytically that the investment adjustment-cost model by Christiano, Eichenbaum, and Evans (2005), which is widely used as a standard theoretical background model in the DSGE literature, predicts the presence of a lagged-investment effect in addition to cash-flow and Q effects. They also empirically find the importance and robustness of the lagged-investment effect in firm-level data for U.S. manufacturing sector. Based on the similar approach, Kang and Piao (2015) find robustness of the lagged-investment effect in Japan as well as differences in investment behavior between firms expanding abroad and those operating mainly in domestic markets.
Based on these previous studies and the relevant explanatory variables identified therein, we estimate the following investment function:
11
,
,
,
,,
,
,, ,
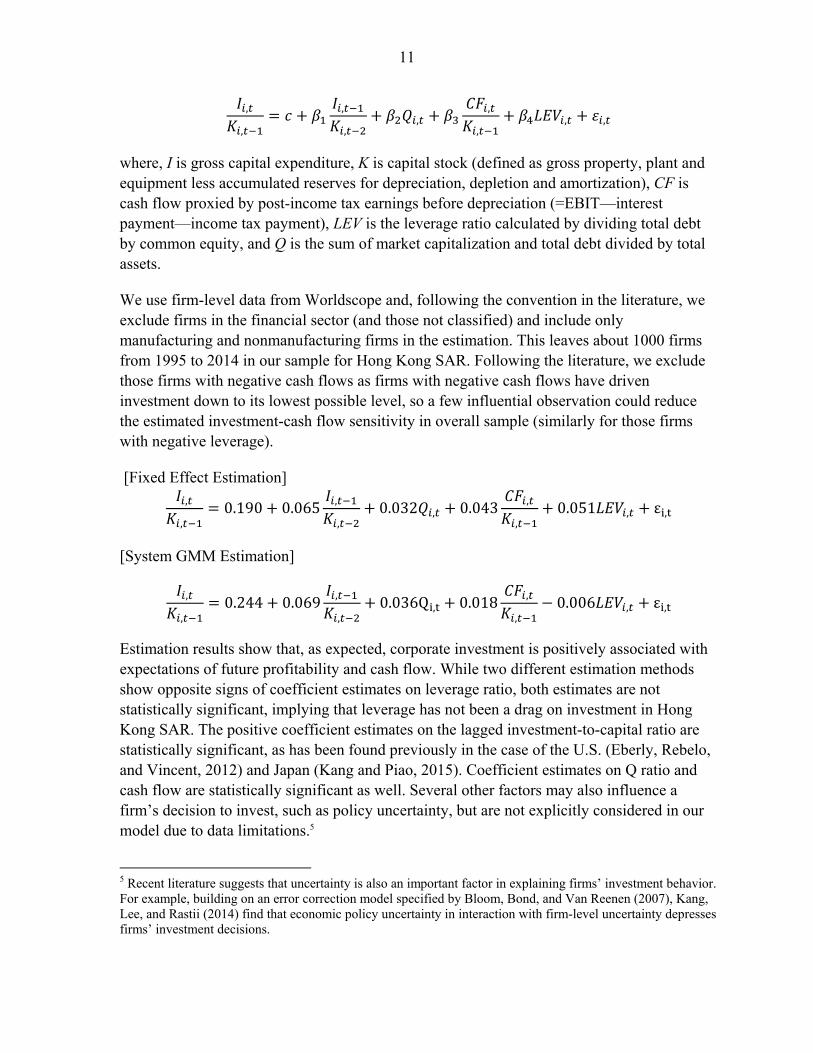
where, I is gross capital expenditure, K is capital stock (defined as gross property, plant and equipment less accumulated reserves for depreciation, depletion and amortization), CF is cash flow proxied by post-income tax earnings before depreciation (=EBIT—interest payment—income tax payment), LEV is the leverage ratio calculated by dividing total debt by common equity, and Q is the sum of market capitalization and total debt divided by total assets.
We use firm-level data from Worldscope and, following the convention in the literature, we exclude firms in the financial sector (and those not classified) and include only manufacturing and nonmanufacturing firms in the estimation. This leaves about 1000 firms from 1995 to 2014 in our sample for Hong Kong SAR. Following the literature, we exclude those firms with negative cash flows as firms with negative cash flows have driven investment down to its lowest possible level, so a few influential observation could reduce the estimated investment-cash flow sensitivity in overall sample (similarly for those firms with negative leverage).
[Fixed Effect Estimation] ,
,0.190 0.065 ,
,0.032 , 0.043 ,
,0.051 , ε ,
[System GMM Estimation]
,
,0.244 0.069 ,
,0.036Q , 0.018 ,
,0.006 , ε ,
Estimation results show that, as expected, corporate investment is positively associated with expectations of future profitability and cash flow. While two different estimation methods show opposite signs of coefficient estimates on leverage ratio, both estimates are not statistically significant, implying that leverage has not been a drag on investment in Hong Kong SAR. The positive coefficient estimates on the lagged investment-to-capital ratio are statistically significant, as has been found previously in the case of the U.S. (Eberly, Rebelo, and Vincent, 2012) and Japan (Kang and Piao, 2015). Coefficient estimates on Q ratio and cash flow are statistically significant as well. Several other factors may also influence a firm’s decision to invest, such as policy uncertainty, but are not explicitly considered in our model due to data limitations.5
5 Recent literature suggests that uncertainty is also an important factor in explaining firms’ investment behavior. For example, building on an error correction model specified by Bloom, Bond, and Van Reenen (2007), Kang, Lee, and Rastii (2014) find that economic policy uncertainty in interaction with firm-level uncertainty depresses firms’ investment decisions.

12
The estimation results also show that, ceteris paribus, a 100 bps increase in interest rates would reduce corporate investment very modestly. As of 2014, the median effective interest rate in our sample was about 4½ percent and a median cash flow-to-capital stock ratio was 0.214. With a 100 bps increase in interest rates, the median cash flow-to-capital stock ratio will fall to 0.200. Coefficient estimates of 0.018 (system-GMM estimation) to 0.043 (fixed effect estimation) on cash flow-to-capital stock ratio imply that corporate investment would decline by ⅛ to ⅓ percent, assuming that there is no change in other factors including expected future probability and leverage. In addition, actual financing conditions may not be tightened as implied by the interest rate increase since major central banks including the U.S. Fed will maintain its expanded balance sheet in the near future. This modest impact of higher interest rates is consistent with robust investment performance during previous rate hike cycles, as we discussed above.
Perfect storm
Although the impact of rate hikes is likely to be modest as discussed above, we cannot exclude a tail risk that global financial volatility would rise following the U.S. Fed’s liftoff and China’s growth would slow more sharply than expected. Although the U.S. Fed raises the Fed Funds target range in line with the median path in the “dot plot,” portfolio rebalancing away from emerging market assets to US dollar assets could be more aggressive, leading to a rapid decompression of spreads globally. Or if wage-price dynamics push up actual inflation faster than expected in the U.S. on the back of improving labor market conditions, the Fed Funds target rate could follow a path closer to the upper bound of FOMC forecasts rather than the median, leading to upward shift of entire yield curve in Hong Kong SAR as well. Even though it is not easy to quantify the spillover effect of China’s hard landing on growth, asset markets could experience significant adjustment. During the Asian financial crisis in late 1990s and more recently the global financial crisis, both stock and property prices declined significantly in Hong Kong SAR—for example by about 30 percent in 1998 for both asset prices—and overall payroll growth in real terms was broadly flat during the both episodes.
If such a shock were to materialize, domestic demand in Hong Kong SAR could be adversely affected. Private consumption would be disrupted if interest rates were to spike with the debt service ratio for new mortgage borrowers rising significantly from its current relatively low level of around 35 percent, depending on the magnitude of the rate increase. Large adjustment in asset prices would also drag on private consumption. Rising costs of refinancing and rolling over corporate debt as well as deterioration of demand and profitability outlook would inhibit corporate investment. For example, if stock and house prices decline by 20 to 30 percent—generating significant negative wealth effects on consumption—and interest rates rise by 200 basis points, the contribution of domestic demand to growth would fall by 3 to 5 percentage points compared to the baseline. This is in line with N’Diaye and Ahuja (2012), who find that a hard landing in Mainland China could
13
reduce Hong Kong SAR’s output by as much as about 3 percentage points below baseline in the first two years, pushing Hong Kong SAR into recession and possible deflation.
V. CONCLUSION
Interest rates in Hong Kong SAR have begun to rise for the first time in seven years with the Fed liftoff. An open question is how private activity will respond with the transmission—via the currency board— of Fed tightening to higher debt service costs in Hong Kong SAR. This paper examines past episodes of Fed tightening and estimates aggregate consumption and investment functions for Hong Kong SAR. The analysis shows that private domestic activity—both consumption and investment—are expected to remain robust with the anticipated gradual increase in interest rates over the next few years and considering the buffers in place in Hong Kong SAR. Specifically, the effect of higher interest rates through higher debt servicing burden would be offset by the income effect as real income grows in line with baseline projection. Thus, private consumption would continue to rise at modest pace despite increase in interest rates. Similarly, various indicators suggest that leverage quality of corporate sector is healthier than its peers in the region and the anticipated gradual pace of increase in interest rates would not be a significant drag on corporate investment in Hong Kong SAR.
14
REFERENCES
Bloom, N., S. Bond, and J. Van Reenen, 2007, “Uncertainty and Investment Dynamics” Review of Economic Studies, Vol. 74, pp. 391–415.
Christiano, L., Eichenbaum, M., Evans, C., 2005, “Nominal Rigidities and the Dynamic Effects of a Shock to Monetary Policy,” Journal of Political Economy, Vol. 113, pp. 1‒45.
Eberly J., S. Rebelo, and N. Vincent, 2012, “What Explains the Lagged-Investment Effect?” Journal of Monetary Economics, Vol. 59, pp. 370–380.
Fazzari, S., G. Hubbard, and B. Petersen, 1988, “Financing Constraints and Corporate Investment,” Brookings Papers on Economic Activity, pp. 141–195.
Hayashi, F., 1982, “Tobin’s Marginal Q and Average Q: A Neoclassical Interpretation,” Econometrica, Vol. 50, pp. 215–224.
Hong Kong Monetary Authority, 2015, Half-Yearly Monetary and Financial Stability Report (Hong Kong: September)
Hubbard, R.G., 1998, “Capital-Market Imperfections and Investment,” Journal of Economic Literature, Vol. 36, pp. 193–225.
International Monetary Fund, 2014, Regional Economic Outlook: Asia and the Pacific (Washington, April).
Kang, J. S. and S. Piao, “Production Offshoring and Investment by Japanese Firms,” IMF Working Paper, No. 15/183 (Washington: International Monetary Fund).
Kang, W., K. Lee, and R. A. Ratti, 2014, “Economic Policy Uncertainty and Firm-Level Investment,” Journal of Macroeconomics, Vol. 39, pp. 42–53.
N'Diaye, P. and A. Ahuja, “Trade and Financial Spillover on Hong Kong SAR from a Downturn in Europe and Mainland China,” IMF Working Paper, No. 12/81 (Washington: International Monetary Fund).