Embed Size (px)
Citation preview
Private Equity co-investments: opportunities
and challenges
Elias Korosis – Partner, Hermes GPE
Private and confidential. This document should not be circulated to third parties
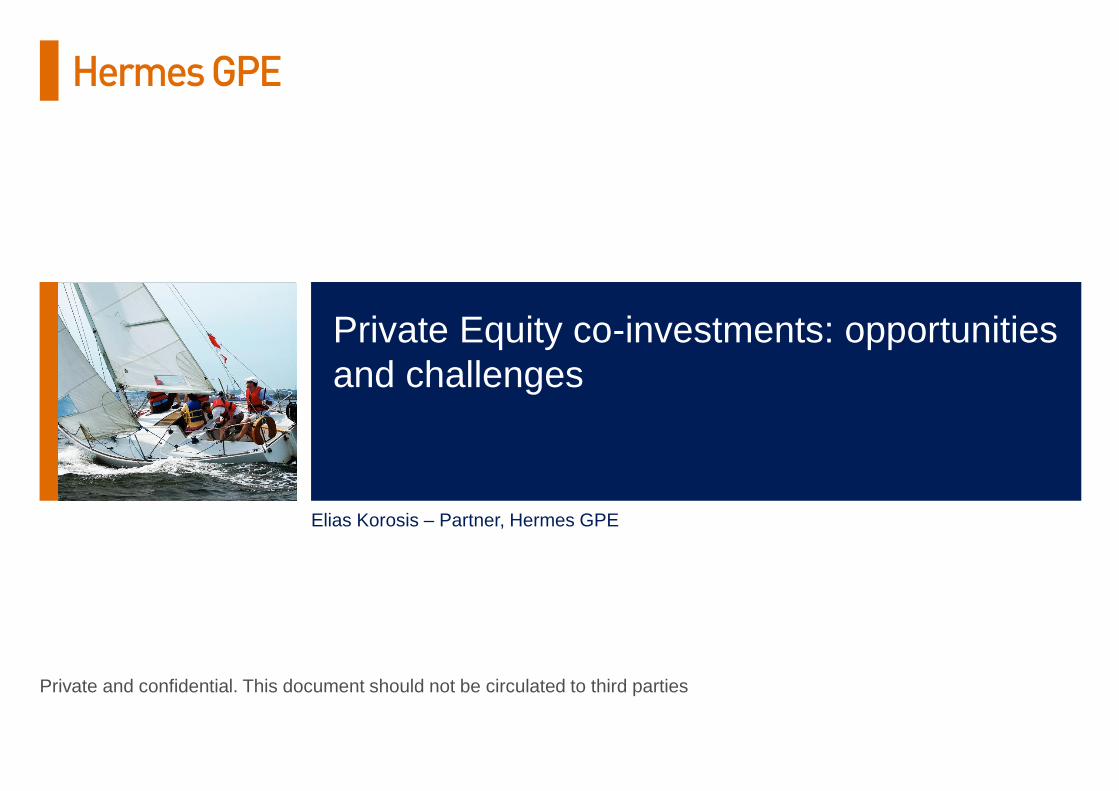
Private equity: market structure
Source: Hermes GPE illustration
1February 2017
PE investment platform
(specialist or in-house)
Pension
fund
Insurance
company
Sovereign
wealth fund
HNW
individual
Underlying
investment 1
Underlying
investment 2
Underlying
investment 3
Private equity
fund 1
Private equity
fund 2
Private equity
fund 3
Underlying
investment 4
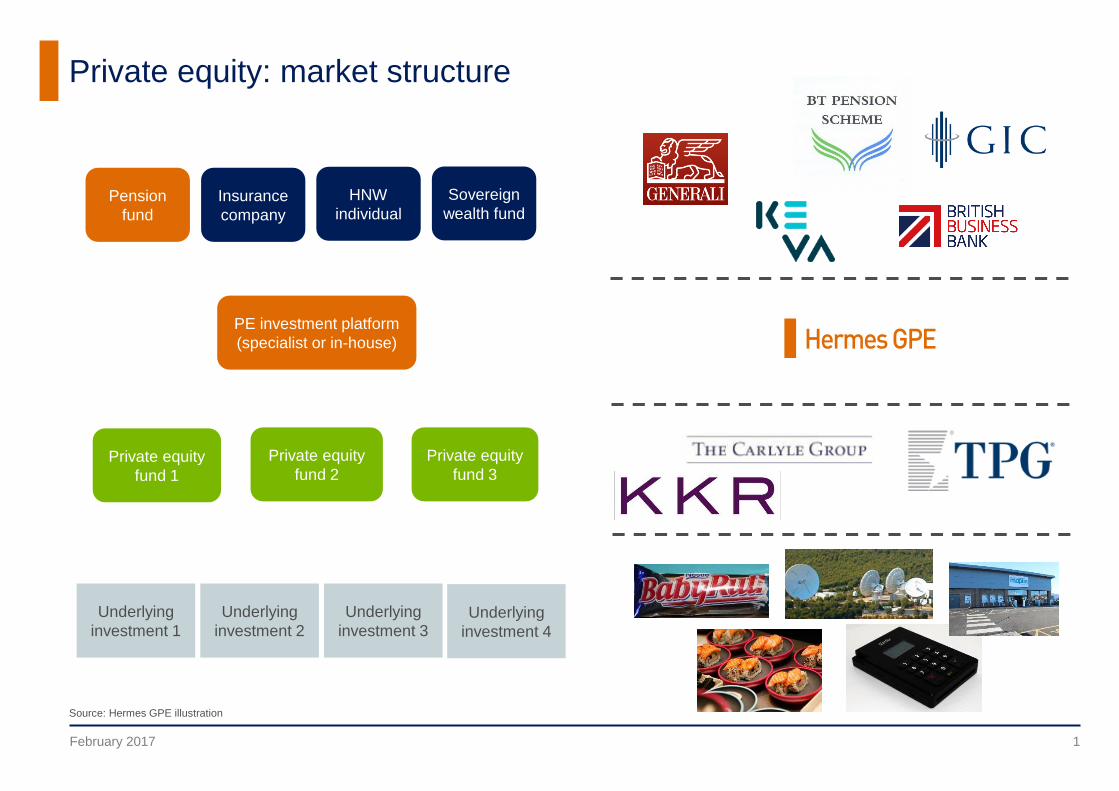
StrategyTypical ‘all-in’
management fees (p.a.)Minimum team size Considerations
Fund of funds 2%-4% 1
Highly diversified
Highest capacity to deploy capital
Low control on ultimate exposure
Primaries 1.5%-2% 2-4
Full J-curve effect
Blind pool risk / opportunity
Requires GP relationship
management
Secondaries 1%-1.5% 10+
Limited blind pool risk
Cash flow / exit driven
Market cycle dependent, episodic
deal-flow
Co-investments 0.75%-1.25% 10+
Control over exposure, given
sufficient and consistent deal-flow
Selectivity challenge to avoid pro-
cyclicality
Blended fee reduction
Directs 0% 20+
Highest concentration
High risk / high return
Highest internal resource
requirement
Private equity implementation – asset owner strategy considerations
2February 2017
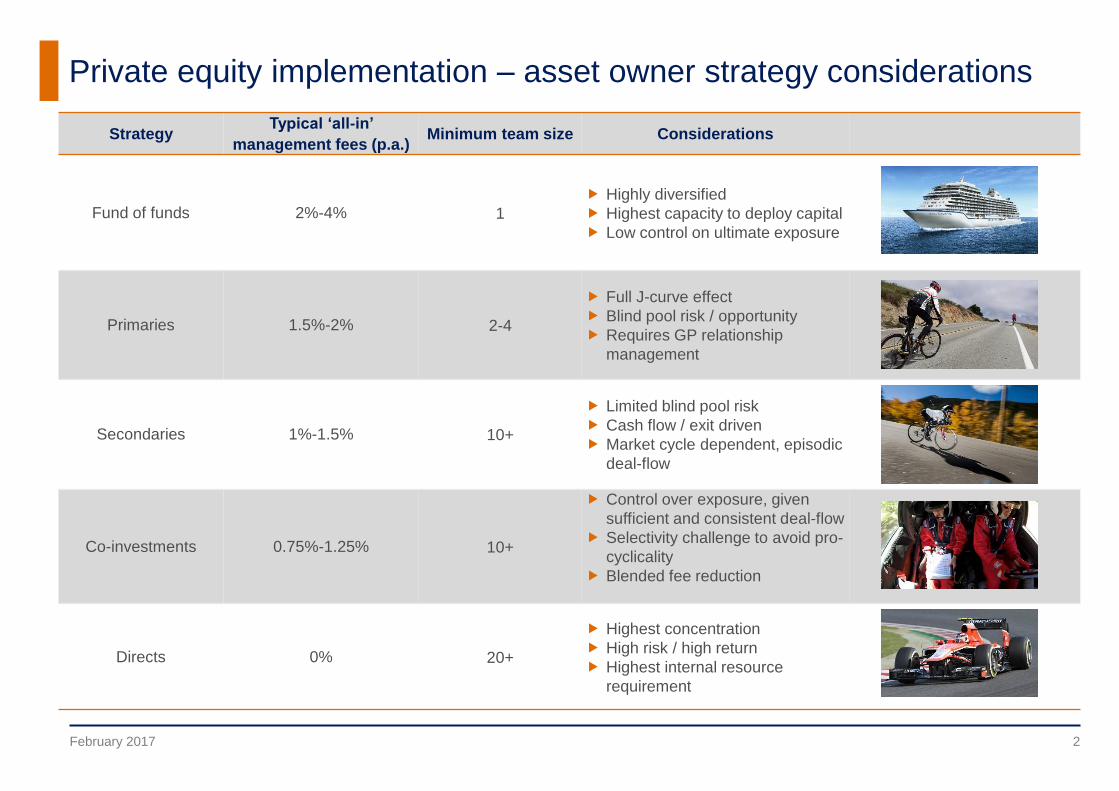
Private equity implementation – asset owner strategy considerations
3February 2017
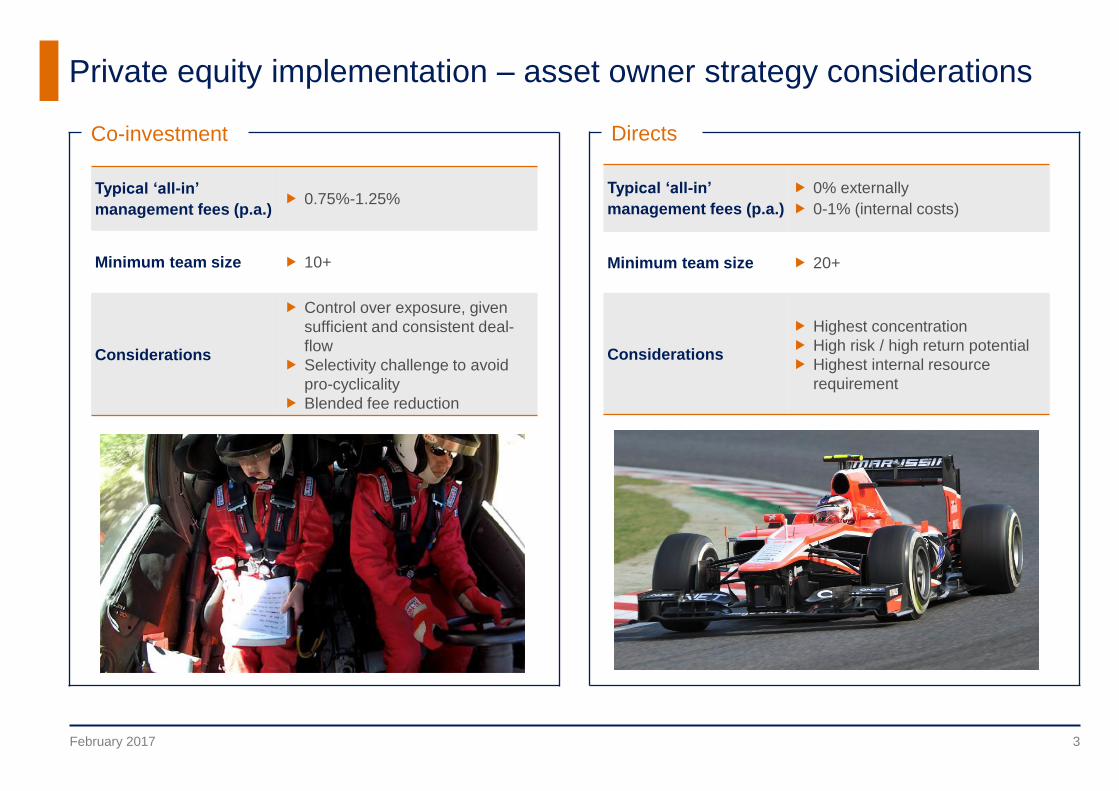
Co-investment Directs
Typical ‘all-in’
management fees (p.a.) 0.75%-1.25%
Minimum team size 10+
Considerations
Control over exposure, given
sufficient and consistent deal-
flow
Selectivity challenge to avoid
pro-cyclicality
Blended fee reduction
Typical ‘all-in’
management fees (p.a.)
0% externally
0-1% (internal costs)
Minimum team size 20+
Considerations
Highest concentration
High risk / high return potential
Highest internal resource
requirement
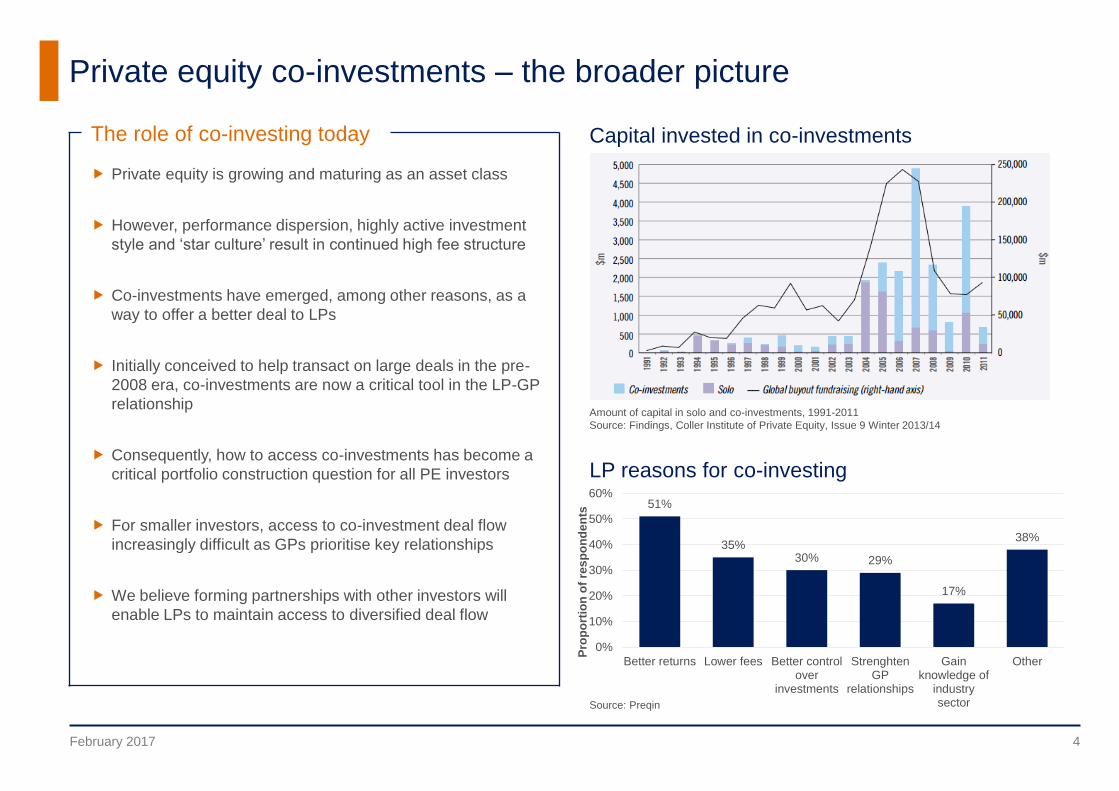
The role of co-investing today
Private equity is growing and maturing as an asset class
However, performance dispersion, highly active investment
style and ‘star culture’ result in continued high fee structure
Co-investments have emerged, among other reasons, as a
way to offer a better deal to LPs
Initially conceived to help transact on large deals in the pre-
2008 era, co-investments are now a critical tool in the LP-GP
relationship
Consequently, how to access co-investments has become a
critical portfolio construction question for all PE investors
For smaller investors, access to co-investment deal flow
increasingly difficult as GPs prioritise key relationships
We believe forming partnerships with other investors will
enable LPs to maintain access to diversified deal flow
51%
35%30% 29%
17%
38%
0%
10%
20%
30%
40%
50%
60%
Better returns Lower fees Better controlover
investments
StrenghtenGP
relationships
Gainknowledge of
industrysector
Other
Pro
po
rtio
n o
f re
sp
on
de
nts
Private equity co-investments – the broader picture
Capital invested in co-investments
LP reasons for co-investing
February 2017 4
Amount of capital in solo and co-investments, 1991-2011
Source: Findings, Coller Institute of Private Equity, Issue 9 Winter 2013/14
Source: Preqin

J-curve and fee reduction in practice: co-invest vs fund comparison
February 2017 5
0.6x
1.1x
1.6x
2.1x
Year 1 Year 2 Year 3 Year 4 Year 5 Year 6 Year 7 Year 8 Year 9 Year 10
Net
TV
PI
Co-Investment Fund 50/50 Co-Investment and Funds Portfolio
2011 vintage 2001 vintage
2002 vintage
1.0x 1.0x
0.66x
0.85x
0.14x
0.03x0.20x
0.11x
0.0x
0.5x
1.0x
1.5x
2.0x
2.5x
Fund Co-Invest
Total Capital Drawn Profit to LP Management Fees Carried Interest
1 Assumptions: both funds with same performance: 2.0x MoC
Buyout Fund terms: 2% fee, 20% carried interest, no hurdle
Co-Invest Fund terms: 0.6% fee, 10% carried interest , no hurdle, incl. fees and carry paid on
underlying co-investments
J-curve reduction: TVPI evolution of a co-investment fund vs the
market (2011 Vintage, Thomson VentureXpert)
Fee savings of different allocations to buyout funds and co-
investment funds (£100m portfolio)
Capital distribution – comparison of a co-investment fund and buyout
fund1 (hypothetical 2.0x gross return for each, based on actual terms)
0.91.9
2.83.8
4.7
0.7
1.4
2.2
2.9
3.6
0
2
4
6
8
10
100% Funds 90/10 Funds/Co-Invest
80/20 70/30 60/40 50/50
£m
Management Fee Savings Carried Interest Savings

Risks and challenges of co-investments
For co-invest programmes run by asset owners:
‘Large deal bias’
Challenging, resource-intensive execution
Concentration risk
Higher headline risk
GP relationship risk
Benefits of co-investments
Deployment speed and J-curve mitigation
Control over portfolio construction, strategy and pace
Potential for enhanced investment returns on selectivity basis
Blended fee reduction
Much improved fund intelligence
Manager diversification vis-à-vis single fund
Private equity co-investments – pros and cons
February 2017 6
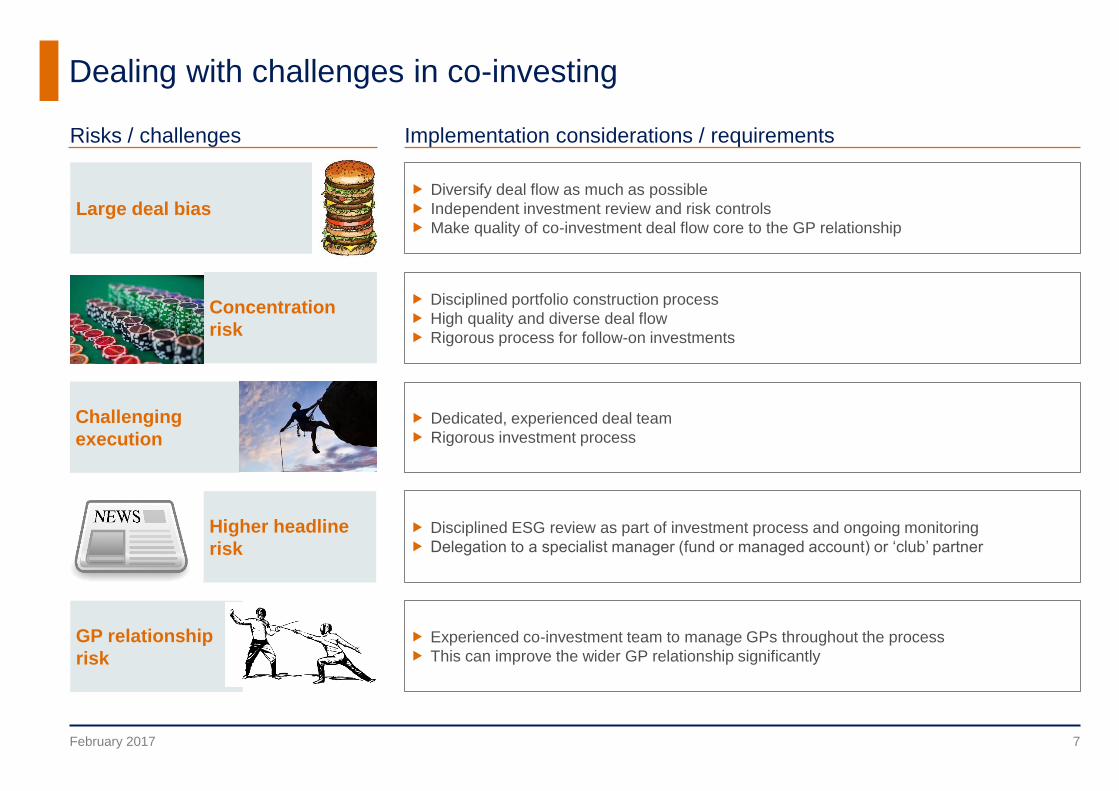
Dealing with challenges in co-investing
February 2017 7
Risks / challenges Implementation considerations / requirements
Large deal bias Diversify deal flow as much as possible
Independent investment review and risk controls
Make quality of co-investment deal flow core to the GP relationship
Disciplined portfolio construction process
High quality and diverse deal flow
Rigorous process for follow-on investments
Concentration
risk
Disciplined ESG review as part of investment process and ongoing monitoring
Delegation to a specialist manager (fund or managed account) or ‘club’ partner
Higher headline
risk
Dedicated, experienced deal team
Rigorous investment process
Challenging
execution
GP relationship
risk
Experienced co-investment team to manage GPs throughout the process
This can improve the wider GP relationship significantly
Deals sourced
1126
In-depth review 218
IC reviewed 143
Invested
109
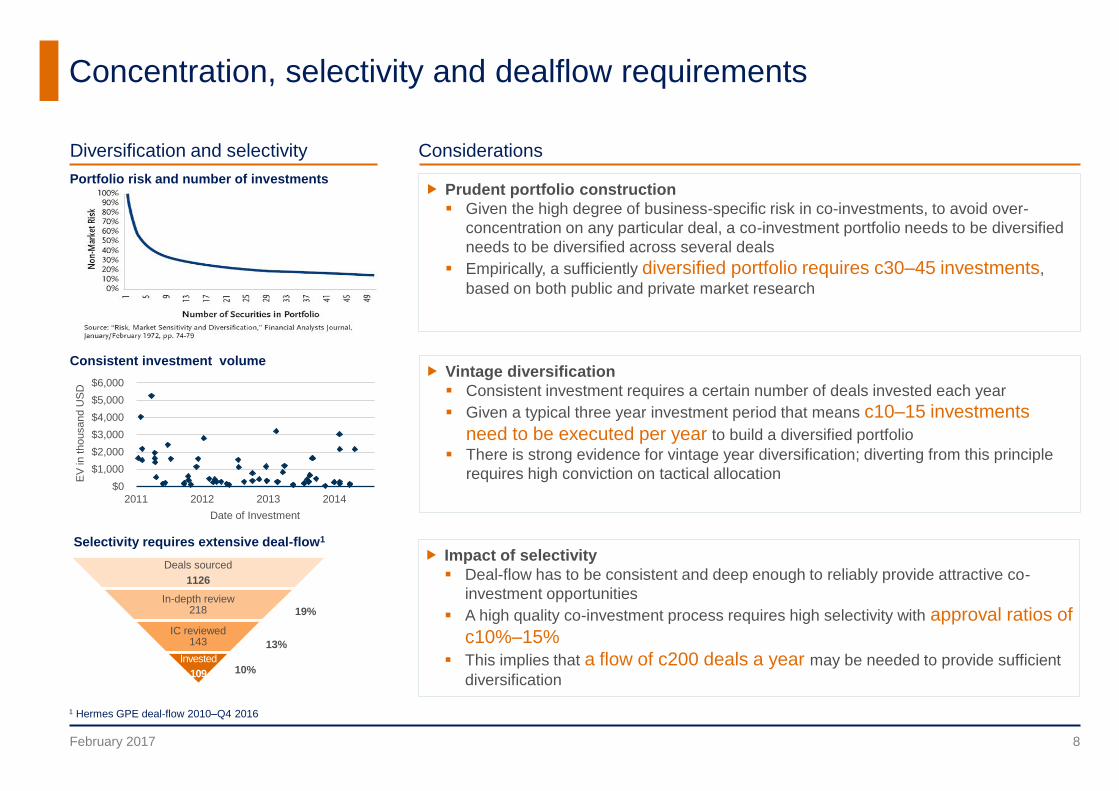
Concentration, selectivity and dealflow requirements
February 2017 8
Diversification and selectivity Considerations
Prudent portfolio construction
Given the high degree of business-specific risk in co-investments, to avoid over-
concentration on any particular deal, a co-investment portfolio needs to be diversified
needs to be diversified across several deals
Empirically, a sufficiently diversified portfolio requires c30–45 investments,
based on both public and private market research
Vintage diversification
Consistent investment requires a certain number of deals invested each year
Given a typical three year investment period that means c10–15 investments
need to be executed per year to build a diversified portfolio
There is strong evidence for vintage year diversification; diverting from this principle
requires high conviction on tactical allocation
Impact of selectivity
Deal-flow has to be consistent and deep enough to reliably provide attractive co-
investment opportunities
A high quality co-investment process requires high selectivity with approval ratios of
c10%–15%
This implies that a flow of c200 deals a year may be needed to provide sufficient
diversification
19%
13%
10%
1 Hermes GPE deal-flow 2010–Q4 2016
Consistent investment volume
Selectivity requires extensive deal-flow1
Portfolio risk and number of investments
$0
$1,000
$2,000
$3,000
$4,000
$5,000
$6,000
2011 2012 2013 2014
EV
in
thousand U
SD
Date of Investment

Key investor considerations and select research issues
Select research issues / challenges
Understanding and quantifying risk in PE, including at
sub-asset class level (sector, region, stage etc)
Analyzing the systemic risk factors behind the value
creation drivers
Understanding correlation properties at the sub-asset
class level vis-à-vis different economic environments
Analytical rigour in manager selection
Cash flow modelling / forecasting
Market structure evolution (e.g. co-investment model)
Appropriate regulatory treatment
Proposed benefits
High absolute returns: Equity risk premium, illiquidity
premium, PE value creation (incl. leverage)
Strong risk-return relationship (Sharpe ratio
improvement?)
Imperfect (if material) correlation with public equities
Outperformance potential in downturns due to
structural advantages
Risks and costs
Large dispersion of performance
Cash flow timing risks
Control over investments (blind pool)
High fees
Transparency
Regulation
February 2017 9
February 2017 10
How do we do it?
An introduction to Hermes GPE
Cameron Payne |
Associate
RBC, Canaccord
Genuity,
Standard
& Poor’s
Sanjoy Sankaran |
Senior Associate
IDFC
Alternatives,
MBA
Nitin Muddana |
Associate
HGPE Sg /
London,
Doughty Hanson
Sean Yoo |
Senior Associate
Anchor Equity
Partners,
Goldman Sachs
Iesan Tsai | VP
UBS, JP Morgan,
H&Q Asia
Pacific, MBA
Elias Korosis | Partner
Previously Bridgewater, Citigroup,
Schroder Salomon Smith Barney
Sunny Chu | Partner
Previously Qatar Investment
Authority, Alpinvest, McKinsey
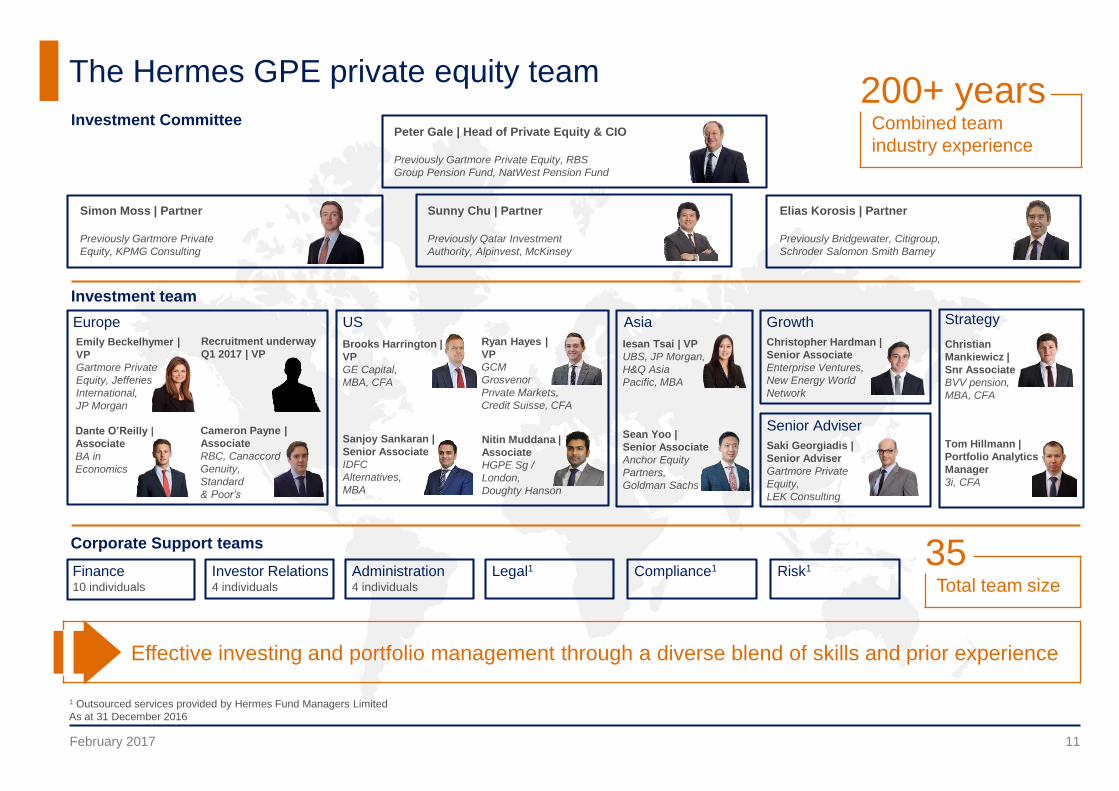
The Hermes GPE private equity team
February 2017
Investment CommitteePeter Gale | Head of Private Equity & CIO
Previously Gartmore Private Equity, RBS
Group Pension Fund, NatWest Pension Fund
Simon Moss | Partner
Previously Gartmore Private
Equity, KPMG Consulting
Investment team
GrowthEurope US Asia Strategy
Brooks Harrington |
VP
GE Capital,
MBA, CFA
Christopher Hardman |
Senior Associate
Enterprise Ventures,
New Energy World
Network
Christian
Mankiewicz |
Snr Associate
BVV pension,
MBA, CFA
Dante O’Reilly |
Associate
BA in
Economics
Tom Hillmann |
Portfolio Analytics
Manager
3i, CFA
Corporate Support teams
Finance10 individuals
Investor Relations4 individuals
Administration4 individuals
Legal1 Compliance1 Risk1
1 Outsourced services provided by Hermes Fund Managers Limited
As at 31 December 2016
Effective investing and portfolio management through a diverse blend of skills and prior experience
200+ yearsCombined team
industry experience
35Total team size
Emily Beckelhymer |
VP
Gartmore Private
Equity, Jefferies
International,
JP Morgan
Ryan Hayes |
VP
GCM
Grosvenor
Private Markets,
Credit Suisse, CFA
Senior Adviser
Saki Georgiadis |
Senior Adviser
Gartmore Private
Equity,
LEK Consulting
11
Recruitment underway
Q1 2017 | VP
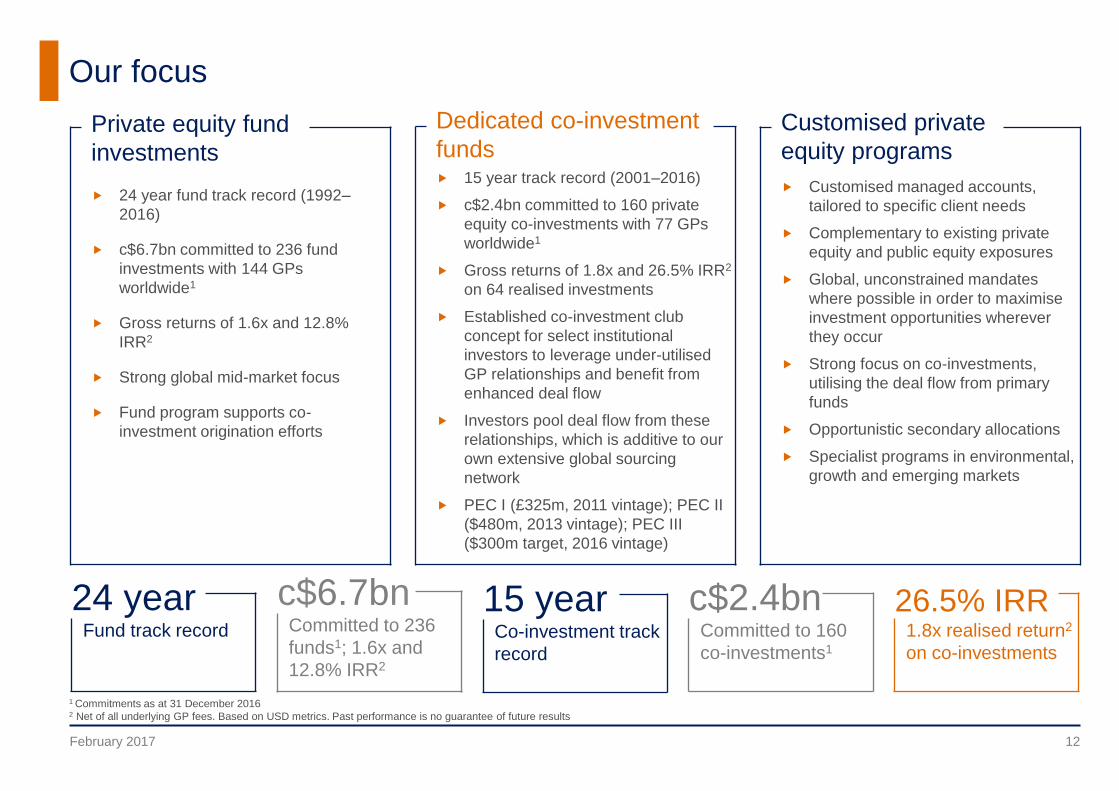
Customised private
equity programs
Customised managed accounts,
tailored to specific client needs
Complementary to existing private
equity and public equity exposures
Global, unconstrained mandates
where possible in order to maximise
investment opportunities wherever
they occur
Strong focus on co-investments,
utilising the deal flow from primary
funds
Opportunistic secondary allocations
Specialist programs in environmental,
growth and emerging markets
Private equity fund
investments
24 year fund track record (1992–
2016)
c$6.7bn committed to 236 fund
investments with 144 GPs
worldwide1
Gross returns of 1.6x and 12.8%
IRR2
Strong global mid-market focus
Fund program supports co-
investment origination efforts
1 Commitments as at 31 December 20162 Net of all underlying GP fees. Based on USD metrics. Past performance is no guarantee of future results
Our focus
February 2017
c$6.7bnCommitted to 236
funds1; 1.6x and
12.8% IRR2
24 yearFund track record
15 yearCo-investment track
record
c$2.4bnCommitted to 160
co-investments1
26.5% IRR1.8x realised return2
on co-investments
Dedicated co-investment
funds 15 year track record (2001–2016)
c$2.4bn committed to 160 private
equity co-investments with 77 GPs
worldwide1
Gross returns of 1.8x and 26.5% IRR2
on 64 realised investments
Established co-investment club
concept for select institutional
investors to leverage under-utilised
GP relationships and benefit from
enhanced deal flow
Investors pool deal flow from these
relationships, which is additive to our
own extensive global sourcing
network
PEC I (£325m, 2011 vintage); PEC II
($480m, 2013 vintage); PEC III
($300m target, 2016 vintage)
12
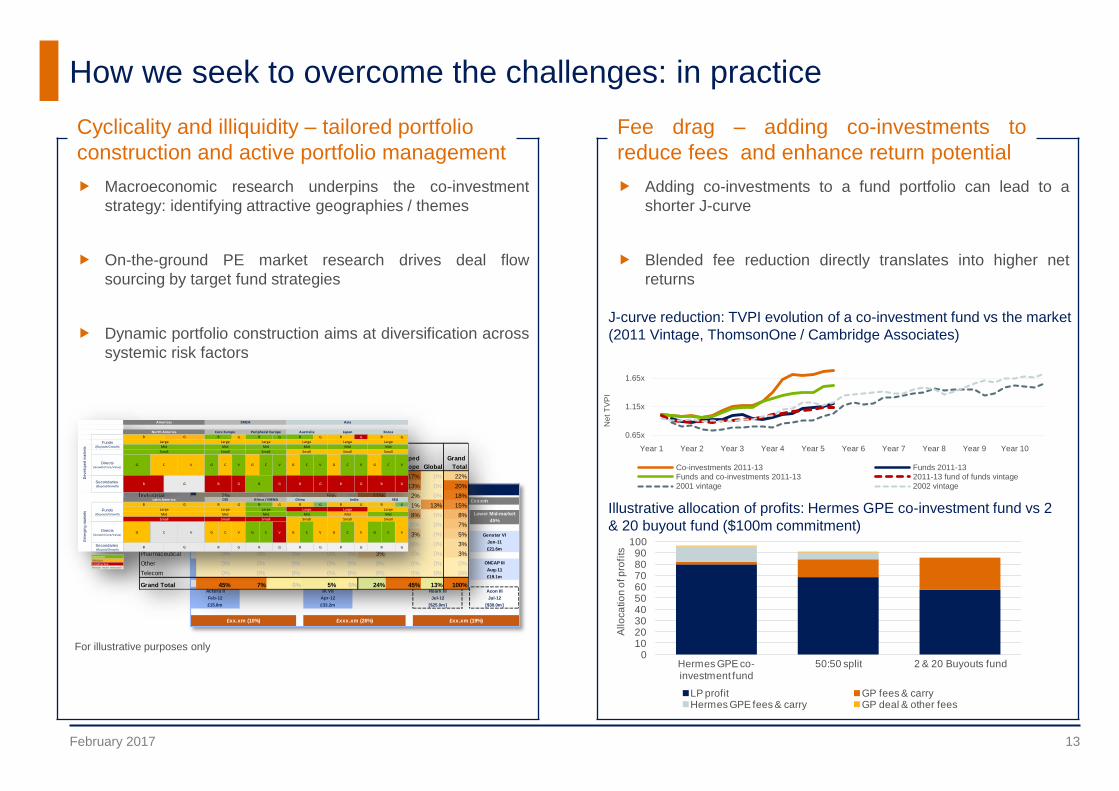
Fee drag – adding co-investments to
reduce fees and enhance return potential
Adding co-investments to a fund portfolio can lead to a
shorter J-curve
Blended fee reduction directly translates into higher net
returns
Cyclicality and illiquidity – tailored portfolio
construction and active portfolio management
Macroeconomic research underpins the co-investment
strategy: identifying attractive geographies / themes
On-the-ground PE market research drives deal flow
sourcing by target fund strategies
Dynamic portfolio construction aims at diversification across
systemic risk factors
How we seek to overcome the challenges: in practice
February 2017
For illustrative purposes only
Mid Funds Small Funds Large/Mid Funds Small Funds Upper Mid-market Lower Mid-market
50% 50% 65% 35% 55% 45%
AIF Capital IV BC Partners IX Quadriga IV GTCR X Genstar VI
Jul-11 Mar-11 May-11 Feb-11 Jun-11
£12.2m £30.2m £17.6m £21.6m £21.6m
EMPEF EQT VI Court Square III ONCAP III
Jan-12 Jul-11 May-12 Aug-11
£19.1m £36.1m £21.7m £19.1m
Actera II IK VII Roark III Acon III
Feb-12 Apr-12 Jul-12 Jul-12
£15.8m £33.2m [$25.0m] [$30.0m]
Emerging Markets: £xxm Developed Europe: £xxxm Americas: £xxxm
Hermes GPE Client Account 2011-2013 : £xxxm
£xx.xm (10%) £xxx.xm (26%) £xx.xm (19%)
Developed
Europe
Emerging
Europe
Developed
Asia
Emerging
Asia Africa
North
America
Developed
Europe Global
Grand
Total
Healthcare 17% 0% 0% 0% 0% 0% 17% 0% 22%
Retail 13% 7% 0% 0% 0% 0% 13% 0% 20%
Industrial 2% 0% 0% 5% 0% 11% 2% 0% 18%
Financial services 1% 0% 0% 0% 0% 1% 1% 13% 15%
Consumer Services 8% 0% 0% 0% 0% 0% 8% 0% 8%
Business Services 0% 0% 0% 0% 0% 7% 0% 0% 7%
Energy 3% 0% 0% 0% 0% 0% 3% 0% 5%
Consumer 0% 0% 0% 0% 0% 3% 0% 0% 3%
Pharmaceutical 0% 0% 0% 0% 0% 3% 0% 0% 3%
Other 0% 0% 0% 0% 0% 0% 0% 0% 0%
Telecom 0% 0% 0% 0% 0% 0% 0% 0% 0%
Grand Total 45% 7% 0% 5% 0% 24% 45% 13% 100%
G G G G G
Directs(Growth/Core/Value)
G C V G C V G C V G C V G C V
Secondaries (Buyout/Growth)
G G G G G
G G G G G
Directs(Growth/Core/Value)
G C V G C V G C V G C V G C V
Secondaries (Buyout/Growth)
G G G G G
Attractive
Medium
Unattractive Needs more research
Korea
Americas EMEA Asia
North America Core Europe Peripheral Europe Australia Japan
De
ve
lop
ed
ma
rke
ts
Funds(Buyouts/Growth)
B G B
Mid Mid
G C V
B G B
B B B
Large Large Large Large Large Large
B
Mid Mid Mid
Small Small Small Small Small Small
Mid
B B B
Latin America CEE Africa / MENA China India SEA
B
Em
erg
ing
ma
rke
ts
Funds(Buyouts/Growth)
B G B
Mid Mid
G C V
B G B
Small Small
B B B
Large Large Large Large Large Large
B
Mid
B
Mid Mid Mid
SmallSmall Small Small
B B B
Illustrative allocation of profits: Hermes GPE co-investment fund vs 2
& 20 buyout fund ($100m commitment)
J-curve reduction: TVPI evolution of a co-investment fund vs the market
(2011 Vintage, ThomsonOne / Cambridge Associates)
13
0.65x
1.15x
1.65x
Year 1 Year 2 Year 3 Year 4 Year 5 Year 6 Year 7 Year 8 Year 9 Year 10
Net
TV
PI
Co-investments 2011-13 Funds 2011-13Funds and co-investments 2011-13 2011-13 fund of funds vintage2001 vintage 2002 vintage
0102030405060708090
100
Hermes GPE co-investment fund
50:50 split 2 & 20 Buyouts fund
Allo
ca
tio
n o
f p
rofi
ts
LP profit GP fees & carryHermes GPE fees & carry GP deal & other fees
Appendix
February 2017 14
Disclaimer
February 2017
.
For Professional Investors only. Any person who
receives this document is required to make
themselves aware of their respective jurisdictions
and observe any restrictions including exchange
control restrictions. This document does not
constitute a solicitation or offer to any person to buy
or sell any related securities or financial
instruments. It pays no regard to the investment
objectives or financial needs of any recipient. No
action should be taken or omitted to be taken based
on this document. Tax treatment depends on
personal circumstances and may change. This
document is not advice on legal, taxation or
investment matters so investors must rely on their
own examination of such matters or seek advice.
Before making any investment (new or continuous),
please consult a professional and/or investment
adviser as to its suitability. Any opinions expressed
may change. The value of investments and
income from them may go down as well as up,
and you may not get back the original amount
invested. Any investments overseas may be
affected by currency exchange rates. Past
performance is not a reliable indicator of future
results and targets are not guaranteed. All
figures, unless otherwise indicated, are sourced
from Hermes GPE LLP (‘Hermes GPE’). For more
information please read any relevant Offering
Documents or contact Hermes GPE. Issued and
approved by Hermes GPE which is authorised and
regulated by the Financial Conduct Authority.
Registered address: Lloyds Chambers, 1 Portsoken
Street, London E1 8HZ, United Kingdom. Hermes
GPE is a registered investment adviser with the
United States Securities and Exchange
Commission. Hermes GPE (Singapore) Pte Ltd is
regulated by the Monetary Authority of Singapore.
Telephone calls may be recorded for training and
monitoring purposes.
15