Embed Size (px)
Citation preview

U.S. Department of Justice Bureau of Justice Statistics
Prisoners in 1986 The nu mber of prisoners under the jurisdiction of Federal and State correctional authorities at yearend 1986 reached a record 546,659. The states and the Distl'ict of Columbia added 39,203 prisonel's; the Federal system, 4,185. The increase for 1986 bring'> total growth in the prison populati"n since 1980 to nearly 217,000 inmatesan increase of about 66% in the 6-year period (table 1).
The 1986 growth rate (8.6%) was the largest percentage increase since 1982 and nearly equals Ule record increase in the absolute number of additional prisoners during that year (43,876 in 1982 and 43,388 in 1986). Prisoners with sentences of more than 1 year (referred to as "sentenced prisoners") accounted for nearly 96% of the total prison population at the end of 1986, gl'owing by 8.8% during the year (table 2). The remaining prisoners had sentences of a year or less or were unsentenced (those, for example, awaiting trial in States with combined prison-jail systems).
Table 1. Change in the State and Federal prison populations, 1980-86
Total Number Annual percent of percent change
Yellr in'1lates change since 1980
1980 329,821 1981 369,930 12.2% 12.2% 1982 413,806 1l.9 25.5 1983 437,248 5.7 32.6 1984 464,567 6.2 40.9 1985 503,271 8.3 52.6 1986 546,659 8.6 65.7
Note: All counts are for December 31 of each year amI may differ from previously l'eported numbers because of revision.
This bulletin presents popUlation counts for the Nation's prisons on December 31, 1986. The increase of more than 43,000 in 1 year is the second largest absolute increase recorded in the SO-year history of the National Prisoner S ta tis tics progra m.
Later this year BJS will have a wealth of new information to share on those who are incarcerated in State institutions. These da ta, drawn from interviews in 1986 with a national sample of
The numbel' of sentenced Federal prisoners continued to grow at a faster rate than sentenced prisoners in the States during the year (11.7% vs. 8.6%). Among the 7,877 Federal prisoners with no sentences or sentences of 1 year or less were 2,358 under the jurisdiction of the 1m migration and Naturalization Service-an increase of nearly 25% in the size of this population compared to the preceding year (1,888). Nearly 92% of the total Federal increase, however, occurred among those with sentences grea tel' than 1 year.
In seven Sta tes total prison populations decreased during 1986; however, in five of these Sta tes the decreases were small (less than 60 inmates). Only West Virginia and Washington reported declines of greater magnitude, and in both cases increases were reported in the preceding year.
". : .~ .":-?:" . ~otal prison populations rose most '., ii' ~, .:i :rt!111,dly during 1986 in Nevada (19.5%), ~;: if, :"\: S...wC~li Cornia (18.7%), Michigan and New '" /. ,.., .. <Il "f ( ) k ;~:';" ";',' '.' Meidco 16.8%, and 0 lahoma , < , (15.2%). New Mexico and Maine re-
corded the largest percentage increases in the number of sentenced prisoners,
May 1987
15,000 inmates, will permit analysts to trace the criminal careers, drug histories, and other characteristics of imprisoned offenders.
I want to express my deepest appreciation to the departments of correc tions in the 50 Sta tes and the District of Columbia and to the Federal Prison System who make it possible for BJS to gather and report these data.
Steven R. Schlesinger Director
each growing by mOl'e than 20% during the year. Five additional States reported increases between 15% and 20%: California (19.6%), Nevada (19.5%), Michigan (16.8%), and Oklahoma and Delaware (each with 15.2%). During the previous year, California, \1aine, and Michigan were also among the fastest growing Sta tes-all increasing the number of sentenced prisoners by at least 15% in 1985.
Rates of incarceration increase
On December 31, 1986, the number of sentenced prisoners per 100,000 residents was 216, also setting a new record. Twelve of the 18 jurisdictions equal to or greater than the national avel'age were located in the South, 3 were in the West, 2 in the Midwest, and 1 in the Northeast.
Since 1980, the number of sentenced inmates per 100,000 residents has risen 55%, from 139 to 216. During this period, pel' capita incarceration rates have grown most rapidly in the West, increasing by nearly 89%, compared to 82% in the Northeast, 59% in the Midwest, and 32% in the South.

Wes\:em states grow faster than other regions
DUl'ing 1986, the growth in the sentenced prisoner population in Western States (14.5%) was higher than in the
other regions of the Na tion: the Northeast increased 8.8%, the Midwest 7.8%, and Southern States by 6.4%. Since 1980, sentenced prison popu-la tions in Western Sta tes have more than doubled (up nearly 116%),
Table 2. Prisoners under the jurisdiction of sta te and Federal correctional authorities, by region and state, yearend 1985 and 1986
Sen tenced to more Total than 1 :tear
Percent Percent Incar-Advance Final change Advance Final change ceration
Region and State 1986 1985 1985-86 1986 1985 1985-86 rate 1986*
U. S., total 546,659 503,271 8.6% 523,922 481,393 8.8% 216
Federal 44,408 40,223 10.4 36,531 32,695 11.7 15 State 502,251 463,048 8.5 487,391 448,698 8.6 201
Northeast 82,388 75,706 8.8% 79,071 72,656 8.8% 158
Connecticut 6,905 6,149 12.3 4,043 4,326 7.0 135 Maine 1,316 1,226 7.3 1,165 967 20.5 99 Massachuse tts 5,678 5,390 5.3 5,678 5,390 5.3 97 New Hampshire 782 683 14.5 782 683 14.5 76 New Jersey 12,020 11,335 6.0 12,020 11,335 6.0 157 New York 38,449 34,712 10.8 38,449 34,712 10.8 216 Pennsylvania 15,201 14,227 6.8 15,165 14,119 7.4 128 Rhode Island 1,361 1,307 4.1 1,010 964 4.8 103 Vermont 676 677 -0.1 4'i6 443 7.4 88
Midwest 103,101 95,704 7.7% 102,689 95,245 7.8% 173
Illinois 19,456 18,634 4.4 19,456 18,634 4.4 168 Indiana 10,175 9,904 2.7 9,963 9,615 3.6 181 Iowa 2,777 2,832 -1.9 2,777 2,832 -1.9 98 Kansas 5,425 4,732 14.6 5,425 4,732 14.6 220 Michigan 20,742 17,755 16.8 20,742 17,755 16.8 227 Minnesota 2,462 2,343 5.1 2,462 2,343 5.1 58 Missouri 10,485 9,915 5.7 10,485 9,915 5.7 206 Nebraska 1,953 1,814 7.7 1,863 1,733 7.5 116 North Dakota 421 422 -0.2 361 375 -3.7 53 Ohio 22,463 20,864 7.7 22,463 20,864 7.7 209 South Dakota 1,045 1,047 -0.2 1,014 1,035 -2.0 143 Wisconsin 5,697 5,442 4.7 5,678 5,412 4.9 119
South 215,713 202,926 6.3% 208,374 195,868 6.4% 249
Alabama 11,710 11,015 6.3 11,504 10,749 7.0 283 Arkansas 4,701 4,611 2.0 4,701 4,611 2.0 198 Delaware 2,828 2,553 10.8 2,026 1,759 15.2 324 District of Columbia 6,746 6,404 5.3 4,786 4,604 4.0 753 Florida 32,228 28,600 12.7 32,219 28,482 13.1 272 Georgia 17,363 16,014 8.4 16,291 15,115 7.8 265 Kentucky 6,322 5,801 9.0 6,322 5,801 9.0 169 Louisiana 14,580 13,890 5.0 14,580 13,890 5.0 :122 Maryland 13,326 13,005 2.5 12,559 12,303 2.1 280 Mississippi 6,747 6,392 5.6 6,565 6,208 5.8 249 North Carolina 17,762 17,344 2.4 16,460 16,007 2.8 258 Oklahoma 9,596 8,330 15.2 9,596 8,330 15.2 288 South Carolina 11,676 10,510 11.1 11,022 9,908 11.2 324 Tennessee 7,182 7,127 0.8 ",182 7,127 0.8 149 Texas 38,534 37,532 2.7 38,534 37,532 2.7 228 Virginia 12,930 1.2,073 7.1 12,54~ 11,717 7.1 215 West Virginia 1,482 1,725 -14,1 1,482 1,725 -14.1 77
West 101,049 88,712 13.9% 97,257 84,929 14.5% 198
Alaska 2,460 2,329 5.6 1,666 1,530 d.9 306 Arizona 9,434 8,&31 10.6 9,038 8,273 9.2 268 California 59,484 50,111 18.7 57,725 48,279 19.6 212 Colorado 3,673 3,369 9.0 3,673 3,369 9.0 111 Hawaii 2,180 2,111 3.3 1,521 1,428 6.5 142 Idaho 1,451 1,294 12.1 1,451 1,294 12.1 144 Montana 1,111 1,129 -1.6 1,111 1,129 -1.6 135 Nevada 4,505 3,771 19.5 4,505 3,771 19.5 462 New Mexico 2,701 2,313 16.8 2,545 2,112 20.5 170 Oregon 4,737 4,454 6.4 4,737 4,454 6.4 175 utah 1,84:; 1,633 13.0 1,817 1,623 12.0 108 Washington 6,603 6,909 -4.4 6,603 6,909 -4.4 147 Wyoming 865 758 14.1 865 758 14.1 170
Note: ExplanatQry notes for each figures become available. jUllSdiction are provided on pages 7-8. *The number of prisoners sentenced to Prisoner counts for 1985 may differ from more than 1 year per 100,000 resident those reported in previous publications population. Population estimates are for and are subject to revision as updated July 1, 1986.
2
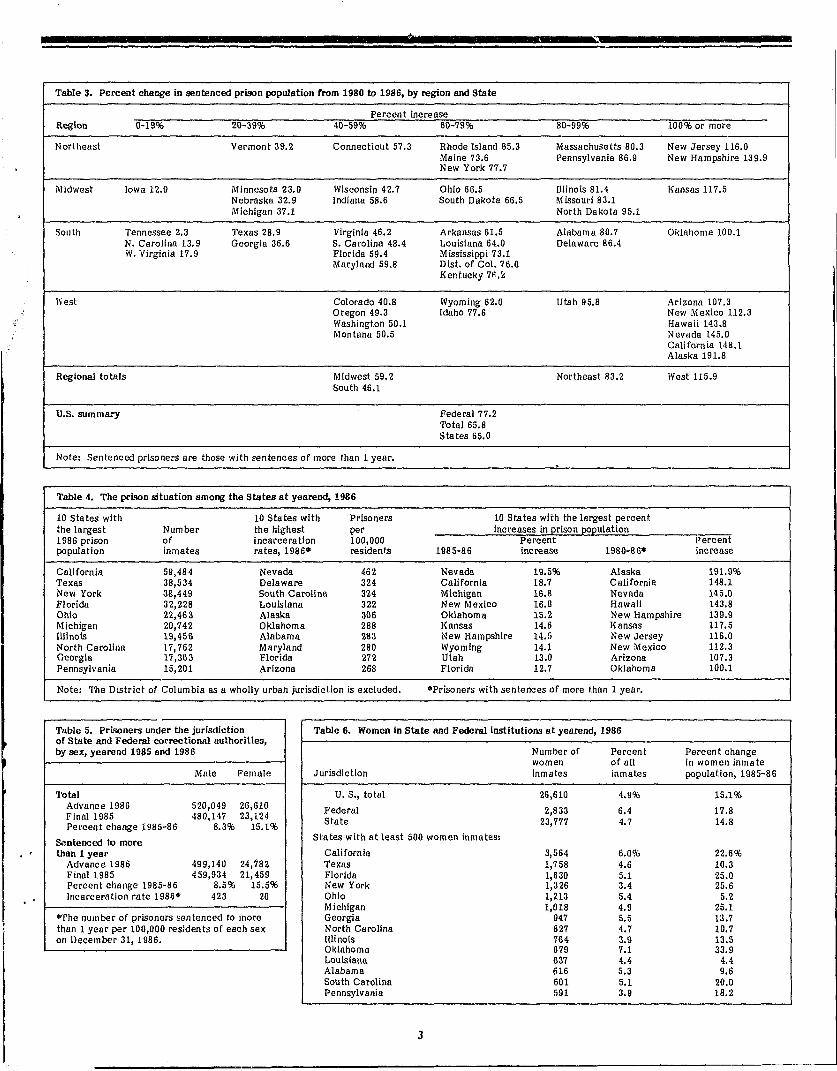
compared to growth of 8;3% in Ule Northeast, 59% in the Midwesl, and 46% in the South (table 3). Ten States have more than doubled their sentenced populations since 1980; six are in the West: Alaska (192%), California (148%), Nevada (145%), Hawaii (144%), New Mexico (112%), and Arizona (107%).
Califomia's increase of more than 34,000 sentenced prisoners since 1980 accounts for 66% of the increase for the West and 18% of the entire national increase among the States since 1980. In 1980, 7.9% of the Nation's sentenced Sta te prisoners were in California; in 1986, 11.8%. (For additional State comparisons see table 4.)
Female prisoner population grows at a fllSl:er pace
Women inmates numbered 26,610 among the Nation's prisoners, increasing at a faster rate during 1986 (15.1%) than males (8.3%) (table 5). The rate of incarceration for sentenced males (423 per 100,000 males in the resident population), however, was about 21 times higher than for sentenced females.
The female prison population has grown at a faster rate than the male population in each year since 1981 (table 6). The higher growth rates for women over the period 1981 to 1986 have raised the female percentage of the Nation's prison population from 4.2% in 1981 to 4.9% in 1986.
In 1986, 14 States and the Federal system had more than 500 female inmutes. During the year eight of these jurisdictions reported growth in excess of 15%: Oklahoma (33.9%}. New York (25.6%), Michigan (25.1 %), F~!)rida (25.0%), California (22.6%), ::;outh Carolina (20.0%), Pennsylvania (18.2%), and the Federal Prison System (17.8%).
i
Table 3. Percent change in sentenced prison population (rom 1980 to 1986, by region and state
Percent increase Region 0-19% 20-39% 40-59%
Northea st Vermont 39.2 Connecticut 57.3
Midwest Iowa 12.0 Minnesota 23,0 Wisconsin 42,7 Nebraska 32.9 Indiana 58.6 Michigan 37.1
South Tennessee 2.3 Texas 28.9 Virginia 46.2 N. Carolina 13.9 Georgia 36.6 S. Carolina 48.4 W. Virginia 17.9 Florida 59.4
M aryiand 59.8
West Colorado 40.8 Oregon 49.3 Washington 50.1 Montana 50.5
Regional totals Midwest 59.2 South 46.1
U.S. sum mary
Note: S entenced prisoners are those with sentences of more than 1 year.
Table 4. The prison situation among the states at yearend, 1986
s with est
10 State the larg 1986 pri populati
son on
ia
rk
Number of inmates
59,484 38,534 38,449 32,228
10 Sta tes with Prisoners the highest per incal'ceration 100,000 rates, 1986. resident.s
Nevada 462 Delaware 324 South Carolina 324 Louisiana 322
60-79% 80-99%
Rhode Island 65.3 Massachusetts 80.3 Maine 73.6 Pennsylvania 86.9 New York 77.7
Ohio 66.5 lllinois 81.4 South Dakota 66.5 Missouri 83.1
North Dakota 95.1
Arkansas 61.5 Alabama 80.7 Louisiana 64.0 Delaware 86.4 Mississippi 73.1 D ist. of Col. 76.0 Kentucky 7ft.2
Wyoming 62.0 Utah 95.8 Idaho 77.6
Northeast 83.2
Federal 77.2 Total 65.8 States 65.0
.
10 States with the largest percent increases in Qrison ~Qulation
Percent 1985-86 increase 1980-86·
Nevada 19.5% Alaska California 18.7 California Michigan 16.8 Nevada New Mexico 16.8 Hawaii
100% or more
New Jersey 116.0 New Hampshire 139.9
Kansas 117.5
Oklahoma 100.1
Arizona 107.3 New Mexico 112.3 Hawaii 143.8 Nevada 145.0 California 148.1 Alaska 191.8
West l15.9
Percent increase
191.9% 148.1 145.0 143.8
Californ Texas New Yo Florida Ohio Michiga llIinois North C Georgia Pennsyl
22,463 Alaska 306 Oklahoma 15.2 New Hampshire 139.9 n 20,742 Oklahoma 288 Kansas 14.6 Kansas
19,456 Alabama 283 New Hampshire 14.5 New Jersey arolina 17,762 Maryland 280 Wyoming 14.1 New Mexico
17,363 Florida 272 utah 13.0 Arizona vania 15,201 Arizona 268 Florida 12.7 Oklahoma
Note: T he District of Columbia as a wholly urban jurisdiction is excluded. .Prisoners with sentences of more than 1 year.
Table 5. of state by sex, y
Prisoners under the jurisdiction and Federal correctional authorities, earend 1985 and 1986
ce 1986 Total
Advan Final Perce
1985 nt change 1985-86
ed to more SCntenc than 1 y
Advan Final Perce Incarc
ear ce 1986 1985 nt change 1985-86 eration rate 198B·
Male
520,049 480,147
8.3%
499,140 459,934
8.5% 423
Female
26,610 23,124
15.1%
24,782 21,459
15.5% 20
mber of prisoners sentenced to more .-rhe nu than 1 y on Dece
ear per 100,000 residents of each sex mber 31, 1986.
Table 6. Women in State and Federal institutions at yearend, 1986
Number of Percent women of all
Jurisdiction inmates inmates
U. S., total 26,610 4.9%
Federal 2,833 6.4 State 23,777 4.7
States with at least 500 women inmates:
California 3,564 6.0% Texas 1,758 4.6 Florida 1,630 5.1 New York 1,326 3.4 Ohio 1,213 5.4 Michigan 1,018 4.9 Georgia 947 5.5 North Carolina 827 4.7 Illinois 764 3.9 Oklahoma 679 7.1 Louisiana 637 4.4 Alabama 616 5.3 South Carolina 601 5.1 Pennsylvania 591 3.9
3
117.5 116.0 112.3 107.3 100.1
Percen t change in women inmate population, 1985-86
15.1%
17.8 14.8
22.6% 10.3 25.0 25.6 5.2
25.1 13.7 10.7 13.5 33.9
4.4 9.6
20.0 18.2

Nearly 14,000 in local jails because of state prison crowding
At the end of 1986,17 States reported a total of 13,770 sta te prisoners held in local jails because of crowding in State facilities (table 7). Although there were two fewel' States with prisoners held locally at the end of 1986 than in 1985, the number of such inmates gl'ew by 3,627, an increase of nearly 36%. Three States-Louisiana, New Jersey and California-accounted for more than half of the State-
sentenced prisoners in IOCHI jails at yeHrend. Five States-Louisiana, :'I-lississippi, Tennessee, Kentucky, and New Jersey-held more than 13% of their StHte-sentenced prisoners in 10cHI jails because of State facility crowding. Arkansas and Tennessee reported the largest percentage gains in the number of such inmates between 1985 and 1986. Overall, 2.7% of the State prison population was confined in local jails on December 31, 1986, because of pl'ison crowding.
Table 7. Number of State prisoners held in local jails because or prison crowding, by state, yearend 1985 and 1986
Prisoners held in local jails Sta tes housing As percen t of prisoners Number all Erisoners in local jails 1985 1986 1985 1986
Total 10,143 13,770 2.2% 2.7%
Alabama 398 514 3.6 4.4 ArkansasB 115 458 2.5 8.9 California 1,122 1,566 2.2 2.6 Coloradoa 245 343 6.8 8.5 Idaho 9 0 .6 0
Illinois 43 48 .2 .2 Kentucky 791 886 13.7 14.0 Louisiana 2,923 3,449 21.0 23.7 Maine 51 36 4.2 2.7 Massachusetts 2 1 - -Mississippi 933 1,169 14.6 17.3 New JerseyB 1,486 2,244 11.6 13.2 Sou th Ca roli na 429 451 4.1 3.9 TennesseeB 628 1,201 8.3 14.3 Utah 33 77 2.1 4.2
Vermontb 11 8 1.7 1.2 Virginia 786 1,257 6.5 9.7 Washington 49 62 .7 .9 Wisconsin 89 0 1.6 0
-Less than 0.05%. jurisdiction population was calculated on the aFor states not including jail backups in their ~'llbined total of jail and prison. jurisdiction cour,ts, the percentage of ermont reported 8 inmates in local lockups.
4
Estimating prison capacity
The extent of crowding in the Nation's prisons is di fficult to determine precisely because of the absence of uniform measures for defining capacity. A wide variety of capacity measures are in use among the 52 reporting jurisdictions since capacity may reflect both available space to house inma tes as well as the ability to sta ff Hnd opel'ate an institution. To estimate the capacity of the Nation's prisons, States were asked to supply up to three measures for yearend 1986-ra ted, operational, and design capacities. These measures were defined as follows:
• Rated capacity is the number of beds or inmates assigned by a rating official to institutions within the state.
• Opera tional capacity is the number of inmates that can be accommodated based on a facility's sta ff, existing prograrns, and services.
• Design capacity is the number of inmates that planners or architects intended for the facility.
Of the 52 reporting jurisdictions, 36 supplied rated capacities, 42 provided opera tional capacities, and 35 subm i tted design capacities (table 8). As a result, estimates of total capacity and measures of the relationship to population are based on the highest and lowest capacity figures provided. (Twenty-t.wo states reported one capacity measure or gave the same figure for each capacity measure they reported.)

,f
l Il
Table 8. Reported Federal and State prison capacities at yearend 1986
Population as a Qercent of:a
Rated Operational Design Highest Lowest Jurisdiction capacity capacity capacity capacity capacity
Federal 27,938 34,890 27,938 127% 159%
Northeast Connecticut 6,072 4,968 3,781 114% 183% Maine 1,033 1,033 1,033 124 124 :l-lassachusetts b 3,265 .. , ... 174 174 New Hampshire 689 689 539 110 141 New Jersey 10,401 11,394 9,777 105 123 New York 37,743 39,502 35,891 97 107 Pennsylvania ... ... 11,048 138 138 Rhode Island 1,456 1,440 1,359 94 100 Vermont 597 591 547 113 124
Midwest lllinois 19,705 19,705 15,943 98% 122% Indiana 8,710 .. , ." 113 117 Iowa ... 2,702 2,918 95 103 Kansas 3,502 5,015 ... 108 155 Michigan ... 16,784 ." 124 124 Minnesota 2,495 2,495 2,633 94 99 !'.iissouri ... 11,588 .,. 91 91 Nebraska 1,562 1,513 1,542 125 129 North Dakota ... 471 471 89 89 Ohio ... ... 13,282 169 169 South Dakota 1,189 1,090 1,189 88 96 Wisconsin ... 4,591 ... 124 124
South Alabama 10,374 10,374 10,374 108% 108% Arkansas ... 4,620 .., 102 102 Delaware .,. 2,563 2,404 110 118 District of Columbia 6,769 6,577 ... 100 103 Florida 35,982 32,290 25,561 90 126 Georgia .,. 16,323 .., 106 106 Kentucky 4,921 5,327 ... 10 1 107 Louisiana 11,080 11,080 11,080 100 100 Ilaryland ." 13,646 9,544 98 140 Mississippi 5,878 .. , .. , 95 95 North Carolina ... . .. 16,575 107 107 Oklahoma 7,642 7,260 ... 126 132 Sou th C a roli na 9,212 9,212 8,163 122 138 Tennessee 7,801 ... . .. 92 92 Texas 40,392 38,373 40,392 95 100 Virginia 10,159 10,159 9,753 115 120 West Virginiab 1,547 1,640 1,547 86 91
West Alaska 2,336 ... ... 105% 105% Arizona ... 9,911 . .. 95 95 Cali fornia 32,853 53,887 32,853 107 176 Colorado 3,760 3,760 ... 98 98 Hawaii 1,252 ... 1,252 174 174 Idaho 1,149 1,470 1,149 99 126 Montana 936 1,190 936 93 119 Nevada ... '" 3,911 115 U5 New Mexico 2,363 2,593 2,363 104 114 Oregon ... 4,057 2,815 117 168 Utah 1,805 1,805 1,537 98 115 IV aSilington 5,324 6,040 5,324 108 123 Wyo'lling ... 950 ... 91 91
••• Dat,l not available. have been included in the total prisoner &Exclu:les State-sentenced inmates held %ount. in loea jails due to crowding where they Capacity figures for males only.
Table 9. Population as a percentage of reported capacity for State and Federal prisons, 1984-86
Poeulation as a Qercent of:* 1985-86 increase in: Highest caeacit:i Lowest caeacit:i Highest Lowest
1984 1985 1986 1984 1985 1986 capacity capacity
U. S., total 104% 106% 108% 117% 121% 126% 31,963 23,605
Federal prisons 110 123 127 137 154 159 2,305 1,807 Sta te priSons 105 105 106 116 119 124 29,658 21,79B
Note: States were asked to report their rated, .Excludes State-sentenced inmates held in local operational, and design capacities. Tabulations jails due to crowding where they have been renect the highest and lowest of the three included in the total prisoner count. capacities reported for 1984, 1985, and 1986.
5
Most jurisdictions are operating above reported capacity
Generally, prisons require reserve cupacity in order to operate efficiently. Prison dormi tories and cells need to be maintained and repaired periodically, special housing space is n€:eded to accommodate protective custody and disciplinary cases, and space may be needed to cope with emergencies. At the end of 1986, 10 States reported that they were operating below 95% of their highest capacity. Forty-one jurisdictions and the Federal Prison System reported operating at approximately 100% or more of their lowest capacity; 32 of these held populations that met or exceeded their highest capacities . Three States exceeded their highest capacity by more than 50%.
Overall, State prisons are estimated to be operating at approximately 106% of their highest reported capacities and at 124% of their lowest capacities (table 9). The Federal system is estimated to be operating between 27% and 59% above capacity.
I3etween 1985 and 1986, State and Federal prison capacities are estimated to have increased by approximately 24,000-32,000 beds (based on the lowest and highest capacities in table 9). During the same period, prison populations grew by more than 41,000 (excluding locally held but State-sentenced prisoners). At the end of 1986 the total capacity of State and Federal prisons was estimated to be between 433,700 inmates und 497,539 inmates. Approximately 7% of the available capacity at the end of 1986 was maintained by the Federal govel'l1ment, while about 8% of the Nation'S inmates resided in Federal facili ties.
Jurisdictions have employed many methods to alleviate erowding. Construction of permanent and temporary facilities, backups in local jails, doublebunking, intensive community supervision programs, accelerated parole release, and sentence rollbacks have all been used to make room for new inmates.
-----~--
Crime and prison population growth
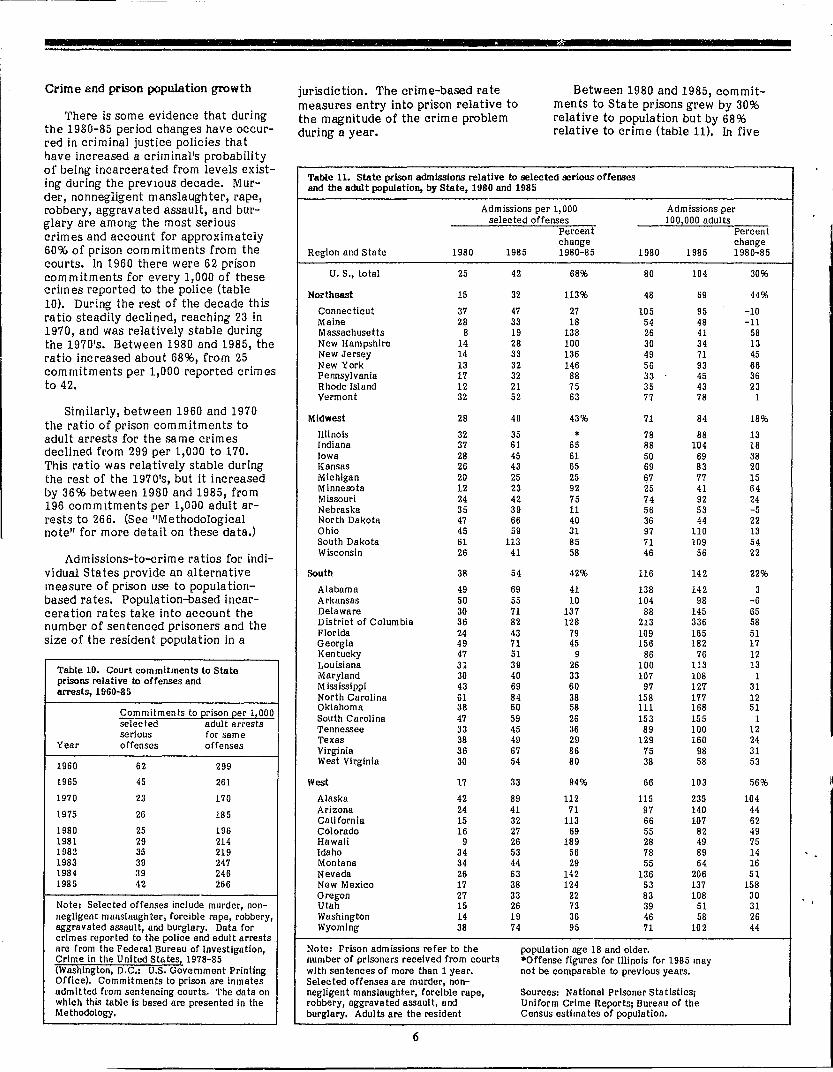
There is some evidence that during the 1980-85 period changes have occurred in criminal justice policies that have increased a criminal's probability of being incarcerated from levels existing during the prevIOus decade. Murder, nonnegligent manslaughter, rape, robbery, aggravated assault, and burglary are among the most serious crimes and account for approximately 60% of prison commitments from the courts. In 1960 there were 62 prison commitments for every 1,000 of these crimes reported to the police (table 10). During the rest of the decade this ra tio steadily decli ned, reaching 23 in 1970, and was relatively stable during the 1970's. Between 1980 and 1985, the ratio increased about 68%, from 25 commitments per 1,000 reported crimes to 42.
Similarly, between 1960 and 1970 the ratio of prison commitments to adult arrests for the same crimes declined from 299 per 1,000 to 170. This ratio was relatively stable during the rest of the 1970's, but it increased by 36% between 1980 and 1985, from 196 commitments per 1,000 adult arrests to 266. (See "Methodological note" for more detail on these data.)
Admissions-to-crime ratios for individual States provide an alternative measure of prison use to popula tionbased rates. Population-based incarceration rates take into account the number of sentenced prisoners and the size of the resident popUlation in a
Table 10. Court commitments to State prisons relative to offenses and arrests, 196D-8S
Commitments to erison eer 1,000 selected adult arrests serious for same
Year offenses offenses
1960 62 299
1965 45 261
1970 23 170
1975 26 185
1980 25 196 1981 29 214 1982 35 219 1983 39 247 1984 39 246 1985 42 266
Note: Selected offenses include murder, non-negligent manslaughter, forcible rape, robbery, aggravated assault, and burglary. Data for crimes reported to the police and adult arrests are from the Federal Bureau of Investigation, Crime in the United States, 1978-85 (Washington, D.C.: U.S. Government Printing Office). Commitments to prison are inmates admitted fl'om sentencing courts. The data on which this table is based are presented In the Methodology.
jurisdiction. The crime-based rate measures entry into prison relative to the magnitude of the crime problem during a year.
Between 1980 and 1985, commitments to State prisons grew by 30% relatiVe to population but by 68% relative to crime (table 11). In five
Tabl.e 11. state prison admissions relative to selected serious offenses and the adult population, by state, 1980 and 1985
Adm issions per 1, 000 Admissions per selected offenses 100,000 adults
Percent Percent change change
Region and State 1980 1985 1980-85 1980 1985 1980-85
U. S., total 25 42 68% 80 104 30%
Northeast 15 32 113% 48 69 44%
Connecticut 37 47 27 105 95 -10 Maine 28 33 18 54 48 -11 Massachusetts 8 19 138 26 41 58 New Hampshire 14 28 100 30 34 13 New Jersey 14 33 136 49 71 45 New York 13 32 146 56 93 66 Pennsylvania 17 32 88 33 45 36 Rhode Island 12 21 75 35 43 23 Vermont 32 52 63 77 78 1
Midwest 28 40 43% 71 84 18%
Illinois 32 35 * 78 88 13 Indiana 37 61 65 88 104 18 Iowa 28 45 61 50 69 38 Kansas 26 43 65 69 83 20 Michigan 20 25 25 67 77 15 Minnesota 12 23 92 25 41 64 Missouri 24 42 75 74 92 24 Nebraska 35 39 11 56 53 -5 North Dakota 47 66 40 36 44 22 Ohio 45 59 :n 97 110 13 South Dakota 61 113 85 71 109 54 Wisconsin 26 41 58 46 56 22
South 38 54 42% 116 142 22%
Alabama 49 69 41 138 142 3 Arkansas 50 55 10 104 98 -6 Delaware 30 71 137 88 145 65 District of Colum bia 36 82 128 213 336 58 Florida 24 43 79 109 165 51 Georgia 49 71 45 156 182 17 Kentucky 47 51 9 86 76 12 Louisiana 31 39 26 100 113 13 Maryland 30 40 33 107 108 1 Mississippi 43 69 60 97 127 31 Nor th Ca roli na 61 84 38 158 177 12 Oklahoma 38 60 58 111 168 51 South Carolina 47 59 26 153 155 1 Tennessee 33 45 36 89 100 12 Texas 38 49 29 129 160 24 Virginia 36 67 86 75 98 31 West Virginia 30 54 80 38 58 53
IYest 17 33 94% 66 103 56%
Alaska 42 89 112 115 235 104 Arizona 24 41 71 97 140 44 Cali fornia 15 32 113 66 107 62 Colorado 16 27 69 55 82 49 Hawaii 9 26 189 28 49 75 Idaho 34 53 56 78 89 14 Montana 34 44 29 55 64 16 Nevada 26 63 142 136 206 51 New Mexico 17 38 124 53 137 158 Oregon 27 33 22 83 108 30 utah 15 26 73 39 51 31 Washington 14 19 36 46 58 26 Wyoming 38 74 95 71 102 44
!-lote: Prison admissions refer to the popUlation age 18 and older. number of prisoners received from courts ·Offense figures for Illinois for 1985 may with sentences of more than 1 year. not be comparable to previous years. Selected offenses are murder, non-negligent manslaught.er, forcible rape, Sources: National Prisoner Statistics; robbery, aggravated assault, and Uniform Crime Reports; BUreau of the burglary. Adults are the resident Census estima tes of population.
6
States-Arkansas, Connecticut, Kentucky, Maine, and Nebraska-the number of com mitments to prison per 100,000 adult residents declined between 1980 and 1985. In all five, however, the ratio of prison commitments to reported crimes increased during these years. Thus, these States were sending fewer persons to prison per adul,t resident in 1985 than in 1980 but more persons to prison per reported crime.
Methodological note
This bulletin is based upon an advance count of prisoners conducted immediately after a calendar year ends. A detailed, final count of prisoners and prisoner movements is published at a later time.
The data used to compute the rates in table 10 are presented in the accompanying appendix table.
Explanatory notes
Alabama. Reported capacity figures exclude community programs.
Alaska. In this Sta te prisons and jails form one integrated system. All NPS data include, therefore, both jail and prison populations. Rated capacity excludes 300 additional beds under contract for Alaska •.
Arkansas. Population counts for male inmates with with more than a I-year maximum sentence include an undetermined number of inmates with a sentence of 1 year or less. The male population counts exclude 458 inmates housed in local jails due to overcrowding, 450 awaiting pickup, and 8 awaiting release. The Arkansas Department of Corrections has one type of capacity, which is set by the Board of Corrections. This capacity is reported in operational capacity.
California. Population counts are based on custody data. California uses jails and work furlough facilities to house inma tes due to prison crowding. In-ma tes in both types of facilities are included in the counts of prisoners housed in local jails because of State
.' prison crowding.
Colorado. Population counts fOl'
inmates with more than a I-year maximum sentence include an undetermined number of inmates with a sentence of 1 year or less. Population counts exclude 343 male inmates housed in local jails awaiting pickup. Capacity figures include 350 spaces in community cen-
Appendix table. Data used to compute the rates in table 10
Number of court Number of commitments to selected serious Estimated number prison for offenses reported of adult arrests
Year any offense to the ,?olice for same offenses
1960 74,852 1,200,560 250,466
1965 74,724 1,669,890 286,685
1970 67,304 2,943,820 395,678
1975 112,803 4,278,380 609,764
19BO· 130,323 5,139,720 666,063 1981 149,186 5,141,520 697,409 1982 164,648 4,769,490 752,873 1983 173,289 4,387,990 702,662 1984 166,927 4,257,680 677,275 1985 183,131 4,400,740 688,864
Note: The number of court commitments to prison is based upon the total number of entries from sentencing courts with sentences greater than 1 year. The number of reported offenses is derived from annual publications from the FBI on the number of murders, non-negligent manslaughters, forcible rapes, robberies, aggravated assaults, and burglaries reported to police agencies. The estimated number of a.dult arrests for these crimes is derived by multiplying the estimated total number of arrests by the percentage of known arrests age 18 and older, as reported annually
ters not exclusively designated as male or female.
Connecticut. In this Sta te prisons and jails form one integrated system. All NPS data include, therefore, both jail and prison popUlations.
Delaware. In this State prisons and jails form one integrated system. All NPS da ta include, therefore, both jail and prison populations. Population counts for Delaware are estimates believed to be within .07% of a complete enumeration.
District of Columbia. Population counts are based on custody data. Those inmates housed in Federal Bureau of Prison's facilities as a result of crowding are not included. In the District of Columbia prisons and jails form one integrated system. All NPS data include, therefore, both jail and prison popUlations. The capacity figures include 263 male and 22 female contract spaces.
Federal. Popula tion counts for unsentenced inmates include 2,345 males and 13 females who come under the jurisdiction of the U.S. Immigration and Naturalization Service. Capacity figures apply to Bureau of Prisons institutions only and do not include capacity provided by contract facilities.
Florida. Population counts are based on custody data.
Georgia. Population counts are based 7
by the FBI. For 1960 and 1965, estimates of adult arrests were based on FBI data for total known arrests for those years and were weighted for reporting coverage (see Crime in the U.S., 1970, tables 24-25). By year, the percentage of a:aun arrests among all arrests for these crimes was:
1960 - 65.7% 1981- 69.1% 1965 - 61.4% 1982 - 71.5% 1970 - 61.5% 1983 - 72.1% 1975 - 60.8% 1984 - 73.0% 1980 - 67.4% 1985 - 73.2%
on custody data. Inmates housed in local jails awaiting pickup are not included in the jul'isdiction population until they enter <'l Stat", prison, according to department policy.
Hawaii. In this Sta te prisons and jails form one integrated system. All NPS data include, therefore, both jail and prison popula tions.
Iowa. Population counts are based on custody data.
Kansas. For rated capacity Kansas reported optimum management capacity, which is the largest number of inmates that can be accommodated and still maintain a desirable level of management and control. For operational capacity Kansas reported maxim um capacity, which is the largest number of inmates that can be physically housed without using nonhousing areas such as hallways, recreation areas, infirmary, and segregation space.
Maine. Population totals are actual counts; the breakdowns for sentenc~ length are estimates believed to be within 3% of the actual figures.
Maryland. Population totals are actual manual counts; the breakdowns for sentence length are estimates.
Massachusetts. Population counts for inmates with more than a l-year maximum sentence include an undetermined number of inmates with a sentence of 1 year or less. By law, offenders in Massachusetts may be sentenced to
terms of up to 2 1/2 years in locally operated jails and correctional institutions. Such populations are excluded from the State count but are included in the published population counts and rates for local jails and correctional institutions.
Michigan. Population counts only include inmates in Michigan's custody and inmates in the Community Residential Program. Capacity figures exclude the capacities of prer'elease centers and halfway houses.
Nevada. For design capacity Nevada reported its "critical opera tional capacity."
New Hampshire. New Hampshire has no facility to house female inmates. Thus, all females are housed in county, Federal, or other Sta tes' facili ties,
New Jersey. Population counts exclude 1,825 of the 2,162 male and 82 female inmates housed in local jails because of overcrowding. Capacity figures include 480 bedspaces in county facilities under County Contt'act and County Assistance programs.
New York. Rated capacity figures exclUde 1,759 tempoI'ary housing units. Design capacity figures exclude 1,759 temporary housing units, 1,153 disciplinary units, and 699 infirmary UnIts.
North Carolina. Population totals are actual counts; the breakdowns for sentence length are estimates believed to be accura te within 1 % of the actual counts.
Ohio. Population counts for inmates with more than a 1-year maximum sentence include an undetermined number of inmates with a sentence of 1 year or less.
Oklahoma. Population counts for inmates with more than a 1-year maximum sentence may include a small undetermined number of inmates with a sentence of 1 year.
Oregon. Oregon revised the June 30, 1986, count for inmates with more than a 1-year maximum sentence. Population counts are for all inmates in Oregon's jurisdiction including those out to hospitals, to court, and on furlough. Capacity figures for this State exclude 275 male and 4 female Ifspecial purpose" beds. For operational capacity Oregon reported figures for actual bed occupancy count as of December 31, 1986.
Rhode Island. Rhode Island revised the June 30, 1986, counts for male inmates with more than a I-year maximum sentence and for unsentenced male inmates. In this State prisons and jails form one integrated system, All NPS data include, therefore, both jail and prison popula tions.
Tennessee. Population counts are based on custody data. Population counts exclude 1,201 inmates housed in local jails because of Sta te prison crowding.
Texas. Population counts are based on custody data.
Vermont. In this Sta te prisons and jails form onE' integra ted system. All NPS da ta include, therefore, both jail and prison populations. The count for inmates in local jails because of State prison crowding include eight male inmates housed in local lockups.
Washington. Capacity figures exclude space in work release facilities, which housed 540 male and 32 female inmates on December 31, 1986.
West Virginia. The female popUlation counts are based on custody data. The male jurisdiction count excludes an undeter'mined number of inmates housed in local jails awaiting pickup.
Wyoming. Jurisdiction population count is an estimate believed to be within 3% of the actual count. The male operational capacity figure is absolute total bedspace and includes 60 bedspaces in community centers not exclusively designated as male or female.
8
Bureau of Justice Statistics I3ulletins are prepared principally by BJS staff. This bulletin was written by LawI'ence A, Greenfeld, corrections unit chief, and was edited by Frank D, Balog. Statistical assistance was provided by Sophie Bowen. Marilyn :vJarbrook, publications unit chief, administered production, assisted by Betty Sherman, Jeanne Harris, Millie Baldea, and Arlene F. James. Data collection was supervised by Gregory Wells of the U.S. Bureau of the Census.
May 1987, NCJ-I04864
The Assistant A ttorney General, Office of Justice Programs, coordinates the criminal and juvenile justice activities of the following program Offices and Bureaus: the Bureau of Justice Statistics, National Institute of Justice, Bureau of Justice Assistance, Office of Juvenile Justice and Delinquency Prevention, and the Office of Victims of Crime.
"

..
----------------------------------------------------------------------
Crime and Older Americans Information Package
• Are older Americans more likely to be victims of crime than younger age groups?
• Are the elderly being arrested for certain crimes more frequently than in the past?
• Are offenders in crimes against the elderly more likely to be strangers or nonstrangers compared to other age groups?
A new information package available from the Justice Statistics Clearinghouse answers these and other questions about crime and the elderly. Drawing from national sources for crime statisticsincluding the BJS National Crime Survey, the FBI Uniform Crime Reports, and the BJS National Corrections Reporting Program-the 34-page package discusses the types of crimes in which older Americans are most likely to be victims and offenders, and the types of crime prevention they use.
As the elderly population has grown, so has concern about the effects of crime on this age group.
Please send me copies of the Informa-tion Package on Crime and Older Americans (NCJ 104569) at $10.00 each.
Name: __ _
Organization: _____________ _
Address: _____________ _
City, State, ZIP: __________ _
Telephone: ____________ _
Please detach this form and mail it, with payment, to: Justice Statistics Clearinghouse Dept. F-AGK Box 6000 Rockville, MD 20850
Population statistics indicate that older Americans are fast becoming a large segment of the total U.S. population. In 1985, Americans 60 years and older totaled 39.5 million-a 21-percent in~ crease over the past 10 years.
This package also includes the names and addresses of associations and organizations that are sources of information about crime and older Americans and a list of further r!~adings.
Crime and Older Americans costs only $10.00.
Method of payment o Payment of $ __________ enclosed
o Check payable to NCJRS
o Money order payable to NCJRS
Please bill my
o NCJRS deposit account
#
Credit card 0 Visa 0 MasterCard
# ________ Exp. date:, ___ _
Signature: _____________ _

Order form
... BJS Selected Library in Microfiche and Topical Bibliography from the National Criminal Justice Reference Service Libraries, research organizations, and universities now have access to the full text of 284 documents prepared by the Bureau of Justice Statistics (BJS) , U.S. Department of Justice. The Bureau of J-ttstice Statistics SLiM -produced in 1985 by the Justice Statistics Clearinghouse/NCJRSprovides text of the entire set of documents published between 1971 and 1984 from the various BJS data series, including:
.. National Crime Survey • National Prisoner Statistics • Justice Expenditure and Employment Survey • Computer Crime Series • BJS Bulletins and Special Reports • Sourcebook of Criminal Justice Statistics.
A free Topical Bibliography accompanies your order.
Each copy of the SLiM is shipped with a copy of the Topical Bibliography Publications of the BW'eau of Justice Statistics, 1971-84, which puts at your fingertips more than 200 reference sources and ideas on criminal justice statistics issues and programs. The Topical Bibliography also serves as an index to the SLiM and contains an informative abstract of each document, as well as subject and title indexes to provide easy reference.
Name ____________________________ ___
o Yes! Pleas!;' send me the Bureau ()r Justice Statistics SLiJl ami a free Topical Bibliography for $20:3.00 U.S. and Canada ($24H.25 other foreign COUllt de.;;).
Title ____ _
Agency ______________________________ _
Address ____________________________ _
Telephone L( _---1. _____________________ _
C I don't wish to order the SLiM, but I would like thE! Topieal Bibliography, PlibliC'ali()II.~ 1)( the Bureau o(Justice Statistics, 1!IIi-JON:' (291 pages) for $17.50 ($lH.50 Canada, 822.50 othl'l' foreign countries). C I'd also like infOlwation about other ~Li.M packages.
Heturn with your payment to: Justice Statistics ClearinghousetNCJRS, Dept. {o'·AGB, Box 6000. Rockville, !'lID 20850.
o My check fol' ____ i::; enclosed.
o Chal'ge my ___ VISA ____ MasterCard
Card no. ____________ -_Exp. date ____ _
Signature ____________________ _
o Chal'ge my NCJRS Deposit Account no. _______ _
o Government Purchase Order no. (please add a $2.00 processing fee)
, .
Bureau of Justice Statistics reports (revised June 1987)
Call toll-free 800-732-3277 (local 251-5500) to order 8JS reports, to be added 10 one of Ihe BJS mrJillng lisls, or 10 speak to a reference specialist in statistics at the Justice Statistics Clearinghouse, National Criminal Justice Reference Service, Box 6000, Rockville, MD 20850. Single copies of reports are free; use NCJ number to order. Postage and handling are charged for bulk orders of single reports. For single copies of multiple Ii ties, up to 10 litles are free; 11-40 litles $10; more than 40, $20; libraries call for special rates.
Public-use tapes of BJS data sets and other criminal justice data are available from the Criminal Justice Archive and Information Network, P.O. Box 1248. Ann Arbor, MI48106 (313'763-5010).
National Crime Survey Criminal victimization in the U.S.:
1985 (final report). NCJ-l04273. 5/87 1984 (hnal report) NCJ-loo435.5/86 1983 (final report). NCJ-96459.10/85 1982 (final report), NCJ-92820, 11/84
BJS special reports. Robbery victims, NCJ-l04638. 4/87 Violent crime by strangers and nonstrangers,
NCJ-I03702.1I87 Preventing domestic violence against women.
NCJ.l02037.8/86 Crime prevention measures. NCJ-I00438. 3/86 The use of weapons in committing crimes,
NCJ-99643. 1/86 Reportlrlg crimes to the police, NCJ-99432.
12/85 Locating city, suburban. and rural crime, NCJ-
99535. 12185 The risk of violent crime, NCJ-97119, 5/85 The economic cost of crime to Victims. NCJ-
93450,4/84 Family violence. NCJ·93449, 4184
BJS bulletinS: Households touched by crime. 1 965,
NCJ-l01685,6186 Criminal victimization, 1984, NCJ-98904. 10185 The crime of rape, NCJ-96777, 3/65 Household burglary, NCJ-96021, 1/85 Criminal victimization, 1983, NCJ-93869, 6/84 Violent crime by strangers, NCJ-80829, 4/82 Crime and the elderly, NCJ-796 I 4. 1/82 Meaauring crime, NCJ-75710, 2/81
Serlos crimes: Report of a field test (BJS technical report). NCJ-I04615. 4/87
Crime and older Americans Information package, NCJ.l04569. $10 domestic, 5/87 LifeUmo likelihood of victimization, (BJS tech
OIcal report), NCJ-I 04274,3/87 Teenage victims, NCJ.l03138. 12/86 Response to screerllng questions In the National
CrimI! Survey (BJS techmcal report). NCJ-97624.7/85
Victimization and fear of crime: World perspectives, NCJ.93872. 1/85
The National Crime Survey: Working papers. vol. I: Current and historical perspecllves, NCJ-75374,8/82 vol. Ii: Methological studies, NCJ.90307. 12/84
Issues In tho moasurement of vlctimlzaUon, NCJ.74682,10/81
The cost 01 negligence: Losses from preventable household burglaries. NCJ-53527. 12179
Rape victimization In 26 American cities, NCJ-55878.8179
Criminal vlctlmltation In urban schools, NCJ.56396, 8179
An IntroductIon to the National Crime Survey, NCJ.43732,4178
Local victim surveys: A review 01 the issues. NCJ-39973,8177
expenditure and employment BJS bulla/ins:
1985, NCJ. 1 04460. 3/87
Justice expenditure and employment: 1983, NCJ-l01776, 7186 1982, NCJ-96327,8/85
Justice expenditure and employment In the U.S.: 1980 and 1981 extracts, NCJ-96oo7, 6/85 1971-79, NCJ-92598, 11/84
See order form on last page
Corrections BJS bulletins and special reporls:
Prisoners In 1986, NCJ-l04864, 5/87 Imprisonment in four countries, NCJ-103967.
2/87 Probation and parole, NCJ.l03683. 1/87 Population density In State prisons, NCJ.l 03204,
12/86 Capital punishment, 1985, NCJ.l 02742. 11/86 State and Federal prisoners, 1925-65,
NCJ.l02494,11/86 Prison admission and releases, 1963,
NCJ-loo582, 3/86 Capital punishment 1984, NCJ-96399, 8/85 Examining recidivism, NCJ-96501. 2/85 Returning to prison, NCJ-957oo. 11/84 Time served In prison, NCJ-93924. 6184
Historical corrections statistics in tho U.S., 1650-1964, NCJ-l02529, 4/87
Prisoners In State and Federal Institutions on Oec. 31, 1984, NCJ-l03768. 3/87
Capital punishment 1964 (final). NCJ.99562. 5186 Capital punishment 1983 (final), NCJ.99561. 4/86 1979 survey of inmates 01 Sfate correclionalfacililias snd 1979 consus of Stale corrections/lacilities: BJS special reports:
The prevalence of imprisonment, NCJ-93657. 7/85
Career patterns In crime, NCJ-68672. 6/63
BJS bulletins: Prisoners and drugs, NCJ·87575. 3/63 Prisoners and alcohol, NCJ-B6223, 1/83 Prisons and prisoners, NCJ.80697. 2/82 Veterans In prison. NCJ-79232, 11/81
Census of /ails and survey of jail inmates: Jail Inmates, 1984, NCJ.l0l094. 5/86 Jail Inmates, 1983 (BJS bullellO), NCJ-99175.
11/85 Tho 1963 jail census (BJS bulletin). NCJ-95536.
11/84 Census of jails, 1978: Data lor indiVidual Jails.
vols. HV. Northeast, North Central. South. West. NCJ-72279-72282, 12/81
Profile of jaHlnmates, 1978. NCJ.65412. 2/81
Parole and probation I3JS bulletins:
Probation and parole 1965, NCJ.l03683 1/87 Setting prison terms, NCJ-76218, 6/83
Recidivism 01 young parolees (BJS special report). NCJ.104916. 5/87
Parole In the U.S., 1 gOO and 1981, NCJ-87387,3/86
Characteristics of persons entering parole during 1978 and 1979, NCJ-87243. 5/63
Characteristics of the parole population, 1978, NCJ-66479,4/81
Children in custody: Public juvenile facilities, 1985 (bulletin).
NCJ-l 02457, 10/86 1962-83 census of JUvenile detention and
correctional facilities, NCJ-l01686, 9/86
Courts BJS bulletins:
The growth of appeals: 1973·83 trends, NCJ.96381. 2/85
Case filings in State courts 1 983, NCJ-95111. 10/84
BJS special reports. Felony cas&'processlng time, NCJ.l 01985.8/86 Felony sentencing In 18 local
Jurisdictions, NCJ-97681. 6/85 The prevalence of guilty pleas, NCJ.96018,
12/84 Sentencing practices In 13 States, NCJ-95399.
10/84 Criminal defense systems: A national
survey, NCJ.94630. 8/84 Habea s corpus, NCJ-92948. 3/84 State court case load statistics, 1977 and
I J81, NCJ-87587.2/83 National criminal delense systems stUdy,
NCJ-94702. 10/88 The prosecution of telony arrests:
1981, NCJ-l01380, 9/86. $7.60 domesticl$9.20 Canadlan/$12,:/0 foreign
1980, NCJ.97684 , 10/85 1979, NCJ-88482,5/84
State court model statlsllcal dictionary, Supplement, NCJ.96326, 9/85 1 st edition, NCJ.6~320, 9/80
Stllte court organ/Zillion 1980, NCJ.76711, 7/82
vU.S. G.P.O. 1987-181-478,60008
Privacy and security Computer crime: BJS special reporls:
Electronic fund transfer fraud, NCJ-96666, 3/85 Electronic fund transfer and crime,
NCJ.92650. 2{84 Electronic lund transfer systems fraud,
NCJ-loo461,4/86 Computer security techniques,
NCJ-84049, 9/82 Electronic fund transfer systems and crime,
NCJ-83736. 9/82 Expert witness manual. NCJ.77927. 9/81 Criminal Justice resource manual, NCJ-61550.
12(79
Privacy and security of criminal history Information: Compendium of State legislation: 1984 overview, NCJ-98077. 9/85 Criminal jusllce Information policy:
Automated tlngerprlntldentiflcation systems: Technology and policY Issues, NCJ.l04342. 4/87
Criminal justice "hor' files. NCJ-l01850. 12/66 Data quality policies and procedures:
Proceedings of a BJSISEARCH conference, NCJ-l01849,12/86
Crime control and criminal records (BJS speCial report). NCJ-99176, 10/85
State criminal records repositories (rus lechnical report). NCJ-99017. 10/85
Data quality of criminal history records, NCJ-98079. 10/85
Intelligence and investigative records, NCJ-95787. 4/85
Victimlwltness legislation: An overview, NCJ-94365. 12/84
Information policY and crime control strategies (SEARCHl13JS conlerence), NCJ-93926. 10/84
Research access to criminal justice data, NCJ.84154, 2/83
Privacy and juvenile justice records, NCJ.84152.1183
Survey of State laws (BJS bulietin), NCJ-80836, 6/82
Privacy and the private employer, NCJ-79651.11/Bl
Federal offenses and offenders BJS speCial reports:
Sentencing and time served: Federaloffensas and offenders, NCJ-l 0 1 043,5/87
Pretr/al release and misconduct, NCJ-96132, 1/85
BJS bulletins: Federal civil justice statistics, NCJ-l04769,
5/87 Bank robbery, NCJ-94463, 8/84 Federal drug law violators, NCJ-92692, 2184 Federal justice statistics. NCJ-80814. 3/82
General BJS bulletins and special reporls:
BJS telephone contacts '87, NCJ.l02909. 12/86 Tracking Offenders: Whlt~coliar crime,
NCJ.l 02867, 11/86 Police employment and expenditure,
NCJ-l00117,2/86 Tracking Offenders: The child victim. NCJ-
95785, 12/84 The severity of crime, NCJ-92326, 1/84 The American response to crime: An overview
of criminal justice systems, NCJ-91936. 12183 Tracking offenders, NCJ-91572, 11/83 Victim and witness assistance: New State
laws and the system's response, NCJ·87934. 5/83
Publications of B,IS. 1971-84: A topical bibliography, T8030012. 10/86, $17.50 domestic
BJS PUblications: Selected library In microfiche. 1971·84, PR030012, 10/86. $203 domestic 1986 directory of automated criminal justice
Information systems, rJCJ-l02260, 1/87, $20 domestiC
Crime and Justice lacts, 1985, NCJ-loo757. 5/86 Nallonal survey of crime severlly, NCJ-96017,
10/85 Criminal victimization of District of Columbia
residents and Capitol HIli employees, 1982-83, NCJ-97982; Summary, NCJ.98567, 9/85
DC household Victimization survey data base: Study Implementation, NCJ.98595. $7.60 Documentation, NCJ-98596, $6.40 User manual, NCJ-98597, $8.20
How to gain access to BJS data (brochure). BC-000022. 9/84
Report to the nation on crime and justice: Tho data, NCJ-87068, 10/83
III I =
To be added to any BJS mailing list, copy or cut out this page, fill it in and mail it to:
Justice Statistics Clearinghouse/NCJRS U.S. Department of Justice User Services Department 2 o If the mailing label below is
correct, check here and do not Box 6000
fill in name and address. Rockville, MD 20850
Name:
Title:
Organiza tion:
Street or box:
City, State, Zip.:
Daytime phone number:
Interest in criminal justice (or organization and title if you put home address above):
PLE._.sE PUT ME ON THE MAILING LIST FOR:
o
o o
o
o
Justice expenditure and employment reports-annual spending and staffing by Federal/State/local governments and by fur 'tion (police, courts, etc.)
Computer crime reports--electronic fund transfer system crimes
Privacy and security of criminal history information and information policy--new legislation; maintaining and releasing intelligence and investigative records; data quality issues
Federal statistics-data descl'ibing Federal case processing, from investigation through prosecution, adjudication, and corrections
Juvenile corrections reports-juveniles in custody in public and private detention and correctional facilities
o BJS bulletins and special reports--timely reports of the most current justice data
o Courts reports--State court caseload surveys, model annual State reports, State court organization surveys
o Corrections reports--results of sample surveys and censuses of jails, prisons, parole, probation, and othel' corrections data
o National Crime Survey reports--the on.IY regular national survey of crime victims
o Sourcebook of Criminal Justice Statistics (annual)-broad-based data from 150+ sources (400+ tables, 100+ figures, index)
D Send me a form to sign up for NIJ Reports (issued free 6 times a year), which abstracts both private and government criminal justice publications and lists conferences and training sessions in the field.
You will receive an annual renewal card. If you do not return it, we must drop you from the mailing list.
11
u.s. Department of Justice
Bureau of Justics Statistics
Official Business Penalty for Private Use $300 BULK RATE
POSTAGE & FEES PAID DOJ/BJS
Permit No. 0.91
Washington, D.C 20531
Bulletin
£