Embed Size (px)
Citation preview

Prison Conditions, Capital Punishment,and Deterrence
Lawrence Katz, Harvard University and National Bureau of Economic
Research, Steven D. Levitt, University of Chicago and American Bar
Foundation, and Ellen Shustorovich, City University of New York
Previous research has attempted to identify a deterrent effect of capital punishment. We
argue that the quality of life in prison is likely to have a greater impact on criminal
behavior than the death penalty. Using state-level panel data covering the period
1950±90, we demonstrate that the death rate among prisoners (the best available
proxy for prison conditions) is negatively correlated with crime rates, consistent with
deterrence. This finding is shown to be quite robust. In contrast, there is little
systematic evidence that the execution rate influences crime rates in this time period.
1. Introduction
For more than two decades the deterrent effect of capital punishment has
been the subject of spirited academic debate. Following Ehrlich (1975), a
number of studies have found evidence supporting a deterrent effect of the
death penalty (Cloninger, 1977; Deadman and Pyle, 1989; Ehrlich, 1977;
Ehrlich and Liu, 1999; Layson, 1985; Mocan and Gittings, 2001). A far larger
set of studies have failed to ®nd deterrent effects of capital punishment (e.g.,
Avio, 1979, 1988; Bailey, 1982; Cheatwood, 1993; Forst, Filatov, and
Klein, 1978; Grogger, 1990; Leamer, 1983; Passell and Taylor, 1977).1
Although only one small piece of the broader literature on the issue of
We would like to thank Austan Goolsbee for comments and criticisms. The National
Science Foundation provided ®nancial support.
Send correspondence to: Steven Levitt, Department of Economics, University of
Chicago, 1126 E. 59th Street, Chicago, IL 60637; E-mail: [email protected].
1. See Cameron (1994) for a survey of econometric studies of capital punishment.
American Law and Economics Review Vol. 5 No. 2,#American Law and Economics Association 2003; all rights reserved. DOI: 10.1093/aler/ahg014
318
deterrence, in the minds of many, the question of capital punishment is
inextricably linked to the validity of deterrence.
The great majority of the empirical studies of the deterrent effect of capital
punishment have examined U.S. data from the twentieth century.2 The lim-
ited implementation of capital punishment in this period presents a serious
impediment to empirical analysis. Between 1946 and 1997 there were a total
of 1,885 executions, representing one execution for every 320 reported
homicides. Between 1968 and 1976 no executions were performed. Since
1976 execution rates have remained low: approximately one execution per
1,000 homicides. In Texas, the state with the highest execution rate, only one
in 300 murders was punished by death between 1976 and 1997. Even if a
substantial deterrent effect does exist, the amount of crime rate variation
induced by executions may simply be too small to be detected. Assuming a
reduction of seven homicides per execution (a number consistent with Ehr-
lich, 1975), observed levels of capital punishment in Texas since 1976 (a total
of 144 executions through 1997) would have reduced the annual number of
homicides in Texas by about ®fty, or 2% of the overall rate. Given that the
standard deviation in the annual number of homicides in Texas over this same
time period is over 200, it is clearly a dif®cult challenge to extract the
execution-related signal from the noise in homicide rates.
The empirical focus on deterrent effects of the death penalty, at least as
currently practiced in the United States, also appears to be misplaced from a
theoretical perspective. In 1997 seventy-four prisoners were executed Ð the
highest total in thirty years. At the end of 1997 there were 3,335 inmates
under a sentence of death, meaning that approximately 2% of those on death
row were executed. Even among the subset of those eventually put to death,
there is a long lag between sentencing and execution. Given the high discount
rates of many criminals (Wilson and Herrnstein, 1985) and the fact that many
homicides are committed by individuals under the in¯uence of alcohol or
drugs, which further foreshorten time horizons, it is hard to believe that
punishment with such a long delay would be effective. Furthermore, the
execution rate on death row is only twice the death rate from accidents and
violence among all American men, and is only slightly greater than the rate of
accidental and violent death for black males between the ages of 15 and 34.
2. Avio (1979, 1988), Deadman and Pyle (1989), and Phillips (1980) are notable
exceptions.
Prison Conditions and Deterrence 319

Among the subsample of individuals engaged in illegal activities, the death
rates are likely to be much higher. Levitt and Venkatesh (2000) report a death
rate of 7% annually for street-level drug sellers in the gang they analyze.
Kennedy, Piehl, and Braga (1996) estimate violent death rates to be 1%±2%
annually among all gang members in Boston. With these ®gures, it is hard to
believe that in modern America the fear of execution would be a driving force
in a rational criminal's calculus.
Given these arguments, it seems plausible that the quality of life in prisons
might exert a far more important effect on criminal behavior than the death
penalty. The lower the quality of life in prison, the greater the punishment for
a ®xed amount of time served.3 Thus, poor prison conditions are likely to be a
deterrent to crime. Unlike capital punishment, prison conditions affect all
inmates, regardless of the crime committed. Also, unlike capital punishment,
the rarity of which makes it dif®cult to accurately estimate the likelihood of
implementation, knowledge of prison conditions among potential criminals
is likely to be accurate, either because of personal experience or that of
acquaintances.
It is also possible that poor prison conditions will lead to more crime rather
than less. Murton (1976) and Selke (1993), for instance, argue that poor
prison conditions have a dehumanizing effect on inmates, arousing greater
bitterness and hostility towards society, which manifest themselves as
increased rates or severity of deviant behavior upon release from prison.
Poor conditions may also serve to elevate the level of violence in prisons,
which may in turn inhibit the reassimilation of released prisoners into general
society.
In this article we provide the ®rst rigorous empirical estimates of the
relationship between prison conditions and crime rates. Lacking a direct
measure of prison conditions, we use the death rate (from all causes)
among prisoners in a given state and year as a proxy for prison conditions.4
3. The television show 60 Minutes clearly believes in the deterrent effect of bad prison
conditions. Mike Wallace introduced a report on the subject as follows: `̀ If there are
very young children in the room with you watching 60 Minutes tonight, we caution you
that this next story is not for them. But if you've got a teenage son there in the room
with you, this is a story you should watch together. It is about the cruel and unusual
punishment a young man like your son may have to endure if he gets locked up.''
4. Although we have explored numerous other potential proxies for prison conditions,
we have been unable to locate consistent data series for any other variables. Information on
320 American Law and Economics Review V5 N2 2003 (318±343)

It is likely that prison death rates correlate with many important aspects of the
relative unpleasantness of the prison experience. Inadequate health care, the
subject of many recent lawsuits, is likely to be the most important factor in
determining death rates among prisoners.5
Even after controlling for imprisonment rates in a state, severity of punish-
ment per crime, and a host of other factors, our empirical results using state-
level data over the period 1950±90 suggest a strong and robust negative
relationship between prison death rates and subsequent crime rates in a state.
These estimates appear to be too large to be attributable to the fact that a
prisoner who dies will never be released, thus lowering the overall pool of
criminals. Therefore, we interpret our results as evidence in favor of deter-
rence. The ®ndings are robust to the inclusion of a range of demographic
covariates, state ®xed-effects, state-level trends, region±year interactions,
and state±decade interactions. An alternative explanation for our results is
that states that become better at identifying and locking up the most serious
offenders experience both higher prison death rates (assuming that these
serious offenders are more likely to die or to kill other prisoners) and
decreases in crime (because scarce prison resources are being used more
effectively). Given the data available to us, we cannot rule out this competing
hypothesis. Variation in the age distribution of prisoners, on the other hand,
does not appear to be a plausible explanation for our ®ndings. Given the life
cycle of criminal involvement, prison systems with a high number of old
offenders are likely to be using prison resources inef®ciently. Controlling for
the number of prisoners, which we do, crime is therefore likely to be higher in
states with more older prisoners, as are prisoner death rates, biasing our
estimates against ®nding deterrence.
In contrast to the results on prison death, we ®nd little systematic
evidence supporting a deterrent effect of capital punishment. Estimates of
the coef®cient on executions are extremely sensitive to the choice of controls
and invariably estimated with little precision. There simply does not appear
expenditures for health care, the degree of overcrowding, and attacks on prisoners are
available only in sporadic cross sections by prison systems voluntarily reporting such
information. Breakdowns of overall prison death rates by cause are available only in
recent years.
5. Homicide and suicide are relatively infrequent prison occurrences (a total of
between 200 and 300 occurrences in a typical year). Nonetheless these causes of death
outnumber executions roughly three to one.
Prison Conditions and Deterrence 321

to be enough information in the data on capital punishment to reliably
estimate a deterrent effect.
We cannot stress enough that evidence of a deterrent effect of poor prison
conditions is neither a necessary nor a suf®cient condition for arguing that
current prison conditions are either overly benign or unjusti®ably inhumane.
Ef®ciency arguments related to deterrence are only one small aspect of an
issue that is inextricably associated with basic human rights, constitution-
ality, and equity considerations. Our research is descriptive, not proscriptive.
The outline of the paper is as follows: Section 2 describes the data set.
Section 3 presents the empirical estimates. Section 3 also considers exten-
sions to the basic model and explores alternative explanations for our empiri-
cal ®ndings. Section 4 contains a brief set of conclusions, focusing on the
important social and moral questions that are raised in this study but not
directly addressed in the empirical analysis. A description of our data sources
is presented in the Appendix.
2. Data and the Empirical Model
The data used in this study are a panel of annual, state-level observations
covering the continental United States for the time period 1950±90 and
collected by the authors from the various publicly available sources detailed
in the accompanying data Appendix. We begin our analysis in 1950, since
this is the ®rst year in which many of the data series become available.
Summary statistics for the data are presented in Table 1.
We employ three different crime rates as dependent variables in our
analysis: murder, violent crime (excluding rape), and property crime
(excluding larceny). In all cases we rely on Uniform Crime Report
(UCR) data on crimes reported to the police as our measure of crime.6
Rape is excluded because data was not collected until 1957. Larceny is
omitted because of important changes in its de®nition over the time period
examined. Although there are well-recognized problems with UCR data
(Donohue and Seigelman, 1996; O'Brien, 1985), it is the only crime data
that is available at the level of geographic disaggregation required. If the
6. As is commonly done in the literature, we simply sum the number of reported
crimes across the individual crime categories that comprise violent and property crime.
Thus, each reported crime is given an equal weight, regardless of the crime's severity.
322 American Law and Economics Review V5 N2 2003 (318±343)
measurement error in UCR data is simply random noise, our coef®cient
estimates will be less precise, but still consistent, since crime rates are
used as the dependent variable. To the extent that we obtain similar results
exploiting different sources of variation in the data (e.g., with or without state
trends or region-year interactions), the likelihood that measurement error can
account for our results is diminished.
The explanatory variables of primary interest are the execution rate and
the death rate among prisoners from all sources other than execution. We
de®ne both of these rates per 1,000 state prisoners. The prison death variable
will pick up not only direct deterrent effects associated with an increased
likelihood of death while one is in prison, but also differences in prison
conditions and quality of life for prisoners more generally. Data limitations
prevent including more direct measures of prison conditions, such as square
footage per prisoner, amount of prisoner-prisoner or guard-prisoner vio-
lence, or health care expenditures per prisoner. For most of the time period
examined, no further disaggregation of causes of prison death is available. In
recent years the cause of death is available. In 1997, for instance, 77% of
prison deaths were due to illness, 5% were suicides, 3% were due to accident
or killing by another inmate, 2% were executions (although these are not
included in our variable de®nition), and 12% were due to unspeci®ed causes.
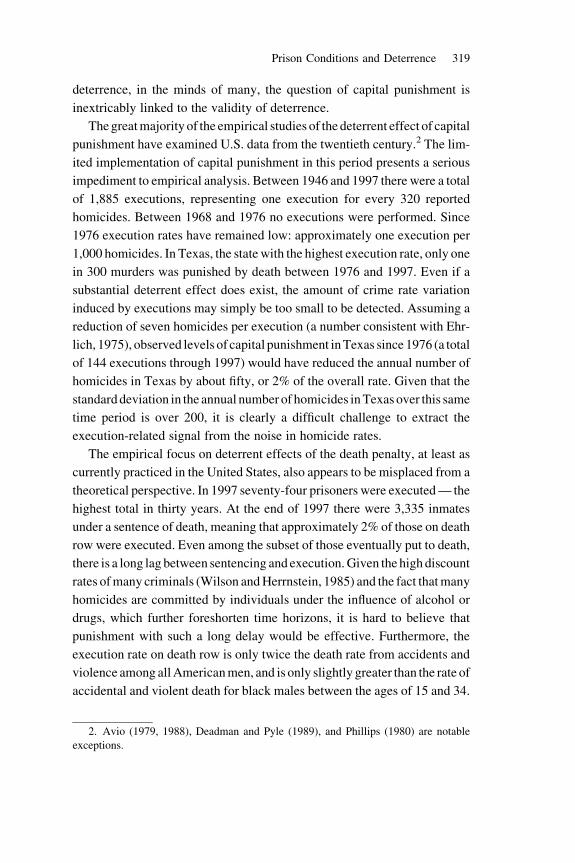
Table 1. Summary Statistics
Variable Mean SD Minimum Maximum
Property crime per 100,000 residents 1,380 735 193 3,586
Violent crime per 100,000 residents 356 255 7 1,186
Murder per 100,000 residents 7.3 3.8 0 20.7
Prison deaths per 1,000 prisoners 3.10 1.64 0 32.53
Executions per 1,000 prisoners 0.11 0.35 0 12.5
Prisoners per crime (ÿ1) 0.095 0.057 0.010 0.408
Prisoners per 100,000 residents (ÿ1) 126.0 63.8 20.3 463.9
Real per capita income 13,724 3,846 4,114 26,146
Insured unemployment rate 3.37 1.62 0.5 12.2
Deaths under 1 yr. per 100,000 live births 1,830 721 622 5,659
Black (%) 0.11 0.08 0 0.45
Urban (%) 0.72 0.14 0.27 0.92
0±24-year-olds (%) 0.42 0.04 0.31 0.58
25±44-year-olds (%) 0.27 0.03 0.20 0.36
Note: The unit of observation is a state-year pair. 1,844 observations. Data cover the years 1950 to 1990,except for 1971, which is missing. Means and standard deviations are weighted by the state's share of
the nation's population. Data sources are described in the Appendix.
Prison Conditions and Deterrence 323

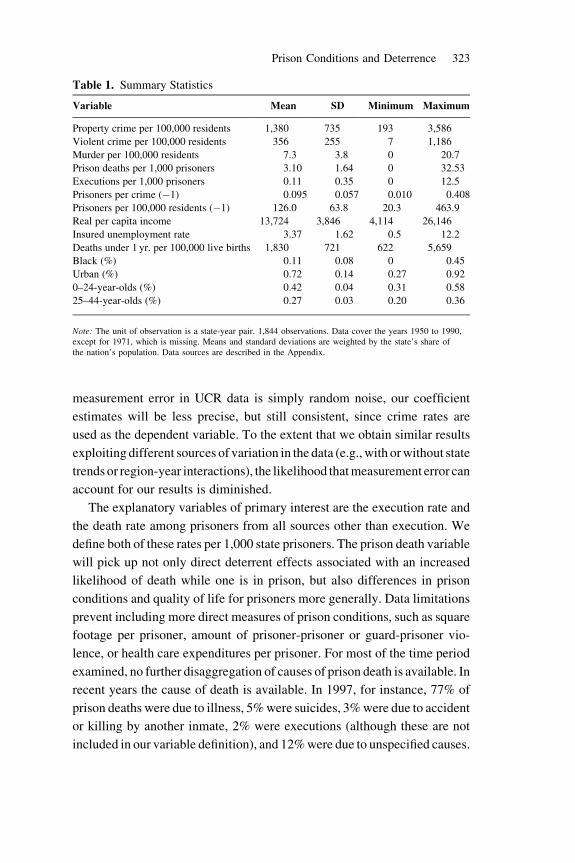
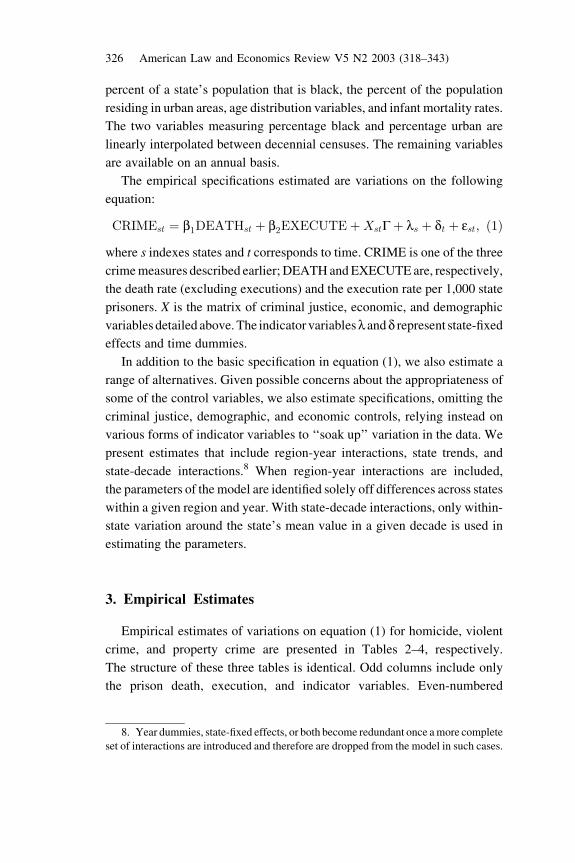
Figures 1 and 2 present regional time-series data on prison death rates and
execution rates.7 Prison death rates generally followed a downward trend
between 1950 and 1990 across all regions of the country. The exception to
this pattern is the late 1980s in the Northeast, where there is a large spike in
prison death, largely attributable to Acquired Immune De®ciency Syndrome
(AIDS). Average rates of prisoner death are similar across regions for most of
the period. The time series data on executions reveals a very different pattern:
high rates early in the sample (particularly in the South), and very low rates in
all regions of the country later on.
In addition to the prisoner death and execution rates, a range of criminal
justice, economic, and demographic variables are also included in our ana-
lysis. The certainty and severity of a state's criminal justice system is proxied
by two variables: the number of prisoners per violent crime and ratio of
prisoners to state population. These two measures are problematic because of
the possibility they are endogenously related to state crime rates. For
Figure 1. Prison death rate by region.
7. The regression estimates we present do not exploit the aggregate time-series
variation presented in Figures 1 and 2. Because year dummies and state-®xed effects are
included in all speci®cations, our parameters are identi®ed with use of only within-state
deviations from national trends.
324 American Law and Economics Review V5 N2 2003 (318±343)

instance, in states where crime rates have recently declined for exogenous
reasons, the stock of prisoners will tend to be large relative to the ¯ow of
crimes, inducing a spurious negative relationship between crime rates and
prisoners per violent crime. A bias in the opposite direction is likely for
prisoners per state resident. Places with high crime rates will tend to have a
larger fraction of residents incarcerated, ceteris paribus. One way in which
we attempt to address this problem is to use once-lagged values of the
criminal justice variables as regressors. This avoids any contamination
of the measures by contemporaneous shocks to crime. Using lags also
reduces the likelihood that ratio-bias problems associated with having
crime rates in the denominator of a right-hand-side variable. More generally,
our research strategy for minimizing the concerns associated with imperfect
controls is to present a wide range of speci®cations exploiting different
sources of variation in the data. To the extent that our main ®ndings are
robust, our level of con®dence in the estimates increases.
The economic measures are real state per capita income and the insured
unemployment rate. We use the insured unemployment rate rather than the
overall unemployment rate because the latter is not available at the state level
in the early part of our sample. Over time periods in which both measures are
available, they are highly correlated. Demographic controls include the
Figure 2. Execution rate by region.
Prison Conditions and Deterrence 325
percent of a state's population that is black, the percent of the population
residing in urban areas, age distribution variables, and infant mortality rates.
The two variables measuring percentage black and percentage urban are
linearly interpolated between decennial censuses. The remaining variables
are available on an annual basis.
The empirical speci®cations estimated are variations on the following
equation:
CRIMEst � b1DEATHst � b2EXECUTE�XstG� ls � dt � est, �1�where s indexes states and t corresponds to time. CRIME is one of the three
crime measures described earlier; DEATH and EXECUTE are, respectively,
the death rate (excluding executions) and the execution rate per 1,000 state
prisoners. X is the matrix of criminal justice, economic, and demographic
variables detailed above. The indicator variables l and d represent state-®xed
effects and time dummies.
In addition to the basic speci®cation in equation (1), we also estimate a
range of alternatives. Given possible concerns about the appropriateness of
some of the control variables, we also estimate speci®cations, omitting the
criminal justice, demographic, and economic controls, relying instead on
various forms of indicator variables to `̀ soak up'' variation in the data. We
present estimates that include region-year interactions, state trends, and
state-decade interactions.8 When region-year interactions are included,
the parameters of the model are identi®ed solely off differences across states
within a given region and year. With state-decade interactions, only within-
state variation around the state's mean value in a given decade is used in
estimating the parameters.
3. Empirical Estimates
Empirical estimates of variations on equation (1) for homicide, violent
crime, and property crime are presented in Tables 2±4, respectively.
The structure of these three tables is identical. Odd columns include only
the prison death, execution, and indicator variables. Even-numbered
8. Year dummies, state-®xed effects, or both become redundant once a more complete
set of interactions are introduced and therefore are dropped from the model in such cases.
326 American Law and Economics Review V5 N2 2003 (318±343)
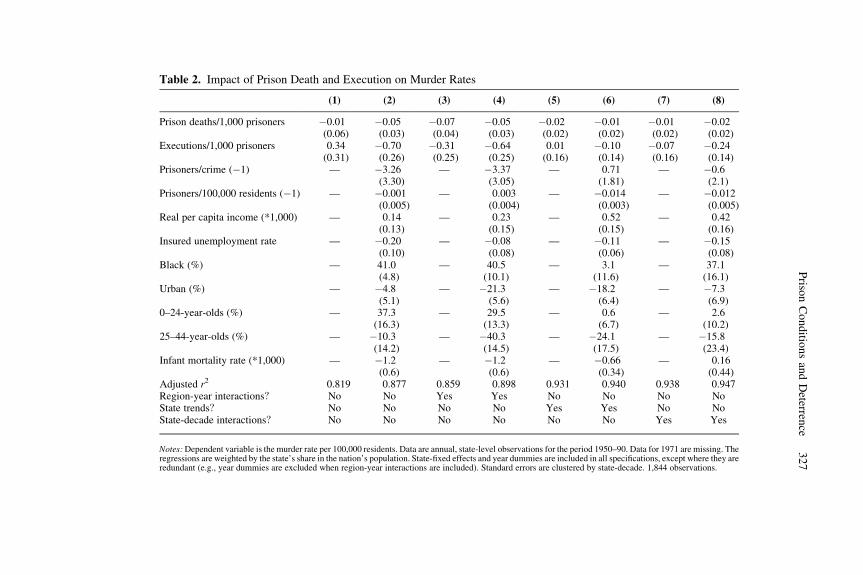
Table 2. Impact of Prison Death and Execution on Murder Rates
(1) (2) (3) (4) (5) (6) (7) (8)
Prison deaths/1,000 prisoners ÿ0.01(0.06)
ÿ0.05(0.03)
ÿ0.07(0.04)
ÿ0.05(0.03)
ÿ0.02(0.02)
ÿ0.01(0.02)
ÿ0.01(0.02)
ÿ0.02(0.02)
Executions/1,000 prisoners 0.34(0.31)
ÿ0.70(0.26)
ÿ0.31(0.25)
ÿ0.64(0.25)
0.01(0.16)
ÿ0.10(0.14)
ÿ0.07(0.16)
ÿ0.24(0.14)
Prisoners/crime (ÿ1) Ð ÿ3.26(3.30)
Ð ÿ3.37(3.05)
Ð 0.71(1.81)
Ð ÿ0.6(2.1)
Prisoners/100,000 residents (ÿ1) Ð ÿ0.001(0.005)
Ð 0.003(0.004)
Ð ÿ0.014(0.003)
Ð ÿ0.012(0.005)
Real per capita income (*1,000) Ð 0.14(0.13)
Ð 0.23(0.15)
Ð 0.52(0.15)
Ð 0.42(0.16)
Insured unemployment rate Ð ÿ0.20(0.10)
Ð ÿ0.08(0.08)
Ð ÿ0.11(0.06)
Ð ÿ0.15(0.08)
Black (%) Ð 41.0(4.8)
Ð 40.5(10.1)
Ð 3.1(11.6)
Ð 37.1(16.1)
Urban (%) Ð ÿ4.8(5.1)
Ð ÿ21.3(5.6)
Ð ÿ18.2(6.4)
Ð ÿ7.3(6.9)
0±24-year-olds (%) Ð 37.3(16.3)
Ð 29.5(13.3)
Ð 0.6(6.7)
Ð 2.6(10.2)
25±44-year-olds (%) Ð ÿ10.3(14.2)
Ð ÿ40.3(14.5)
Ð ÿ24.1(17.5)
Ð ÿ15.8(23.4)
Infant mortality rate (*1,000) Ð ÿ1.2(0.6)
Ð ÿ1.2(0.6)
Ð ÿ0.66(0.34)
Ð 0.16(0.44)
Adjusted r2 0.819 0.877 0.859 0.898 0.931 0.940 0.938 0.947Region-year interactions? No No Yes Yes No No No NoState trends? No No No No Yes Yes No NoState-decade interactions? No No No No No No Yes Yes
Notes: Dependent variable is the murder rate per 100,000 residents. Data are annual, state-level observations for the period 1950±90. Data for 1971 are missing. Theregressions are weighted by the state's share in the nation's population. State-®xed effects and year dummies are included in all speci®cations, except where they areredundant (e.g., year dummies are excluded when region-year interactions are included). Standard errors are clustered by state-decade. 1,844 observations.
Priso
nC
on
ditio
ns
and
Deterren
ce3
27
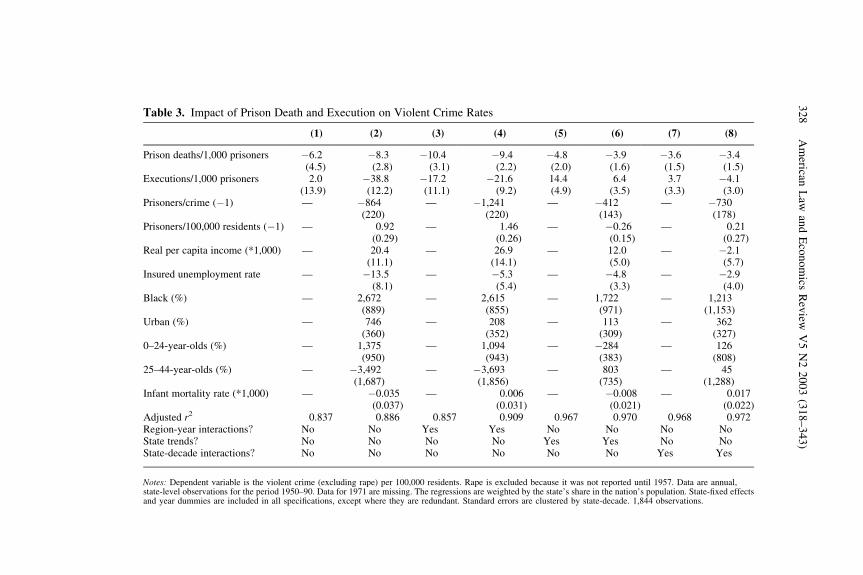
Table 3. Impact of Prison Death and Execution on Violent Crime Rates
(1) (2) (3) (4) (5) (6) (7) (8)
Prison deaths/1,000 prisoners ÿ6.2(4.5)
ÿ8.3(2.8)
ÿ10.4(3.1)
ÿ9.4(2.2)
ÿ4.8(2.0)
ÿ3.9(1.6)
ÿ3.6(1.5)
ÿ3.4(1.5)
Executions/1,000 prisoners 2.0(13.9)
ÿ38.8(12.2)
ÿ17.2(11.1)
ÿ21.6(9.2)
14.4(4.9)
6.4(3.5)
3.7(3.3)
ÿ4.1(3.0)
Prisoners/crime (ÿ1) Ð ÿ864(220)
Ð ÿ1,241(220)
Ð ÿ412(143)
Ð ÿ730(178)
Prisoners/100,000 residents (ÿ1) Ð 0.92(0.29)
Ð 1.46(0.26)
Ð ÿ0.26(0.15)
Ð 0.21(0.27)
Real per capita income (*1,000) Ð 20.4(11.1)
Ð 26.9(14.1)
Ð 12.0(5.0)
Ð ÿ2.1(5.7)
Insured unemployment rate Ð ÿ13.5(8.1)
Ð ÿ5.3(5.4)
Ð ÿ4.8(3.3)
Ð ÿ2.9(4.0)
Black (%) Ð 2,672(889)
Ð 2,615(855)
Ð 1,722(971)
Ð 1,213(1,153)
Urban (%) Ð 746(360)
Ð 208(352)
Ð 113(309)
Ð 362(327)
0±24-year-olds (%) Ð 1,375(950)
Ð 1,094(943)
Ð ÿ284(383)
Ð 126(808)
25±44-year-olds (%) Ð ÿ3,492(1,687)
Ð ÿ3,693(1,856)
Ð 803(735)
Ð 45(1,288)
Infant mortality rate (*1,000) Ð ÿ0.035(0.037)
Ð 0.006(0.031)
Ð ÿ0.008(0.021)
Ð 0.017(0.022)
Adjusted r2 0.837 0.886 0.857 0.909 0.967 0.970 0.968 0.972Region-year interactions? No No Yes Yes No No No NoState trends? No No No No Yes Yes No NoState-decade interactions? No No No No No No Yes Yes
Notes: Dependent variable is the violent crime (excluding rape) per 100,000 residents. Rape is excluded because it was not reported until 1957. Data are annual,state-level observations for the period 1950±90. Data for 1971 are missing. The regressions are weighted by the state's share in the nation's population. State-®xed effectsand year dummies are included in all speci®cations, except where they are redundant. Standard errors are clustered by state-decade. 1,844 observations.
32
8A
merican
Law
and
Eco
no
mics
Rev
iewV
5N
22
00
3(3
18
±3
43
)

Table 4. Impact of Prison Death and Execution on Property Crime Rates
(1) (2) (3) (4) (5) (6) (7) (8)
Prison deaths/1,000 prisoners ÿ14.0(8.1)
ÿ11.4(7.6)
ÿ17.1(7.7)
ÿ12.5(6.5)
ÿ12.6(8.2)
ÿ2.0(5.7)
ÿ13.7(6.8)
ÿ9.2(5.3)
Executions/1,000 prisoners 25.5(30.2)
ÿ33.0(23.9)
ÿ28.4(21.3)
ÿ35.5(20.0)
92.3(25.2)
11.0(13.6)
19.4(11.6)
ÿ9.1(10.3)
Prisoners/crime (ÿ1) Ð ÿ1,819(580)
Ð ÿ1,702(531)
Ð ÿ964(382)
Ð ÿ1,521(536)
Prisoners/100,000 residents (ÿ1) Ð 1.53(0.65)
Ð 1.90(0.57)
Ð ÿ1.77(0.54)
Ð ÿ1.49(0.78)
Real per capita income (*1,000) Ð 32.8(25.1)
Ð 38.9(29.5)
Ð ÿ61.8(21.9)
Ð ÿ58.0(27.9)
Insured unemployment rate Ð 39.4(18.0)
Ð 44.5(16.9)
Ð 30.5(10.4)
Ð 23.7(12.7)
Black (%) Ð 1,119(1,754)
Ð 1,534(1,819)
Ð 12,853(2,650)
Ð 4,592(3,639)
Urban (%) Ð ÿ26(937)
Ð ÿ1,043(971)
Ð ÿ2,961(1,197)
Ð 491(1,078)
0±24-year-olds (%) Ð 5,784(2,117)
Ð 5,261(2,065)
Ð 2,327(1,227)
Ð 3,040(2,099)
25±44-year-olds (%) Ð ÿ4,662(3,370)
Ð ÿ2,020(3,486)
Ð ÿ8,281(3,347)
Ð ÿ7,116(3,736)
Infant mortality rate Ð ÿ0.262(0.108)
Ð ÿ0.089(0.067)
Ð ÿ0.121(0.065)
Ð ÿ0.090(0.073)
Adjusted r2 0.888 0.907 0.920 0.933 0.938 0.959 0.960 0.967Region-year interactions? No No Yes Yes No No No NoState trends? No No No No Yes Yes No NoState-decade interactions? No No No No No No Yes Yes
Notes: Dependent variable is the property crime rate (excluding larceny) per 100,000 residents. Larceny is excluded because of changes in its de®nition over the
sample period. Data are annual, state-level observations for the period 1950±90. Data for 1971 are missing. The regressions are weighted by the state's share of thenations's population. State-®xed effects and year dummies are included in all speci®cations, except where they are redundant. Standard errors are clustered by
state-decade. 1,844 observations.
Priso
nC
on
ditio
ns
and
Deterren
ce3
29
columns include a full set of criminal justice, economic, and demographic
covariates, in addition to a varying set of indicator variables. Columns (1) and
(2) of each table contain the basic speci®cation with year dummies and state
®xed-effects. Additional controls are included in the other columns, as indi-
cated at the bottom of each table. In all cases, the method of estimation is
weighted least squares, with the weight equal to the share of the U.S. popula-
tion residing in the state. The parameter estimates are not, however, sensitive
to this choice of weighting. White-heteroskedasticity-consistent standard
errors (clustered by state-decade to take into account within-state serial
correlation) are reported in parentheses.
Table 2 presents estimates with homicide as the dependent variable. In all
cases a very large fraction of the overall variation in homicide rates is
explained by the regressions. The coef®cient on prison death is negative
in all eight speci®cations, is precisely estimated, and varies over a relatively
small range. In contrast, the execution rate coef®cient is extremely sensitive
to the choice of speci®cation and has estimated standard errors ®ve to ten
times larger than those for prison death. Evaluated at the mean of the data, the
implied decline in homicides associated with one additional prison death
ranges fromÿ0.1 toÿ0.8 across speci®cations.9 For executions, the range is
� 3.1 to ÿ5.6. The largest of these estimates for capital punishment is not
substantially different from the estimate in Ehrlich (1975). The variability of
the estimated effects of capital punishment across speci®cations is consistent
with the sensitivity of the ®ndings in the previous literature to the choice of
functional form (Cameron, 1994; Forst, Filatov, and Klein, 1978).
Evaluated at the means of the data, the implied elasticity of the murder rate
to the prison death rate ranges from ÿ0.005 to ÿ0.048. The corresponding
elasticity for execution is essentially zero (the largest estimated magnitude of
this elasticity isÿ0.00015). There are simply so few executions that, even if
there is a large effect per execution, a doubling of the execution rate would
not have a noticeable impact on murder rates.
The performance of the other variables in Table 2 are mixed. Adding the
covariates to the speci®cation (i.e., comparing even and odd columns)
9. The coef®cients in the table are in terms of rates. To translate the coef®cient into
an effect per death, one must multiply the coef®cient by (state residents/state prisoners)/
100. It is necessary to divide by 100 because the dependent variable is de®ned per
100,000 residents, whereas the death rates are per 1,000 prisoners. Evaluated at the
means of our data reported in Table 1, the adjustment factor is equal to 8.73.
330 American Law and Economics Review V5 N2 2003 (318±343)

explains only a small amount of variance, particularly after the more com-
plete set of interactions are added to the speci®cations in columns (5)±(8).
Theory predicts negative coef®cients on prisoners per crime and prisoners
per 100,000 residents. This prediction is generally borne out in the data, but
not uniformly. As would be expected, given the bias stories presented earlier,
the addition of better controls leads the prisoners-per-crime variable back
towards zero, whereas the prisoners-per-capita variable becomes increas-
ingly negative. The economic variables enter with a counterintuitive sign.
High income is consistently associated with high murder rates (see Ruhm,
2000, for a similar ®nding), as are low unemployment rates. Murder rates are
higher when the percentage black is high and lower, suprisingly, in highly
urbanized states, once other factors are controlled for. The age and infant
mortality variables are not statistically signi®cant once the full set of controls
are introduced.
The results for violent crime are presented in Table 3. The coef®cient on
prison death is now negative and statistically signi®cant at the .05 level in
almost all cases. Both the magnitude of the coef®cient and the standard error
fall as better controls are introduced. Evaluated at the mean of the data, each
additional prison death is associated with a decline of 30±98 violent crimes.
The implied elasticity of violent crime with respect to prison death ranges
from ÿ0.05 to ÿ0.17 across speci®cations. The magnitudes of the crime
reduction are too large to simply re¯ect the elimination of future crimes by
the deceased. Estimates of the number of reported crimes reduced per addi-
tional prisoner-year of incapacitation are generally no greater than ten
(Levitt, 1996; Marvell and Moody, 1994). Thus, it appears that poor prison
conditions, as proxied by prison death rates, have a deterrent effect on
criminal activity.
In contrast to prison death, there is no apparent effect of executions on
violent crime. The execution coef®cient is extremely sensitive to the choice
of speci®cation and takes on a positive sign as frequently as a negative sign.
The estimated change in violent crimes per execution, evaluated at the mean,
ranges from approximately ÿ300 to 100. The lack of a systematic relation-
ship between violent crime and execution is not, however, particularly
surprising, since neither robbery nor aggravated result are capital crimes.
Violent crime rates appear to be negatively related to the incarceration
likelihood per crime, a result that is consistent with deterrence. States with
more prisoners overall tend to have more violent crime in speci®cations
Prison Conditions and Deterrence 331

without state trends or state-decade interactions. Once these controls are
added (columns [6] and [8]), however, this result disappears, strongly sug-
gesting that the presence of omitted factors is driving this result. Economic
factors appear to be fairly weakly associated with violent crime. This mirrors
previous empirical work that ®nds strong business cycle effects on property
crime, but not on violent crime (e.g., Freeman, 1995). The fraction of black
and urban residents exhibits a positive association with violent crime across
all speci®cations. The fraction of the population under age 25 is positively
related to crime rates only in speci®cations with a limited set of controls.
The pattern of estimates for property crimes, presented in Table 4, is
almost identical to that for violent crimes. Once again the coef®cient on
prison death is negative, although statistically signi®cant in only a few
speci®cations. The estimated reduction in property crimes per prison
death (20 to 150) is roughly comparable to that for violent crime. Since
property crime is roughly ®ve times as frequent as violent crime, however,
the implied elasticities are smaller for property crime. The coef®cient on
executions is again extremely sensitive to the choice of speci®cation and is
equally likely to be positive or negative. Both the number of prisoners per
crime and the number of prisoners per resident are negatively related to
property crime once state trends or state-decade interactions are included.
High unemployment rates are associated with higher property crime across
all speci®cations. A one percentage point increase in the unemployment rate
is associated with roughly a 2%±4% increase in property crime rates. The
percentage black and fraction under age 25 are also correlated with higher
property crime rates in most speci®cations. Higher infant mortality rates are
associated with lower property crime rates, although we do not have a good
explanation why this should be the case.
4. Extensions to the Basic Model and AlternativeExplanations for the Empirical Results
Our basic results are consistent with a deterrent effect of prison death rates
(presumably proxying for prison conditions more generally) on crime. In this
section we examine the sensitivity of this result to different sets of assump-
tions and also explore possible alternative explanations for the empirical
regularities we observe.
332 American Law and Economics Review V5 N2 2003 (318±343)

In Table 5 we present speci®cations allowing for prison death and execu-
tion rates to have both contemporaneous and lagged effects on crime rates.
Theoretically, lagged prison death rates might be expected to in¯uence
current crime rates if (1) there are lags in information transmission about
prison conditions to those not incarcerated, (2) bad prison conditions lower
the likelihood that current inmates will recidivate after their release, or (3)
bad prison conditions interfere with reassimilation into society. For each
crime category two columns of results are presented, one with state trends
and the other with state-decade interactions. The full set of year dummies and
criminal justice, economic, and demographic characteristics are included in
all speci®cations, but are not shown in the table. The odd (or even) columns of
Table 5 therefore mirror column (6) (or [8]) of Tables 2±4, except that three
lags of the death and execution rates are added.
The ®rst two columns of Table 5 examine murder. There is little evidence
of systematic effects. The sign on the individual coef®cients is highly vari-
able for both prison death and execution. The joint impact of the coef®cients
is presented in the bottom portion of the table. The prison death coef®cients
are jointly positive, but not signi®cant at the .05 level in column (2). For
executions, even though the contemporaneous effect on murder is negative,
the lagged values are generally positive, and the overall impact is not
statistically signi®cant.
The results for violent and property crimes are in columns (3)±(4) and (5)±
(6), respectively. The contemporaneous and lagged effects of prison death
are negative in virtually every instance. Past prison death rates appear to exert
an independent in¯uence on current crime rates, with the magnitude of the
impact eroding over time. The crime reduction associated with a prison death
two to three years ago is roughly half as large as for a prison death in the
current period.10 The individual prison death variables are not statistically
signi®cant, but they are borderline jointly statistically signi®cant in most
cases, as shown in the bottom portion of the table. The cumulative effect of
the prison death variables is greater than the corresponding coef®cient on
contemporaneous prison death in Tables 3 and 4 in all cases. In contrast, there
is little evidence that execution rates affect violent or property crime in Table 5.
10. Inclusion of further lags yielded coef®cients that were substantively small and
statistically insigni®cant.
Prison Conditions and Deterrence 333

Tab
le5.
Lag
ged
Imp
acts
of
Pri
son
Dea
than
dE
xec
uti
on
Mu
rder
Vio
len
tC
rim
eP
rop
erty
Cri
me
(1)
(2)
(3)
(4)
(5)
(6)
Pri
son
dea
ths/
1,0
00
pri
son
ers
ÿ0.0
16
(0.0
17)ÿ0
.016
(0.0
18)ÿ2
.90
(1.2
8)ÿ3
.27
(1.4
4)ÿ1
.03
(4.9
0)
ÿ8.2
9(4
.98)
Pri
son
dea
ths/
1,0
00
pri
son
ers
(ÿ1
)0.0
10
(0.0
15)
0.0
22
(0.0
17)ÿ2
.58
(1.3
0)ÿ2
.45
(1.8
4)ÿ3
.74
(3.7
6)ÿ1
0.0
2(4
.09)
Pri
son
dea
ths/
1,0
00
pri
son
ers
(ÿ2
)ÿ0
.002
(0.0
17)
0.0
15
(0.0
22)ÿ2
.35
(2.1
7)ÿ2
.26
(2.7
2)ÿ1
.93
(4.3
9)
ÿ6.0
9(4
.07)
Pri
son
dea
ths/
1,0
00
pri
son
ers
(ÿ3
)0.0
27
(0.0
21)
0.0
46
(0.0
23)ÿ1
.23
(1.0
5)ÿ3
.27
(1.4
4)
3.8
8(3
.06)
ÿ2.9
7(3
.44)
Ex
ecu
tio
ns/
1,0
00
pri
son
ers
ÿ0.1
32
(0.1
30)ÿ0
.257
(0.1
42)
5.3
2(3
.23)ÿ3
.37
(2.8
8)
8.4
8(1
1.7
7)ÿ6
.39
(10.3
2)
Ex
ecu
tio
ns/
1,0
00
pri
son
ers
(ÿ1
)0
.115
(0.0
93)
0.0
40
(0.0
91)
8.3
1(2
.87)
0.3
5(3
.09)
14.3
8(1
0.9
5)
1.7
5(9
.24)
Ex
ecu
tio
ns/
1,0
00
pri
son
ers
(ÿ2
)0.0
33
(0.1
15)ÿ0
.052
(0.1
08)
5.5
6(2
.61)ÿ0
.89
(3.0
1)
16.6
6(1
1.7
9)
8.6
7(1
0.7
8)
Ex
ecu
tio
ns/
1,0
00
pri
son
ers
(ÿ3
)0
.035
(0.0
93)
0.0
13
(0.0
78)
8.7
8(2
.73)
3.4
5(3
.91)
10.6
0(1
1.9
1)
1.6
4(1
3.1
4)
Yea
rd
um
mie
s;d
emo
gra
phic
,
eco
no
mic
,an
dso
cio
eco
no
mic
cov
aria
tes
Yes
Yes
Yes
Yes
Yes
Yes
Sta
te-f
ixed
effe
cts?
Yes
No
Yes
No
Yes
No
Sta
te-t
ren
ds?
Yes
No
Yes
No
Yes
No
Sta
te-d
ecad
ein
tera
ctio
ns?
No
Yes
No
Yes
No
Yes
Su
mo
fp
riso
nd
eath
coef
fici
ents
0.0
19
(0.0
34)
0.0
67
(0.0
49)ÿ9
.06
(4.5
6)ÿ1
1.2
5(7
.71)ÿ2
.82
(12.6
1)ÿ2
7.3
7(1
3.7
0)
Su
mo
fex
ecu
tio
nco
effi
cien
ts0
.051
(0.2
94)ÿ0
.256
(0.2
60)
27.9
7(9
.21)ÿ0
.46
(15.9
0)
50.1
2(3
9.2
5)
5.6
7(4
0.0
9)
Ad
just
edr2
0.9
40
0.9
47
0.9
70
0.9
72
0.9
59
0.9
67
Not
es:
Dep
enden
tvar
iable
sar
epro
per
tycr
ime
rate
(excl
udin
gla
rcen
y),
vio
lent
crim
era
te(e
xcl
udin
gra
pe)
and
murd
erra
teper
100,0
00
resi
den
ts.
Lar
ceny
isex
cluded
bec
ause
of
chan
ges
init
sde®
nit
ions
over
the
sam
ple
per
iod.
Rap
eis
excl
uded
bec
ause
itw
asnot
report
edunti
l1957.
Dat
aar
ean
nual
,st
ate-
level
obse
rvat
ions
for
the
per
iod
1950±90.
Dat
afo
r1971
are
mis
sing.
The
regre
ssio
ns
are
wei
ghte
dby
the
stat
e's
shar
ein
the
nat
ion's
popula
tion.
Sta
ndar
der
rors
are
clust
ered
by
stat
e-dec
ade.
1,7
78
obse
rvat
ions.
334 American Law and Economics Review V5 N2 2003 (318±343)

In Table 6 the sample is split into time periods using 1971, a year for
which we do not have data, as the break point. In addition to splitting our
data roughly in half, 1971 is a logical choice because the early 1970s mark
the transition from a period of stable prison populations to the steadily
increasing number of prisoners that continues through the present time.
In all cases a full set of controls, including state trends, are included in
the regressions. With the exception of murder rates, the prison death coef®-
cients are stable across the two time periods. Interestingly, the prison death
rate coef®cients from the split sample with state trends are more similar to the
estimates from the overall sample when state-decade interactions are
included than when state trends are present. This suggests that the assumption
of a constant linear trend across the entire period is not consistent with the
patterns in the data. The execution patterns are dramatically different in the
two parts of the sample. In the early period the execution coef®cients are
relatively small, negative, and precisely estimated. In the latter years the
coef®cients are ten times larger in magnitude, as are the standard errors. The
standard errors rise because so few executions are performed in the latter
period. There is also a great deal of instability in the other covariates included
in the speci®cations, with the signs often reversing across the two time
periods. The fraction of the population aged 25 to 44 enters with the expected
sign and statistical signi®cance in all of the speci®cations except one.
The speci®cations considered thus far assume a linear relationship
between crime rates and prison death rates. Table 7 presents estimates
with crime rates (but not prison death or execution rates) logged.11 This
functional form implies that a given change in the prison death rate will lead
to a greater change in the number of crimes when the crime rate is high. The
eight columns in Table 7 correspond to the columns in Tables 2±4. Coef®-
cients are presented for only the prison death and execution variables, with
separate rows for the three different crime categories. The results are similar
to those of previous tables. The prison death coef®cients are consistently
negative and sometimes statistically signi®cant for violent and property
crime, and are mixed for murder. Evaluated at the sample means, the implied
elasticities of violent (property) crime with respect to prison death rates are as
high as ÿ0.06 (ÿ0.05). These values are similar in magnitude to those
11. Prison death and execution rates are frequently equal to zero and thus cannot be
logged.
Prison Conditions and Deterrence 335

Table 6. Impact of Prison Death and Execution by Time Period
1950±70 1972±90
Property Crime (1) Violent Crime (2) Murder (3) Property Crime (4) Violent Crime (5) Murder (6)
Prison deaths/1,000 prisoners ÿ7.82(3.57)
ÿ2.57(1.17)
0.008(0.024)
ÿ6.65(4.33)
ÿ1.9(1.3)
ÿ0.015(0.026)
Executions/1,000 prisoners ÿ4.61(8.75)
ÿ1.60(2.10)
ÿ0.105(0.121)
ÿ66.6(169.5)
11.68(33.70)
ÿ1.15(0.78)
Prisoners/crime (ÿ1) ÿ1019(448)
ÿ323(126)
0.7(2.2)
ÿ5,322(1,060)
ÿ2,186(504)
ÿ8.7(9.3)
Prisoners/100,000 residents (ÿ1) 1.18(1.07)
ÿ0.20(0.34)
ÿ0.015(0.008)
ÿ0.29(0.70)
0.46(0.25)
ÿ0.013(0.006)
Real per capita income (*1,000) 36.3(24.3)
16.8(10.6)
0.59(0.19)
ÿ94.1(25.3)
ÿ10.8(6.1)
0.83(0.23)
Insured unemployment rate ÿ3.88(8.89)
ÿ4.99(3.88)
ÿ0.012(0.065)
9.77(13.72)
ÿ11.62(4.44)
ÿ0.22(0.10)
Black (%) 42,532(10,989)
11,077(4,191)
ÿ41.0(52.6)
ÿ6,122(5,936)
ÿ5,417(3,887)
ÿ25.6(56.4)
Urban (%) ÿ7(815)
247(361)
ÿ12.1(8.2)
ÿ2,898(2,141)
399(886)
ÿ2.3(25.5)
0±24-year-olds (%) ÿ960(1,495)
ÿ1,214(704)
ÿ0.5(10.4)
ÿ1,365(2,109)
ÿ3,648(1,509)
ÿ26.6(28.2)
25±44-year-olds (%) 6,215(5,364)
4,385(2,059)
62.5(38.5)
7,613(4,065)
4,237(1,837)
ÿ44.1(37.8)
Infant mortality rate ÿ0.070(0.053)
ÿ0.017(0.017)
ÿ0.0006(0.0004)
0.091(0.110)
0.074(0.032)
0.0014(0.0007)
Adjusted r2 0.958 0.922 0.939 0.958 0.976 0.943State-trends? Yes Yes Yes Yes Yes Yes
Notes: Dependent variables are property crime rate (excluding larceny), violent crime rate (excluding rape), and murder rate per 100,000 residents. Larceny is excluded because ofchanges in its de®nition over the sample period. Rape is excluded because it was not reported until 1957. Data are annual, state-level observations. The regressions are weighted by
the state's share in the nation's population. State-®xed effects and year dummies are included in all speci®cations. Standard errors are clustered by state-decade. 36 observations incolumns 1±3, 904 observations in columns 4±6.
33
6A
merican
Law
and
Eco
no
mics
Rev
iewV
5N
22
00
3(3
18
±3
43
)

Table 7. Impact of Prison Death and Execution on Crime Rates in Logs
(1) (2) (3) (4) (5) (6) (7) (8)
Violent crime ratePrison deaths/1,000 prisoners ÿ0.009
(0.010)ÿ0.010(0.007)
ÿ0.019(0.008)
ÿ0.016(0.006)
ÿ0.014(0.027)
ÿ0.009(0.004)
ÿ0.007(0.005)
ÿ0.007(0.004)
Executions/1,000 prisoners 0.139(0.048)
ÿ0.019(0.032)
ÿ0.017(0.031)
ÿ0.001(0.032)
0.066(0.027)
ÿ0.006(0.013)
0.038(0.029)
ÿ0.010(0.015)
Property crime ratePrison deaths/1,000 prisoners ÿ0.010
(0.006)ÿ0.005(0.004)
ÿ0.010(0.005)
ÿ0.005(0.003)
ÿ0.011(0.005)
ÿ0.004(0.003)
ÿ0.008(0.004)
ÿ0.006(0.004)
Executions/1,000 prisoners 0.083(0.024)
0.008(0.015)
ÿ0.014(0.015)
ÿ0.005(0.013)
0.093(0.021)
0.002(0.010)
0.035(0.014)
ÿ0.003(0.010)
Murder ratePrison deaths/1,000 prisoners 0.007
(0.009)0.002
(0.004)ÿ0.002(0.004)
0(0.004)
ÿ0.001(0.004)
0.001(0.003)
0.001(0.003)
ÿ0.001(0.003)
Executions/1,000 prisoners 0.139(0.043)
ÿ0.059(0.027)
ÿ0.009(0.025)
ÿ0.045(0.026)
0.027(0.023)
ÿ0.013(0.018)
0.013(0.025)
ÿ0.020(0.019)
Demographic covariates? No Yes No Yes No Yes No YesRegion-year interactions? No No Yes Yes No No No NoState trends? No No No No Yes Yes No NoState-decade interactions? No No No No No No Yes Yes
Notes: Dependent variables are crime rates per 100,000 residents. Data are annual, state-level observations for the period 1950±90. State-®xed effects andyear dummies are included in all speci®cations, except where they are redundant (e.g., year dummies are excluded when region-year interactions are included).The regressions are weighted by the state's share in the nation's population. Standard errors are clustered by state-decade.
Priso
nC
on
ditio
ns
and
Deterren
ce3
37
obtained in the earlier tables. The capital punishment coef®cient is once
again extremely sensitive to the choice of speci®cation and takes on a
positive sign roughly half of the time.
4.1. Alternative explantions for the negative relationship between prison
death rates and crime rates. We have argued that the negative association
between prison death rates and violent and property crime is an indication
that poor prison conditions (as proxied by death rates) serve as a deterrent to
crime. It is important, however, to give careful consideration to other possible
explanations for the empirical regularities that we observe.
One possibility is that the direction of causality runs in the opposite
direction (i.e., that low crime rates cause high prison death rates).12 For
instance, if current crime rates are low, the in¯ow of young prisoners
may be lessened, leading to an aging prison population with greater age-
related mortality. Although detailed information on the age of prison popu-
lations is not available on a state-by-state basis, we offer two arguments
against this hypothesis, arguments based on aggregate statistics. First, the
aged make up a very small fraction of prison populations. In 1991 only 0.7%
of state prison inmates were 65 years of age or older. In comparison, 12.6% of
Americans were at least 65 years of age in 1991. In the U.S. as a whole,
mortality rates for 70-year-old men are about 20 times higher than those of
30-year-old men. Assuming mortality rates by age in prison are proportional
to those on the outside, a doubling of the fraction of inmates over the age of 65
would induce a 6% increase in the prison death rate, or only one-tenth of a
standard deviation. Second, if the direction of causality runs from crime rates
to prison death rates, it is dif®cult to explain the systematic relationship
between lags of prison death and current crime rates in Table 5. Rather,
one would expect leads of prison death rates to be correlated with current
crime rates; that is, low crime in the current period should predict high prison
death rates in the future. When leads of prison death rates are added to the
speci®cations in Table 5, however, the coef®cients are substantively small,
frequently positive, and never jointly statistically signi®cant.
12. One might just as easily argue, however, that low crime rates would lead to
more pleasant prison conditions and reduced prison death rates. For example, prison
overcrowding is likely to be less acute in states where crime rates are falling.
338 American Law and Economics Review V5 N2 2003 (318±343)

Another explanation for our results might be that prison death rates are
correlated with other factors that affect crime but have been omitted from the
speci®cations, such as a state's effectiveness in identifying the most serious
offenders, or the degree of police brutality. State prison systems that are most
effective in identifying the worst offenders will have low crime rates and high
prison death rates, if the more serious offenders die (or kill) at greater rates
when imprisoned. The most likely channel through which more serious
offenders would have elevated death rates would be through increased
rates of violent death. Death at the hands of another prisoner, however, is
a relatively rare occurrence. Only about 5% of prison deaths in recent years
were murders. It is also possible, however, that death rates of serious offen-
ders are higher for other reasons, such as worse health as a result of past risky
behavior. The data available do not allow us to analyze prisoner death rates by
type of criminal.
Another possible explanation for our results is that a `̀ climate of oppres-
sion'' in a state may reduce crime, with high prison death rates representing
only one element of the oppression. In general, the fact that our prison death
estimates are not particularly sensitive to the choice of controls (including
two measures of criminal justice system punitiveness), argues against this
claim. Furthermore, the inclusion of state trends and state-decade interac-
tions `̀ soaks up'' long-term drifts in such variables. For these stories to hold
true, the omitted variables must be correlated with short-term ¯uctuations in
a state's prison death rate.
A ®nal alternative to our interpretation of the results is that ¯uctuations in
criminal health status are driving both prison death rates and crime rates,
under the assumption that unhealthy criminals commit fewer crimes. It is
hard to imagine, however, that short-term ¯uctuations in criminal health (as
opposed to changes in prison conditions, such as the degree of overcrowding
or the quality of health care) is the primary source of variation in prison
death rates.
5. Conclusion
Using annual state-level data for the period 1950±90, we uncover a robust
negative relationship between prison death rates and violent and property
crime rates. In contrast, there is little evidence in support of a deterrent effect
of capital punishment as presently administered. In terms of crimes reduced
Prison Conditions and Deterrence 339

per prison death, the estimated effects are quite large: 30±100 violent crimes
and a similar number of property crimes.
Although our estimates are large when measured in crimes per prison
death, in another sense, our results are small. The elasticities obtained,
generally smaller than .05, imply that a doubling of the prison death rate
would reduce the crime rate by only a few percentage points. Over the period
1950±90 reported crime rates rose sharply. The decline in prison death rates
between 1950 and 1990 explains only between 2% and 3% of the observed
increase in crime rates over that period.
Although there may be temptation to draw public policy implications
from our results, we strongly caution against doing so. As demonstrated in the
preceding paragraph, the aggregate impact of changing prison conditions on
crime rates appears to be small. Given the limited ef®ciency gains implied by
these estimates, the moral and ethical considerations surrounding these
issues would appear to dominate any economic arguments. In a society
predicated on civil liberties, the social costs of degrading living conditions
in prisons beyond their current state are likely to overwhelm any marginal
reductions in crime.
Without further analysis of the question, we also caution against extra-
polating our results to argue that the elimination of prison amenities such as
cable television and athletic facilities will prove a deterrent to crime.
Although that position is consistent with our ®ndings, it is by no means a
direct implication of our results. Substantial changes in prison death rates are
categorically different from minor alterations of the quality of life associated
with the removal of weight rooms. Before drawing any conclusions about the
latter, we would be prudent to compile evidence that is more directly relevant
to the issue.
Appendix
Crime rates. All crime rates are Uniform Crime Report (UCR) data on reported
crime rates from Crime in the United States, published annually by the Federal
Bureau of Investigation. Our measure of violent crime is the sum of reported
murders, aggravated assaults, and robberies. Data on forcible rape is not collected
until 1957 and therefore is excluded from our sample. Our measure of property
crimes is the sum of burglaries and motor vehicle thefts. Larcenies are excluded
from our calculations because of a de®nitional change in the 1960s.
340 American Law and Economics Review V5 N2 2003 (318±343)
Prisoner counts and prison death rates. Annual data on the number of prison-
ers and prison death rates by state for the period 1950±70 is published annually by
the Federal Bureau of Prisons under numerous different titles, but most frequently
as Prisoners in State and Federal Institutions. This data was collected by the Law
Enforcement Assistance Administration from 1971±79. For 1971, however, no
published data on prisoner death rates are available. Since 1980 the data has been
published annually by the U.S. Bureau of Justice Statistics in Correctional Popu-
lations in the United States. In some cases, our data is drawn from a secondary
source, Sourcebook of Criminal Justice Statistics, rather from the original docu-
ment.
Executions. Data on the number of state executions are compiled by the same
sources listed above for prisoner counts and prisoner death rates, but published in
separate reports originally entitled Executions and later called Capital Punishment.
Since 1980 the capital punishment data has been included in Correctional Popula-
tions in the United States.
State population. Available annually in The Statistical Abstract of the United
States.
Real per capita income. State per capita income is available annually in The
Statistical Abstract of the United States. Values are converted to real dollars using
the Consumer Price Index.
Insured unemployment rate. (This is the average number of workers claiming
state unemployment compensation bene®ts as a percent of all workers covered.)
The rate published in U.S. Department of Labor (1996).
Infant mortality. Death rates under one year of age per 100,000 live births is
annual state-level data from Vital Statistics of the United States.
State population, per capita income, percentage black, percentage urban, and
state age distributions. All of these data are available in the Statistical Abstract of the
United States. The percentage black and percentage urban are based on decennial
census data and are linearly interpolated between censuses.
References
Avio, Kenneth. 1979. `̀ Capital Punishment in Canada: A Time-Series Analysis of the
Deterrent Hypothesis,'' 12 Canadian Journal of Economics 647±76.
ÐÐÐ. 1988. `̀ Measurement Error and Capital Punishment,'' 20 Applied Economics
1253±62.
Bailey, William. 1982. `̀ Capital Punishment and Lethal Assaults against Police,'' 19
Criminology 608±25.
Cameron, Samuel. 1994. `̀ A Review of the Econometric Evidence on the Effects of
Capital Punishment,'' 23 Journal of Socio-Economics 197±214.
Cheatwood, Derral. 1993. `̀ Capital Punishment and the Deterrence of Violent Crime
in Comparable Counties,'' 18 Criminal Justice Review 165±81.
Prison Conditions and Deterrence 341
Cloninger, Dale. 1977. `̀ Deterrence and the Death Penalty: A Cross-Sectional
Analysis,'' 6 Journal of Behavioral Economics 87±107.
Deadman, D., and Donald Pyle. 1989. `̀ Homicide in England and Wales: A Time-
Series Analysis,'' Discussion Paper 102, Department of Economics, University of
Leicester.
Donohue, John J., and Peter Siegelman. 1996. `̀ Is the United States at the Optimal
Rate of Crime?'' Mimeo, American Bar Foundation.
Ehrlich, Isaac. 1977. `̀ Capital Punishment and Deterrence: Some Further Thoughts
and Evidence,'' 85 Journal of Political Economy 741±88.
ÐÐÐ. 1975. `̀ The Deterrent Effect of Capital Punishment: A Question of Life and
Death,'' 65 American Economic Review 397±417.
Ehrlich, Isaac, and Zhiqiang Liu. 1999. `̀ Sensitivity Analyses of the Deterrence
Hypothesis: Let's Keep the Econ in Econometrics,'' 17 Journal of Law and
Economics 455±88.
Federal Bureau of Investigation. Annual. Crime in the United States. Washington,
DC: U.S. Department of Justice.
Forst, Brian, Victor Filatov, and Lawrence Klein. 1978. `̀ The Deterrent Effect of
Capital Punishment: An Assessment of the Estimates,'' in Alfred Blumstein,
Daniel Nagin, and Janet Cohen, eds., Deterrence and Incapacitation: Estimating
the Effects of Criminal Sanctions on Crime Rates. Washington, DC: National
Academy of Sciences.
Freeman, Richard. 1995. `̀ The Labor Market,'' in James Q. Wilson and Joan
Petersilia, eds., Crime. San Francisco: ICS Press.
Grogger, Jeff. 1990. `̀ The Deterrent Effect of Capital Punishment: An Analysis of
Daily Homicide Counts,'' 85 Journal of the American Statistical Association
295±310.
Kennedy, David, Anne Piehl, and Anthony Braga. 1996. `̀ Youth Violence in Boston:
Gun Markets, Serious Youth Offenders, and a Use-Reduction Strategy,'' 59 Law
and Contemporary Problems 147±83.
Layson, Stephen. 1985. `̀ Homicide and Deterrence: A Reexamination of the United
States Evidence,'' 52 Southern Economic Journal 68±89.
Leamer, Edward. 1983. `̀ Let's Take the Con out of Econometrics,''73 American
Economic Review 31±43.
Levitt, Steven. 1996. `̀ The Effect of Prison Population Size on Crime Rates: Evidence
from Prison Overcrowding Litigation,'' 111 Quarterly Journal of Economics
319±52.
Levitt, Steven, and Sudhir Venkatesh. 2000. `̀ An Economic Analysis of a Drug-
Selling Gang's Finances,'' 115 Quarterly Journal of Economics 755±89.
Marvell, Thomas, and Carlisle Moody. 1994. `̀ Prison Population Growth and Crime
Reduction,'' 10 Journal of Quantitative Criminology 109±40.
Mocan, H. Naci, and R. Kaj Gittings. 2001. `̀ Pardons, Executions, and Homicide.''
National Bureau of Economics Working Paper 8639.
342 American Law and Economics Review V5 N2 2003 (318±343)
Murton, Thomas. 1976. The Dilemma of Prison Reform. New York: Holt, Rineheart,
and Winston.
O'Brien, Robert. 1985. Crime and Victimization Data. Beverly Hills, CA: Sage.
Passell, Peter, and John Taylor. 1977. `̀ The Deterrent Effect of Capital Punishment:
Another View,'' 67 American Economic Review 445±51.
Phillips, D. F. 1980. `̀ The Deterrent Effect of Capital Punishment: New Evidence on
an Old Controversy,'' 86 American Journal of Sociology 148±93.
Ruhm, Christopher. 2000. `̀ Are Recessions Good for Your Health?'' 115 Quarterly
Journal of Economics 617±50.
Selke, William. 1993. Prisons in Crisis. Bloomington: Indiana University Press.
U.S. Bureau of the Census. Annual. Statistical Abstract of the United States.
Washington, DC: U.S. Bureau of the Census.
ÐÐÐ. Annual. Vital Statistics of the United States. Washington, DC: U.S. Bureau of
the Census.
U.S. Bureau of Justice Statistics. Annual. Correctional Populations in the United
States. Washington, DC: U.S. Bureau of Justice Statistics.
ÐÐÐ. Annual. Sourcebook of Criminal Justice Statistics. Washington, DC: U.S.
Bureau of Justice Statistics.
U.S. Bureau of Prisons. Annual. Capital Punishment. Washington, DC: U.S. Bureau
of Prisons.
ÐÐÐ. Annual. Executions. Washington, DC:. U.S. Bureau of Prisons.
ÐÐÐ. Annual. Prisoners in State and Federal Institutions. Washington, DC: U.S.
Bureau of Prisons.
U.S. Department of Labor. 1996. ET Handbook 394: Unemployment Insurance
Financial Data, 1938±94. Washington, DC: Department of Labor.
Wilson, James Q., and Richard Herrnstein. 1985. Crime and Human Nature.
New York: Simon and Shuster.
Prison Conditions and Deterrence 343