Embed Size (px)
Citation preview
Measuring a Nation’s
Income
© 2013 Cengage Learning. All Rights Reserved. May not be copied, scanned, or duplicated, in whole or in part, except for use as
permitted in a license distributed with a certain product or service or otherwise on a password-protected website for classroom use.
Premium PowerPoint
Slides by Ron Cronovich2012 UPDATE
N. Gregory Mankiw
MacroeconomicsPrinciples of
Sixth Edition
10
© 2013 Cengage Learning. All Rights Reserved. May not be copied, scanned, or duplicated, in whole or in part, except for use as
permitted in a license distributed with a certain product or service or otherwise on a password-protected website for classroom use.
11
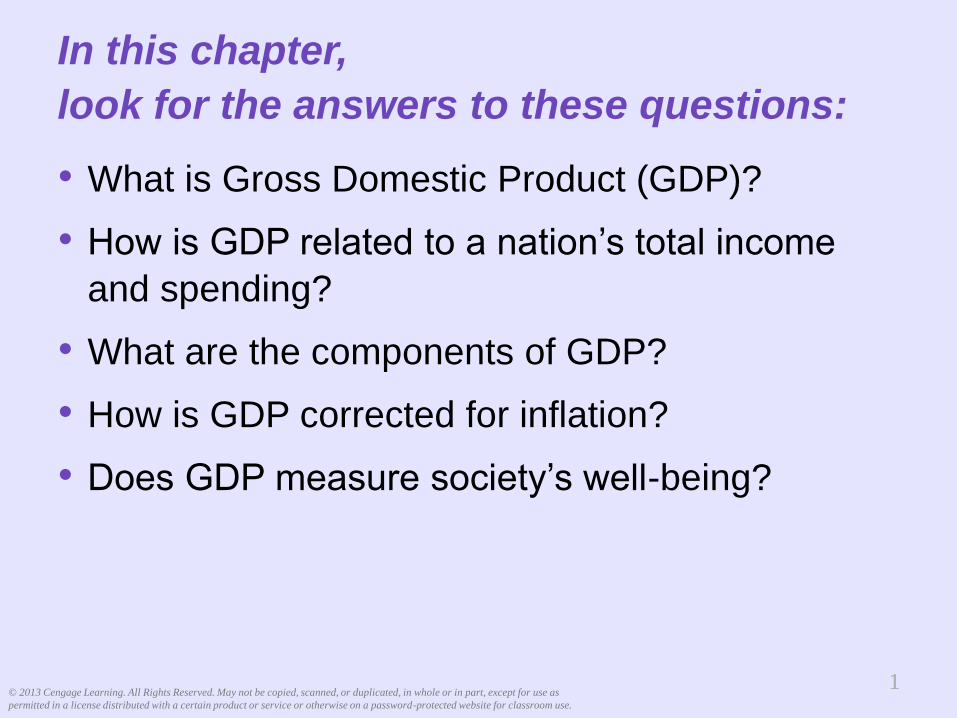
In this chapter,
look for the answers to these questions:
• What is Gross Domestic Product (GDP)?
• How is GDP related to a nation’s total income
and spending?
• What are the components of GDP?
• How is GDP corrected for inflation?
• Does GDP measure society’s well-being?
© 2013 Cengage Learning. All Rights Reserved. May not be copied, scanned, or duplicated, in whole or in part, except for use as
permitted in a license distributed with a certain product or service or otherwise on a password-protected website for classroom use.
22
Warm up
How do you know if an
economy is doing well?
© 2013 Cengage Learning. All Rights Reserved. May not be copied, scanned, or duplicated, in whole or in part, except for use as
permitted in a license distributed with a certain product or service or otherwise on a password-protected website for classroom use.
33
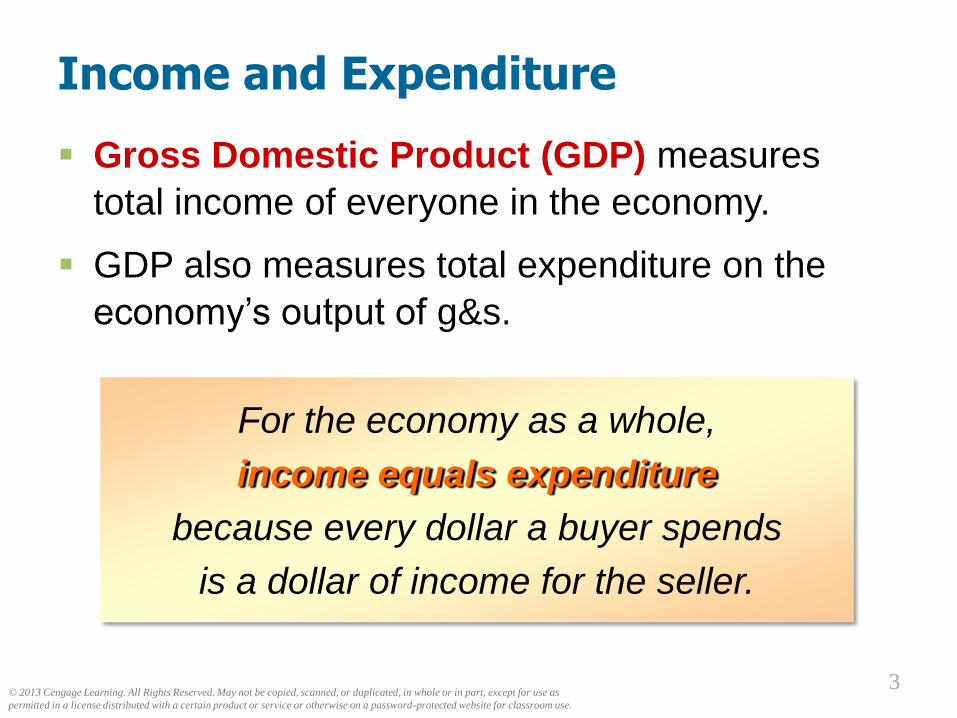
Income and Expenditure
Gross Domestic Product (GDP) measures
total income of everyone in the economy.
GDP also measures total expenditure on the
economy’s output of g&s.
For the economy as a whole,
income equals expenditure
because every dollar a buyer spends
is a dollar of income for the seller.

© 2013 Cengage Learning. All Rights Reserved. May not be copied, scanned, or duplicated, in whole or in part, except for use as
permitted in a license distributed with a certain product or service or otherwise on a password-protected website for classroom use.
44
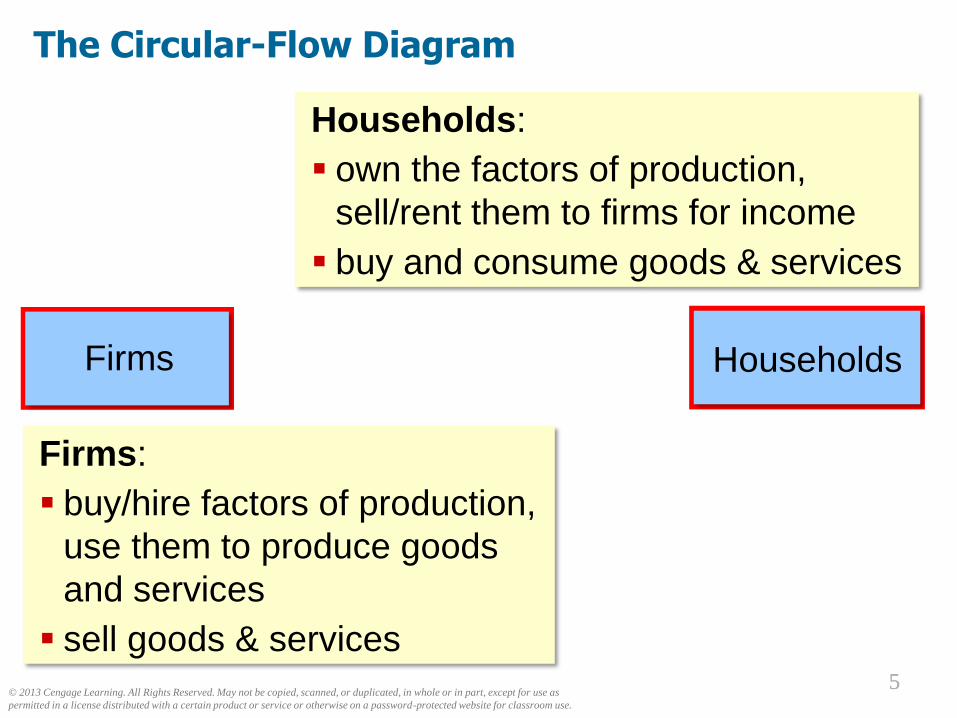
The Circular-Flow Diagram
a simple depiction of the macroeconomy
illustrates GDP as spending, revenue,
factor payments, and income
Preliminaries:
Factors of production are inputs like labor,
land, capital, and natural resources.
Factor payments are payments to the factors
of production (e.g., wages, rent).
© 2013 Cengage Learning. All Rights Reserved. May not be copied, scanned, or duplicated, in whole or in part, except for use as
permitted in a license distributed with a certain product or service or otherwise on a password-protected website for classroom use.
55
The Circular-Flow Diagram
Households:
own the factors of production,
sell/rent them to firms for income
buy and consume goods & services
HouseholdsFirms
Firms:
buy/hire factors of production,
use them to produce goods
and services
sell goods & services

© 2013 Cengage Learning. All Rights Reserved. May not be copied, scanned, or duplicated, in whole or in part, except for use as
permitted in a license distributed with a certain product or service or otherwise on a password-protected website for classroom use.
66
The Circular-Flow Diagram
Markets for
Factors of
Production
HouseholdsFirms
Income (=GDP)Wages, rent, profit (=GDP)
Factors of production
Labor, land, capital
Spending (=GDP)
G & S bought
G & S sold
Revenue (=GDP)Markets for
Goods &
Services
© 2013 Cengage Learning. All Rights Reserved. May not be copied, scanned, or duplicated, in whole or in part, except for use as
permitted in a license distributed with a certain product or service or otherwise on a password-protected website for classroom use.
77
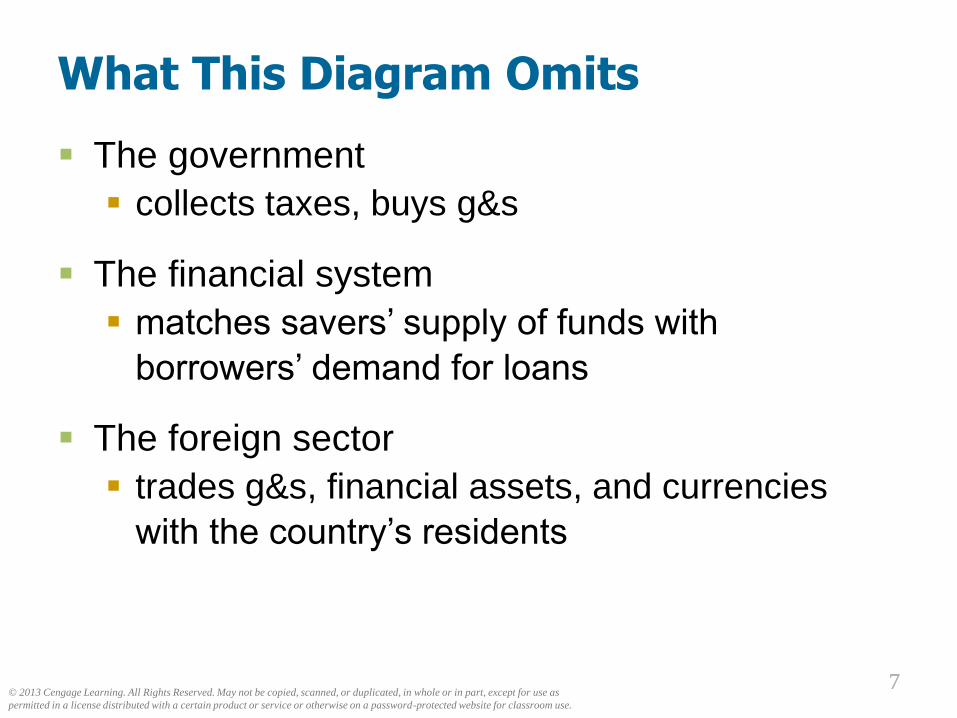
What This Diagram Omits
The government
collects taxes, buys g&s
The financial system
matches savers’ supply of funds with
borrowers’ demand for loans
The foreign sector
trades g&s, financial assets, and currencies
with the country’s residents
© 2013 Cengage Learning. All Rights Reserved. May not be copied, scanned, or duplicated, in whole or in part, except for use as
permitted in a license distributed with a certain product or service or otherwise on a password-protected website for classroom use.
88
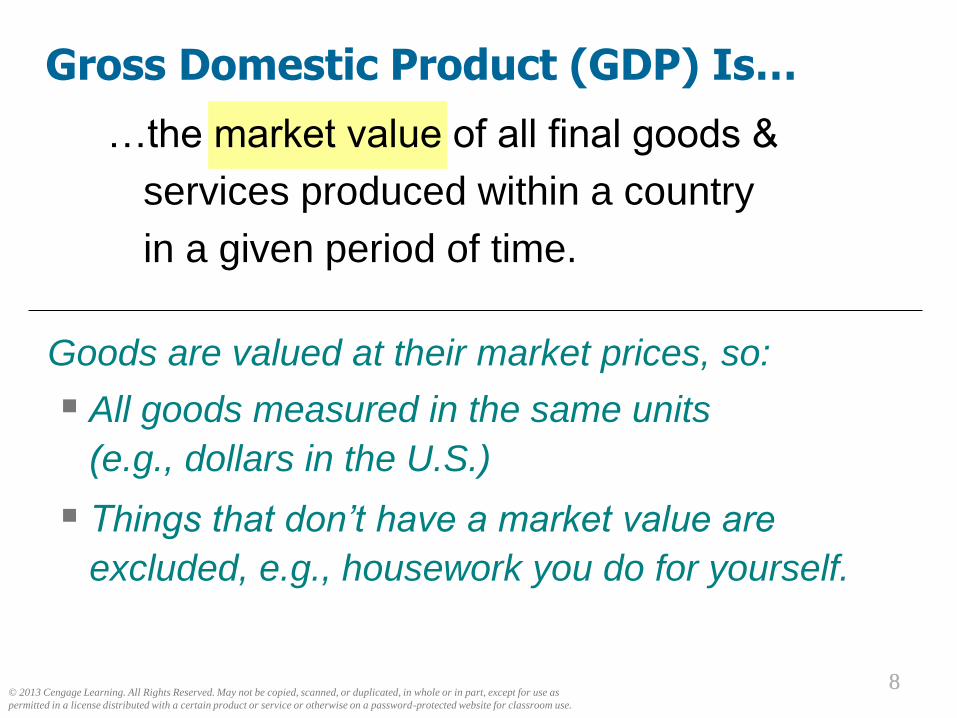
…the market value of all final goods &
services produced within a country
in a given period of time.
Gross Domestic Product (GDP) Is…
Goods are valued at their market prices, so:
All goods measured in the same units
(e.g., dollars in the U.S.)
Things that don’t have a market value are
excluded, e.g., housework you do for yourself.
© 2013 Cengage Learning. All Rights Reserved. May not be copied, scanned, or duplicated, in whole or in part, except for use as
permitted in a license distributed with a certain product or service or otherwise on a password-protected website for classroom use.
99
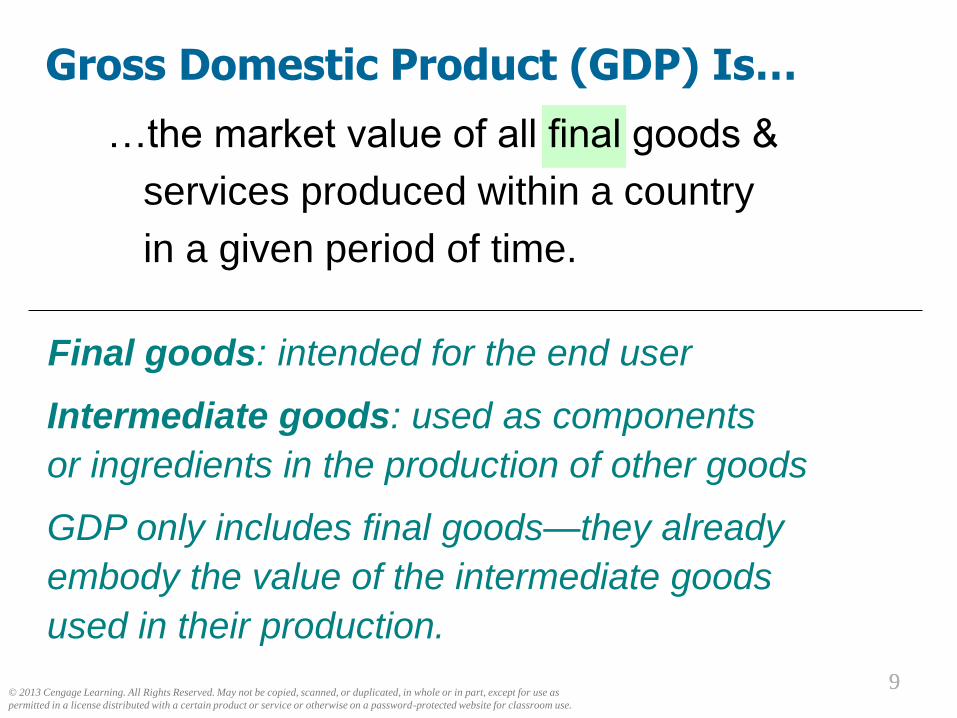
…the market value of all final goods &
services produced within a country
in a given period of time.
Gross Domestic Product (GDP) Is…
Final goods: intended for the end user
Intermediate goods: used as components
or ingredients in the production of other goods
GDP only includes final goods—they already
embody the value of the intermediate goods
used in their production.
© 2013 Cengage Learning. All Rights Reserved. May not be copied, scanned, or duplicated, in whole or in part, except for use as
permitted in a license distributed with a certain product or service or otherwise on a password-protected website for classroom use.
1010
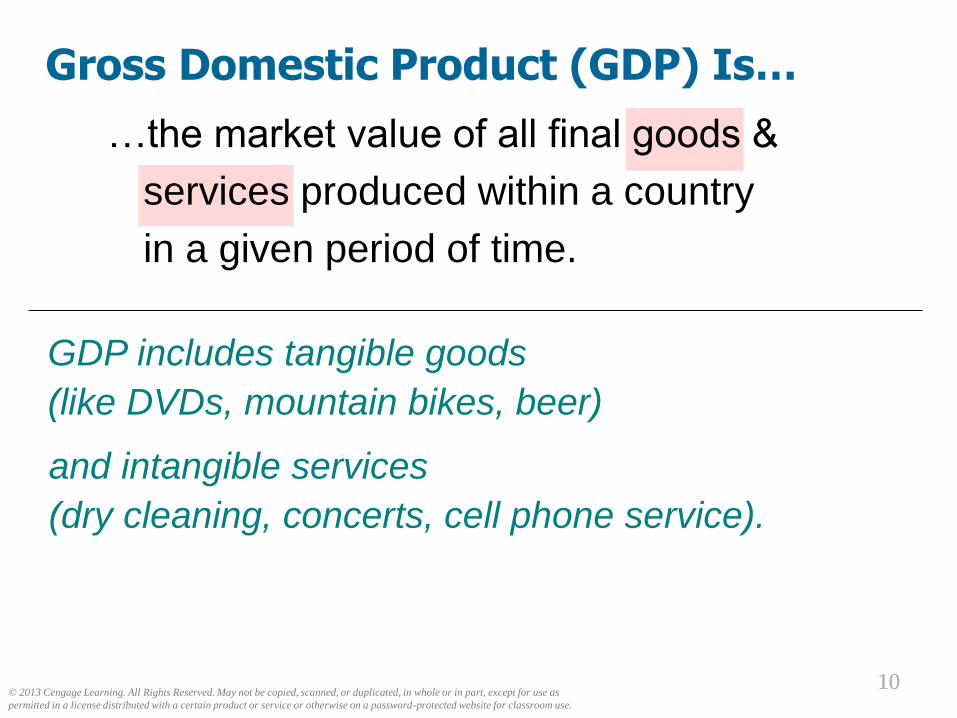
…the market value of all final goods &
services produced within a country
in a given period of time.
Gross Domestic Product (GDP) Is…
GDP includes tangible goods
(like DVDs, mountain bikes, beer)
and intangible services
(dry cleaning, concerts, cell phone service).
© 2013 Cengage Learning. All Rights Reserved. May not be copied, scanned, or duplicated, in whole or in part, except for use as
permitted in a license distributed with a certain product or service or otherwise on a password-protected website for classroom use.
1111
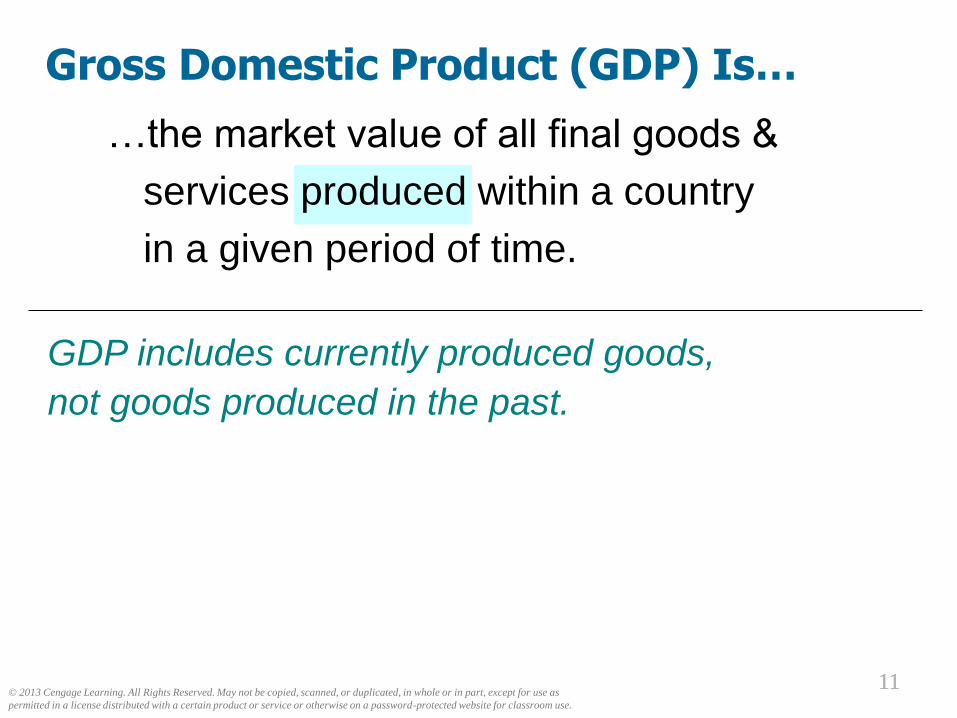
…the market value of all final goods &
services produced within a country
in a given period of time.
Gross Domestic Product (GDP) Is…
GDP includes currently produced goods,
not goods produced in the past.
© 2013 Cengage Learning. All Rights Reserved. May not be copied, scanned, or duplicated, in whole or in part, except for use as
permitted in a license distributed with a certain product or service or otherwise on a password-protected website for classroom use.
1212
…the market value of all final goods &
services produced within a country
in a given period of time.
Gross Domestic Product (GDP) Is…
GDP measures the value of production that occurs
within a country’s borders, whether done by its own
citizens or by foreigners located there.
© 2013 Cengage Learning. All Rights Reserved. May not be copied, scanned, or duplicated, in whole or in part, except for use as
permitted in a license distributed with a certain product or service or otherwise on a password-protected website for classroom use.
1313
…the market value of all final goods &
services produced within a country
in a given period of time.
Gross Domestic Product (GDP) Is…
Usually a year or a quarter (3 months)
© 2013 Cengage Learning. All Rights Reserved. May not be copied, scanned, or duplicated, in whole or in part, except for use as
permitted in a license distributed with a certain product or service or otherwise on a password-protected website for classroom use.
1414
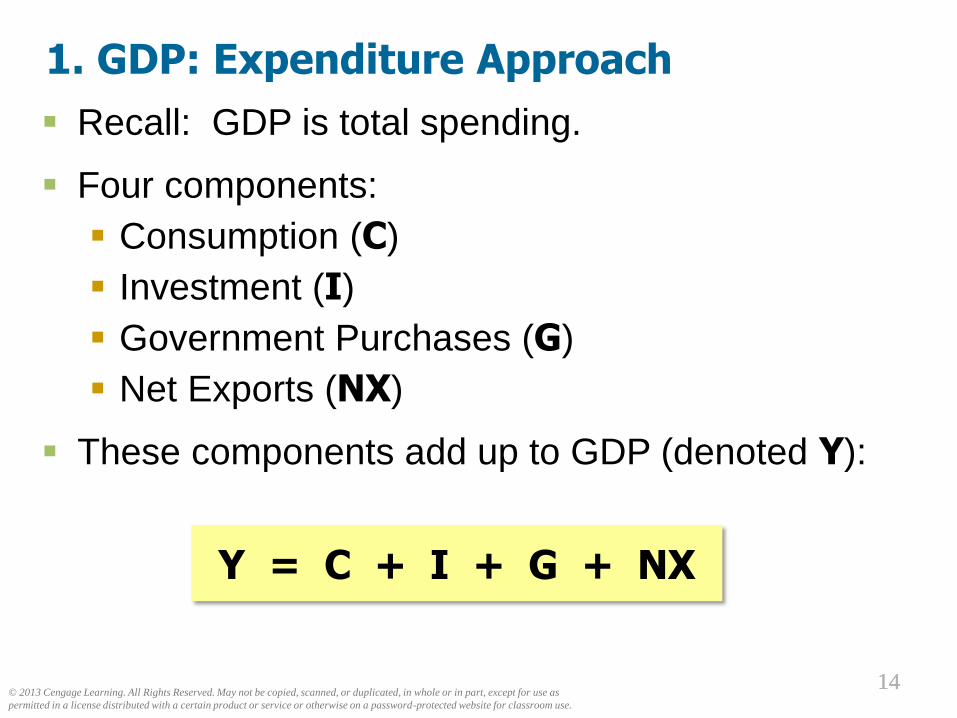
1. GDP: Expenditure Approach
Recall: GDP is total spending.
Four components:
Consumption (C)
Investment (I)
Government Purchases (G)
Net Exports (NX)
These components add up to GDP (denoted Y):
Y = C + I + G + NX
© 2013 Cengage Learning. All Rights Reserved. May not be copied, scanned, or duplicated, in whole or in part, except for use as
permitted in a license distributed with a certain product or service or otherwise on a password-protected website for classroom use.
1515
Consumption (C)
is total spending by households on g&s.
Biggest sector, 2/3 to 7/10 of economy
Note on housing costs:
For renters,
consumption includes rent payments.
For homeowners,
consumption includes the imputed rental value
of the house, but not the purchase price or
mortgage payments.
© 2013 Cengage Learning. All Rights Reserved. May not be copied, scanned, or duplicated, in whole or in part, except for use as
permitted in a license distributed with a certain product or service or otherwise on a password-protected website for classroom use.
1616
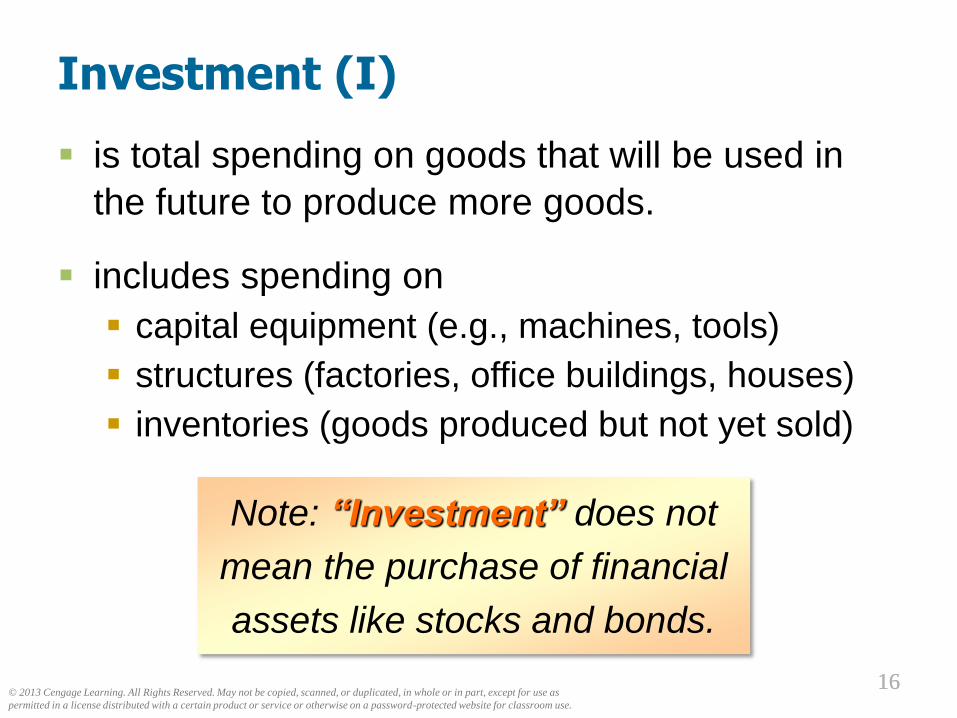
Investment (I)
is total spending on goods that will be used in
the future to produce more goods.
includes spending on
capital equipment (e.g., machines, tools)
structures (factories, office buildings, houses)
inventories (goods produced but not yet sold)
Note: “Investment” does not
mean the purchase of financial
assets like stocks and bonds.
© 2013 Cengage Learning. All Rights Reserved. May not be copied, scanned, or duplicated, in whole or in part, except for use as
permitted in a license distributed with a certain product or service or otherwise on a password-protected website for classroom use.
1717
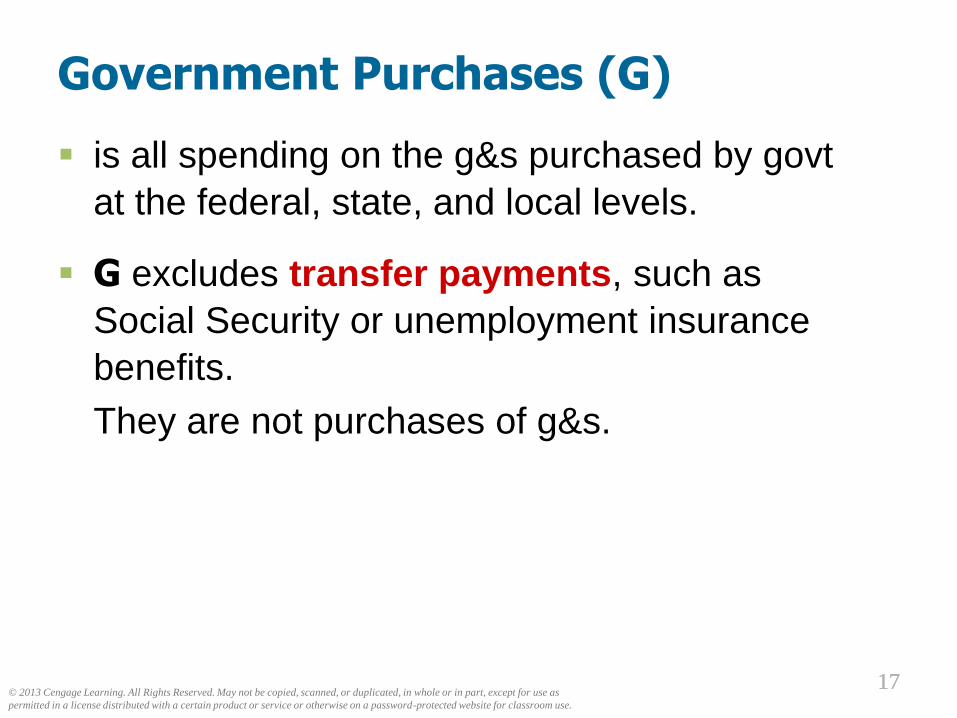
Government Purchases (G)
is all spending on the g&s purchased by govt
at the federal, state, and local levels.
G excludes transfer payments, such as
Social Security or unemployment insurance
benefits.
They are not purchases of g&s.
© 2013 Cengage Learning. All Rights Reserved. May not be copied, scanned, or duplicated, in whole or in part, except for use as
permitted in a license distributed with a certain product or service or otherwise on a password-protected website for classroom use.
1818
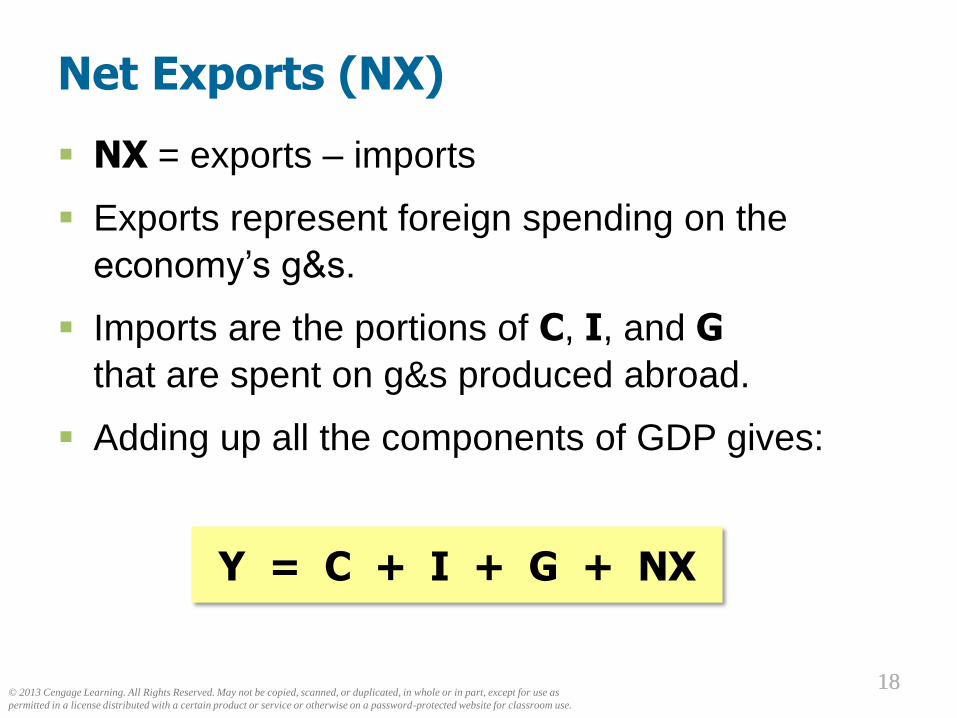
Net Exports (NX)
NX = exports – imports
Exports represent foreign spending on the
economy’s g&s.
Imports are the portions of C, I, and G
that are spent on g&s produced abroad.
Adding up all the components of GDP gives:
Y = C + I + G + NX
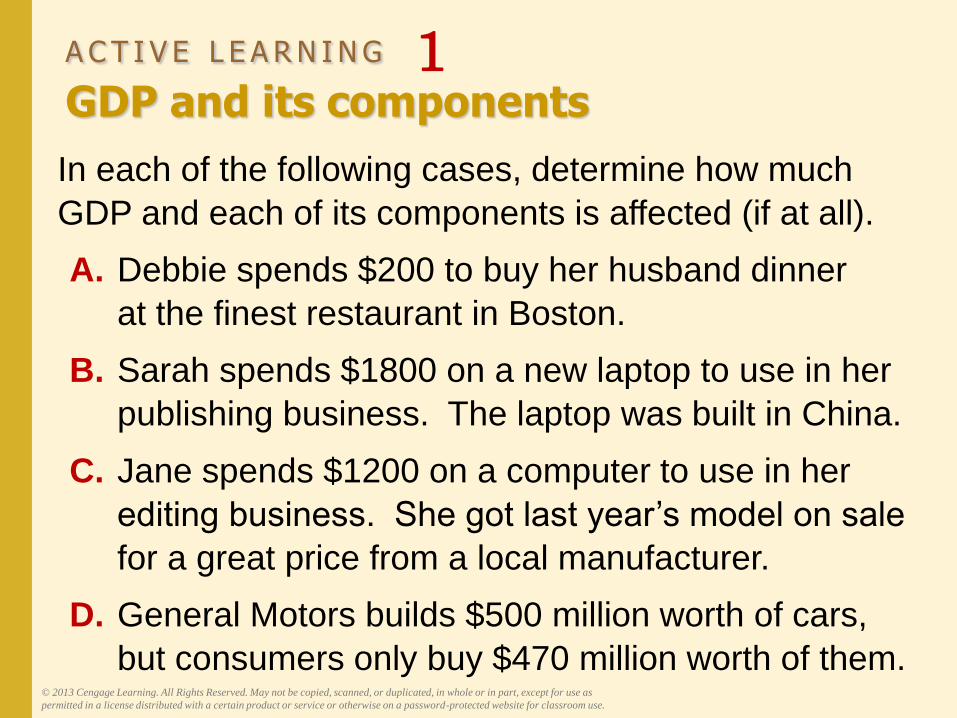
A C T I V E L E A R N I N G 1GDP and its components
In each of the following cases, determine how much
GDP and each of its components is affected (if at all).
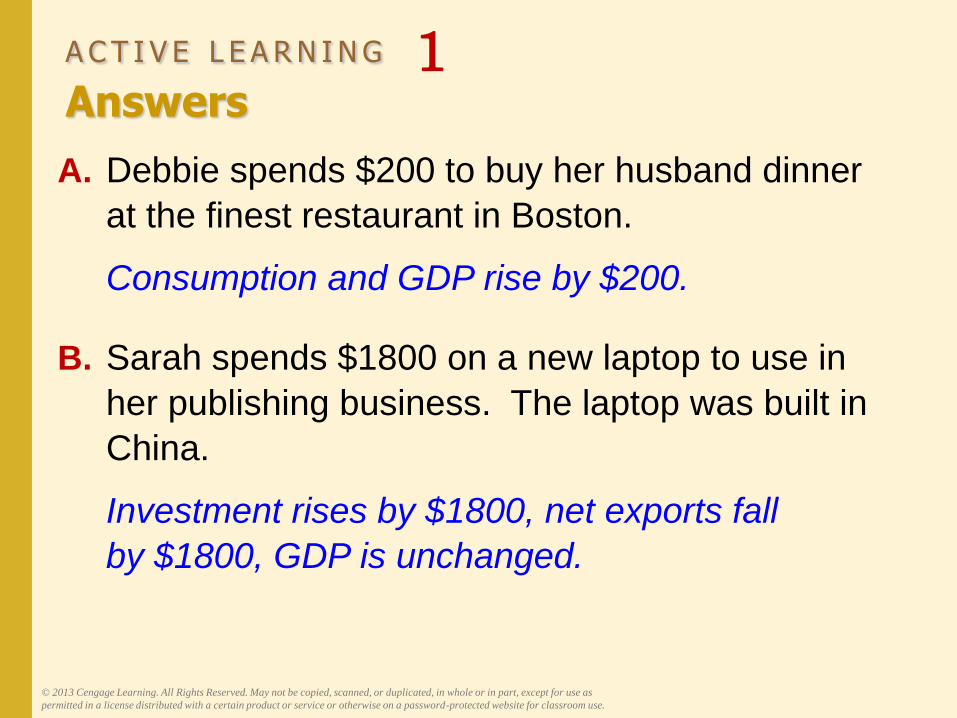
A. Debbie spends $200 to buy her husband dinner
at the finest restaurant in Boston.
B. Sarah spends $1800 on a new laptop to use in her
publishing business. The laptop was built in China.
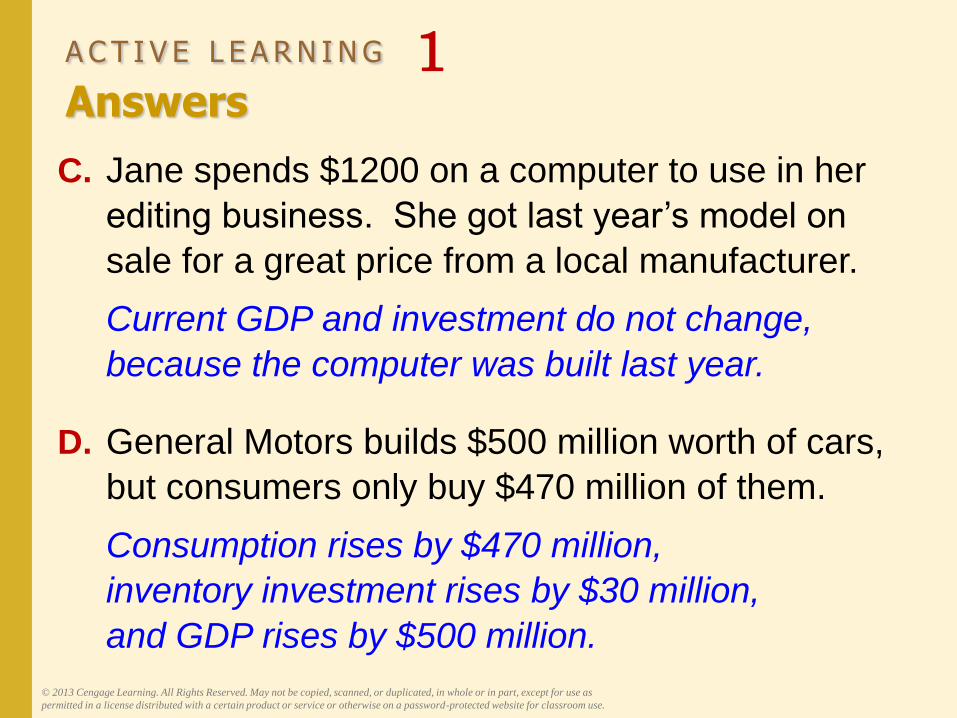
C. Jane spends $1200 on a computer to use in her
editing business. She got last year’s model on sale
for a great price from a local manufacturer.
D. General Motors builds $500 million worth of cars,
but consumers only buy $470 million worth of them.© 2013 Cengage Learning. All Rights Reserved. May not be copied, scanned, or duplicated, in whole or in part, except for use as
permitted in a license distributed with a certain product or service or otherwise on a password-protected website for classroom use.
A C T I V E L E A R N I N G 1Answers
A. Debbie spends $200 to buy her husband dinner
at the finest restaurant in Boston.
Consumption and GDP rise by $200.
B. Sarah spends $1800 on a new laptop to use in
her publishing business. The laptop was built in
China.
Investment rises by $1800, net exports fall
by $1800, GDP is unchanged.
© 2013 Cengage Learning. All Rights Reserved. May not be copied, scanned, or duplicated, in whole or in part, except for use as
permitted in a license distributed with a certain product or service or otherwise on a password-protected website for classroom use.
A C T I V E L E A R N I N G 1Answers
C. Jane spends $1200 on a computer to use in her
editing business. She got last year’s model on
sale for a great price from a local manufacturer.
Current GDP and investment do not change,
because the computer was built last year.
D. General Motors builds $500 million worth of cars,
but consumers only buy $470 million of them.
Consumption rises by $470 million,
inventory investment rises by $30 million,
and GDP rises by $500 million.
© 2013 Cengage Learning. All Rights Reserved. May not be copied, scanned, or duplicated, in whole or in part, except for use as
permitted in a license distributed with a certain product or service or otherwise on a password-protected website for classroom use.
© 2013 Cengage Learning. All Rights Reserved. May not be copied, scanned, or duplicated, in whole or in part, except for use as
permitted in a license distributed with a certain product or service or otherwise on a password-protected website for classroom use.
2222
2. GDP: Income Approach
Recall: GDP is total spending.
Four components:
Wages (W)
Rent (R)
Interest (I)
Profit (P)
These components add up to GDP (denoted Y):
Y = W + R + I + P
© 2013 Cengage Learning. All Rights Reserved. May not be copied, scanned, or duplicated, in whole or in part, except for use as
permitted in a license distributed with a certain product or service or otherwise on a password-protected website for classroom use.
2323
Real versus Nominal GDP
Inflation can distort economic variables like GDP,
so we have two versions of GDP:
Nominal GDP
values output using current prices
not corrected for inflation
Real GDP
values output using the prices of a base year
is corrected for inflation
© 2013 Cengage Learning. All Rights Reserved. May not be copied, scanned, or duplicated, in whole or in part, except for use as
permitted in a license distributed with a certain product or service or otherwise on a password-protected website for classroom use.
2424
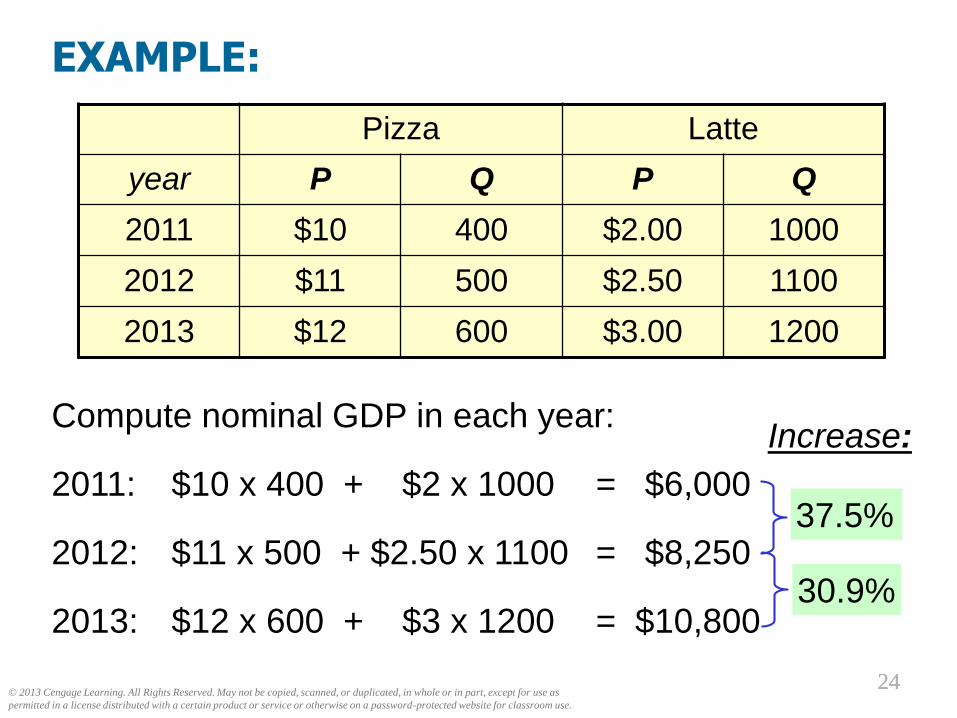
EXAMPLE:
Compute nominal GDP in each year:
2011: $10 x 400 + $2 x 1000 = $6,000
2012: $11 x 500 + $2.50 x 1100 = $8,250
2013: $12 x 600 + $3 x 1200 = $10,800
Pizza Latte
year P Q P Q
2011 $10 400 $2.00 1000
2012 $11 500 $2.50 1100
2013 $12 600 $3.00 1200
37.5%
Increase:
30.9%
© 2013 Cengage Learning. All Rights Reserved. May not be copied, scanned, or duplicated, in whole or in part, except for use as
permitted in a license distributed with a certain product or service or otherwise on a password-protected website for classroom use.
2525
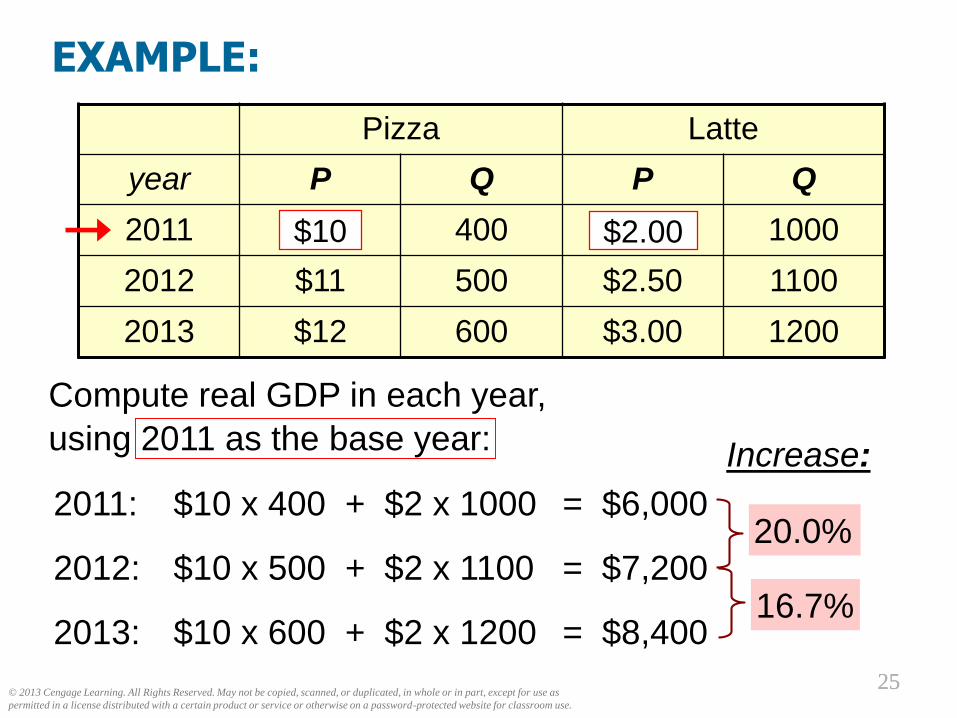
EXAMPLE:
Compute real GDP in each year,
using 2011 as the base year:
Pizza Latte
year P Q P Q
2011 $10 400 $2.00 1000
2012 $11 500 $2.50 1100
2013 $12 600 $3.00 1200
20.0%
Increase:
16.7%
$10 $2.00
2011: $10 x 400 + $2 x 1000 = $6,000
2012: $10 x 500 + $2 x 1100 = $7,200
2013: $10 x 600 + $2 x 1200 = $8,400
© 2013 Cengage Learning. All Rights Reserved. May not be copied, scanned, or duplicated, in whole or in part, except for use as
permitted in a license distributed with a certain product or service or otherwise on a password-protected website for classroom use.
2626
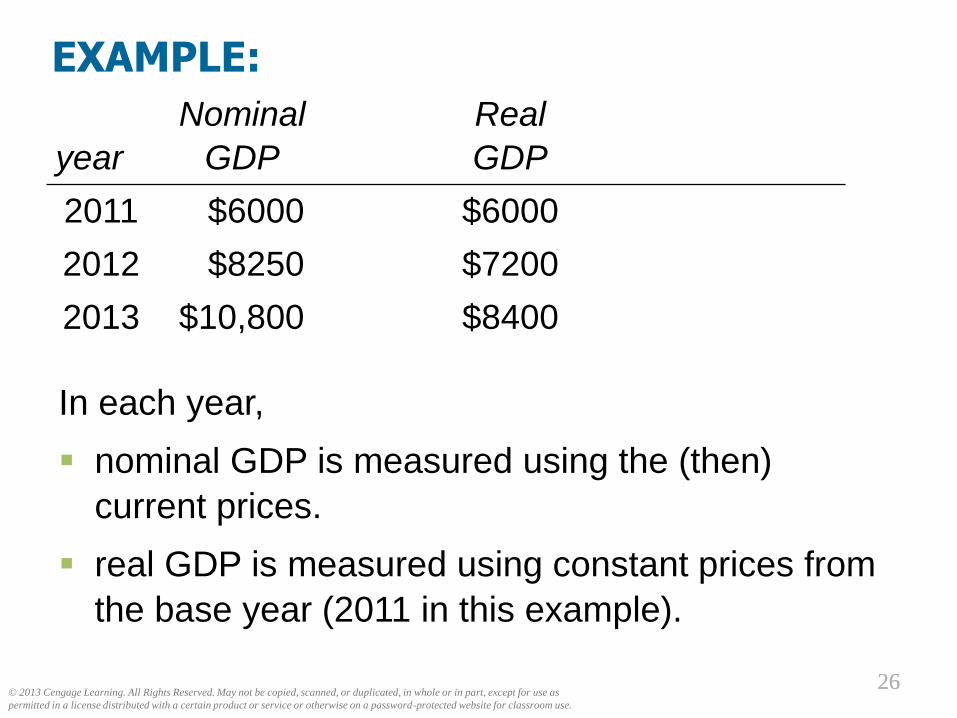
EXAMPLE:
In each year,
nominal GDP is measured using the (then)
current prices.
real GDP is measured using constant prices from
the base year (2011 in this example).
year
Nominal
GDP
Real
GDP
2011 $6000 $6000
2012 $8250 $7200
2013 $10,800 $8400
© 2013 Cengage Learning. All Rights Reserved. May not be copied, scanned, or duplicated, in whole or in part, except for use as
permitted in a license distributed with a certain product or service or otherwise on a password-protected website for classroom use.
2727
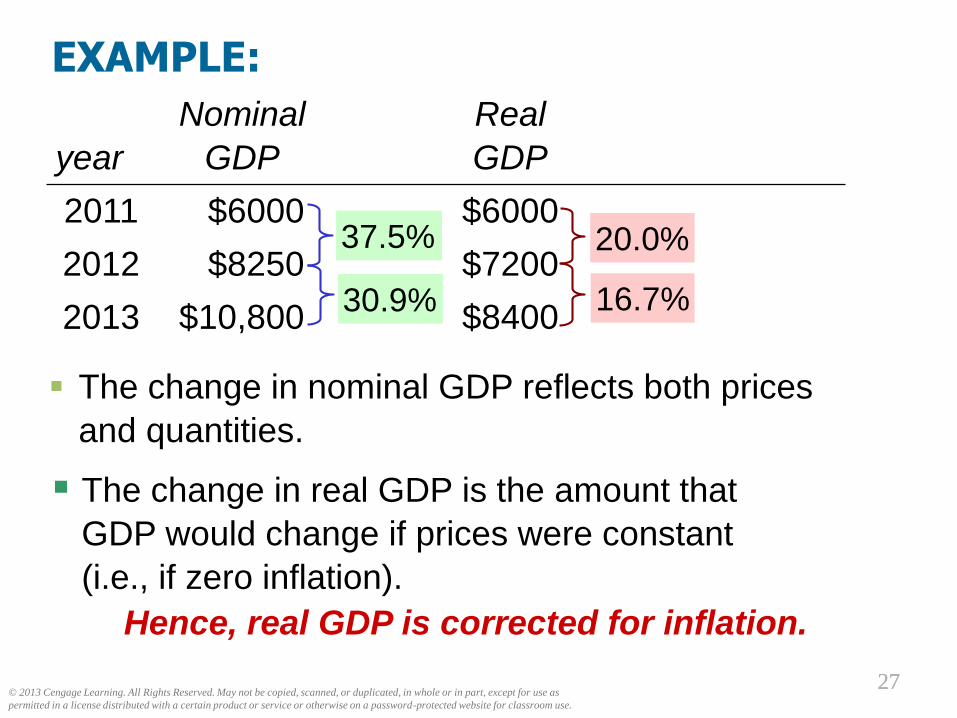
EXAMPLE:
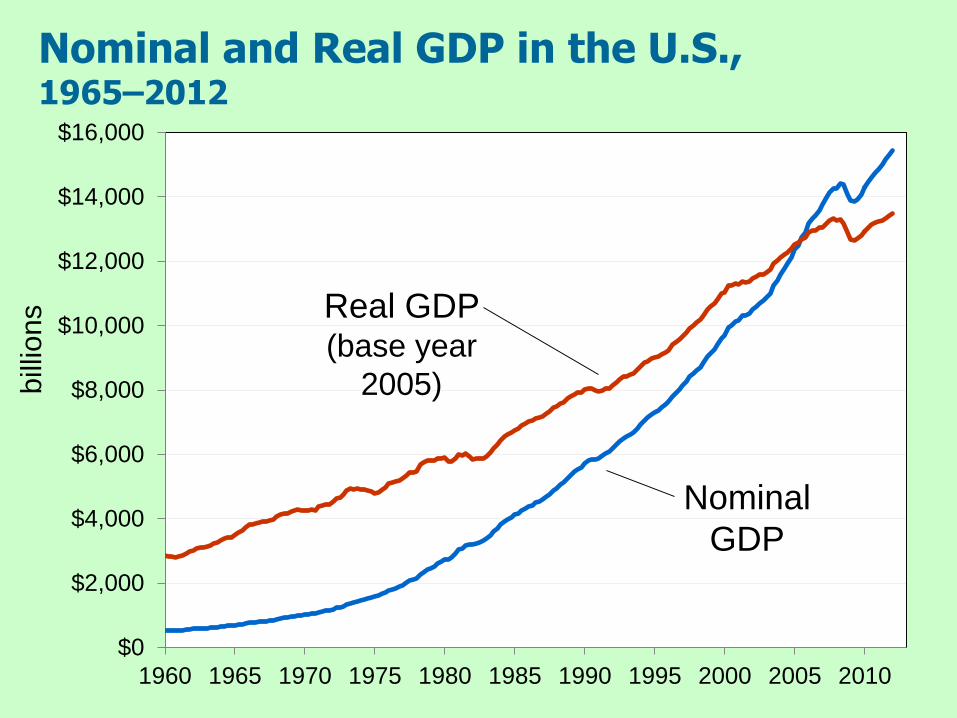
The change in nominal GDP reflects both prices
and quantities.
year
Nominal
GDP
Real
GDP
2011 $6000 $6000
2012 $8250 $7200
2013 $10,800 $8400
20.0%
16.7%
37.5%
30.9%
The change in real GDP is the amount that
GDP would change if prices were constant
(i.e., if zero inflation).
Hence, real GDP is corrected for inflation.
$0
$2,000
$4,000
$6,000
$8,000
$10,000
$12,000
$14,000
$16,000
1960 1965 1970 1975 1980 1985 1990 1995 2000 2005 2010
Nominal and Real GDP in the U.S., 1965–2012
Real GDP (base year
2005)
Nominal
GDP
bill
ions
© 2013 Cengage Learning. All Rights Reserved. May not be copied, scanned, or duplicated, in whole or in part, except for use as
permitted in a license distributed with a certain product or service or otherwise on a password-protected website for classroom use.
2929
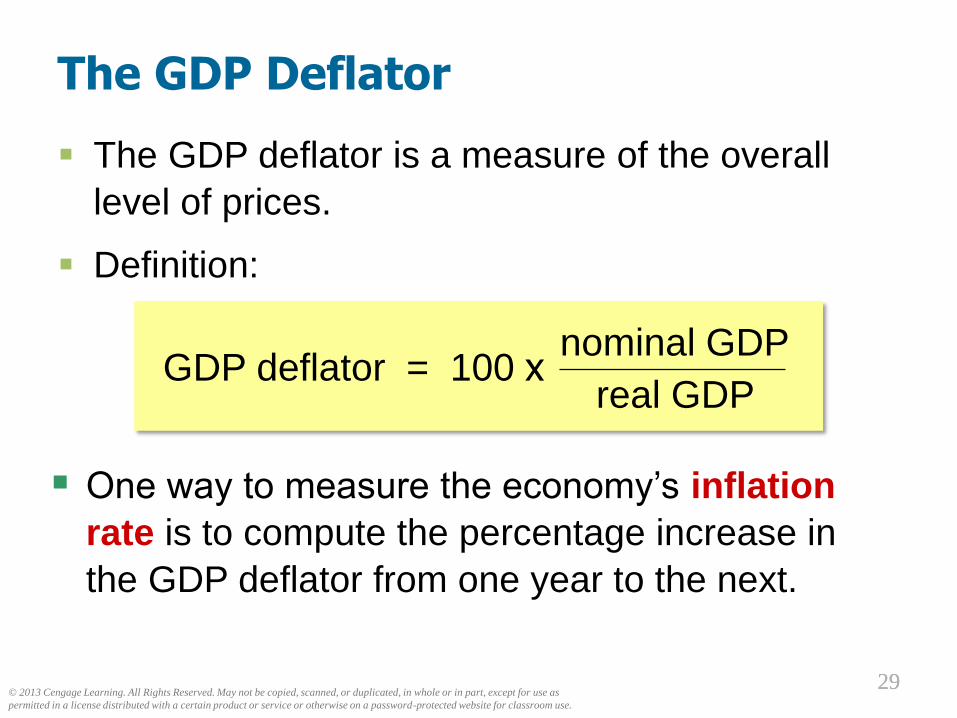
The GDP Deflator
The GDP deflator is a measure of the overall
level of prices.
Definition:
One way to measure the economy’s inflation
rate is to compute the percentage increase in
the GDP deflator from one year to the next.
GDP deflator = 100 xnominal GDP
real GDP
© 2013 Cengage Learning. All Rights Reserved. May not be copied, scanned, or duplicated, in whole or in part, except for use as
permitted in a license distributed with a certain product or service or otherwise on a password-protected website for classroom use.
3030
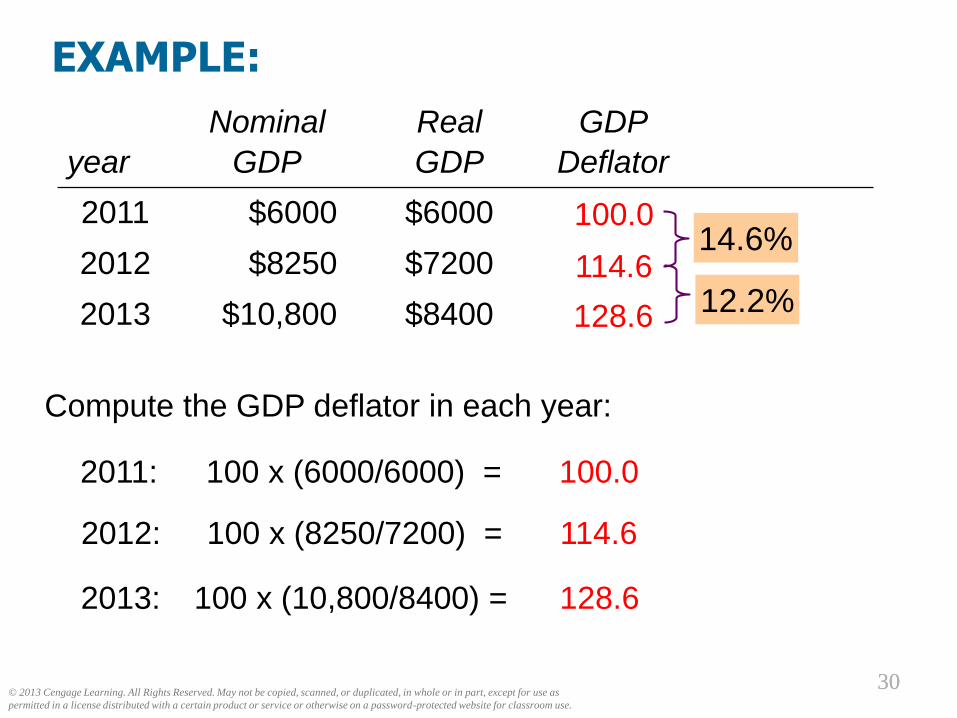
EXAMPLE:
Compute the GDP deflator in each year:
year
Nominal
GDP
Real
GDP
GDP
Deflator
2011 $6000 $6000
2012 $8250 $7200
2013 $10,800 $8400
2011: 100 x (6000/6000) = 100.0
100.0
2012: 100 x (8250/7200) = 114.6
114.6
2013: 100 x (10,800/8400) = 128.6
128.6
14.6%
12.2%

A C T I V E L E A R N I N G 2Computing GDP
© 2013 Cengage Learning. All Rights Reserved. May not be copied, scanned, or duplicated, in whole or in part, except for use as
permitted in a license distributed with a certain product or service or otherwise on a password-protected website for classroom use.
Use the above data to solve these problems:
A. Compute nominal GDP in 2011.
B. Compute real GDP in 2012.
C. Compute the GDP deflator in 2013.
2011 (base yr) 2012 2013
P Q P Q P Q
Good A $30 900 $31 1000 $36 1050
Good B $100 192 $102 200 $100 205
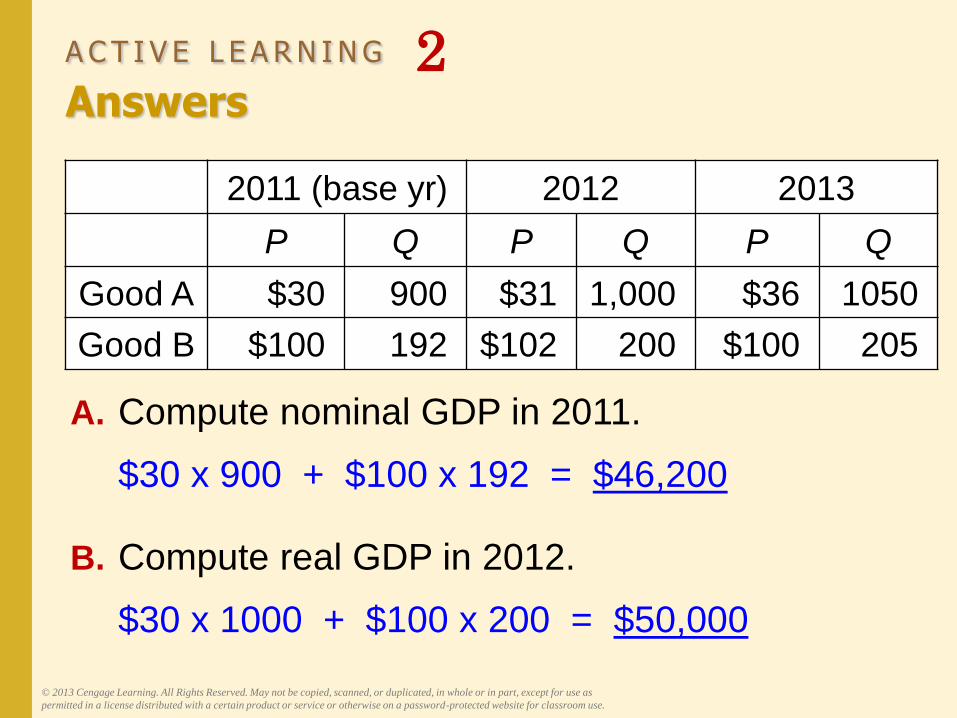
A C T I V E L E A R N I N G 2Answers
© 2013 Cengage Learning. All Rights Reserved. May not be copied, scanned, or duplicated, in whole or in part, except for use as
permitted in a license distributed with a certain product or service or otherwise on a password-protected website for classroom use.
A. Compute nominal GDP in 2011.
$30 x 900 + $100 x 192 = $46,200
B. Compute real GDP in 2012.
$30 x 1000 + $100 x 200 = $50,000
2011 (base yr) 2012 2013
P Q P Q P Q
Good A $30 900 $31 1,000 $36 1050
Good B $100 192 $102 200 $100 205
A C T I V E L E A R N I N G 2Answers
© 2013 Cengage Learning. All Rights Reserved. May not be copied, scanned, or duplicated, in whole or in part, except for use as
permitted in a license distributed with a certain product or service or otherwise on a password-protected website for classroom use.
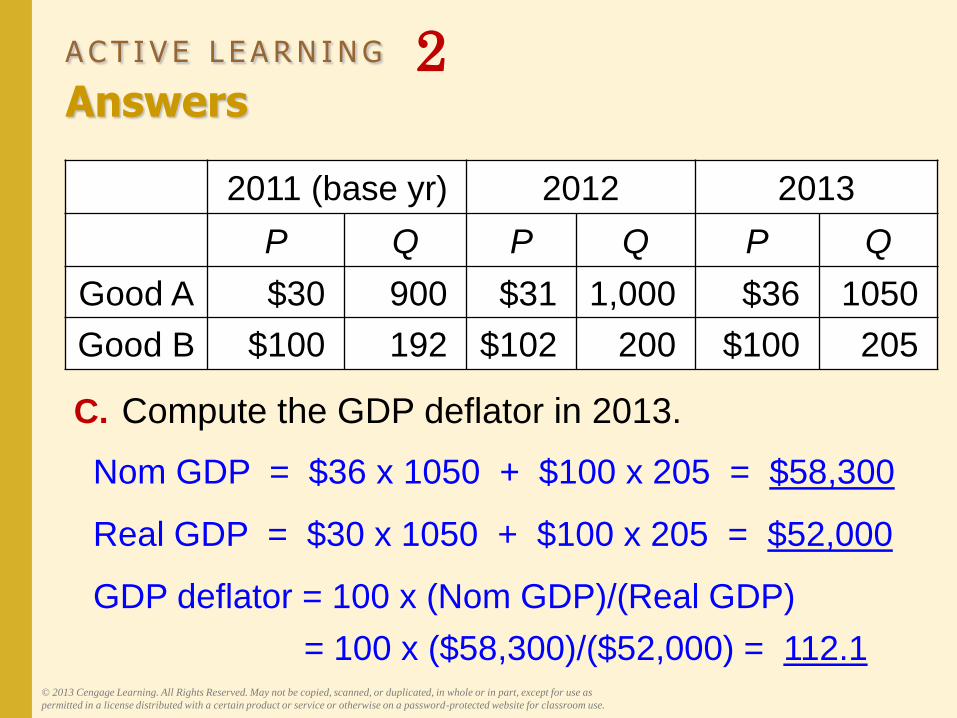
C. Compute the GDP deflator in 2013.
Nom GDP = $36 x 1050 + $100 x 205 = $58,300
Real GDP = $30 x 1050 + $100 x 205 = $52,000
GDP deflator = 100 x (Nom GDP)/(Real GDP)
= 100 x ($58,300)/($52,000) = 112.1
2011 (base yr) 2012 2013
P Q P Q P Q
Good A $30 900 $31 1,000 $36 1050
Good B $100 192 $102 200 $100 205
© 2013 Cengage Learning. All Rights Reserved. May not be copied, scanned, or duplicated, in whole or in part, except for use as
permitted in a license distributed with a certain product or service or otherwise on a password-protected website for classroom use.
3434
GDP and Economic Well-Being
Real GDP per capita is the main indicator of
the average person’s standard of living.
But GDP is not a perfect measure of
well-being.
Robert Kennedy issued a very eloquent
yet harsh criticism of GDP:

Gross Domestic Product…
“… does not allow for the health of our
children, the quality of their education,
or the joy of their play. It does not
include the beauty of our poetry or
the strength of our marriages, the
intelligence of our public debate or
the integrity of our public officials.
It measures neither our courage, nor our wisdom,
nor our devotion to our country. It measures everything,
in short, except that which makes life worthwhile, and it
can tell us everything about America except why we are
proud that we are Americans.”
- Senator Robert Kennedy, 1968
© 2013 Cengage Learning. All Rights Reserved. May not be copied, scanned, or duplicated, in whole or in part, except for use as
permitted in a license distributed with a certain product or service or otherwise on a password-protected website for classroom use.
3636
GDP Does Not Value:
the quality of the environment
leisure time
non-market activity, such as the child care
a parent provides his or her child at home
an equitable distribution of income
© 2013 Cengage Learning. All Rights Reserved. May not be copied, scanned, or duplicated, in whole or in part, except for use as
permitted in a license distributed with a certain product or service or otherwise on a password-protected website for classroom use.
3737
Then Why Do We Care About GDP?
Having a large GDP enables a country to afford
better schools, a cleaner environment,
health care, etc.
Many indicators of the quality of life are
positively correlated with GDP. For example…
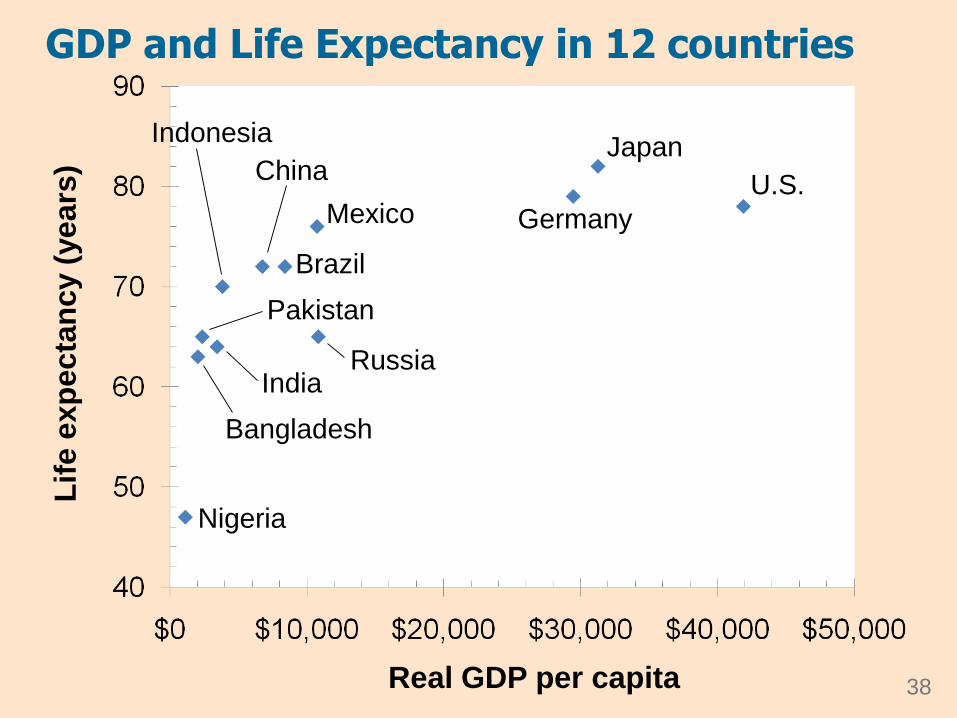
GDP and Life Expectancy in 12 countries
38
Lif
e e
xp
ec
tan
cy (
ye
ars
)
Real GDP per capita
U.S.
Germany
Japan
Mexico
Russia
Brazil
China
India
Indonesia
Pakistan
Bangladesh
Nigeria

GDP and Literacy in 12 countries
39
Ad
ult
Lit
era
cy
(% o
f p
op
ula
tio
n)
Real GDP per capita
U.S.Germany Japan
Mexico
Russia
Brazil
China
India
Indonesia
Nigeria
Pakistan
Bangladesh
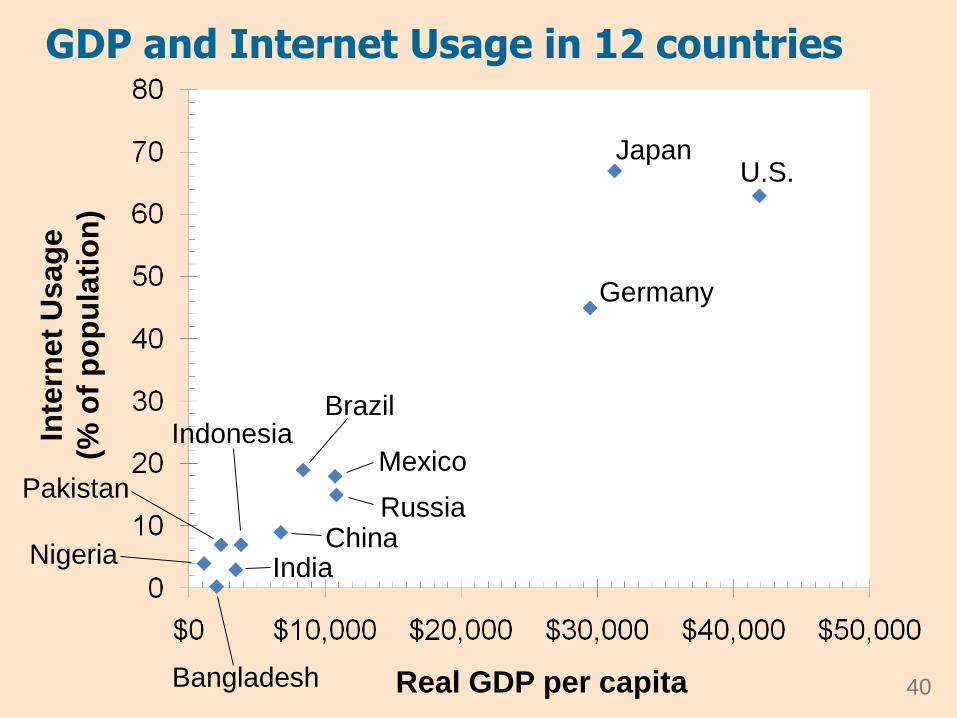
GDP and Internet Usage in 12 countries
40
Inte
rne
t U
sa
ge
(% o
f p
op
ula
tio
n)
Real GDP per capita
U.S.
Germany
Japan
Mexico
Russia
Brazil
ChinaIndia
Indonesia
Nigeria
Bangladesh
Pakistan
S U M M A RY
• Gross Domestic Product (GDP) measures a
country’s total income and expenditure.
• The four spending components of GDP include:
Consumption, Investment, Government
Purchases, and Net Exports.
• Nominal GDP is measured using current prices.
Real GDP is measured using the prices of a
constant base year and is corrected for inflation.
• GDP is the main indicator of a country’s economic
well-being, even though it is not perfect.
© 2013 Cengage Learning. All Rights Reserved. May not be copied, scanned, or duplicated, in whole or in part, except for use as
permitted in a license distributed with a certain product or service or otherwise on a password-protected website for classroom use.