Embed Size (px)
Citation preview

NASA CR-134646SRI PYU-2285
FABRICATION AND TESTOF INORGANIC/ORGANIC SEPARATORS
by J. S. Smatko
STANFORD RESEARCH- INSTITUTE333 Ravenswood Avenue
Menlo Park, California 94025
PRICES SUBJECT TO CAGE
prepared for
NATIONAL AERONAUTICS AND SPACE ADMINISTRATION
NASA Lewis Research CenterCleveland, Ohio
John M. Bozek, Project ManagerDirect Energy Conversion Division
Reproduced by
NATIONAL TECHNICALINFORMATION SERVICE
US Department of CommerceSpringfield, VA. 22151
INORGANIC/OEG0 IzC SEPARATORS Finalo GA9_1C/OAGA FABRICATION AND TEST OpReport, Iov. 1972 Jan. 19 (Stanford
Research Inst.) an- 1974 (Stanford N74-26517
CSCL 0C Unclas
G3/0 3 42002
9k
https://ntrs.nasa.gov/search.jsp?R=19740018398 2018-06-20T07:29:47+00:00Z

1. h o . 2. ( ' * 1 t /,- . ,i , "') 3 . ,
NASA CR-134646
~abrication- I C.L~ 1- "~-4. Ti' nd title 5. fReport [)D teFebruary 1974
Fabrication and Test of Inorganic/Organic Separators Palfo4i Ornoi ,irnc0
7. . et'form, i in ; )rgitir izai oian ",port No.
Joseph S. Smatko
9. Purfrminq Ot(;anizztionr N me a,:ind Address
Stanford Research Institute 11. Cnt: or Grcnt No.333 Ravenswood Avenue NAS 3-17344
Menlo Park, California 94025 13. Type of R port a:d Pu;iod C,. d
12. Spor ins A~~;cy N-, and /-v'druss Final Nov 1972-Jan 1974
NASA-Lewis Research Center 14. Sponsoring Agency Code21000 Brookpark Road, Cleveland, Ohio 44135
15. Sup, nlentary Notes
Project Manager, John M. Bozek
10. Abstact
Work on this contract was performed under two major tasks. In Task I,
completion of testing and failure analysis of MDC 40 Ahr silver-zinc cells
containing largely inorganic separators was accomplished. The results showed
that the wet stand and cycle life objectives of the silver-zinc cell develop-
ment program under Contracts NAS 3-10928 and NAS 3-15686 and the present
contract were accomplished and led to recommendations for cell composition,
design and operation that should provide further improvements in cycle and
wet life.
In Task II, the paramount task, the building, testing and failure analysis
of two-plate cells employing three optimum separators selected on the basis
of extensive screening tests on Contract NAS 3-15686, was performed. The best
separator material as a result of these tests was doped calcium zirconate.
This result points to the potential of building of silver-zinc cells having
longer cycle and wet life and a longer period of capacity retention than
cells heretoforemade with inorganic separators.
17. Key Words (Suggested by Author(s)) 18. Distribution Statement
Sealed silver-zinc cells
Inorganic battery separatorsUnclassified - Limited
Cell failure analysis
Sterilized batteries
10. Security Classif. (of this report) 20. Security CIJssif. (of this page) 21. No. of Pages 22. Price'
Unclassified Unclassified 73
For s.l1e by tile 1.tioul Technical hlfrl!1ti!n Service. Sprinofleld, Virfgini 22151
% 7I

CONTENTS
SUMMARY . . . . . . . . . . . . . . . . . . . . . . . . 1
INTRODUCTION . . . . . . . . . . . . . . . . . . . . . . . . . . 3
EXPERIMENTAL PROCEDURE . ........... . . . ......... 5
Testing of Original MDC Cells ..... ..... . . . ... 6
Battery Separator Preparation .... .... . ... . . . .... 6
Cell Assembly . . . . .. . . . . . . . . . ..... . 8
Cell Testing . ..... .. .. . . . . . .. . . . . . . . 10
RESULTS . ...................... . . . . . . . . . . . . . . . . . . . . . 15
Test Results on the Cells Manufactured at MDC . ....... 15
Viking Cell Group (Cycling Regime: VK-2) . .. .. ...... 15
Cell Design Variation Group (Cycling Regime: VK-1) . .. .. . 18
Temperature-Battery/Cell Group (Cycling Regime: VK-1) . . .. 20
Plate-Lock Cell Group (Cycling Regime: 100% DOD) . ...... 20
Group of Extra Cells (Cycling Regimes: VK-1 and 100% DOD) . 28
Failure Analysis . . . .. ... .. ... . .. . . . . ...... . 30
Failure Modes: Breakdown by Cell Test Group 32
Test Results on Cells Made at SRI ..... . ... . . . . . 38
Testing of the First Series of Cells . ........ . . . . 39
Testing the Second Series of Cells . . .......... 49
Comparison of Series I and Series II Cell Tests . . . . . . . 53
Failure Analysis .. . ... .... ........ . . . . . 57
DISCUSSION .................... . . . . . .. . . . . . . 63
CONCLUSIONS . . . . . . . . .... . . . . . . . . . . . . 67
Original MDC Cells . . . . . ......... . .. ... . 67
Preceding page blank

CONTENTS (Concluded)
Two Plate Cells . . . . .. . . . ...................... 69
RECOMMENDATIONS . . . . . . .. . ...................... 71
REFERENCES . . . . . ........................... 73
LIST OF ILLUSTRATIONS
Figure
1 Output Capacity Retention with Cycle Life,
Series NHS-114-1-5 . . . . . . . . .. ................... 24
2 Output Capacity Retention with Cycle Life,
Series NHS-114-16-20 . . . . . . . . ................. . 25
3 Output Capacity Retention with Cycle Life,
Series NHS-114-26-30 . .. . . . . . . ............ . . 26
4 Output Capacity Retention with Cycle Life,
Series NHS-114-31-35 . . . . . . . . . . . ..... . . . 27
5 Capacity Change with Cycling, Cell No. B-Il-, B-1-2, B-1-3 40
6 Capacity Change with Cycling, Cell No. JC-1-1, JC-1-2,
JC-1-3 . ... . . . . . ........................ 41
7 Capacity Change with Cycling, Cell No. Q-1-1, Q-1-2,
Q-1-3 . . . . . . . . . .. . .. ...................... . 42
8 Capacity Change with Cycling, Cell No. S'-1-1, S'-1-2,
S-1-3 . . . . . . . .. . ... .................... 43
9 Capacity Change with Cycling, Cell No. P-2-1, P-2-2,
P-2-3 . . . . . . . . . . . . . . 44
10 Capacity Change with Cycling, Cell No. PX-2-1, PX-2-2,
PX-2-3 . . . . . . . .. . . . ......................... 45
iv

LIST OF ILLUSTRATIONS (Concluded)
Figure
11 Capacity Change with Cycling, Cell No. E-2-1, !-2-2, S-2-3 46
12 Capacity Change with Cycling, Cell No. SS-2-1, SS-2-2,
SS-2-3 . . . . . . . . . . . . . . . . . . . . . . . . . 47
LIST OF TABLES
Table
1 Cycling Regimes . ............ .. . . . . . . .. 7
2 Charge-Discharge Conditions, Two-Plate Cells ; . ... . . 11
3 Summary of Cell Test Groups and Conditions . ....... 16
4 Cycling Results: Viking Cell Group . ........... 17
5 Cycling Results: Cell Design Variation Group . ...... 19
6 Cycling Results: Temperature-Battery/Cell Group . ... . 21
7 Cycling Results: Plate-Lock Group . .... ... ... . 23
8 Cycling Results: Group of Extra Cells . ......... 29
9 Cell Failure Analysis: Statistical Breakdown of Faults
and Failures .. ................... . . 31
10 Cell Failure Analysis, 3-Plate Pilot Cell . ....... . 33
11 Viking, Float-Charged Stand Category . ......... . 33
12 Viking, Discharged Wet-Stand Category .......... 34
13 Viking, Continuous Cycling Immediately After Activation 34
v

LIST OF TABLES (Concluded)
Table
14 Cell Failure Analysis, Temperature-Battery/Cell Group . . 35
15 Cell Failure Analysis, Plate Lock Cell Group ... .... 36
16 Cell Failure Analysis, Design Variation and Extra Cell
Groups . . . . . . . . . . . . . . . . . . . . . . . . 37
17 Group Average Cycle Life to 50% of Formation Capacity . 48
18a 100% DOD Cycle Tests; First Series for Cycle 15 . ..... 50
18b 100% DOD Cycle Tests; First Series for Cycle 41 . ..... 51
18c 100% DOD Cycle Tests; First Series for Cycle 120 ..... 52
19a 100% DOD Cycle Tests; Second Series for Cycle 13 . .... 54
19b 100% DOD Cycle Tests; Second Series for Cycle 41 . . 55
19c 100% DOD Cycle Tests; Second Series for Cycle 120 .... 56
20 Failure Analysis of Two-Plate Cells, First Series . ... . 58
21 Silver Content of Separators . . . . . . . . . . . . . . . 59
22 Failure Analysis of Two-Plate Cells, Second Series .... 60
vi

SUMMARY
The work on this contract was done under two major tasks.
The first task was to continue testing and failure analysis of
40 Ahr silver-zinc cells containing semiflexible inorganic separators
developed at McDonnell-Douglas Corporation (MDC) under Contract NAS 3-
10928 and tested by SRI under Contract NAS 3-15686. The data accumu-
lated by MDC and SRI indicate that the major objective of the program--
the development of a heat-sterilizable, sealed silver-zinc cell capable
of extended stand and subsequent cycling--was accomplished. Cells that
were placed on discharged stand and then cycled, plus a small group of
cells that were cycled immediately after'activation, both yielded high
cycle and wet lives. Although charged stand and float-charged stand
are detrimental standing conditions, useful working lives are achiev-
able by standing conditions at subambient temperatures.
Analysis of the data showed that cell failures were almost exclu-
sively from shorting zinc nodules, and filamentary or leafy zinc den-
drites. Although silver was found in the separators, no shorting was
traced to continuous paths of silver. The low incidence of slumping
indicates the potential advantages of using MDC type cells to achieve
extended life in batteries containing zinc electrodes and alkali elec-
trolyte. Recommendations to improve silver-zinc cells include suggested
environmental and electrical conditions for standing and operating cells,
exploration of factors that cause separator degradation, and suggestions
for improved separators.
The major task in this investigation was to build and test two-
plate cells, using battery separators fabricated from separator
1

compositions selected by a series of screening tests from a large num-
ber of compositions on a previous program (Contract NAS 3-15686). After
cell testing and subsequent failure analysis, the best separator mater-
ial--a doped calcium zirconate--was then selected to be used as a con-
trol in a second series of tests. Modifications in the doping level
of this separator material were made and tested in two-plate cells,
in anticipation of finding an optimum separator. The final results
indicated that the original doping level in the calcium zirconate pro-
vided the best separator material. This material, when incorporated
in separators gave improved life characteristics to cells compared to
all other separators, including the separators used in the 40 Ahr MDC
cells.
2

INTRODUCTION
Silver-zinc batteries, which have higher energy densities than
other alkaline batteries, are attractive energy sources for compact
power applications, especially for space applications. However, limited
cycle- and wet-stand life and sealability problems have been deterrents
for some applications.
As demonstrated in a series of silver-zinc battery development
programs supported by NASA (References Nos. 1 to 7), the development of
inorganic battery separators represents a major advance toward the goal
of long-life, hermetically sealed batteries. The usefulness of these
separators was confirmed by the results of this SRI study. Many sealed
silver-zinc cells (nominally 40 Ahr) were still cycling more than
three years after their construction and initial testing. The results
obtained from cycling of these cells and analysis of those cells that
failed were given under Task I in report NASA CR-121215. The results
obtained on cells that failed since then are given under Task I in
this report.
Preliminary results of development programs at the former Astro-
power Laboratory of the McDonnell-Douglas Corporation suggested that
any improvements in inorganic separators and silver-zinc battery charac-
teristics were likely to occur through modifying existing technology.
Achieving such improvements was the overall objective of the current
program. The specific objective was to develop separator formulations
with improved characteristics (such as better chemical compatibility,
and a negligible rate of gassing when in contact with zinc) that would
permit increases of stand and cycle life of alkaline cells, especially
3

silver-zinc cells. Twenty different materials (including the 3420-09
7and 3420-25 reference materials) were previously prepared and tested
as rigid separators, and 16 of these materials were processed into
semiflexible separators.
From these 16 materials, three of the most promising materials plus
a reference material (3420-25) were selected for initial tests as sepa-
rators in two-plate cells on the basis of previous screening tests.7
The three materials were: (1) material B', a proprietary, synthetic.
substituted olivine, (2) material JC, a commercial magnesium titanate,
and (3) material S , a proprietary, doped calcium zirconate.
A second series of tests using two-plate cells was conducted after
an evaluation of the cells in the first series. Material S was selected
as the most promising material in the first series of tests. This
material was also tested in the second series of tests. The other
materials used in the second test series were undoped calcium zirconate
and a heavily doped (approximately twice the dopant level of S ) cal-
cium zirconate. In addition, the zinc electrodes of a group of three
cells with calcium zirconate separators were treated with lead acetate
(- 28 mg Pb per plate) to measure whether zinc dendrite penetration
was inhibited.
This report contains the results of the cell testing of inorganic
separator materials selected on the basis of previous screening tests,
and also contains the results of continued testing of silver-zinc cells
fabricated under a previous NASA contract (NAS 3-15686).
4

EXPERIMENTAL PROCEDURE
The Work Statement for NASA Contract NAS 3-17344 specified that
SRI was to continue testing silver-zinc cells fabricated and placed on
various long-term tests under Contract NAS 3-10928, continued on Con-
tract NAS 3-15686, and further continued under the present contract.
The cells were to be tested, according to the established schedule,
until the cells failed or until the end of the contract.
The work statement also called for analysis of all cells that
were tested to failure in this program. Failed cells were to be disas-
sembled, the causes of failure were to be determined by examining the
cells using appropriate techniques, and failure analysis data were to
be transmitted to the NASA project manager.
During this program, SRI and the NASA project manager jointly
decided that some cells that failed in testing at SRI would be analyzed
at NASA-Lewis. Complete data on all failed cells analyzed at SRI were
to be transmitted to the NASA project manager as appendices to the
Monthly Progress Reports.
Furthermore, SRI was to formulate separator materials of the three
materials previously selected under Contract NAS 3-15686, fabricate
materials into battery separators, assemble these separators into cells,
and then test the cells. After analysis of the cell test data, a fur-
ther selection of materials was to be made, and these materials were to
be fabricated into battery separators and assembled into cells for
testing.
5

Testing of Original MDC Cells
The testing regimes for the cells remaining on test or requiring
failure analysis after completion of Contract NAS 3-15686 are shown
in Table 1. These regimes are the same ones used under the above cited
contract.
Battery Separator Preparation
All separators used in the two-plate cells were prepared according
to the proprietary procedures developed at McDonnell-Douglas Corporation,
except where minor modifications, such as mechanically dipping the
separator bags, resulted in improved battery separators.
Battery separators were made in the form of a bag or envelope
from specially treated fuel cell asbestos. These bags were then coated
with a uniform 0.005-inch thick layer of the separator material by
dipping the bags in a slurry of the appropriate material. The actual
thickness was held to 0.127 ± 0.025 mm.
The slurries were prepared according to established procedures.
All inorganic powders were screened through a 325-mesh screen to
remove tramp material and agglomerates. A slurry was made up from
inorganic material, resinous binder, plasticizer, and solvent, and
mixed in a ball mill for from 15 to 16 hours. The slurry was then
screened through a 325-mesh sieve to remove agglomerates of ceramic
material and undissolved polymer, and chips from the mill-mixing media.
After these steps, the viscosity was adjusted if necessary, and the
slurries were bottled for subsequent use in the dipping operation.
The compositions and procedures essentially followed those cited
in U.S. Pat. No. 3,625,770. No extraordinary problems were encoun-
tered in preparing the slurries.
6

Table 1
CYCLING REGIMES
Conditions Charging
Regime Cycling VoltageFrequency Discharge Charge
Code Period Limit
(% DOD) _ (per cell)
VK-1 (10) 24 hr one cycle/day 2A for 2 hr 0.32A for 22 hr 2.02
VK-2 (7.5 & 15) 24 hr 2 different (a) 3A for (a) 0.45A for 2.00
cycles per day, 1 hr 7 hr
(a) & (b) (b) 3A for (b) 0.45A for
2 hr 14 hr
100% DOD 1 mo. 1 cycle followed 10A to 1.00V, 1.5A to 2.OOV 2.00
(NHS-114 Series) by charged stand followed by limit
for 1 month 2A to 1.00V
100% DOD defined by as frequently as 6A to 1.00V, 1.5A to 2.OOV 2.00
(HS-54-5,6, & charge-disch. convenient, with followed by limit
HS-123-GX) conditions charged stand 2A to 1.00V
between cycles
Modified (10.5) 24 hr one cycle per 0.5A for 2 hr 0.06A for 22 hr 2.02
VK-1 day
(HS-16 Series)
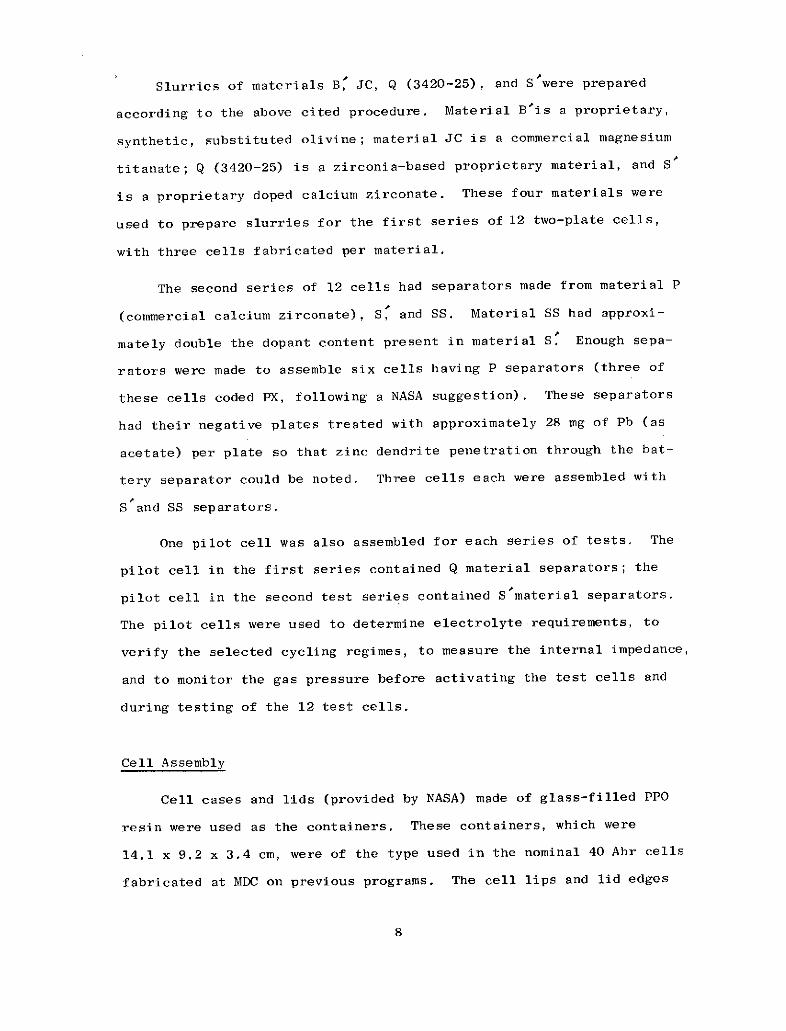
Slurries of materials B, JC, Q (3420-25), and S'were prepared
according to the above cited procedure. Material B is a proprietary,
synthetic, substituted olivine; material JC is a commercial magnesium
titanate; Q (3420-25) is a zirconia-based proprietary material, and S'
is a proprietary doped calcium zirconate. These four materials were
used to prepare slurries for the first series of 12 two-plate cells,
with three cells fabricated per material.
The second series of 12 cells had separators made from material P
(commercial calcium zirconate), S, and SS. Material SS had approxi-
mately double the dopant content present in material S. Enough sepa-
rators were made to assemble six cells having P separators (three of
these cells coded PX, following a NASA suggestion). These separators
had their negative plates treated with approximately 28 mg of Pb (as
acetate) per plate so that zinc dendrite penetration through the bat-
tery separator could be noted. Three cells each were assembled with
S and SS separators.
One pilot cell was also assembled for each series of tests. The
pilot cell in the first series contained Q material separators; the
pilot cell in the second test series contained S material separators.
The pilot cells were used to determine electrolyte requirements, to
verify the selected cycling regimes, to measure the internal impedance,
and to monitor the gas pressure before activating the test cells and
during testing of the 12 test cells.
Cell Assembly
Cell cases and lids (provided by NASA) made of glass-filled PPO
resin were used as the containers. These containers, which were
14.1 x 9.2 x 3.4 cm, were of the type used in the nominal 40 Ahr cells
fabricated at MDC on previous programs. The cell lips and lid edges
8

were lightly abrasive-blasted to deglaze and clean the surfaces that
would be in contact with the RTV rubber sealant. The cases were
washed in deionized water and dried with warm air before the internal
components were installed in them. Before blasting the lids, it was
necessary to pre-tin the upper portion of the silver-plated, hollow-
steel terminal posts.
The respective electrodes were very carefully inserted into the
preshaped separator bags. A U-shaped Teflon sling enclosing one posi-
tive and one negative electrode was sandwiched between two plastic
shims of appropriate thickness. The assembly was then gently pushed
into the cell case. The electrode pack fitted snugly in the cell
case, with very little excess void volume. The tabs were passed
through the hollow electrode posts of the lids, whose edges were pre-
coated with RTV silicone rubber (the cell lips were also precoated with
RTV rubber), and the lids were seated. The extruded RTV rubber was
molded into a neat fillet along the edges. After a half-day cure, the
tabs were soldered to the posts, making a complete solder seal over
the posts, after gently scavenging acetic acid vapors (from the RTV
rubber) with a gentle stream of clean air passing into the cell.
All cells of the first series were activated with 45% KOH (approxi-
mately 35 to 36 cc) as determined from the pilot cell. This quantity
was established to make a final electrolyte level (vacuum filling and
one day soak) that would be about 3 to 4 mm below the tops of the bags.
As requested by NASA, the second series were activated with a 30 cc fil-
ling of 45% KOH.
Following activation, the cells were heat-treated at 1000C for 24
hours (filler plugs were installed but not sealed). After the cells
were cooled from the heat treating, the filler plugs were sealed and
the cells given their formation cycles: Each plug had a small drilled
9

hole, back filled with RTV rubber to permit blowout in case of danger-
ous pressures.
Cell Testing
Table 2 displays the details of the formation cycle and the regu-
lar 100% DOD continuous cycle for the first and second series of cells.
All regular 100% DOD cycle testing was controlled by automatic equip-
ment originally designed and used for testing the 40 Ahr cells on the
VK-2 regime on Contract NAS3-15686. The control resistors were adjusted
for the currents required by the two-plate cells.
On the regular 100% DOD cycle, the cells were charged from a
constant-current power supply until each cell reached 2.050 V ± 2 mV,
at which time appropriate relays switched the cells to a constant-
potential power supply, set at 2.000 V. After a lapse of 10 hours, a
time clock switched all cells to the discharge position; each cell
discharged through its own adjustable transistor-resistor load. A cell
that reached 1.000 V ± 2 mV before the full two-hour period allotted,
was automatically switched to the open-circuit position, to await the
time clock switching to charge again after the lapse of the 2 hours.
An electrically operated counter logged the number of cycles.
Each cell had its voltage monitored in a succession of 2-second
time intervals so that the 12 test cells plus the pilot cell plus a
reference-voltage signal (14 positions) would be scanned in approxi-
mately one-half minute. This arrangement allowed a maximum of only
one-half minute for a cell to discharge below 1.000 V, or to charge
The first several cycles in the first series had a limit of 2.000 ± 2 mV
but was increased to 2.050 V due to inadequate charging.
10

Table 2
CHARGE-DISCHARGE CONDITIONS
TWO PLATE CELLS
Format ion Cycle
Rate Voltage Limit
Charge
Series 1 0.30 Amps -- C/20) 2.005 V
Series 2 0.33 Amps (- C/20) 2.050 V
Discharge
Series 1 A 1.1 Amps (- C/5 ) 1.00 V
B 0.55 Amps -- C/10) 1.00 V
Series 2 A 1.34 Amps (- C/5 ) 1.00 V
B 0.693Amps (- C/10) 1.00 V
100% DOD Regular Cycles
Rate Voltage limit Time limit
Charge
Series 1 0.55 Amps (- C/10) 2.05 V. Then 2.00 V float 10 hrs
Series 2 0.57 Amps (- C/10) 2.05 V. Then 2.00 V float 10 hrs
Discharge
Series 1 2.42 Amps '- C/2 ) 1.00 V 2 hrs
Series 2 2.71 Amps (- C/2 ) 1.00 V 2 hrs
11

above 2.050V before the actuating relays performed their assigned
switching function. Separately, another device automatically sampled
each cell's voltage successively for 6 seconds, feeding the signals to
a recorder to create a graphic display. A separate 24-channel Esterline-
Angus recorder sampled the current passing through each cell (each cell
passed its current through its own calibrated shunt), printing out its
value and identifying number. The current for any given cell was sam-
pled once every 2 minutes.
The first series of cells received three formation cycles before
commencing the regular 100% DOD cycles as defined in Table 2. After a
few regular 100% DOD cycles, it became apparent that the voltage limit
of 2.000V on the constant-current supply was too low because the dis-
charge capacities were low. Approval was obtained from NASA to raise
the voltage on the constant-current supply to a value permitting the
cells to charge to 2.050V ± 1 mV. This increased charge improved the
discharge performance of all cells. During the tests of the first
series of cells, accurate discharge times and currents were determined,
and discharge capacities were calculated for each cell three times per
week. In this way, capacity decline with increasing cycles could be
monitored. At Cycle 24, a malfunction in the charging equipment allowed
the cells to receive more than the allotted charge; however, the effect
was apparently not damaging.
Early in the testing (Cycle 37), samples of cell gas were with-
drawn for chromatographic analysis. Because the compositions varied
so widely, cell leaks were suspected but not verified during the
testing. Nevertheless, a pressure transducer was fitted to the pilot
cell for a short period to observe pressure excursions. Later, the
transducer was fitted to Cell S-1-2. Both cells had leaks, which were
sealed over with paraffin wax.
12

After Cycle 130, all cells were put on open-circuit stand (charged)
for 4 days to check them for "slow shorts." The residual capacity was
then determined. At this point, many of the cells were close to the
end of life (some could cycle poorly only to Cycle 142).
The second series of cells received two formation cycles (c.f.
Table 2) before commencing the regular 100% DOD cycling. In this case,
the constant-current voltage limit on the cells for formation and regular
100% DOD cycling remained at the 2.050 V limit previously established.
The constant-potential power supply for 100% DOD cycling was held at
2.000 V as before. Tests were controlled by the same automatic equip-
ment used in the first series of cells.
The pilot cell was fitted with a pressure transducer to measure the
pressure excursions during experimental charge and discharge conditions,
when the charge voltage limit was raised to 2.100 V. Discharge capaci-
ties were determined once per week, as arranged by joint agreement by
NASA and SRI. These checks provided sufficient control to enable changes
to be made if needed. Cycling was continued past the capacity failure
point (contractually defined as deliverance of less than 50% of the
original capacity) by mutual agreement between NASA and SRI. Cycling
terminated with Cycle 120. A formation charge-discharge cycle was
then applied to determine the capacity of all cells followed by failure
analysis.
13

RESULTS
The results are presented in two separate categories: (1) those
that relate to the cells tested at SRI but fabricated at MDC and (2)
those that pertain to the two-plate cells fabricated and tested by SRI,
using the selected optimum separators.
Test Results on the Cells Manufactured at MDC
Of the 141 cycling cells transferred to SRI on Contract NAS 3-10928,
29 failed cells were returned to NASA for failure analysis and 48 were
analyzed at SRI. The results were previously reported.7 Thirty cells
failed during this program and the results of the failure analyses are
given below. This testing program was terminated on 10 October 1973.
The 34 cells on test at that time which included 10 cells that had
failed but had remained on test, will be returned to NASA.
The breakdown of all 141 cells into the various test groups and
test conditions is shown in Table 3. A full description of the various
test groups (and subgroups) and test conditions, together with the
definitions of the objectives for these are provided in Reference 7.
Viking Cell Group (Cycling Regime: VK-2)
Although the uncertainties and variations associated with the
small numbers of cells per subgroup are considerable, several major
trends are apparent (Table 4), further supporting the observed trends
cited in Reference 7.
Preceding page blank15 --

Table 3
SUMMARY OF CELL TEST GROUPS AND CONDITIONS
No. of
Experimental No. of Failed
Factor Cells Cells Regime Comments
3-Plate Pilot
Cells 6 6 VK-1 3-plate cells; all negatives bagged; some positives bagged.
Viking 4 4 VK-2 Standard Design 7; 45 Ahr original capacity.17 15 Charged stand, 1
0'-42
0C for 21+ months prior to cycling.
15 15 Float stand at 100-32
0C for 21+ months prior to cycling.
15 11 Discharged stand at 240C for 21+ months prior to cycling.
4 - Stand Discharged stand+- o
Design 5 4 VK-1 Design 7 (6b /5b ); 24 Co
Variation 5 2 Design 6 (4b+ //5b ); 24 C; extra separator layer between the
4 positive bags and 5 negative bags5 1 Design 8 (6b /£/5b ); 24 C; extra separator layer between the
6 positive bags and 5 negative bags
Temperature- 4 4 VK-1 Tested as a battery at 24 C
Battery/Cell 2 2 Tested as single cells at 24 C All cells of Design 74 2 Tested as a battery at 10 C
2 2 Tested as single cells at 10°C
3 3 Tested as a battery at 32 C
Plate Lock 4 4 VK-3 Design 7, no plate lock, environmentally tested
4 4 Design 7, epoxy plate lock, normal cure; no environmental test
3 3 Design 7, epoxy plate lock, normal cure; environmental test
4 4 Design 7, epoxy plate lock, normal cure plus 24 hrs at 100 C;environmentally tested
1 1 Design 7, GX film separator, plate lock, normal cure; environ-
mentally tested
20 17 100% DOD Charged stand, discharged about once per month
1 1 Stand Continuous charged stand since original 3 cycles
+Extra 2 2 100% DOD Design 5 (4b /L/5b ); extra supported separator layer between
bags.1 0 Design 7; 8 wraps of GX film plus double plate lock
3 3 Design 5; on 7 to 9-month stand before cycling.5 5 Design 3 (5b /6b ); on 7 to 8.5-month stand before cycling.2 2 Design 2 (Sb /6b ); only negatives were bagged.
TOTALS 141 117
Status as of 10 October 1973.
The designs used for the cells tested under this program are described in Reference No. 6. As an exampleof the design notation, 6b+/5b
- indicates that a cell comprises six bagged positive and five bagged
negative electrodes. The letter (1) indicates presence of an additional layer (usually an asbestos-freecomposite of binder and the inorganic material) between each pair of adjacent positive and negativeelectrodes. Capital letter (L) indicates that the extra layer consists of the semiflexible separatormaterial used to fabricate separator bags.
16

Table 4
CYCLING RESULTS: VIKING CELL GROUP*
(Status as of 10 October 1973)
Early-Cycling Category: 4 Total Cells Charged-Stand Category: 17 Total Cells
No. of failed cells 4 Subgroup standing at 10 C: total cells
Range and average wet life (days) 1142-1300 [1237] No. of cells failing reconditioning ORange and average of cycle life (cycles) 2004-2318 [2186] No. of cells not failed in cycling 2Wet life (days)
1553Float Charged-Stand Category: 15 Total Cells Cycle life (cycles) 1569-1573
Subgroup standing at 10oC: total cells 5 No. of cells failed in cycling 3Subgroup standing at 1C: total cells 5 Range and average of wet life (days) 795- 8611 823]No. of cells failing reconditioning 1 Range and average of cycle life (cycles) 99- 209[ 150]No. of cells failed in cycling 4
Range and average of wet life (days) 869-1035 C 929] Subgroup standing at 24C: total cells 5Range and average of cycle life (cycles) 152- 480 [ 269] No. of cells failing reconditioning
Subgroup standing at 24C No. of cells failed in cycling 4No. of cells failing reonditioning Range and average of wet life (days) 994-1107F1039]No. of cells failed ing reconditycling Range and average of cycle life (cycles) 474- 699[ 565]No. of cells failed in cycling 3Range and average of wet life (days) 903-1228 [1069] Subgroup standing at 32 C: total cells 5Range and average of cycle life (cycles) 218- 885 [ 668] No. of cells failing reconditioning
5
Subgroup standing at 320C oSubgroup standing at 32C Subgroup standing at 42 C: total cells 2No. of cells failing reconditioning 4 No. of cells failing reconditioning2
No. of cells failed in cycling 1
Wet life (days) 974 isharged-Stand Category: TotalCycle life (cycles) 379 15 Total Cells
Subgroup of virgino standing cells
No. of cells failing reconditioning 2
No. of cells not failed in cycling 3
Range and average of wet life (days) 1266-1486[1392Range and average of cycle life (cycles) 1223-1473[1389]
No. of cells failed in cycling 6
Range and average wet life (days) 1237-15071360]Range and average of cycle life (cycles) 1163-1447[1260]
Subgroup of cells with charged-stand history
No. of cells failing reconditioning 2
No. of cells not failed in cycling 1
Wet life (days) 1488
Cycle life cycles 1469
No. of cells failed in cycling 1
Wet life (days) 1474Cycle life (cycles) 1447
Viking group cells were cycled on the VK-2 regime, with cells atlaboratory temperature (nominally 24oC).
Discharge stand was at 24 C.
#That is, cells not cycles (except in forming step) prior to stand;this was the standard condition for all Viking cells with exceptionof the subgroup of discharged-stand cells with charged-stand history,

The trends are as follows:
(1) Cell survivability after reconditioning, cycle life,
and wet life is higher for discharged stand (21 to 25
months) than for charged or float-charged stand (also
for 21 to 25 months).
(2) Cells that are cycled soon after activation (essentially
no stand period) have the best cycle life expectancy,
exceeding 2000 cycles.
(3) If the standing temperature is increased, the survival
rate of reconditioned charged and float-charged stand
cells decreases.* The effect of standing temperature
is marked: While only one of the 10 cells standing at
320C or 420C survived, 9 out of 10 cells survived
standing at 100 C. Of the cells standing at 240 C, 7
out of 10 cells survived reconditioning.
(4) An unexpected finding was that cells surviving charged
or float-charged stand at 100C had markedly inferior
cycle life compared to the subgroups standing at 24 C.
Cell Design Variation Group (Cycling Regime: VK-1)
Two of the three cell designs (Designs 6 and 8) had extra layers
of separator between cell plates. As expected, the extra separator
layers appear to delay cell failure in cycling. With due regard for
small number statistics, this trend is noted in Table 5. Design 6
had two out of five cells fail, Design 8 had one out of five cells
fail, but Design 7 had four out of five cells fail.
Temperature influence was not investigated for the discharged stand
cells.
18

Table 5
CYCLING RESULTS: CELL DESIGN VARIATION GROUP(Status as of 10 October 1973)
Design 7 (6b /5b ) subgroup: total cells (in battery) 5
No. of cells not failed in cycling 1Wet life (days) 1515Cycle life (cycles) 1254
No. of cells failed in cycling 4Range and average of wet life (days) 477-1388[ 991]Range and average of cycle life (cycles) 348-1127[ 763]
Design 6 (4b +//5b- ) subgroup: total cells (in battery) 5
No. of cells not failed in cycling 3Wet life (days)
1515Cycle life (cycles)
1305
No. of cells failed in cycling 2Wet life (days)
1077-1171Cycle life (cycles) 874- 964
Design 8(6b+ //5b - ) subgroup: total cells (in battery) 5
No. of cells not failed in cycling 4Wet life (days)
1515Cycle life (cycles) 1266
No. of cells failed in cycling 1Wet life (days)
1141Cycle life (cycles)
892
Cycling is on the VK-l regime, with all cells at laboratory temperature(nominally 24 C).
19

Temperature-Battery/Cell Group (Cycling Regime:VK-l)
The general trend of lower temperatures (below room temperature)
for cell or battery operation favors life expectancy, as notes in
Table 6. The two major trends may be summarized as follows:
(1) Operation of cells in batteries appears to reduce
cell wet and cycle life expectancy, presumably be-
cause of the additional stresses (excess voltage and/
or overcharge) imposed on the remaining cells if one
of the cells in a battery has lower voltage and
charge acceptance during impending failure.
(2) Cycling of cells below room temperature appears to
have a somewhat beneficial effect on wet stand and
cycle life, whether cells are cycled singly or as
a battery. However, this conclusion is weakened by
the observation that cells from the 320C battery
group had better average cycle life than those from
the 24UC battery. These findings must be considered
in the light of small number statistics and the fact
that impending failure of a single cell in a battery
can impose very high stresses on all remaining cells.
No comparison is possible for single cells since the
320C subgroup did not include single cells.
Plate-Lock Cell Group (Cycling Regime: 100% DOD)
During environmental testing of cells under Contract NAS 3-10928,
it-was shown that applying high shock loads to cells caused the elec-
trode packs to shift partly into the void space under the cell lids.
Although no catastrophic cell failures were caused by environmental
testing and the electrical performance of cells with shifted packs was
satisfactory, an epoxy plate lock and heat sealing of bag tops (to
localize electrodes within bags) were added as design features to one
group of cells. Testing of this group was continued under the current
program.
20

Table 6
CYCLING RESULTS: TEMPERATURE-BATTERY/CELL GROUP
(Status as of 10 October 1973).
0Subgroup at 10 C: total cells 6
No. of cells cycled individually 2
No. of cells failed in cycling 2
Wet life (days) 1334 -1444
Cycle life (cycles) 1198 -1305
No. of cells cycled as a battery 4
No. of battery cells failed in cycling 2
Wet life (days) 1528
Cycle life (cycles) 1336
No. of battery cells failed in cycling 2
Range and average of wet life (days) 757-785 [ 771]Range and average of cycle life (cycles) 572-598 [ 585]
0-Subgroup at 24 C: total cells 6
No. of-cells cycled individually 2
No. of individual cells failed in cycling 2
Range and average of wet life (days) 661 -1222
Range and average of cycle life (cycles) 541 -1096
No. of cells cycled as a battery 4
No. of battery cells failed in cycling 4
Range and average of wet life (days) 554-701 1 591]Range and average of cycle life (cycles) 429-576 1 466]
OSubgroup at 32 C: total cells 3
No. of cells cycled as a battery 3
No. of battery cells failed in cycling 3
Range and average of wet life (days) 837-1188 [ 958]Range and average of cycle life (cycles) 668-1019 [ 789]
Cycling is on the VK-l regime.
21

The cells of the plate-lock group were broken down into subgroups
that correspond to the factors examined. These subgroups and the re-
sults obtained in cycling these cells are shown in Table 7. The capa-
city loss during cell operation is shown in Figures 1 to 4 as the per-
centage of first formation capacity versus cycle number. No group was
clearly superior to any other, although the B and C subgroups tended
to have higher capacity retention, at least for the first 15 (approxi-
mately) cycles. At 50% of the formation capacities of surviving cells
in the B and C subgroups had an average of 27 and 30 cycles, respec-
tively, compared to surviving cells of subgroups A and D which had 26
and 24 cycles, respectively. At 70% of the formation capacity, sur-
viving cells of the B and C subgroups had 22 cycles each, compared to
surviving cells of subgroups A and D which had 20 and 18 cycles, respec-
tively. The reasons for variation in formation capacity are not clear.
One must exercise caution in interpreting small-number statistics,
especially in this case where curve smoothing methods were employed.
The anomalous dip in the curve of cell NHS-114-17 might be explained
by the gradual increase in shorting Zn dendrites, to Cycle 29, followed
by a gradual recession (decomposition) of the dendrites that caused the
slow shorts.
In examining the cycle lives to failure, as noted in Table 7, sub-
group D appears to be best, followed by subgroup C and then by subgroups
A and B. The wet lives follow the same pattern. Several trends are
shown by the test results:
(1) Plate locking tends to degrade the wet and cycle life
of cells; the effect is not very large but definitely
discernible.
(2) Extended curing of the epoxy cement used for plate
locking appears to reduce the degrading effect of
plate locking on cell life.
22

Table 7
CYCLING RESULTS: PLATE-LOCK GROUP(Status as of 10 October 1973)
100% DOD
Subgroup A (epoxy plate lock, normal cure, not environmentallytested), total cells
5
No. of cells not failed in cycling 1
Wet life (days) 1160
Cycle life (cycles) 34
No. of cells failed in cycling 4
Range and average of wet life (days) 605- 925F 7721Range and average of cycle life (cycles) 16- 27[ 22]
Subgroup B (epoxy plate lock, normal cure, environmentallytested), total cells 5
No. of cells not failed in cycling 1
Wet life (days) 1168
Cycle life (cycles) 34
No. of cells failed in cycling 4Range and average of wet life (days) 536- 923[ 771]Range and average of cycle life (cycles) 14- 27F 22]
Subgroup C (epoxy plate lock,.extended cure, environmentallytested), total cells 5
No. of cells not failed in cycling 1Wet life (days)
1166Cycle life (cycles)
34
No. of cells failed in cycling 4Range and average of wet life (days) 620-1013[ 8401Range and average of cycle life (cycles) 17- 31[ 24]
Subgroup D (control: no plate lock, environmentallytested), total cells 5
No. of cells failed in cycling 3Range and average of wet life (days) 755-1069[ 9181Range and average of cycle life (cycles) 21- 33[ 271
All cycling is at laboratory temperature (nominally 240C).
Two of these cells exploded on cycle 10 (wet life: 418 days) due to equipmentmalfunction; their wet and cycle life is not included in the data of the table.
23

120
SERIESNHS-114-1-5
100
< 80
z
S40 4
Regime: 100% DOD
Charge: 1.5A to 2.00V
Discharge A: 10A to 1.00V
Cell Stands Charged~1 month Between Cycles
0
5 10 15 20 25 30 35
CYCLE NUMBER
I-
SA-2285-1
FIGURE 1 OUTPUT CAPACITY RETENT!ON WITH CYCLE LIFE

120
19 SERIESNHS-114-16-20*
100
I-
< 20S80
16z
60
Ll.
I-0
Charge: 1.5A to 2.00V
u
Discharge A: 10A to 1.00V 17Discharge B: 2A to 1.00V
20 Cell Stands Charged~1 month Between Cycles
*Cells 16 and 20 exploded on stand.
0 5 10 15 20 25 30 35CYCLE NUMBER
SA-2285-2
FIGURE 2 OUTPUT CAPACITY RETENTION WITH CYCLE LIFE

120
SERIESNHS-114-26-30
100
so
I-
o 80
u60 0
< 226
2740
I-N
0 29
UJ
Regime: 100% DOD
Charge: 1.5A to 2.00VDischarge A: 10A to. 1.00V
20 t Discharge B: 2A to 1.00V
Cell Stands Charged~1 month Between Cycles
5 10 15 20 25 30 35
CYCLE NUMBERSSA-2285-3
FIGURE 3 OUTPUT CAPACITY RETENTION WITH CYCLE LIFE

120
33
SERIESNHS-114--31-35*
100
35
S80
o/31
I--
o
iC-
a. Regime: 100% DODCharge: 1.5A to 2.00VDischarge A: 10A to 1.00V
Discharge B: 2A to 1.00V20 Cell Stands Charged
-1 month Between Cycles
*Cells 33 and 35 exploded on cycling-faulty equipment. 332
0 5 10 15 20 25 30 35CYCLE NU'MBERS
SA-2285-4
FIGURE 4 OUTPUT CAPACITY RETENTION WITH CYCLE LIFE

(3) Environmental testing does not seem to degrade wet life and
cycle life of plate-locked cells.
(4) Cells with extended cure epoxy plate lock accumulated
more cycles to both the 70% and 50% capacity retention
levels than cells in all other subgroups.
Group of Extra Cells (Cycling Regimes: VK-1 and 100% DOD)
In this group, cell design was the major factor being tested. Several
cells of varying backgrounds were collected. The designs (Reference No. 6)
ranged from the early Design 2, which has only the zinc negatives bagged,
to a modification of Design 5, has all electrodes bagged plus an extra
separator layer between the bagged electrodes. The results obtained
with this group of cycling tests are given in Table 8; the major trends
are summarized as follows:
(1) As expected, cells of Design 2, which have fewer
separator layers for a primary-type application,
failed much earlier in cycling. The extra layer of
semiflexible separator between the bagged electrodes
of Design 5 appears to improve cycle life over that
of cells Design 3, which have no extra layer.
(2) Although the zinc negatives of Design 5 have a lower
capacity than those of Design 3, this lower capacity
has not led to low capacity failures. Because of the
shallow cycles of the VK-1 regime applied to these
subgroups, nominally low capacity will not become a
failure mode until all capacity has declined to from
10% to 15% of its original value.
(3) A comparison* of the limited data for cycling of
Design 3 and Design 5 cells, using the VK-1 regime,
with the data in Tables 5 and 6 suggests that a
7- to 9-month wet stand--even in the charged or
float-charged conditions--does not noticeably de-
grade wet life and cycle life.
Although there are differences in design, these differences are not con-
sidered large enough to invalidate a comparison in terms of parameters
other than cell design.28

Table 8
CYCLING RESULTS: GROUP OF EXTRA CELLS
(Status as of 10.October 1973)
VK-l regime
Design 2 subgroup: total cells 2
No. of cells failed in cycling 2Average wet life (days) 646Average cycle life (cycles) 283
Design 3 subgroup: total cells 5
No. of cells failed in cycling 5Range and average of wet life (days) '996-1375[1194]Range and average of cycle life (cycles) 636-997 [ 828]
Design 5 subgroup (VK-1): total cells 3
No. of cells failed in cycling 3Range and average of wet life (days) 1284-1319[1297]Range and average of cycle life (cycles) 922- 957[ 935]
Design 5 subgroup (100% DOD): total cells 2 100% DOD
regimeNo. of cells failed in cycling
Wet life (days) 884-1468Cycle life (cycles) 136- 160
Design 7 cell (with SWRI-type GX separator):total cells 1
No. of cells not failed in cycling 1Wet life (days) 1146Cycle life (cycles) 51
Cell cycling is at laboratory temperature (nominally 24 C).
Cells HS-47-2,8 were cycled to failure at Astropower Laboratory.
Cells were on 7-month stand prior to cycling (2 cells on charged stand,3 cells on float-charged stand)
Cells were on 7 to 9 month stand prior to cycling (one cell each oncharged stand, float-charged stand and discharged stand).
29

Failure Analysis
A detailed description of the faults and failures of these cells,
and of their significance has already been published.? However, the
faults and failures of the last 30 cells are tabulated in Table 9 of
this report. Table 9 displays the incidence of the various kinds of
faults. No drastic differences are evident among this group of 30
failed cells, compared to the 48 failed cells reported in Table 14 of
Reference 7. The slightly higher incidence of split bags (23% vs. 19%)
in the current group is probably due to the longer cycle lives and wet
lives, which allows more opportunity for the bonded bag edges to weaken.
The percentage of cells in the current group that failed by zinc nodule
shorting is 14% vs 20% in the previous group, However, the percentage
of failures in the current group by zinc-dendrite or external zinc mass
shorting is 19% versus 11% in the former group. Nevertheless, the per-
centage of shorts by both types of zinc shorting is approximately the
same in both groups. The exact mechanism that favors zinc nodule shorts
over zinc dendrite shorts is not clearly established, so the differences
between the two groups is unresolved.
It is difficult to distinguish low capacity per se (implying that
an electrode, such as the zinc electrode, has a portion of its working
material electrochemically immobilized) from electrodes that are incom-
pletely charged because slow shorts have bypassed some of the current.
Obviously, slow shorts can cause discharges to give the appearance of
low capacity. One can, of course, set up individual cycling equipment
for such cells, with suitable monitoring and recording of the electrical
behavior, to distinguish between the two kinds of low capacity, but such
extra testing was beyond the scope of this program.
The 30 cells analyzed in this program had a 3% incidence of zinc
electrode slumping. However, the incidence of erosion or shedding of
30

Table 9
CELL FAILURE ANALYSIS: STATISTICAL BREAKDOWNOF FAULTS AND FAILURES*
Total number of cells analyzed at SRI 30
Faults
Leaks 21
Split bags 20
Zinc nodule shorts (confirmed) 12
Zinc dendrite shorts (probable) 17
Low capacity 1
Zinc electrode slumping 3
Zinc electrode erosion 14
Total Faults 88
Physical and (or) Formal Causes of Cell Failure
Zinc nodule short 12
Zinc dendrite or filament short 17
Nominally low capacity 1
Total Failures 30
For cells failed between 31 October 1972 and 10 October 1973.
31

working material from the zinc electrodes in the current group was equal
to 16%. This erosion and shedding is probably associated with the longer
cycle life and wet life, which gave more opportunity for redistributing
the zinc-containing material that existed outside of the bags. The
details of the failure analysis of the 30 cells are given for each
category, group and subgroup in Tables 10 to 16.
Failure Modes: Breakdown by Cell Test Group
The overall failure statistics in Tables 10 to 16 indicate that
zinc nodule and dendrite (filament) shorting together accounted for
nearly all failures in each cell test group. However, there were suf-
ficient systematic differences in the fault and failure patterns of
cells from different groups to warrant a breakdown of failure analysis
findings. This breakdown by cell test group is also shown in Tables 10
through 16. The major findings from the analysis, which are similar to
those cited in Reference 7, can be summarized as follows:
(1) Zinc nodule shorts were the dominant failure mode of
cells subjected to 100% DOD with charged stand between
periodic discharges. This failure mode is also domi-
nant for Viking cells of the charged and float-charged
stand subgroups that failed during stand or early in
subsequent cycling, and for the temperature-battery/
cell group. Inasmuch as several more cells from other
groups failed early in life by this mode, failure analy-
sis has established zinc nodule shorts as the major cause
for cell failures in long cycling. Zinc nodule shorts
were not observed in the few failed cells from the Viking
discharged-stand category, but were observed in Viking cells
that were placed on cycling immediately after being acti-
vated.
(2) Shorts associated with the presence of dentritic and
mossy zinc (and ascribed to zinc filament penetration)
are the dominant failure mode for those cells from the
Viking and other groups that attained at least several
hundred cycles on the VK-1 and VK-2 regimes.
32

Table 10
CELL FAILURE ANALYSIS, 3-PLATE PILOT CELL
(Status as of 10 October 1973)
Cycle Wet Bag
Cell No. Life Life(d) Leaks Splits Slumping Erosion Failure Notations
HS-16-12 777 1230 + + + Probable shorting through both Zn
dendrites, and through the large mass
of Zn bridging the splits in both
Zn and Ag bags.
Inadequate RTV rubber seal.
Table 11
VIKING, FLOAT-CHARGED STAND CATEGORY
(Status as of 10 October 1973)
Stand Cycle Wet BagO
Cell No. Temp. C Life Life(d) Leaks Splits Slumping Erosion Failure Notations
HS-59-24 24 t 810 1222 + - A Zn shorting nodule was found
Cycled on the VK-2 regime
Float-charged stand for 24 months prior to cycling.

Table 12
VIKING, DISCHARGED WET-STAND CATEGORY
(Status as of 10 October 1973)
Stand Cycle Wet Bag
Cell No. Temp. C Life Life(d) Leaks Splits Slumping Erosion Failure Notations
HS-59-30 24 1447 1507 + + Shorting through large Zn mass
bridging splits in both Zn and Ag
bags.
HS-90-1 24 1163 1237 - + Shorting through numerous Zn
dendrites.
Cycling on the VK-2 regime.
tn discharged-stand for 25 months prior to cycling.
On discharged-stand for 21 months prior to cycling.
Table 13
VIKING, CONTINUOUS CYCLING IMMEDIATELY AFTER ACTIVATION
(Status as of 10 October 1973)
Cycle Wet Bag
Cell No. Life Life(d) Leaks Splits Slumping Erosion Failure Notations
HS-86-1 2156 1218 + + A Zn shorting nodule was found.
HS-86-2 2004 1142 + + 3 Zn shorting nodules were found.
Cycled on the VK-2 regime.

Table 14
CELL FAILURE ANALYSIS, TEMPERATURE-BATTERY/CELL GROUP
(Status as of 10 October 1973)
Temp. Cycle Wet Bag
Cell No. C Life Life(d) Leaks Splits Slumping Erosion Failure Notations
HS-61-ll 10 1226 1369 + + A small Zn shorting nodule was found.
Shorting also probably occurred through
the massive Zn deposits bridging the
Zn and Ag bag splits.
HS-82-4 32 1019 1188 - + + Probable Zn dendrite shorts.
Cycled singly.
Cycled in a battery.

Table 15
CELL FAILURE ANALYSIS, PLATE LOCK CELL GROUP
100% DOD Regime*
(Status as of 10 October 1973)
Wet Bag
Cell No. Cycle Life Life(d) Leaks Splits Slumping Erosion Failure Notations
NHS-114-0 3 1050 + - Gradual self-discharge of Zn plates
NHS-114-3 27 925 - - Probable Zn dendrite short
NHS-114-4 27 925 + - - - Probable Zn dendrite short
NHS-114-16 27 923 - + - - A shorting Zn nodule was found
(Cell exploded)
NHS-114-18 24 837 + + - - A shorting Zn nodule was found
NHS-114-19 22 793 + - - + A shorting Zn nodule was found
NHS-114-26 31 1013 - + - + A shorting Zn nodule was found
NHS-114-29 26 914 - - - - Probable Zn dendrite short. The
remains of a large decomposed
dendrite was found.
NHS-114-30 22 789 + - - - A shorting Zn nodule was found
NHS-114-31 28 929 + - - + A shorting Zn nodule was found
NHS-114-32 33 1069 - - - + Probable Zn dendrite short
NHS-114-33 10 417 - + - - Cell exploded because of cycling
equipment failure.
Except NHS-114-0 which remained on continuous charged stand after the 3 formation cycles.
All others were on approximately one month charged stand between cycles.
Inadequate RTV rubber seal.

Table 16
CELL FAILURE ANALYSIS, DESIGN VARIATION AND EXTRA CELL GROUPS(Status as of 10 October 1973)
Design Cycle Wet Bag-Cell No. No. Regime Life Life(d) Leaks Splits Slumping Erosion Failure Notations
HS-51-4 3 VK-1 997 1342 + + - + A shorting Zn nodule was found* t
HS-51-7 3 VK-l (971)(1375) - + - + Probable Zn dendrite shorts1248 1667
HS-54-2 5 VK-l 922 1284 + + + Probable Zn dendrite shorts, and
possible minute nodule(s) short
HS-54-5 5 100% DOD 160 1468 + + Probable Zn dendrite shorts, and
low capacity
HS-54-7 5 VK-l (925)(1288) + + + Probable Zn dendrite shorts1104 1470
HS-66-1 7 VK-l 724 985 + + Shorting through Zn mass
bridging Zn and Ag bag splits
HS-66-3 7 VK-l 1127 1388 + + + + Shorting through Zn mass
bridging Zn and Ag bag splits
HS-66-5 7 VK-l (851)(1112) + + + + Shorting through Zn mass1164 1428 bridging Zn and Ag bag splits
HS-66-10 6 VK-1 1109 1316 + + + + A shorting Zn nodule was found
HS-66-11 8 VK-1 892 1141 + + - - A shorting Zn nodule was found.
Cycled singly; all others cycled in a battery.
Numbers in ( ) indicate cycle number or wet life in days at time of first failure (cell wasallowed to continue cycling). The other number refers to cycle number or wet life in days atconclusion of cycling.

(3) Nominally low cell capacity depends on the criteria
applied in defining it. One cell was judged to have
failed in this mode because it delivered only approxi-
mately 20% of its nominal rated capacity. Presumably,
such a cell would not be used when it reaches such a
low capacity. All cells seem to decline in capacity
after the first several cycles, and the usefulness of
a cell, if it does not fail in some other mode, depends
on the delivery of a pre-established minimum capacity.
Accordingly, the initial capacity is made high enough
to accommodate the decline in capacity over the cycle
span desired. The shallow cycling regimes VK-1 and
VK-2 allow a long cycle life of cells having large
initial capacities, as compared to short cycle life
at the deep depths of discharge in other cells of
similar initial capacity.
(4) Bag splits were common in all cell groups, except
those in the Viking charged stand, in the float-
charged stand categories, and infrequently in the
plate-lock cell subgroup cycled on 100% DOD. There
may be a correlation between bag splits (especially
when both Zn and Ag bags are split) and failure by
shorting through the mass of Zn external to the bags.
(5) All cells with lids sealed only with RTV silicone
adhesive, developed leaks. A substantial percentage
of the cells in all other groups also leaked, but no
direct correlation is apparent between cell leakage
and a particular failure mode.
(6) About one-half of all cells showed zinc electrode
erosion. About 57% of these cells and all cells
showing electrode slumping were from batteries and
cells from the Design Variation and Extra Cell groups.
All three instances of slumping originated in cells
operated in a battery in the design variation group.
Test Results on Cells Made at SRI
Two test series of cells were made at SRI. Electrodes were sup-
plied by a vendor that made them according to NASA specifications
(similar or identical to the electrodes used in the cells made at MDC).
38

The cell cases and lids (electrode posts already attached to the lids)
were supplied from NASA stock. SRI fabricated the separators and added
electrolyte and other minor components necessary to complete the cells.
Each series comprised 12 test cells, grouped by threes as shown in
Table 17. Each group represents a particular separator composition.
Graphs of percent of formation capacity versus number of cycles display
the decline in capacity. These graphs are shown as Figures 5 to 8 for
the first series and as Figures 9 to 12 for the second series. The
performance of each cell in a group and the group average are plotted
in each graph. One may conceive of an envelope of curves or a band
that would define each group average curve. Table 17 lists the group
average numbers obtained for both test series.* The differences between
the two series appears to be quite substantial, and these differences
may be explained, at least in part, in the history of the cells.
Testing of the First Series of Cells
The formation cycles for the first series of cells was performed
on a five-station charge-discharge panel, having an electromechanical
cutoff meter as the limit control for the 2.005V discharge limit and
the 1.000V discharge limit. Earlier experience in cycling the MDC
(NHS-114 group in Table 7) cells indicated that a few millivolts dif-
ference in the set value could make a significant difference in the
input or output. The meter was always set correctly according to a
reference standard. However, vibrations of the floor or building
triggered the meter to cutoff at an equivalent of a few to several
millivolts before the set point. Variations in observed capacities
Specific cycle performances appear in Tables 20 and 21 and are derivedfrom Figures 5 - 8 and 9 - 12.
39

120 I I
I-
F- -
80
2 60 -S CAPACITY FAILURE BASELINE
z w
o 60 o-I-
z ww w
20 -
0 - - - B'-1-2. -. B '- 1-3 r -
• Group Average
0
-J
0 20 40 60 80 100 120 140
NUMBER OF CYCLES (100% DOD) FIRST SERIESSA-2285-5
FIGURE 5 CAPACITY CHANGE WITH CYCLING

120 2 I I I I ! I I
I--
100 -
o
z
0IL0z
so
0
>- >
S80
,<
< 60
NFLL 1 DS
A- -- / --.-- , -60 -- I-
20 0- C-1-i
0- - _JC-1-2
0 20 40 60 80 100 120 140
NUMBER OF CYCLES (100% DOD) FIRST SERIESSA-2285-6
FIGURE 6 CAPACITY CHANGE WITH CYCLING

120-
100 0Oz
0oT-
\ o
80 wL
I ULL
20
: -60 Ur
0U- 2 <
W V
CC 40 Xuw
CELL NUMBER
0--- 0-1-2
0- Group Average
0I II I I II I I I I
0 20 40 60 80 100 120 140
NUMBER OF CYCLES (100% DOD) FIRST SERIESSA-2285-7
FIGURE 7 CAPACITY CHANGE WITH CYCLING

120I I I I
100
<80 - RESIDUAL CAPACITY AFTER 4 DAYS ON OPEN CIRCUIT
40 -
60
0O Z---\ S'-1-1 I-
o ,
OCAPACITY FAILURE BASELINE
w 0
-O --- S'-1-1 g-
-
0---- Group Average
40 -
0 20 40 60 80 100 120 140
NUMBER OF CYCLES (100% DOD) FIRST SERIESSA-2285-8
FIGURE 8 CAPACITY CHANGE WITH CYCLINGFIGURE 8 CAPACITY CHANGE WITH CYCLING

120I I
100
I-
80
_ REFORMATION
z CYCLE
0 121
z 6
40 -
CELL NUMBER
20 - O P-2-1
--
_------ P-2-3--.. .. P-2-3
- Group Average
0 20 40 60 80 100 120 140
NUMBER OF CYCLES (100% DOD) - second seriesSA-2285-9
FIGURE 9 CAPACITY CHANGE WITH CYCLING

120
100
o0
t 80
< REFORMATION
<-CYCLEU 121 *
2 60
o 40
U-
CELL NUMBER
20 0 PX-2-1
] - - - PX-2-2
0 --- PX-2-3
0- Group Average
0 I I I I I I
0 20 40 60 80 100 120 140
NUMBER OF CYCLES (100% DOD) - second seriesSA-2285-10
FIGURE 10 CAPACITY CHANGE WITH CYCLING

120
100
REFORMATION
> CYCLES80 ,121
O.
00I-
o 0tr 40
CELL NUMBER
20 O-- S'-2-1
O- - - S'-2-2
i------ S'-2-3
0- Group Average
0 20 40 60 80 100 120 140
NUMBER OF CYCLES (100% DOD) - second seriesSA-2285-11
FIGURE 11 CAPACITY CHANGE WITH CYCLING

120 I I
100
b 80
U
O REFORMATION a
< CYCLE2 60 121
0
zc-
C 40w
CELL NUMBER
20 -0- SS-2-1 a
0--- SS-2-2
.----- SS-2-3
-- Group Average
0 I I I I __ _0 20 40 60 80 100 120 140
NUMBER OF CYCLES (100% DOD) -- second seriesSA-2285-12
FIGURE 12 CAPACITY CHANGE WITH CYCLING

Table 17
GROUP AVERAGE CYCLE LIFE
TO 50% OF FORMATION CAPACITY
Cell Band WidthSeparator
Numbers Cycles
First Series
B-1-1
B-1-2 B' 80-94
B-1-3
JC-l-I
JC-1-2 JC 86-93
JC-1-3
Q-1-1
Q-1-2 Q 109-116
Q-1-3
Sl-1S-1-2 S f
S-1-3
Second Series
P-2-1
P-2-2 P 25-29
P-2-3
PX-2-1
PX-2-2 P 27-32
PX-2-3
S-2-1SZ2-2 S 42-47
S-2-3
SS-2-1
SS-2-2 SS 21-27
SS-2-3
Determined by overlaying a band 4-6 mm wide on Figures 5-8 and 9-12, to
generate a band curve (smooth rather than articulated). Intersection with
the 507% capacity line yielded the numbers given.
Did not drop to or below 50% capacity.
48

can easily be attributed to this cause. Capacities observed in the
third formation were employed as values of nominal capacity for each
cell.
Regular and automatic life cycling using a 2-cycle per day 100% DOD
regime was started using the cell capacity data acquired during forma-
tion. Records of charge and discharge capacity were maintained; it
was from these records that the curves in Figures 5 to8 were constructed.
Records for Cycles 15, 41, and 120 are presented in Tables 18a, 18b,
and 18c.
In the first series to Cycle 130, it is to be noted that the group
average for the S" separator stayed above the 50% capacity level. Clearly,
it was the best separator, confirming the findings of the selection pro-
cess on the preceeding contract (NAS 3-15686). A subsequent four-day
stand charged on open circuit disclosed that 7 of the 12 cells had slow
shorts (See Figures 5-8) as shown by the plots of the last data points
in the graphs. Only a few more cycles were applied after the stand period,
many of the cells recovering somewhat from the slow shorts. However, at
this point even the S'-group of cells had a group average below 50% (one
S -cell yielded 67%). It was decided to stop cycling and dismantle the
cells for failure analysis.
Testing of the Second Series of Cells
The formation charges for the second series were provided by the
17-station automatic cycling panel, with the voltage limit for the first
formation set at 2.005 V. Because the capacity inputs were lower than
desired, the second formation charge voltage limit was set at 2.050 Vper
agreement with NASA. After the discharge capacity was determined for the
49

Table 18a
100% DOD CYCLE TESTS
First Series for Cycle 15
On 18 May 1974
Percent of GroupSepa- Cell Formation Discharge Ampere
Formation Averagerator No. Capacity Time (hr) Hrs
Capacity Percent
B-1-1 5.6 1.85 4.53 80.5
B B'-1-2 5.7 1.67 4.08 72.1 74.7
B -1-3 5.2 1.55 3.80 74.5
JC-1-1 5.3 1.55 3.80 73.1
JC JC 1-2 5.7 1.45 3.55 63.4 66.7
JC-1-3 5.2 1.35 3.31 63.7
Q-1-1 5.2 1.42 3.48 66.8
Q Q-1-2 5.4 1.75 4.29 79.4 70.7
Q-1-3 5.1 1.38 3.38 65.9
S-1-1 4.4 1.30 3.19 73.2
S S -1-2 4.6 1.32 3.23 70.4 72.9
S -1-3 4.5 1.37 3.36 75.2
Average Discharge Current: 2.45A.
50

Table 18b
100% DOD CYCLE TESTS
First Series for Cycle 41
On 1 June 1973
Percent of GroupSepa- Cell Formation Discharge Ampere
Formation Averagerator No. Capacity Time (hr) HrsCapacity Percent
B -1-1 5.6 1.78 4.31 76.6
B B -1-2 5.7 1.72 4.15 73.4 72.1B -1-3 5.2 1.42 3.43 66.3
JC-1-1 5.3 1.55 3.75 71.2
JC JC-1-2 5.7 1.28 3.10 54.5 63.6JC-1-3 5.2 1.40 3.39 65.1
Q-1-1 5.2 1.47 3.55 68.1
Q Q-1-2 5.4 1.78 4.31 79.9 75.5Q-1-3 5.1 1.55 3.76 73.3
S -1-1 4.4 1.40 3.39 77.7
S S -1-2 4.6 1.40 3.39 73.8 77.3S -1-3 4.5 1.48 3.59 80.3
Average Discharge Current: 2.42A
51

Table 18c
100% DOD CYCLE TESTS
First Series for Cycle 120
On 11 July 1973
Percent of Group
Sepa- Cell Formation Discharge Ampere Formation Average
rator No. Capacity Time (hr) Hrs Capacity PercentCapacity Percent
B '1-1 5.6 0.83 2.00 35.5
B B -1-2 5.7 0.83 2.00 35.3 36.5
B -1-3 5.2 0.83 2.00 38.7
JC-1-1 5.3 0.60 1.44 27.3
JC JC-1-2 5.7 0 53 1.28 22.5 26.8
JC-1-3 5.2 0.67 1.60 30.7
Q-1-1 5.2 1.25 3.01 57.8
Q Q-1-2 5.4 1.05 2.52 46.7 48.3
Q-1-3 5.1 0.87 2.08 40.5
S '-1-1 4.4 0.82 1.96 44.9
S' S -1-2 4.6 1.13 2.72 59.2 54.6
S '-1-3 4.5 1.12 2.67 59.7
Average Discharge Current: 2.40A.
52

second formation cycle, the normal 100% DOD cycling of the cells was
started. In this series of tests the electromechanical cutoff meter
relay used in the first series of tests was replaced by an electronic
device not sensitive to mechanical motion. Variations in observed
capacities therefore must be attributed to causes other than variations
in performance of the charging curcuitry.
The capacities observed in formation charging and the performance
data for regular 100% DOD life-cycling are presented in Tables 19a,
19b, and 19c. These' tables present the numerical data taken at Cycles
13, 41, and 120 in the testing of the second series. Data such as these
were used to plot the curves of Figures 9 through 12.
Comparison of Series I and Series II Cell Tests
The formation capacities of the first series of tests are lower than
the second series. The charge voltage limit in the first series was set
at 2.005 volts and was increased to 2.050 volts in the second series of
tests.
The discharge current was 2.7.A for the second series as compared to
from 2.4 to 2.5 A for the first series, and therefore the discharge times
in the second test series were shorter. This shorter discharge time pro-
duces a smaller number of cycles to the 50% point (i.e., a capacity return
of 50% of the formation capacity). A comparison of the data for Cycle 41
for both series (Tables 18 and 19) clearly shows the effects of the higher
discharge current for the second series. No other extraordinary effects
were noted during cycling.
53

Table 19a
100% DOD CYCLE TESTS
Second Series for Cycle 13
On 24 October 1973
Percent of Group
Sepa- Cell Formation Discharge Ampere Formation Average
rator No. Capacity Time (hr) HrsCapacity Percent
P-2-1 5.9 1.60 4.45 75.7
P P-2-2 6.6 1.48 4.12 62.7 66.8
P-2-3 6.2 1.38 3.85 62.1
PX-2-1 5.7 1.33 3.71 65.4
P PX-2-2 5.3 1.28 3.57 67.8 63.5
PX-2-3 6.3 1.30 3.61 57.3
S -2-1 4.3 1.02 2.83 65.3
S S -2-2 6.7 1.45 4.03 60.6 62.6
S -2-3 5.6 1.25 3.48 61.8
SS-2-1 6.1 1.30 3.61 59.0
SS SS-2-2 6.3 1.27 3.52 56.4 57.6
SS-2-3 6.4 1.32 3.66 57.5
Average Discharge Current: 2.78A
54
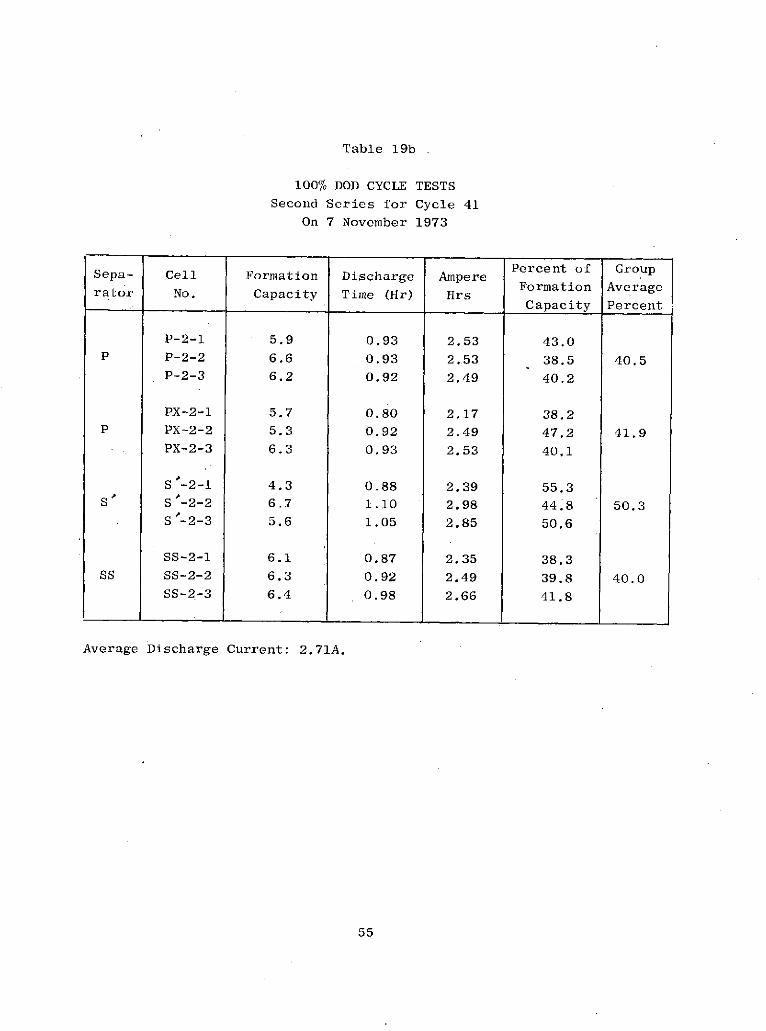
Table 19b
100% DOD CYCLE TESTS
Second Series for Cycle 41
On 7 November 1973
Percent of GroupSepa- Cell Formation Discharge Ampere Average
rator No. Capacity Time (Hr) HrsCapacity Percent
P-2-1 5.9 0.93 2.53 43.0P P-2-2 6.6 0.93 2.53 38.5 40.5
P-2-3 6.2 0.92 2.49 40.2
PX-2-1 5.7 0.80 2.17 38.2P PX-2-2 5.3 0.92 2.49 47.2 41.9
PX-2-3 6.3 0.93 2.53 40.1
S -2-1 4.3 0.88 2.39 55.3SA S -2-2 6.7 1.10 2.98 44.8 50.3
S *-2-3 5.6 1.05 2.85 50.6
SS-2-1 6.1 0.87 2.35 38.3SS SS-2-2 6.3 0.92 2.49 39.8 40.0
SS-2-3 6.4 0.98 2.66 41.8
Average Discharge Current: 2.71A.
55

Table 19c
100% DOD CYCLE TESTS
Second Series for Cycle 120
On 18 December 1973
Percent of Group
Sepa- Cell Formation Discharge AmpereFormation Average
rator No. Capacity Time (Hr) HrsCapacity Percent
P-2-1 5.9 0.37 0.83 14.1
P P-2-2 6.6 0.52 1.16 17.7 14.4
P-2-3 6.2 0.28 0.70 11.3
PX 2-1 5.7 0.40 1.10 17.6
P PX-2-2 5.3 0.50 1.31 24.9 20.9
PX-2-3 6.3 0.57 1.27 20.1
S -2-1 4.3 0.62 1.81 41.9
S S -2-2 6.7 0.48 1.26 18.9 30.6
S V-2-3 5.6 0.67 1.75 31.1
SS-2-1 6.1 0.50 1.43 23.3
SS SS-2-2 6.3 0.67 1.75 28.0 24.0
SS-2-3 6.4 0.50 1.31 20.6
Average Discharge Current: 2.55A.
56

Failure Analysis
Cells from both series were carefully taken apart, and all parts
examined. Certain characteristics common to both series were noted,
such as the total absence of seam splits or coating cracks, and the
frequent occurrence of zinc dendrite deposition on the 'back side of the
bags containing the silver electrodes (case wall side).
An interesting finding of the failure analysis for the first series
was the presence of very small nodules (described as nailhead nodules)
on the back faces of all but one of the Zn bags, and all but three of
the Ag bags. The quantities varied from a few to several hundred. The
failure analysis data appear in Table 20. Judging from the patterns of
the small nodules, it is suspected that they were covered over by a
very thin layer of leafy dendritic zinc, which was dissolved by the time
disassembly took place. These structures, possibly acting as slow shorts
shunting a part of the current, could account for the apparent decline
in cell capacity. Similar nailhead nodule penetrations were noted in
the working faces of the separator bags. Separators made from B'and
Q materials had a higher density of nodules than the separator made
from S-type materials.
Some slumping was observed in all zinc plates. The Q group exhi-
bited the most slumping, while the B and S groups showed the least
amount of slumping. Only a few instances of zinc plate erosion or
shedding were found; the most severe erosion was observed on a plate
from a cell in the Q group.
Very little silver was found in the zinc bags due to time span
of cell testing. The results of silver analyses are shown in Table 21.
As shown in Table 22, one significant difference in the second
series of cells compared to the first series, was that no nodules or
dendrites were found on the back of the zinc bags. This may have been
57

Table 20
FAILURE ANALYSIS OF TWO-PLATE CELLS
First Series
3d Final Specific Zn Nodule Zn Nodule Zn Nodule Zn Nodule Separator Plate
Cell Form. Capacity Cycle Life Penetration Penetration Penetration Penetration Erosion Slumping Erosion
No. Capacity Cycle 130 to 50% Back of Back of Active Face Active Face or
Ahr Ahr Capacity Zn Bag Ag Bag Zn Bag Ag Bag Damage
Days
a b
B--il 5.63 2.22 71 +++++ ++ + + No x slight
B-1-2 5.66 1.94 87 +++++ ++ ++++ +++ +++++ Yes (Zn) x No3 cm
B-1-3 5.17 1.94 94 +++++ ++ ++++ ++++ No x No
JC-1-1 5.27 1.43 87 +++++ +++++ + Yes (Ag) xxx No
00 JC-1-2 5.69 1.23 35 +++ + ++ ++ No xx No
JC-1-3 5.20 1.51 100 +++ ++ - - No x No
Very
Q-1-1 5.21 2.78 134 +++++ - ++++ ++++ Yes xxxx signifi-
cant
Q-1-2 5.40 2.42 112 +++++ +++++ +++ +++++ No xxxx Slight
Q-1-3 5.13 1.98 98 +++++ +++ ++ ++ No xxx No
S~l-1 4.36 1.98 114 ++ +++ ++ - No x No
S'1-2 4.59 2.82 134 - + No x No
S-1-3 4.47 2.26 134 ++++ ++ ++++ + No x No
aNumerous (hundreds of small "nailhead nodules") . +++++, > a few +, > none -
bConsiderable - xxxx, > moderate E xxx, > light - xx, > slight x, > none -
There were no seam splits or coating cracks in any of the bags.

Table 21
SILVER CONTENT OF SEPARATORS
First Series of Cells Second Series of Cells
Cell Silver Bag Zinc Bag Cell Silver Bag Zinc BagNo. Weight t Weight t No. Weight t Weight t
Mg/cm2 Mg/cm 2 Mg/cm2 Mg/cm2
B-l-l 8.0 0.3 P-2-1 2.9 0.2
B-l-2 6.1 0.2 P-2-2 2.4 0.1
B-1-3 7.3 0.1 P-2-3 2.3 0.1
JC-1-1 6.8 0.2 PX-2-1 1.9 0.1
JC-1-2 4.1 0.0+ PX-2-2 1.8 0.1
JC-1-3 7.4 0.1 PX-2-3 1.9 0.1
Q-1-1 8.2 0.2 S-2-1 2.5 0.1
Q-1-2 7.6 0.0+ S-2-2 1.9 0.1
Q-1-3 9.2 0.3 S-2-3 2.1 0.1
S-1-1 7.0 0.3 SS-2-1 1.9 0.2
S-1-2 7.1 0.0+ SS-2-2 2.1 0.1
S-1-3 9.2 0.2 SS-2-3 2.2 0.1
Pilot 4.7 0.1
Samples were cut from the working faces.
Average of two determinations.

Table 22
FAILURE ANALYSIS OF TWO-PLATE CELLS
Second Series
2nd Final Specific Zn Nodule Zn Nodule Zn Nodule Zn Nodule Separator
Cell Form. Capacity Cycle Life or Dendrites or Dendrites or Dendrites or Dendrites Erosion Slumping Plate
No. Capacity Cycle 120 to 50% Back of Back of Active Face Active Face or Erosion
Ahr Ahr Capacity Zn Bag Ag Bag of Zn Bag of Ag Bag Damage
Days
t t t
P-2-1 5.88 0.83 32 - ++ ++ + No
P-2-2 6.57 1.16 26 - +++ ++ +
P-2-3 6.19 0.70 26 - ++ ++ + No
PY-2-1 5.67 1.00 28 - +++++ + + No
PY-2-2 5.26 1.31 37 - ++++ + + No
PY-2-3 6.31 1.27 27 - +++++ + No
S'2-1 4.33 1.81 47 - +++++ - - No
S-2-2 6.65 1.26 57 - ++ No
S-2-3 5.62 1.75 30 - +++++ ++ ++ No
SS-2-1 6.13 1.43 23 No
SS-2-2 6.25 1.75 22 No
SS-2-3 6.37 1.31 26 No
No indication is made here that penetration did or did not occur.
There were no bag seam splits on any OOHS
Numerous Zn masses >
~ 60% of area E +++++, > 1% E +, none E -

influenced by the fact that these cells were analyzed in the discharged
state. Except for cells having the SS separator, all cells had sub-
stantial amounts of flat dendritic zinc deposits on the backs of the
Ag separator bags. These deposits had at times been connected electron-
ically with the zinc mush deposits that filled the V-notch groove at the
edges (bottom) of the two separator bags in each cell.
The SS cells had no dendritic zinc deposits on or between the
working faces. Two of the S' cells, likewise, did not have such depo-
sits on or between the working faces. The other cells had small amounts
of these deposits on about 17 of the face areas. There was no erosion
or spalling of the separator coatings anywhere in any of the cells.
Furthermore, there was no obvious slumping or plate shedding or ero-
sion. However, in most if not all the cases, the central areas of the
negative plates were somewhat densified (this was true in the first
series also). One could postulate that this phenomenon might precede
ultimate slumping.
61

DISCUSSION
The large fluctuations of the small-number statistics governing
the results of this test program introduce considerable uncertainties,
especially in a more detailed analysis. However, the test program has
provided worthwhile answers to the most important questions pursued.
The major objective of the silver-zinc cell development program
initiated at MDC and continued at SRI, was to demonstrate that the use
of separators of largely inorganic constitution, would bring longer
stand and cycle life to silver-zinc cells. A derived objective was to
improve these separators by modifying its composition to further ex-
tend the cell performance. Both objectives were realized. We believe
that other modifications can enhance cell performance still further.
A full discussion on the finding of this study and their signifi-
cance with respect to the cells fabricated by MDC and tested both at
MDC and SRI (Contract NAS 3-15686) and continued in testing on the
present contract are found in Reference 7. Most, if not all of the
observations and comments cited in that reference apply to the cells
continued in testing on the present program. An additional finding,
however, relates to the zinc mush found external to the bags and filling
the void areas at the bag edges (commonly in the bottom of the cell):
When the seam splits occurred in both the Ag and Zn bags, and the split
areas were choked with metallic zinc mush, it appears that a number of
cells failed by shorting through this metallic path.
A brief summary of the discussion in Reference 7 follows. Elevated
stand temperatures were detrimental to good cell performance. The
attack on the organic binder of the separator coating and on the cement
63
Preceding page blank

bond at the separator bag edges is enhanced by elevated temperatures,
tending to promote earlier failure. Conversely, as expected, lower
temperatures favor extension of cell life. Cells on charged or float-
charged stand likewise had shorter lives than cells on discharged stand.
Moreover, cells cycled immediately after activation (VK-2 regime) dis-
played long cycle and wet life (Table 13). Also, cells on charged or
float-charged stand (as is true for the 100% DOD cells with a 1-month
charged stand between cycles) had as a significant failure mode, shorting
by zinc nodules, sometimes quite early in the cycling portion of cell
testing.
Bag splits (at .the cemented seams) almost always were choked with
active negative plate matter, and most bag splits were located in the
Zn bags. In the few instances of Ag bag splits, the open areas were
also choked with Zn and ZnO. On a charge portion of a cycle, it would
be easy to conceive of an electronic bridge between Zn and Ag electrodes.
Whether the splits originated in a delamination of the glue line, or
in tears adjacent to the glue line by the invading zinc mass could not
be determined. In any case, a weakness appears in this area of the
separator, quite likely aided by gradual degradation by silver oxide.
Contract NAS 3-15686 had, as one of its major goals, the screening
and identification of a few optimum inorganic materials to use in the
separators of silver-zinc cells. The selection of materials B, JC, and
S required the building and testing (the first series) of two-plate
cells with material Q (3420-25) as a control, since the latter was used
in building all the cells fabricated by MDC and tested on earlier programs
as well as this program. Actual cell testing permitted the selection
of the best separator composition, which proved to be the S material.
Cells containing S material in the first series did not decline to or
64

below 50% capacity by Cycle 130, although the others had declined
earlier.
The second series of tests disclosed that excessive doping was
not favorable to maintaining high capacity, although it improved the
suppression characteristics of zinc dendrite growths, both on the
working faces and on the back faces of the separator bags. This
suppression characteristic suggests that cells containing the SS sepa-
rator might cycle for a long time, but at depressed capacities.
Of the materials tested on this program, S'material proved the
best, verifying the findings of the screening tests program of the
preceeding contract (NAS 3-15686).
65

CONCLUSIONS
Original MDC Cells
The results of this testing program, continued from Contract NAS 3-
10928, and NAS 3-15686,~showed that MDC heat-sterilized silver-zinc
cells containing proprietary semiflexible separators were able to sur-
vive at least four years (some cells on wet stand for about one-half
that time before cycling) and to deliver more than 1000 cycles. Four
batteries delivered more than 2000 shallow charge-discharge cycles.
Thus, one of the major objectives of the silver-zinc development pro-
gram was accomplished.
If cells are required to undergo an activated stand period, the
discharged stand favors longer cycle and wet life over either charged
stand or float-charged stand. Furthermore, continuous shallow DOD
cycling immediately following activation also seems to favor long life,
compared to achievable life under conditions of charged stand or float-
charged stand followed by shallow cycling. Storing cells at low tempera-
tures (for example 283UK) appears to favor higher survival.
Although the limitations of small sample statistics apply to most
of the results relating to the secondary testing objectives, the fol-
lowing conclusions appear reasonably well established.
(1) Additional layers of separators between bags increasecell cycle life for shallow and deep cycles.
(2) Plate-locking electrodes in cells with epoxy cementreduces cell wet and cycle life. This effect isreduced as the epoxy cement is more thoroughly cured.Environmental testing does not seem to affect cycleand wet life of plate-locked cells.
67
Preceding page blank

(3) Operating cells as groups in "batteries" has reduced
cell wet and cycle life, presumably because individual
cells can experience overcharges as cell imbalances
develop with age.
Cell failure analysis shows shorting by zinc nodules to be a signi-
ficant cause for cell failures. However, these failures were observed
only in cells that had been charged for an extended period of time and
had undergone either deep discharges or significant overcharges. These
failures also appeared in cells cycled immediately after activation when
cycle life and wet life was high and when cells had been cycled once
per month (100% DOD) with charged stand for approximately one month
between cycles. Zinc nodule shorts were formed under these conditions,
apparently partly because the semiflexible separators were extensively
attacked by dissolved silver oxide and were unable to withstand zinc
penetration.
Cell shorting by filament-type zinc dendrites appears to have caused
most of the remaining cell failures, especially those that occurred
after large numbers of cycles. Shorting by silver deposited in semi-
flexible separators was not observed in any of the cells. Although
many cells developed a number of faults, such as leaks, electrode ero-
sion, slumping and split seams, no significant correlations existed be-
tween these faults and specific failure modes, except in the case of
split seams. About 20% of the 30 cells analyzed failed by shorting
through the external zinc mass when both Zn bags and Ag bags in the
same cell were split. Only cells of one subgroup showed a modest degree
of zinc electrode slumping. This low incidence of zinc electrode slum-
ping points to the advantage of using inorganic electrode separators to
acheive extended cycle life in both shallow and deep cycling of alkaline
cells with zinc negatives.
68

Two Plate Cells
The results of the cell testing of separator materials selected on
the basis of screening tests showed that the best separator material
was doped calcium zirconate (Material S'). This separator material per-
formed best in both series of two plate cell tests, when compared to a
synthetic olivine (material B), a commercial magnesium titanate (material
JC), and a reference material used to build the separators of MDC cells
(material Q). Material S was also superior to a more heavily doped
calcium zirconate (material SS), and was better than commercial calcium
zirconate (material P).
In the first series of tests, only cells containing separators of
material S had more than 50% of the original capacities at Cycle 130
(100% DOD).
In the second series of tests, cells containing S separators had
the highest average percentage of the original capacity when the tests
were terminated at Cycle 120.
The following brief conclusions may be cited:
(1) The S separators had only minor slumping, no plate
erosion and separator erosion, and few Zn nodules or
Zn dendrites in or on the working faces of the separator
bags. These separators maintained more of the originalcapacity than any of the other separators.
(2) Q separators had the most slumping, plate erosion, andzinc dendrites (and nailhead nodules) both on back facesand working faces. The capacity maintenance was secondto the S separators in the first series of tests.
(3) SS separators showed no external Zn deposits, separatorerosion, plate erosion, or slumping. The capacity main-tenance was second to the S separators in the secondtest series.
69

(4) Including lead in the Zn electrode did not add any
unique benefits to P separator performance above those
benefits of normal Zn electrodes.
(5) Based on the individual studies of the pilot cell in
the second series and the charge currents used, the
upper charge voltage limit could be set to 2.100V with-
out danger of excessive gassing. (Maximum pressure
rise at end of charge was one to two psi (0.7 to 1.4
N/cm2 .) Increasing the upper charge voltage limit
would provide a formation charge capacity approximately
50% higher than the second series average.
70

RECOMMENDATIONS
The results and conclusions of the cell testing programs lead to
the following recommendations.
(1) If MDC-type silver-zinc cells using the present designsand semiflexible separators are to be standing for ex-tended periods, discharged stand should be used. Ifcharged stand is an operational requirement, the stan-ding temperature should be 2830 CK (10UC) or lower.
(2) Deep cycling (such as applied in reconditioning or in100% DOD regimes) should be avoided for cells that haveexperienced extended periods on charged stand.
(3) The major cause(s) of cell capacity loss in standingand cycling should be investigated. As part of thiseffort (or for its own merit) the possibility ofdeveloping a "nondestructive" silver electrode capa-city test based on the rate of voltage rise .should beexplored.
(4) Operation of cells in batteries is to be avoidedunless circuitry is provided that allows cells to beremoved individually from charge and discharge.
(5) The upper voltage limit for cell charging should bereliably controlled. Charging circuitry should beused that "recognizes" the voltage spike associatedwith the phase transition of silver (I) oxide-silver(II) oxide.
(6) The separator constituent mainly responsible for formingsilver deposits should be identified, and the effect ofits elimination on cell behavior and life should be in-vestigated.
(7) Improved techniques (and their automation) for enclosingelectrodes in bags should be devised. This effort shouldinclude developing better bag seals and investigating
71

electrodes with rounded edges that would improve current
distribution and permit improved conformity of bags, thus
eliminating void spaces within bags.
(8) Improved seals for terminal posts should be designed.
(9) Unless needed for specific applications, plate locks should
not be used. If needed, plate locks should be made from
fully cured epoxy cements or from chemically neutral, pow-
dered resins, fusible at temperatures compatible with cell
structure, thereby acting as immobilizing cements.
(10) Eliminate void spaces between the separator bags and be-
tween the cell case.
(11) The origin of polarizations, which seem to affect cell
performance, and the C/2 discharge rate should be inves-
tigated so that cell performance at discharge rates higher
than C/2 could be improved.
72

REFERENCES
1. C. Berger , F. C. Arrance, A. D. Taylor, "Inorganic Separatorfor High Temperature Silver-Zinc Battery," Final Report,Contract NAS 3-6007, Douglas Aircraft Co., Newport Beach,Calif. (Sept. 1965).
2. H. Frank and M. P. Strier, "Elimination of Pressure Causedby Gassing in High Energy Density Batteries," Interim Report,Contract NAS 5-9594, Douglas Aircraft Co., Newport Beach,Calif.
3. F. C. Arrance, "Program to Develop an Inorganic Separatorfor a High Temperature Silver-Zinc Battery," Final Report,Contract NAS 3-7639, Douglas Aircraft Co., Newport Beach,Calif. (June 1967).
4. A. Himy, "Heat Sterilizable Battery," Final Report, ContractNAS 2-3819, NASA CR-73110, Douglas Aircraft Co., Newport Beach,Calif. (July 1967).
5. H. Frank, M. P. Strier, "Sealing of Silver Oxide-Zinc StorageCells," Final Report, Contract NAS 5-10409, McDonnell-DouglasCorp., Newport Beach, Calif. (August 1968).
6. A. Himy, "Development of a Heat-Sterilizable 40 Ahr SealedSilver-Zinc Cell," Final Report, Contract NAS 3-10928, NASACR-1812, McDonnell-Douglas Corp., Newport Beach, Calif.(November 1970).
7. J. S. Smatko, R. D. Weaver, and F. R. Kalhammer, "InorganicSeparator Technology Program," Final Report, Contract NAS 3-15686, NASA CR-121215,Stanford Research Institute, Menlo Park,Calif. (January 1973).
73