Embed Size (px)
Citation preview
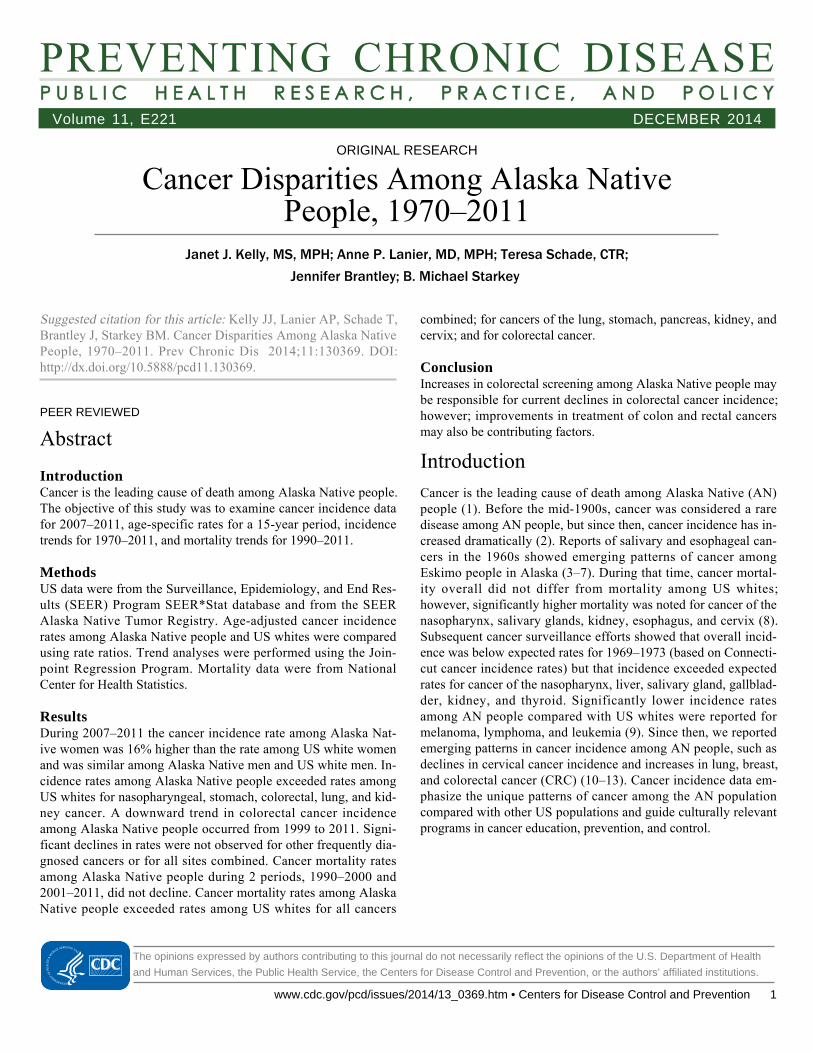
PREVENTING CHRONIC DISEASEP U B L I C H E A L T H R E S E A R C H , P R A C T I C E , A N D P O L I C Y Volume 11, E221 DECEMBER 2014
ORIGINAL RESEARCH
Cancer Disparities Among Alaska NativePeople, 1970–2011
Janet J. Kelly, MS, MPH; Anne P. Lanier, MD, MPH; Teresa Schade, CTR;
Jennifer Brantley; B. Michael Starkey
Suggested citation for this article: Kelly JJ, Lanier AP, Schade T,Brantley J, Starkey BM. Cancer Disparities Among Alaska NativePeople, 1970–2011. Prev Chronic Dis 2014;11:130369. DOI:http://dx.doi.org/10.5888/pcd11.130369.
PEER REVIEWED
Abstract
IntroductionCancer is the leading cause of death among Alaska Native people.The objective of this study was to examine cancer incidence datafor 2007–2011, age-specific rates for a 15-year period, incidencetrends for 1970–2011, and mortality trends for 1990–2011.
MethodsUS data were from the Surveillance, Epidemiology, and End Res-ults (SEER) Program SEER*Stat database and from the SEERAlaska Native Tumor Registry. Age-adjusted cancer incidencerates among Alaska Native people and US whites were comparedusing rate ratios. Trend analyses were performed using the Join-point Regression Program. Mortality data were from NationalCenter for Health Statistics.
ResultsDuring 2007–2011 the cancer incidence rate among Alaska Nat-ive women was 16% higher than the rate among US white womenand was similar among Alaska Native men and US white men. In-cidence rates among Alaska Native people exceeded rates amongUS whites for nasopharyngeal, stomach, colorectal, lung, and kid-ney cancer. A downward trend in colorectal cancer incidenceamong Alaska Native people occurred from 1999 to 2011. Signi-ficant declines in rates were not observed for other frequently dia-gnosed cancers or for all sites combined. Cancer mortality ratesamong Alaska Native people during 2 periods, 1990–2000 and2001–2011, did not decline. Cancer mortality rates among AlaskaNative people exceeded rates among US whites for all cancers
combined; for cancers of the lung, stomach, pancreas, kidney, andcervix; and for colorectal cancer.
ConclusionIncreases in colorectal screening among Alaska Native people maybe responsible for current declines in colorectal cancer incidence;however; improvements in treatment of colon and rectal cancersmay also be contributing factors.
IntroductionCancer is the leading cause of death among Alaska Native (AN)people (1). Before the mid-1900s, cancer was considered a raredisease among AN people, but since then, cancer incidence has in-creased dramatically (2). Reports of salivary and esophageal can-cers in the 1960s showed emerging patterns of cancer amongEskimo people in Alaska (3–7). During that time, cancer mortal-ity overall did not differ from mortality among US whites;however, significantly higher mortality was noted for cancer of thenasopharynx, salivary glands, kidney, esophagus, and cervix (8).Subsequent cancer surveillance efforts showed that overall incid-ence was below expected rates for 1969–1973 (based on Connecti-cut cancer incidence rates) but that incidence exceeded expectedrates for cancer of the nasopharynx, liver, salivary gland, gallblad-der, kidney, and thyroid. Significantly lower incidence ratesamong AN people compared with US whites were reported formelanoma, lymphoma, and leukemia (9). Since then, we reportedemerging patterns in cancer incidence among AN people, such asdeclines in cervical cancer incidence and increases in lung, breast,and colorectal cancer (CRC) (10–13). Cancer incidence data em-phasize the unique patterns of cancer among the AN populationcompared with other US populations and guide culturally relevantprograms in cancer education, prevention, and control.
The opinions expressed by authors contributing to this journal do not necessarily reflect the opinions of the U.S. Department of Health
and Human Services, the Public Health Service, the Centers for Disease Control and Prevention, or the authors’ affiliated institutions.
www.cdc.gov/pcd/issues/2014/13_0369.htm • Centers for Disease Control and Prevention 1

The term “Alaska Native” refers to 3 broadly defined groups of in-digenous people living in Alaska: Eskimo, Indian, and Aleut. ANpeople comprise approximately 18% of the Alaskan population;33% live in one of 2 major cities. Health care for AN people wasthe responsibility of the Indian Health Service (IHS) until 1997,when the Alaska Tribal Health Compact, a self-governance agree-ment, allowed tribal governments and their regional health corpor-ations to assume this responsibility (14). The objective of thisstudy was to examine cancer incidence and mortality data for ANpeople from 1970 through 2011.
MethodsUS data are from the Surveillance, Epidemiology, and End Res-ults (SEER) Program SEER*Stat database and from the SEERAlaska Native Tumor Registry, a population-based registry that in-cludes AN people who lived in Alaska at the time of cancer dia-gnosis from 1969 to 2011 and who met eligibility requirements forIHS benefits (15). Tumor data and demographic information forAN patients were gathered from electronic medical records, med-ical charts, pathology reports, and provider dictations from theAlaska Native Medical Center and regional medical facilities.Cancers described in this report include only invasive cancers.Classification of site of cancer origin, histologic cell type, behavi-or, and grade coding followed the International Classification ofDiseases for Oncology, second and third editions. Cancer sites oforigin were grouped according to SEER site groups. Less than 1%of the cases were identified from death certificates only; 89% ofcancers were histologically confirmed. Abstracting followed de-tailed coding and staging guidelines established by the SEER pro-gram, and data were processed through a standard set of computer-ized edits. SEER data quality is monitored through periodic re-cord review and other SEER data quality-improvement activities.AN population estimates were obtained from the US Census(1970, 1980, and 1990) and from National Center for Health Stat-istics’ bridged population series for ANs (1981–2010), obtainedfrom the SEER*Stat website (16). Cancer incidence rates were ex-pressed as average annual rates per 100,000 population for a 5-year period, 2007–2011. Age-specific cancer incidence rates werebased on data for 2000–2011. US cancer incidence data for2000–2011 were obtained from a SEER*Stat data set based on 18registries (17); US trend data for 1973–2011 were obtained from aSEER*Stat data set based on 13 registries (18). AN and US whitemortality rates were calculated for years 2007–2011 using datafrom the National Center for Health Statistics, available fromSEER*Stat (19). Incidence and mortality rates, rate ratios (RRs),and corresponding 95% confidence intervals were computed us-ing SEER*Stat statistical software version 8.1.2 (20). Rates wereage-adjusted to the US Census 2000 standard population using the
direct method for comparison with US white incidence rates.Trend analysis of 2-year averaged incidence rates for 1970–2011was performed using the Joinpoint Regression Program, version4.0.4 (21). The Joinpoint regression models determined the best fitfor a single line or multisegmented lines across 2-year averagedincidence rates among ANs and US whites. Annual percentagechange (APC) in trends was noted for cancers showing significantchanges in trend; probability level was set at P = .05.
We calculated 11-year average annual age-adjusted death rates for2 periods: 1990–2000 and 2001–2011. Age-adjustments were per-formed using the direct method and the 2000 US Census data.Rates were compared and considered significantly different whenthere was no overlap of confidence intervals.
ResultsAmong Alaska men and women, 1,968 cases of invasive cancerwere diagnosed during 2007–2011. The age-adjusted incidencerate among AN women for all cancer sites combined was 16%higher than the rate among US white women (RR = 1.16; P <.001); however, the rate among AN men was not significantly dif-ferent from the rate among US white men (RR = 0.94; P = .11)(Table 1). The leading cancers among AN and US white popula-tions were lung, colorectal, and prostate cancer among men, andbreast, colorectal, and lung cancer among women. We found strik-ing differences in incidence rates between ANs and US whites forseveral sites. Incidence rates for lung and CRC among ANs ex-ceeded rates among US whites (lung: RRmen = 1.59, P < .001;RRwomen = 1.44, P < .001; colorectal: RRmen = 1.92, P < .001;RRwomen = 2.03, P < .001). The prostate cancer rate among ANmen was significantly lower than the rate among US white men(RR = 0.48, P < .001). Whereas breast cancer rates among AN wo-men were once lower than rates among US white women, wefound similar rates (RR = 1.02, P = .66). Other disparities betweenANs and US whites were observed. Significantly higher ratesamong ANs were found for the following sites: nasopharynx(RRmen = 10.71, P < .001; RRwomen = 10.39, P < .001), stomach(RRmen = 2.82, P < .001; RRwomen = 3.94, P < .001), and kidney(RRmen= 1.39, P = .04; RRwomen = 1.90, P < .001). Significantlylower rates among ANs were found for melanoma of the skin(RRmen = 0.09, P < .001; RRwomen = 0.14, P < .001 ), urinary blad-der (RRmen= 0.57, P = .002), thyroid (RRwomen = 0.68, P = .03),non-Hodgkin lymphoma (RRmen = 0.52, P = .001), and leukemia(RRmen = 0.43, P = .002; RRwomen = 0.53, P = .01).
PREVENTING CHRONIC DISEASE VOLUME 11, E221
PUBLIC HEALTH RESEARCH, PRACTICE, AND POLICY DECEMBER 2014
The opinions expressed by authors contributing to this journal do not necessarily reflect the opinions of the U.S. Department of Health and Human Services,
the Public Health Service, the Centers for Disease Control and Prevention, or the authors’ affiliated institutions.
2 Centers for Disease Control and Prevention • www.cdc.gov/pcd/issues/2014/13_0369.htm
Age-specific rates
Age-specific incidence rates for all cancer sites combined weresimilar among AN and US white men for most 10-year age groups(Table 2). AN women aged 50 to 79 had significantly higher ratesthan US white women of similar age, and AN men aged 50 to 69had significantly lower rates than US white men of similar age.Stomach and CRC incidence rates, which are 2 or more timeshigher among ANs than among US whites, showed disparitiesacross nearly all 10-year age groups. Disparities in lung cancerrates were greatest among the older age groups. Breast cancerrates among AN women were similar to rates among US whitewomen for half of the 10-year age groups. Prostate cancer rateswere much lower among AN men aged 50 to 79 than among USwhite men of similar age. Kidney cancer incidence among ANs byage group was generally similar to rates among US whites, butrates were higher among AN men aged 70 to 79 than US men ofsimilar age and among AN women aged 50 to 59 than US whitewomen of similar age.
Cancer time trends
Joinpoint analysis indicated a 1.1% annual increase in combinedcancer incidence rates among AN men and women during1970–2005 (Table 3). The annual rate of increase among AN wo-men (1.2%) was greater than the rate among AN men (0.7%) dur-ing 1970–2011. All site rates among US white men increased1.5% annually during 1973–1989 and decreased 0.5% annuallyduring 1995–2011. Rates among US white women increased dur-ing 1973–1982 (0.5% annually) and 1985–1999 (0.5% annually);no significant declines were found.
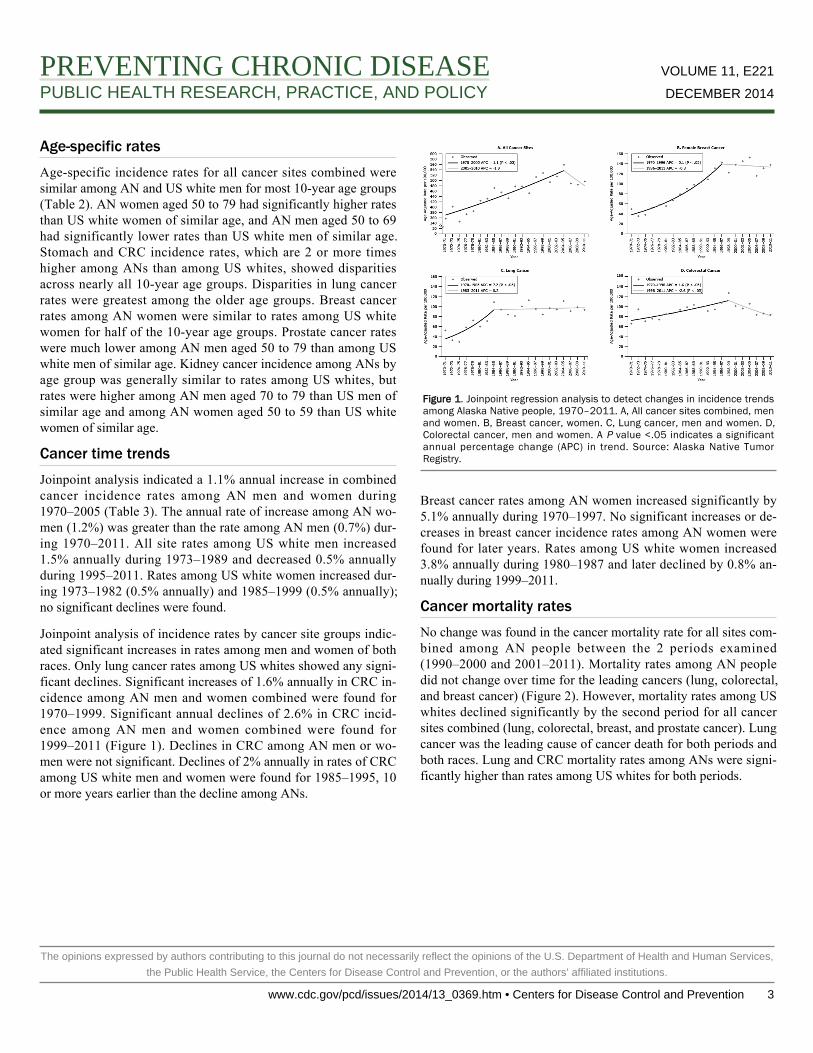
Joinpoint analysis of incidence rates by cancer site groups indic-ated significant increases in rates among men and women of bothraces. Only lung cancer rates among US whites showed any signi-ficant declines. Significant increases of 1.6% annually in CRC in-cidence among AN men and women combined were found for1970–1999. Significant annual declines of 2.6% in CRC incid-ence among AN men and women combined were found for1999–2011 (Figure 1). Declines in CRC among AN men or wo-men were not significant. Declines of 2% annually in rates of CRCamong US white men and women were found for 1985–1995, 10or more years earlier than the decline among ANs.
Figure 1. Joinpoint regression analysis to detect changes in incidence trendsamong Alaska Native people, 1970–2011. A, All cancer sites combined, menand women. B, Breast cancer, women. C, Lung cancer, men and women. D,Colorectal cancer, men and women. A P value <.05 indicates a significantannual percentage change (APC) in trend. Source: Alaska Native TumorRegistry.
Breast cancer rates among AN women increased significantly by5.1% annually during 1970–1997. No significant increases or de-creases in breast cancer incidence rates among AN women werefound for later years. Rates among US white women increased3.8% annually during 1980–1987 and later declined by 0.8% an-nually during 1999–2011.
Cancer mortality rates
No change was found in the cancer mortality rate for all sites com-bined among AN people between the 2 periods examined(1990–2000 and 2001–2011). Mortality rates among AN peopledid not change over time for the leading cancers (lung, colorectal,and breast cancer) (Figure 2). However, mortality rates among USwhites declined significantly by the second period for all cancersites combined (lung, colorectal, breast, and prostate cancer). Lungcancer was the leading cause of cancer death for both periods andboth races. Lung and CRC mortality rates among ANs were signi-ficantly higher than rates among US whites for both periods.
PREVENTING CHRONIC DISEASE VOLUME 11, E221
PUBLIC HEALTH RESEARCH, PRACTICE, AND POLICY DECEMBER 2014
The opinions expressed by authors contributing to this journal do not necessarily reflect the opinions of the U.S. Department of Health and Human Services,
the Public Health Service, the Centers for Disease Control and Prevention, or the authors’ affiliated institutions.
www.cdc.gov/pcd/issues/2014/13_0369.htm • Centers for Disease Control and Prevention 3

Figure 2. Cancer mortality rates in Alaska Native and US white populations for2 periods, 1990–2000 and 2001–2011.
DiscussionHigh cancer incidence rates among AN people compared withrates among US whites were first reported in the early 1970s. Dur-ing the past 40 years, lung cancer and breast cancer incidenceamong AN people increased by 200%, and CRC incidence in-creased by 35%. Significant declines in cancer incidence and mor-tality in the United States began in 1992 among men and in 1998among women, primarily in the 4 leading cancers: lung,colorectal, prostate, and breast cancer (22). Rates of leading can-cers among ANs did not decline, except for CRC incidence andmortality rates; this situation has resulted in an ever-increasingdisparity in cancer incidence and mortality among the AN popula-tion.
Patterns of cancer incidence and mortality are not similar amongAmerican Indian and AN (AI/AN) groups in the United States. In-cidence rates for all cancer sites combined among AI/AN groupsare lower than rates among US whites; however, AI/AN cancerrates by IHS region show striking differences between AI/ANgroups and US whites. Underreporting of cancer incidence be-cause of race misclassification was demonstrated in several stud-ies that linked cancer registry and IHS registration data (23–26).Studies on cancer conducted among AI/AN living in US countiescontaining tribal lands (or areas adjacent to tribal lands), wherecontract health services are provided for AI/ANs and where ratesof race misclassification are lower, showed higher rates of certaincancers among AI/ANs in some IHS regions compared with ratesamong non-Hispanic whites from the same counties (27–29). Thecontract health services delivery area (CHSDA) counties groupedby IHS region showed higher incidence rates of lung cancer in theregions of the Northern Plains and Alaska; higher incidence ratesof CRC in the regions of the Northern Plains, Southern Plains andAlaska; higher incidence rates of kidney cancer in the regions ofthe Northern Plains, Southern Plains, Southwest, and Alaska; andhigher incidence rates of stomach cancer in the regions of theNorthern Plains, Southern Plains, Pacific Coast, Southwest, andAlaska among AI/ANs than among non-Hispanic whites from thesame regions (30–32). These studies underscore the disparitybetween AI/ANs and US whites and demonstrate geographic dif-ferences in cancer incidence.
Lung cancer rates among ANs have not declined as they haveamong US whites (22). High rates of lung cancer are likely to con-tinue until tobacco use declines significantly. Since 2001, theAlaska Behavioral Risk Factor Surveillance System (BRFSS) sur-vey has consistently measured rates of 38% to 45% for currentsmokers among the AN population — nearly double the rateamong Alaska whites (33). Youth Risk Behavior Surveillance(YRBS) surveys in 2007, 2009, and 2011 among high school stu-dents in Alaska indicated that one-fourth to one-third of AN stu-dents were current smokers. Far fewer non-Native Alaska stu-dents in Alaska reported they were current smokers (10%–13%) inthe same surveys (34).
In 2003, Alaska Native Tribal Health Consortium (ANTHC) es-tablished a Tobacco Prevention and Control Program to build ca-pacity for tribal health organizations of the Alaska Tribal HealthSystem to develop, expand, or revitalize nicotine-dependencetreatment services. Later, tobacco treatment specialists who re-ceived educational training on tobacco cessation became com-munity-based resources for providing information on quitting to-bacco and counseling to those who had decided to quit. Trainingof these specialists continues.
PREVENTING CHRONIC DISEASE VOLUME 11, E221
PUBLIC HEALTH RESEARCH, PRACTICE, AND POLICY DECEMBER 2014
The opinions expressed by authors contributing to this journal do not necessarily reflect the opinions of the U.S. Department of Health and Human Services,
the Public Health Service, the Centers for Disease Control and Prevention, or the authors’ affiliated institutions.
4 Centers for Disease Control and Prevention • www.cdc.gov/pcd/issues/2014/13_0369.htm

The Healthy People 2020 target for the proportion of nonsmokersin the United States is 88% (35), and the Healthy Alaskans 2020target for the proportion of Alaskans who are tobacco-free is 83%for adults (from the current baseline of 78%) (36). A 10% in-crease in the number of tobacco-free ANs would result in a to-bacco-free rate of approximately 68%, a rate more achievable thanthe state goal during the next 6 years.
CRC incidence and mortality among US men declined rapidlyafter 1998 and among women after the 1970s (37). We found asignificant decrease of 2.6% annually in CRC incidence ratesamong AN men and women combined for 1999–2011. The recentdecrease in incidence of CRC is probably due to a recent increasein colorectal screening efforts among AN people. Beginning in theearly 1990s, when high incidence rates of CRC were documented,the ANTHC began endoscopy training for nurse practitioners andphysician assistants, an effort to make endoscopy more available(38). In 2007, ANTHC supported itinerant screening colonoscopyfield clinics. ANTHC also began an outreach program to follow upand encourage colonoscopy for eligible members of families ofpatients diagnosed with CRC. This program added a patient navig-ator to encourage people due for colonoscopy to make a screeningappointment. In addition, the patient navigators assisted people byscheduling precolonoscopy appointments, assisting with travelplans, sending out appointment reminders, and answering ques-tions about the bowel preparation and procedure (39). As a result,the CRC screening rate among AN people 50 years or older in-creased from 29% in 2000 to 65% in 2011 (12). A grant awardedby the Centers for Disease Control and Prevention to individualAlaska tribal health organizations provides patient navigators inmedical centers at several regional hubs to assist AN people in rur-al areas in accessing CRC screening. Because CRC screening hasincreased only during recent years, significant reductions in CRCmortality are not expected immediately.
National data indicate that breast cancer mortality has not de-clined among AI/AN women in the United States (40). Breast can-cer incidence and mortality declines in US white women are attrib-uted to decreases in the use of hormone replacement therapy, in-creases in screening by mammography, early detection of in situdisease, and improvements in breast cancer treatment. Breast can-cer incidence rates were once low among AN women (13,41) butthen increased dramatically from 1970 to 1997; they have since re-mained constant. Rates of mammography (mammography in thepast 2 years) among AN women aged 50 to 74 who had a mammo-gram in the past 2 years (76.8%) are similar to rates among whitewomen in Alaska (74.9%), according to BRFSS surveys for2004–2012 (33). Thirty percent of AN women with breast cancerare diagnosed when they are younger than 50. Age-specific breastcancer incidence rates among AN women younger than 50 were
14% to 23% higher than rates among US white women in our ana-lysis, although significantly different rates were found only amongwomen aged 40 to 59. In light of these data, changing screeningrecommendations for mammography to an earlier age may beworthy of consideration. Further study is needed to understandhow risk factors such as race, gravidity and parity, age at firstmammogram, screening history, stage at diagnosis, use of hor-mone replacement therapy, and family history of breast cancerhave influenced breast cancer incidence and mortality among ANwomen.
The US Healthy People 2020 target is to reduce death rates by10% for all cancer deaths from 179 to 161 deaths per 100,000people. The Healthy Alaskans 2020 target to reduce cancer deathrates is 162 deaths per 100,000, an 8% reduction over the baselinerate of 176 per 100,000 (36). The AN cancer mortality rate for2001–2011 was 246 per 100,000 for all cancer sites combined,36% higher than the rate among US whites (181 per 100,000). Arecent review indicated that cancer mortality among ANs has notchanged, whereas rates among US whites declined in the past 2decades (22). It is unlikely that AN people will meet the state ornational 2020 targets of cancer mortality reduction, especially be-cause smoking rates have not decreased.
CRC and breast cancer screening programs appear to be having animpact on controlling breast cancer incidence and reducing CRCincidence rates. It is not known how many people would benefitfrom increased screening efforts, but BRFSS data from surveyyears 2004–2012 combined indicated that approximately 23% ofAN women aged 50 to 74 did not receive a mammogram in the 2years before the telephone interview. BRFSS survey data fromcombined years 2010–2012 also indicated that 40% of AN menand women aged 50 or older have not had a sigmoidoscopy orcolonoscopy.
The impact of the CRC screening program may contribute to fu-ture declines in CRC mortality rates. Improvements in treatment ofcancer may also contribute to the relatively stable rates seen forbreast and lung cancer. The impact of tobacco cessation programsis not detectable on tobacco use trends among AN adults accord-ing to BRFSS data. Further study is needed to examine changes insmoking behavior in regions where smoking cessation programsare most active.
PREVENTING CHRONIC DISEASE VOLUME 11, E221
PUBLIC HEALTH RESEARCH, PRACTICE, AND POLICY DECEMBER 2014
The opinions expressed by authors contributing to this journal do not necessarily reflect the opinions of the U.S. Department of Health and Human Services,
the Public Health Service, the Centers for Disease Control and Prevention, or the authors’ affiliated institutions.
www.cdc.gov/pcd/issues/2014/13_0369.htm • Centers for Disease Control and Prevention 5

Our study has several limitations. Classification of cancer cases byAI/AN race was largely determined by eligibility for tribal healthservices. Denominator data were obtained from the US Census;participants self-identified as a single race in census years 1970,1980, and 1990. Beginning with the Census 2000, individualscould choose more than one race, and the combination of AI/ANplus another race inflated the expected population counts for AI/AN in Alaska by about 10%. Several adjustments were made tocorrect for the overestimate of the AN population, including theprocess of “bridging,” which allowed a comparison of data beforeand after the Census 2000. Although eligibility for tribal healthservices can be identified for cases, it cannot be determined fromcensus data.
Many of our incidence and mortality counts had small values, anddifferences between rates were difficult to detect. Combining sev-eral years of data is often needed to provide reliable estimates, butshifts in trends may not be identified for several years when usingthis approach. Because of the small number of deaths, we couldnot perform Joinpoint analysis on AN mortality rates.
The objective of this study was to describe patterns in cancer in-cidence and mortality and trends over time among AN people, byage and sex, and to compare these data with US data to identifydisparities. Our data provide information to assess the impact ofcancer control interventions (such as colonoscopy in reducingCRC). Cancer incidence rates paired with risk factor data mayprovide communities with information from which cancer preven-tion programs may be built. We hope to provide a resource forhealth care providers, tribal leaders, communities, and individualswho work to improve the health of AN people.
Disparities in cancer persist among AN people. Overall cancer in-cidence rates for both sexes combined among AN people exceedrates among the US white population, largely because of a 16%excess rate among AN women. Rates among AN men and womenare higher than rates among US whites for multiple site-specificcancers: lung, stomach, colorectal, kidney, and nasopharynx.Rates among ANs increased for all cancers and selected sites;whereas rates among US whites decreased — increasing cancerdisparities. Further studies are needed to identify the causes for theunique cancer pattern and ways to enhance cancer control.
AcknowledgmentsThe authors recognize the work of the many cancer registrars andothers working throughout the state who have ensured the com-pleteness and accuracy of information on cancer among ANpeople. Funding for the SEER Alaska Native Tumor Registry isprovided through Interagency Agreement No. Y1-PC-0064-01with the National Institutes of Health, National Cancer InstituteSEER Program.
Author InformationCorresponding Author: Janet J. Kelly, Alaska Native Tribal HealthConsortium, Alaska Native Epidemiology Center, Division ofCommunity Health Services, 3900 Ambassador Dr, Anchorage,A l a s k a 9 9 5 0 8 . T e l e p h o n e : 9 0 7 - 7 2 9 - 3 9 4 9 . E - m a i l :[email protected].
Author Affiliations: Anne P. Lanier, Teresa Schade, JenniferBrantley; B. Michael Starkey, Alaska Native Tribal HealthConsortium, Alaska Native Epidemiology Center, Division ofCommunity Health Services, Anchorage, Alaska.
ReferencesDay G, Holck P, Provost E. Alaska Native mortality update:2004–2008. Anchorage: Alaska Native Epidemiology CenterReport, Alaska Native Tribal Health Consortium; 2011. http://anthctoday.org/epicenter/publications/mortality/index.html.Accessed January 12, 2013.
1.
Lanier AP, Kelly JJ, Maxwell J, McEvoy T, Homan C. Cancerin Alaska Native people, 1969–2003. Alaska Med 2006;48(2):30–59.
2.
Arthaud JB. Anaplastic parotid carcinoma (“malignantlymphoepithelial lesion”) in seven Alaska Natives. Am J ClinPathol 1972;57(3):275–86.
3.
Fortuine R. Characteristics of cancer in the Eskimos ofsouthwestern Alaska. Cancer 1969;23(2):468–74.
4.
Hurst EE. Malignant tumors in Alaska Eskimos, uniquepredominance of carcinoma of the esophagus in AlaskaEskimo women. Cancer 1964;17(9):1187–96.
5.
Johnson MW, editor. Lung cancer among the Alaska Natives.Science in Alaska, Proceedings of the fifteenth AlaskanScience Conference. 1964Aug 31–Sep 4; Juneau, Alaska.
6.
Torrey EF. Malignant neoplasms among Alaskan Natives: anepidemiologic approach to cancer. McGill Med J 1962;31:107–15.
7.
PREVENTING CHRONIC DISEASE VOLUME 11, E221
PUBLIC HEALTH RESEARCH, PRACTICE, AND POLICY DECEMBER 2014
The opinions expressed by authors contributing to this journal do not necessarily reflect the opinions of the U.S. Department of Health and Human Services,
the Public Health Service, the Centers for Disease Control and Prevention, or the authors’ affiliated institutions.
6 Centers for Disease Control and Prevention • www.cdc.gov/pcd/issues/2014/13_0369.htm

Blot WJ, Lanier AP, Fraumeni JFJr, Bender TR. Cancermortality among Alaskan natives, 1960–69. J Natl Cancer Inst1975;55(3):547–54.
8.
Lanier AP, Bender TR, Blot WJ, Fraumeni JFJr, Hurlbert WB.Cancer incidence in Alaska natives. Int J Cancer 1976;18(4):409–12.
9.
Lanier AP, Knutson LR. Cancer in Alaskan natives: a 15-yearsummary. Alaska Med 1986;28(2):37–41.
10.
Lanier AP, Kelly JJ, Smith B, Harpster AP, Tanttila H,Amadon C, et al. Alaska Native cancer update: incidence rates1989–1993. Cancer Epidemiol Biomarkers Prev 1996;5(9):749–51.
11.
Lanier AP, Kelly JJ, Holck P, Smith B, McEvoy T, Sandidge J.Cancer incidence in Alaska Natives thirty-year report1969–1998. Alaska Med 2001;43(4):87–115.
12.
Lanier AP, Kelly JJ, Maxwell J, McEvoy T, Homan C. Cancerin Alaska Native people, 1969-2003. Alaska Med 2006;48(2):30–59.
13.
About the Alaska Native Tribal Health Consortium. Anchorage(AK): Alaska Native Tribal Health Consortium. http://anthctoday.org/about/index.html. Accessed October 20, 2014.
14.
Surveillance, Epidemiology and End Results program.Bethesda (MD): National Cancer Inst i tute. ht tp: / /seer.cancer.gov/about/. Accessed May 13, 2014.
15.
Surveillance Epidemiology and End Results (SEER) programSEER*Stat database: Populations — total U.S. (1981–2011),state-level, by expanded race <single ages to 85+, Katrina/Ritaadjustment>. Bethesda (MD): National Cancer Institute,Division of Cancer Control and Population Sciences,Surveillance Research Program, Surveillance Systems Branch;released October 2012. http://www.seer.cancer.gov.AccessedMay 13, 2014.
16.
Surveillance Epidemiology and End Results (SEER) programSEER*Stat database: Incidence — SEER 18 regs research data+ Hurricane Katrina impacted Louisiana cases, Nov 2013 sub(2000–2011) <Katrina/Rita population adjustment> linked tocounty attributes — total U.S., 1969–2012 counties. Bethesda(MD): National Cancer Institute, Division of Cancer Controland Population Sciences, Surveillance Research Program,Surveillance Systems Branch; released April 2014, based onthe November 2013 submission. http://www.seer.cancer.gov .AccessedMay 13, 2014.
17.
Surveillance Epidemiology and End Results (SEER) programSEER*Stat database: Incidence — SEER 9 regs research data,Nov 2013 sub (1973–2011) <Katrina/Rita populationadjustment> linked to county attributes — total U.S.,1969–2012 counties. Bethesda (MD): National CancerInstitute, Division of Cancer Control and Population Sciences,Surveillance Research Program, Surveillance Systems Branch;released April 2014, based on the November 2013 submission.http://www.seer.cancer.gov. Accessed May 13, 2014.
18.
Surveillance Epidemiology and End Results (SEER) programSEER*Stat database: Mortality — all COD, aggregated withstate, total U.S. (1990–2011) <Katrina/Rita populationadjustment>. Bethesda (MD): National Cancer Institute,Division of Cancer Control and Population Sciences,Surveillance Research Program, Surveillance Systems Branch;released July 2014. http://www.seer.cancer.gov. Underlyingmortality data provided by National Center for HealthStatistics. http://www.cdc.gov/nchs. Accessed September 26,2014.
19.
SEER*Stat statistical software, version 8.1.2. Bethesda (MD):National Cancer Institute, Surveillance Research Program,Surveillance Systems Branch. http://www.seer.cancer.gov/seerstat. Accessed May 13, 2014.
20.
Joinpoint regression program, version 4.0.4. Bethesda (MD):N a t i o n a l C a n c e r I n s t i t u t e ; M a y 2 0 1 3 . h t t p : / /surveillance.cancer.gov/joinpoint. Accessed July 28, 2014.
21.
Edwards BK, Noone A-M, Mariotto AB, Simard EP, BoscoeFP, Henley SJ, et al. Annual report to the nation on the statusof cancer, 1975–2010, featuring prevalence of comorbidity andimpact on survival among persons with lung, colorectal, breast,or prostate cancer. Cancer 2014;120(9):1290–314.
22.
Sugarman JR, Holliday M, Ross A, Castoria J, Hui Y.Improving American Indian cancer data in the WashingtonState Cancer Registry using linkages with the Indian HealthService and tribal records. Cancer 1996;78(7,7 Suppl):1564–8.
23.
Partin MR, Rith-Najarian SJ, Slater JS, Korn JE, Cobb N,Soler JT. Improving cancer incidence estimates for AmericanIndians in Minnesota . Am J Publ ic Heal th 1999;89(11):1673–7.
24.
Kwong S, Perkings C, Snipes K, Wright W. ImprovingAmerican Indian cancer data in the California Cancer Registryby linkage with the Indian Health Service. J Registry Manag1998;25:17–20.
25.
Becker TM, Bettles J, Lapidus J, Campo J, Johnson CJ,Shipley D, et al. Improving cancer incidence estimates forAmerican Indians and Alaska Natives in the Pacific Northwest.Am J Public Health 2002;92(9):1469–71.
26.
PREVENTING CHRONIC DISEASE VOLUME 11, E221
PUBLIC HEALTH RESEARCH, PRACTICE, AND POLICY DECEMBER 2014
The opinions expressed by authors contributing to this journal do not necessarily reflect the opinions of the U.S. Department of Health and Human Services,
the Public Health Service, the Centers for Disease Control and Prevention, or the authors’ affiliated institutions.
www.cdc.gov/pcd/issues/2014/13_0369.htm • Centers for Disease Control and Prevention 7

Espey DK, Wiggins CL, Jim MA, Miller BA, Johnson CJ,Becker TM. Methods for improving cancer surveillance data inAmerican Indian and Alaska Native populations. Cancer 2008;113(5Suppl):1120–30.
27.
Wiggins CL, Espey DK, Wingo PA, Kaur JS, Wilson RT,Swan J, et al. Cancer among American Indians and AlaskaNatives in the United States, 1999–2004. Cancer 2008;113(5Suppl):1142–52.
28.
Cobb N, Wingo PA, Edwards BK. Introduction to thesupplement on cancer in the American Indian and AlaskaNative populations in the United States. Cancer 2008;113(5Suppl):1113–6.
29.
Bliss A, Cobb N, Solomon T, Cravatt K, Jim MA, Marshall L,et al. Lung cancer incidence among American Indians andAlaska Natives in the United States, 1999–2004. Cancer 2008;113(5Suppl):1168–78.
30.
Perdue DG, Perkins C, Jackson-Thompson J, Coughlin SS,Ahmed F, Havercamp DS, et al. Regional differences incolorectal cancer incidence, stage, and subsite amongAmerican Indians and Alaska Natives, 1999–2004. Cancer2008;113(5 Suppl):1179–90.
31.
Wingo PA, King J, Swan J, Coughlin SS, Kaur J, Erb-AlvarezJA, et al. Breast cancer incidence among American Indian andAlaska Native women: US, 1999–2004. Cancer 2008;113(5Suppl):1191–202.
32.
Health risks in Alaska among adults — Alaska BehavioralRisk Factor Survey reports, 1990–2010. Anchorage (AK):State of Alaska, Department of Health and Social Services,Division of Public Health, Chronic Disease Prevention andHealth Promotion. http://www.hss.state.ak.us/dph/chronic/hsl/brfss/publications.htm. Accessed July 7, 2014.
33.
Youth Risk Behavior Survey (YRBS), 2003–2011. Anchorage(AK): State of Alaska, Department of Health and SocialServices, Division of Public Health. http://dhss.alaska.gov/dph/Chronic/Pages/yrbs/yrbs.aspx. Accessed August 27, 2014.
34.
Healthy people 2020: tobacco use. Washington (DC): USD e p a r t m e n t o f H e a l t h a n d H u m a n S e r v i c e s .www.HealthyPeople.gov/2020/topicsObjectives2020/overview.aspx?topicid=41. Accessed August 27, 2014.
35.
Healthy Alaskans 2020. Anchorage (AK): State of Alaska,Department of Health and Social Services; 2013. http://hss.state.ak.us/ha2020/. Accessed August 27, 2014.
36.
Edwards BK, Kohler BA, Eheman C, Zauber AG, AndersonRN, Jemal A, et al. Annual report to the nation on the status ofcancer, 1975–2006, featuring colorectal cancer trends andimpact of interventions (risk factors, screening, and treatment)to reduce future rates. Cancer 2010;116(3):544–73.
37.
Redwood D, Joseph DA, Christensen C, Provost E, PetersonVL, Espey D, et al. Development of a flexible sigmoidoscopytraining program for rural nurse practitioners and physicianassistants to increase colorectal cancer screening amongAlaska Native people. J Health Care Poor Underserved 2009;20(4):1041–8.
38.
Redwood D, Provost E, Perdue DG, Haverkamp D, Espey D.The last frontier: innovative efforts to reduce colorectal cancerdisparities among the remote Alaska Native population.Gastrointest Endosc 2012;75(3):474–80.
39.
White A, Richardson LC, Li C, Ekwueme DU, Kaur JS. Breastcancer mortality among American Indian and Alaska Nativewomen, 1990–2009. Am J Public Health 2014;104(Suppl3):S432–8.
40.
Kelly JJ, Lanier AP. Cancer in Alaska Native people,1969–2008: 40-year report. Anchorage (AK): Alaska NativeTumor Registry, Epidemiology Center, Alaska Native TribalHealth Consortium; 2012. http://anthctoday.org/epicenter/publications/index.html. Accessed January 12, 2013.
41.
PREVENTING CHRONIC DISEASE VOLUME 11, E221
PUBLIC HEALTH RESEARCH, PRACTICE, AND POLICY DECEMBER 2014
The opinions expressed by authors contributing to this journal do not necessarily reflect the opinions of the U.S. Department of Health and Human Services,
the Public Health Service, the Centers for Disease Control and Prevention, or the authors’ affiliated institutions.
8 Centers for Disease Control and Prevention • www.cdc.gov/pcd/issues/2014/13_0369.htm

Tables
Table 1. Average Annual Age-Adjusted Cancer Incidence Ratesa per 100,000, Alaska Native and US White Men and Women,2007–2011
Cancer Siteb
Men Women
No.AlaskaNative
USWhite
Rate Ratio (PValue) No.
AlaskaNative
USWhite Rate Ratio (P Value)
All sites 899 501.3 532.1 0.94 (.11) 1,069 495.5 424.4 1.16 (<.001)
Oral cavity and pharynx 39 18.5 17.0 1.08 (.69) 18 7.8 6.4 1.22 (.47)
Nasopharynx 13 6.5 0.6 10.71 (<.001) 6 2.7 0.3 10.39 (<.001)
Digestive system 310 167.2 99.9 1.67 (<.001) 265 129.7 66.6 1.94 (<.001)
Esophagus 9 4.1 8.0 0.50 (.06) 10 4.4 1.7 2.53 (.02)
Stomach 47 26.0 9.2 2.82 (<.001) 38 17.6 4.5 3.94 (<.001)
Colon and rectum 173 95.6 49.6 1.92 (<.001) 153 75.9 37.3 2.03 (<.001)
Colon only 109 64.8 34.3 1.89 (<.001) 115 58.1 27.5 2.11 (<.001)
Rectum only 45 21.1 11.5 1.83 (<.001) 30 14.1 7.1 1.99 (.001)
Liver 28 13.8 10.0 1.37 (.18) 12 5.8 2.9 1.97 (.06)
Gallbladder 3 2.0 0.8 2.66 (.25) 6 3.6 1.4 2.57 (.08)
Pancreas 37 19.1 14.0 1.36 (.10) 28 14.1 10.7 1.31 (.21)
Respiratory system 197 123.4 79.6 1.55 (<.001) 152 79.0 55.7 1.41 (<.001)
Larynx 12 7.0 6.0 1.15 (.74) 3 1.2 1.3 0.85 (>.99)
Lung and bronchus 183 115.3 72.4 1.59 (<.001) 148 77.6 53.8 1.44 (<.001)
Bones and joints 3 0.9 1.2 0.75 (1.0) 1 0.3 0.8 0.36 (.65)
Soft tissue and heart 5 2.8 4.2 0.66 (.47) 11 4.2 2.8 1.48(.30)
Skin, excluding basal and squamous 8 3.4 35.3 0.09 (<.001) 9 4.3 21.4 0.20 (<.001)
Melanoma of the skin 7 3.1 32.3 0.09 (<.001) 6 2.8 20.0 0.14 (<.001)
Breast 1 0.7 1.2 0.54 (.72) 303 131.6 128.0 1.02 (.66)
Female genital system — — — — 113 47.5 50.5 0.94 (.56)
Cervix uteri — — — — 30 11.2 7.8 1.42 (.08)
Corpus uteri — — — — 41 16.6 25.4 0.65 (.006)
Ovary — — — — 28 13.4 13.0 1.03 (.92)
Male genital system 140 76.6 147.7 0.51 (<.001) — — — —
Prostate 119 67.5 139.9 0.48 (<.001) — — — —
Testis 18 7.2 6.6 1.08 (.79) — — — —
Urinary system 89 52.8 62.5 0.84 (.15) 53 26.2 21.0 1.24 (.16)
Urinary bladder 34 22.5 39.4 0.57 (.002) 9 5.2 9.5 0.54 (.07)
Kidney and renal pelvis 55 30.3 21.7 1.39 (.04) 44 21.0 11.0 1.90 (<.001)
a Source of data: Surveillance Epidemiology and End Results (SEER) program SEER*Stat database (17).b Not all cancer site subgroups are shown for the major cancer site groups.
(continued on next page)
PREVENTING CHRONIC DISEASE VOLUME 11, E221
PUBLIC HEALTH RESEARCH, PRACTICE, AND POLICY DECEMBER 2014
The opinions expressed by authors contributing to this journal do not necessarily reflect the opinions of the U.S. Department of Health and Human Services,
the Public Health Service, the Centers for Disease Control and Prevention, or the authors’ affiliated institutions.
www.cdc.gov/pcd/issues/2014/13_0369.htm • Centers for Disease Control and Prevention 9

(continued)
Table 1. Average Annual Age-Adjusted Cancer Incidence Ratesa per 100,000, Alaska Native and US White Men and Women,2007–2011
Cancer Siteb
Men Women
No.AlaskaNative
USWhite
Rate Ratio (PValue) No.
AlaskaNative
USWhite Rate Ratio (P Value)
Eye and orbit 3 2.2 1.1 2.07 (0.42) 0 — — —
Brain and nervous system 11 4.7 8.4 0.55 (.08) 19 7.0 6.0 1.17 (.56)
Endocrine system 12 5.4 7.7 0.70 (.31) 38 15.2 21.1 0.72 (.05)
Thyroid 11 5.2 6.9 0.75 (.45) 35 14.0 20.4 0.68 (.03)
Lymphoma 30 13.8 28.2 0.48 (<.001) 31 14.2 19.8 0.71 (.08)
Non-Hodgkin lymphoma 27 13.1 24.9 0.52 (.001) 30 13.8 17.2 0.80 (.27)
Myeloma 8 5.2 7.2 0.71 (.43) 5 2.2 4.3 0.50 (.15)
Leukemia 18 7.7 17.5 0.43 (.002) 17 5.8 10.7 0.53 (.01)
Mesothelioma 1 0.3 2.1 0.16 (.004) 0 — — —
Kaposi sarcoma 2 1.3 0.9 1.51 (.81) 1 0.6 0.1 7.54 (.25)
Undefined 22 14.5 10.5 1.37 (.25) 33 19.8 7.9 2.51 (<.001)a Source of data: Surveillance Epidemiology and End Results (SEER) program SEER*Stat database (17).b Not all cancer site subgroups are shown for the major cancer site groups.
PREVENTING CHRONIC DISEASE VOLUME 11, E221
PUBLIC HEALTH RESEARCH, PRACTICE, AND POLICY DECEMBER 2014
The opinions expressed by authors contributing to this journal do not necessarily reflect the opinions of the U.S. Department of Health and Human Services,
the Public Health Service, the Centers for Disease Control and Prevention, or the authors’ affiliated institutions.
10 Centers for Disease Control and Prevention • www.cdc.gov/pcd/issues/2014/13_0369.htm
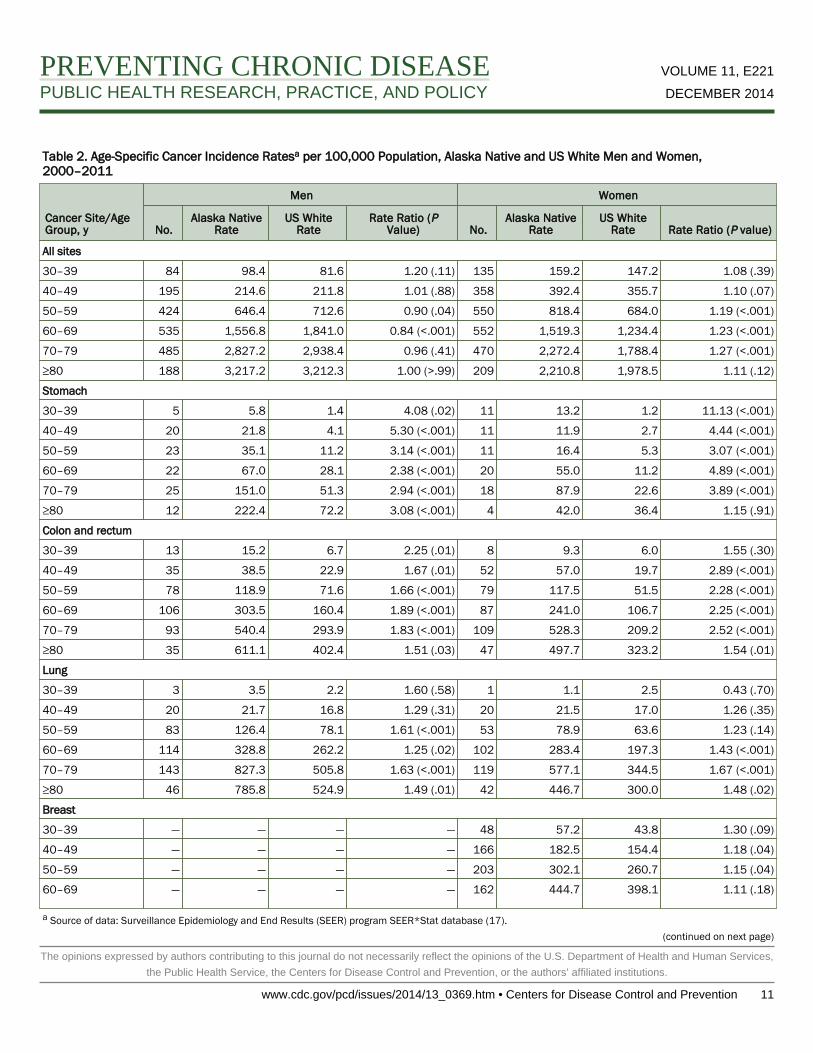
Table 2. Age-Specific Cancer Incidence Ratesa per 100,000 Population, Alaska Native and US White Men and Women,2000–2011
Cancer Site/AgeGroup, y
Men Women
No.Alaska Native
RateUS White
RateRate Ratio (P
Value) No.Alaska Native
RateUS White
Rate Rate Ratio (P value)
All sites
30–39 84 98.4 81.6 1.20 (.11) 135 159.2 147.2 1.08 (.39)
40–49 195 214.6 211.8 1.01 (.88) 358 392.4 355.7 1.10 (.07)
50–59 424 646.4 712.6 0.90 (.04) 550 818.4 684.0 1.19 (<.001)
60–69 535 1,556.8 1,841.0 0.84 (<.001) 552 1,519.3 1,234.4 1.23 (<.001)
70–79 485 2,827.2 2,938.4 0.96 (.41) 470 2,272.4 1,788.4 1.27 (<.001)
≥80 188 3,217.2 3,212.3 1.00 (>.99) 209 2,210.8 1,978.5 1.11 (.12)
Stomach
30–39 5 5.8 1.4 4.08 (.02) 11 13.2 1.2 11.13 (<.001)
40–49 20 21.8 4.1 5.30 (<.001) 11 11.9 2.7 4.44 (<.001)
50–59 23 35.1 11.2 3.14 (<.001) 11 16.4 5.3 3.07 (<.001)
60–69 22 67.0 28.1 2.38 (<.001) 20 55.0 11.2 4.89 (<.001)
70–79 25 151.0 51.3 2.94 (<.001) 18 87.9 22.6 3.89 (<.001)
≥80 12 222.4 72.2 3.08 (<.001) 4 42.0 36.4 1.15 (.91)
Colon and rectum
30–39 13 15.2 6.7 2.25 (.01) 8 9.3 6.0 1.55 (.30)
40–49 35 38.5 22.9 1.67 (.01) 52 57.0 19.7 2.89 (<.001)
50–59 78 118.9 71.6 1.66 (<.001) 79 117.5 51.5 2.28 (<.001)
60–69 106 303.5 160.4 1.89 (<.001) 87 241.0 106.7 2.25 (<.001)
70–79 93 540.4 293.9 1.83 (<.001) 109 528.3 209.2 2.52 (<.001)
≥80 35 611.1 402.4 1.51 (.03) 47 497.7 323.2 1.54 (.01)
Lung
30–39 3 3.5 2.2 1.60 (.58) 1 1.1 2.5 0.43 (.70)
40–49 20 21.7 16.8 1.29 (.31) 20 21.5 17.0 1.26 (.35)
50–59 83 126.4 78.1 1.61 (<.001) 53 78.9 63.6 1.23 (.14)
60–69 114 328.8 262.2 1.25 (.02) 102 283.4 197.3 1.43 (<.001)
70–79 143 827.3 505.8 1.63 (<.001) 119 577.1 344.5 1.67 (<.001)
≥80 46 785.8 524.9 1.49 (.01) 42 446.7 300.0 1.48 (.02)
Breast
30–39 — — — — 48 57.2 43.8 1.30 (.09)
40–49 — — — — 166 182.5 154.4 1.18 (.04)
50–59 — — — — 203 302.1 260.7 1.15 (.04)
60–69 — — — — 162 444.7 398.1 1.11 (.18)
a Source of data: Surveillance Epidemiology and End Results (SEER) program SEER*Stat database (17).(continued on next page)
PREVENTING CHRONIC DISEASE VOLUME 11, E221
PUBLIC HEALTH RESEARCH, PRACTICE, AND POLICY DECEMBER 2014
The opinions expressed by authors contributing to this journal do not necessarily reflect the opinions of the U.S. Department of Health and Human Services,
the Public Health Service, the Centers for Disease Control and Prevention, or the authors’ affiliated institutions.
www.cdc.gov/pcd/issues/2014/13_0369.htm • Centers for Disease Control and Prevention 11

(continued)
Table 2. Age-Specific Cancer Incidence Ratesa per 100,000 Population, Alaska Native and US White Men and Women,2000–2011
Cancer Site/AgeGroup, y
Men Women
No.Alaska Native
RateUS White
RateRate Ratio (P
Value) No.Alaska Native
RateUS White
Rate Rate Ratio (P value)
70–79 — — — — 87 420.0 460.4 0.91 (.43)
≥80 — — — — 23 244.4 412.3 0.59 (.01)
Prostate
30–39 2 2.4 0.5 5.03 (.12) — — — —
40–49 11 11.8 22.4 0.52 (.03) — — — —
50–59 65 98.9 210.8 0.46 (<.001) — — — —
60–69 101 292.5 681.2 0.42 (<.001) — — — —
70–79 63 366.5 899.7 0.40 (<.001) — — — —
≥80 28 468.9 642.7 0.72 (.11) — — — —
Kidney
30–39 6 7.3 3.8 1.92 (.19) 4 4.7 2.6 1.78 (.38)
40–49 13 14.3 13.6 1.05 (.93) 5 5.5 7.4 0.74 (.68)
50–59 29 44.2 33.8 1.30 (.19) 24 35.7 16.6 2.14 (<.001)
60–69 30 87.5 68.4 1.27 (.22) 15 40.3 32.5 1.24 (.47)
70–79 29 170.3 93.8 1.81 (<.001) 14 65.8 46.2 1.42 (.25)
≥80 7 108.9 91.2 1.19 (.75) 9 96.3 44.3 2.17 (.05)a Source of data: Surveillance Epidemiology and End Results (SEER) program SEER*Stat database (17).
PREVENTING CHRONIC DISEASE VOLUME 11, E221
PUBLIC HEALTH RESEARCH, PRACTICE, AND POLICY DECEMBER 2014
The opinions expressed by authors contributing to this journal do not necessarily reflect the opinions of the U.S. Department of Health and Human Services,
the Public Health Service, the Centers for Disease Control and Prevention, or the authors’ affiliated institutions.
12 Centers for Disease Control and Prevention • www.cdc.gov/pcd/issues/2014/13_0369.htm

Table 3. Joinpoint Analyses for Trends Among Alaska Native (1970–2011) and US White (1973–2011) 2-Year Averaged AnnualCancer Incidence Rates — Model Selections
Site/Sex Trend 1 APCa, b Trend 2 APCa, b Trend 3 APCa, b Trend 4 APCa, b
All Sites
Men and women
Alaska Native 1970–2005 1.1b 2005–2011 −1.9 — — — —
US white 1973–1982 0.9b 1982–1991 1.7b 1991–2008 −0.2b 2008–2011 1.7
Men
Alaska Native 1970–2011 0.7b — — — — — —
US white 1973–1989 1.5b 1989–1992 4.7 1992–1995 −3.7 1995–2011 −0.5b
Women
Alaska Native 1970–2011 1.2b — — — — — —
US white 1973–1982 0.5b 1982–1985 2.6 1985–1999 0.5b 1999–2011 −0.2
Lung
Men and women
Alaska Native 1970–1985 7.2b 1985–2011 0.2 — — — —
US white 1973–1981 2.9b 1981–1990 1.3b 1990–2007 −1.6b 2007–2011 −2.6b
Men
Alaska Native 1970–1995 2.8b 1995–2011 −1.5 — — — —
US white 1973–1978 2.6b 1978–1988 0.3 1988–2007 −1.6b 2007–2011 −2.9b
Women
Alaska Native 1970–1985 12.9b 1985–2011 0.9 — — — —
US white 1973–1982 6.3b 1982–1991 3.5b 1991–2007 0.6b 2007–2011 −2.5b
Colorectal
Men and women
Alaska Native 1970–1999 1.6b 1999–2011 −2.6b — — — —
US white 1973–1985 0.9b 1985–1995 −2.0b 1995–1998 2.1 1998–2011 −2.9b
Men
Alaska Native 1970–1997 2.0b 1997–2011 −1.9 — — — —
US white 1973–1986 1.1b 1986–1995 −2.3b 1995–1998 1.8 1998–2011 −3.3b
Women
Alaska Native 1970–2005 0.9 2005–2011 −7.3 — — — —
US white 1973–1984 0.7b 1984–1995 −2.0b 1995–1998 2.4 1998–2011 −2.6b
Breast
Women
Alaska Native 1970–1997 5.1b 1997–2011 −0.3 — — — —
US white 1973–1980 −0.5 1980–1987 3.8b 1987–1999 0.5 1999–2011 −0.8b
a Alaska Native annual percentage change (APC) based on 2-year averaged incidence rates.b APC significantly different from zero at α = .05.
PREVENTING CHRONIC DISEASE VOLUME 11, E221
PUBLIC HEALTH RESEARCH, PRACTICE, AND POLICY DECEMBER 2014
The opinions expressed by authors contributing to this journal do not necessarily reflect the opinions of the U.S. Department of Health and Human Services,
the Public Health Service, the Centers for Disease Control and Prevention, or the authors’ affiliated institutions.
www.cdc.gov/pcd/issues/2014/13_0369.htm • Centers for Disease Control and Prevention 13