Embed Size (px)
Citation preview
H2S CONCENTRATION l p p r r i
Figure 3. Graph to determine H2S concentration from a standard gas volume of 1 liter using the modified Methylene Blue Method as de- scribed in text Solid line represents the mean, dashed lines the 95% confidence limits
The variations in the H2S concentration of different gas cylinders (see Table I ) which reached up to 160% of the specified values probably result from a loss of H2S during the analyses carried out by the various suppliers who used the standard Methylene Blue Method ( I ) . The fact that the gas suppliers' results were consistently lower than the ones obtained by the modified technique reported here can easily be explained by comparing curves A and B of Figure 1. Approximate agreement between the two techniques (and the slopes of the two curves in Figure 1) can be achieved only if small volumes of up to 300 ml of H;?S con- taining gas are analyzed. In this small volume range, how- ever, the precision of the measurements is rather poor, and it is therefore not recommended to analyze gas volumes of less than one liter. If various gas volumes from 100 to 3000 ml are analyzed b!, the standard method where H2S losses are encountered, one is at a complete loss to draw a straight line through the data points and the origin and thus derive
Table I . Comparison of H2S Concentrations Obtained on 3 Gas Cylinders by the Standard and the Modified Methylene Blue Method as Described in Text
H,S concentration, ppm
Cur analysis
95% confidence limits Gas Suppliers'
cylinders Upper Lower Mean analysis
A 16.7 13.7 15.2 10.3
B 14.8 12.7 13.8 9 C 28.5 24.0 26.2 10
(11.6)
a meaningful H2S concentration. The modifications of the Methylene Blue Method reported here eliminate this prob- lem caused by H2S losses and lead to more accurate data in the H2S analysis.
ACKNOWLEDGMENT
The author appreciates valuable suggestions by R. C. Vehse. Special thanks are due to H. J. Lory and S. F. Ny- gren for providing the computer programs.
LITERATURE CITED M. B. Jacobs, M. M. Braverman, and S. Hochheiser, Anal. Chem., 29, 1349 (1957). M. B. Jacobs, J. Air Pollut. Control Assoc., 15, 314 (1965). W. L. Bamesberger and D. F. Adams, Environ. Sci. Techno/., 3, 258 (1969). E. P. Marbach and D. M. Doty, J. Agric. FoodChem., 4, 881 (1956).
R. R. Moest Bell Telephone Laboratories, Inc. 2525 North 11th Street Reading, P A 19604
RECEIVED for review January 8, 1975. Accepted February 19, 1975.
Pretreatment of Molecular Sieve 5A to Eliminate Tailing of Nitric Oxide
Sir: Gas chromatographic analysis of NO has been plagued by reaction and/or slow desorption of NO with the supposedly inert column packing. Unacceptably large sam- ple tailing results. Dietz ( I ) reports a series of pretreatment steps designed to eliminate this problem. The object of the pretreatment is to fix NO on the highly active sites of the packing, which either react with or have a slower desorp- tion rate of NO than the normal packing. The approach is to saturate those sites with NO, which is then oxidized to NO2 by contact with 0 2 . The NO2 so formed is bound tightly to the site, presumably preventing it from reacting further or adsorbing additional NO.
This technique was used to pretreat a Molecular Sieve
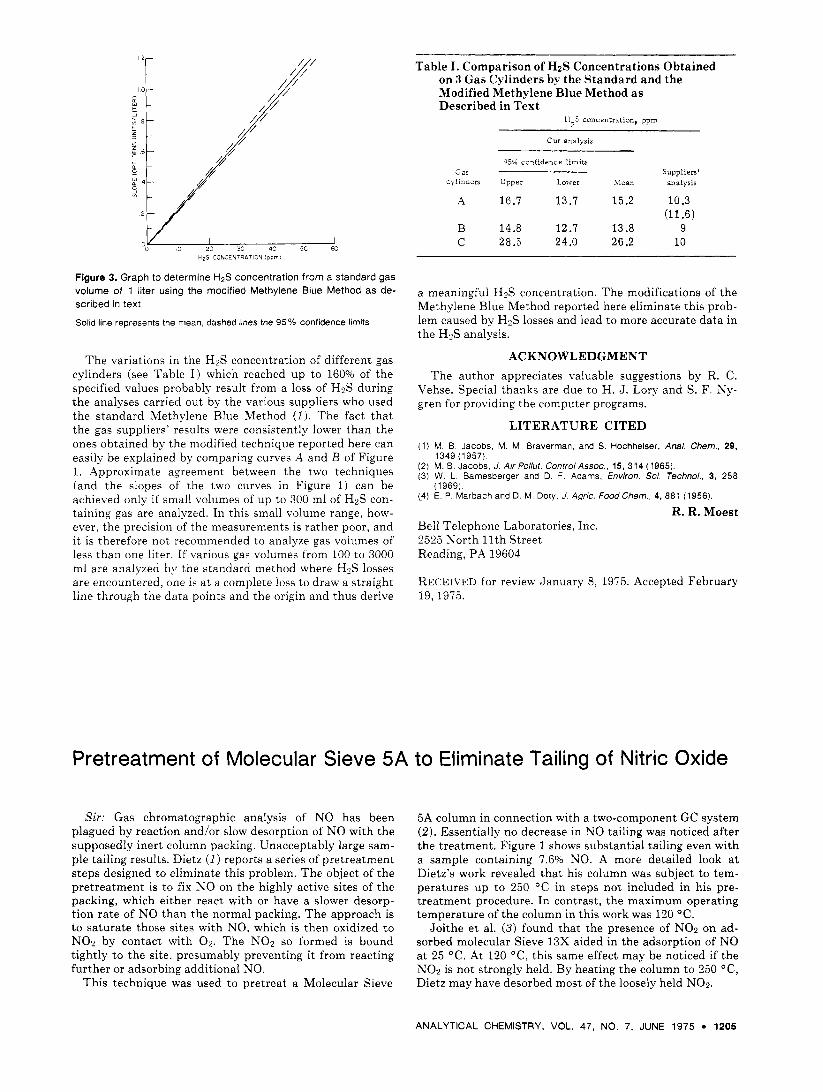
5A column in connection with a two-component GC system (2). Essentially no decrease in NO tailing was noticed after the treatment. Figure 1 shows substantial tailing even with a sample containing 7.6% NO. A more detailed look a t Dietz's work revealed that his column was subject to tem- peratures up to 250 "C in steps not included in his pre- treatment procedure. In contrast, the maximum operating temperature of the column in this work was 120 "C.
Joithe et al. ( 3 ) found that the presence of NO:! on ad- sorbed molecular Sieve 13X aided in the adsorption of N O a t 25 "C. At 120 "C, this same effect may be noticed if the NO2 is not strongly held. By heating the column to 250 "C, Dietz may have desorbed most of the loosely held NO:!.
ANALYTICAL CHEMISTRY, VOL. 47, NO. 7, J U N E 1975 1205
0 I 2 3 4 5 6 7 % Time ( m i n )
Figure 1. NO peak from column preconditioned by Dietz method [NO], 7.6%; span, 2 mV: attn, 2: system: Chromosorb 104-Molecular Sieve 5A
, Pressure
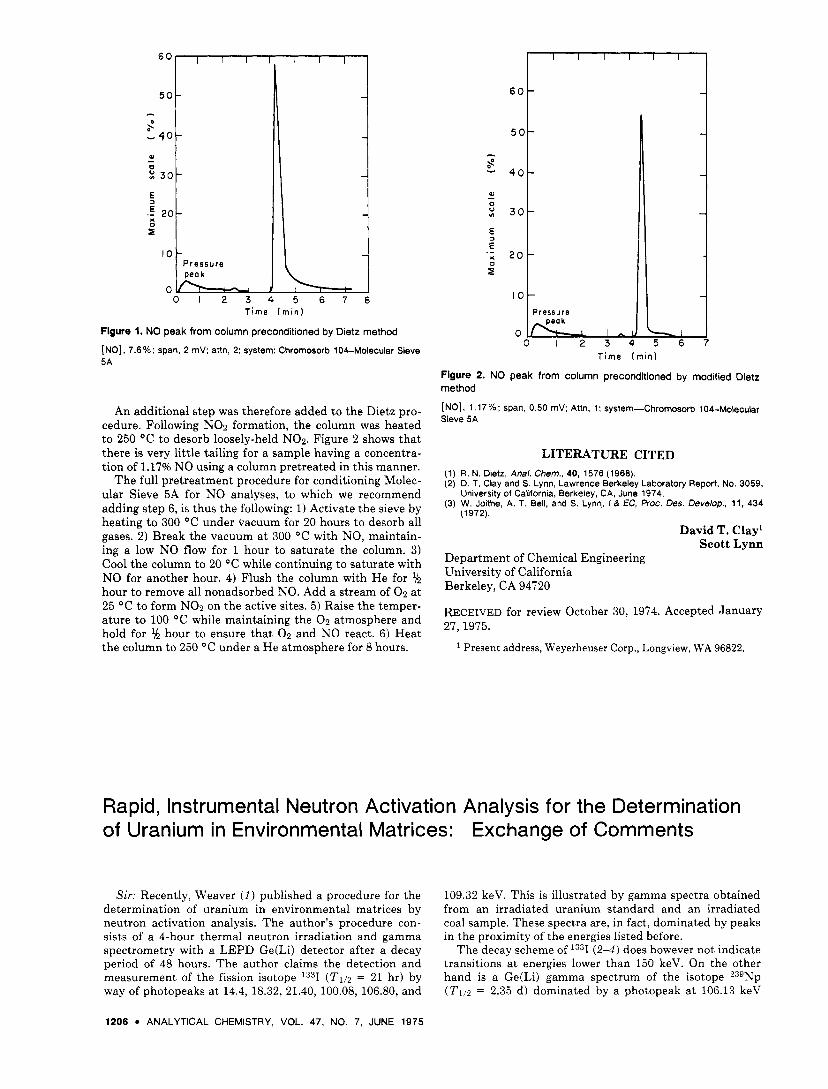
An additional step was therefore added to the Dietz pro- cedure. Following NO2 formation, the column was heated to 250 "C to desorb loosely-held NOz. Figure 2 shows that there is very little tailing for a sample having a concentra- tion of 1.17% NO using a column pretreated in this manner.
The full pretreatment procedure for conditioning Molec- ular Sieve 5A for NO analyses, to which we recommend adding step 6, is thus the following: 1) Activate the sieve by heating to 300 O C under vacuum for 20 hours to desorb all gases. 2) Break the vacuum at 300 O C with NO, maintain- ing a low NO flow for 1 hour to saturate the column. 3) Cool the column to 20 "C while continuing to saturate with NO for another hour. 4) Flush the column with He for % hour to remove all nonadsorbed NO. Add a stream of 0 2 at 25 "C to form NO:! on the active sites. 5) Raise the temper- ature to 100 OC while maintaining the 0 2 atmosphere and hold for l , hour to ensure that 0 2 and NO react. 6) Heat the column to 250 "C under a He atmosphere for 8 hours.
I I 1 I l l
0 ,, 0 1 2 3 4 5 6
T ime ( m i n )
Figure 2. NO peak from column preconditioned by modified Dietz method [NO], 1.17%; span, 0.50 mV; Attn, 1: system-Chromosorb 104-Molecular Sieve SA
LITERATURE CITED (1) R. N. Dietz, Anal. Chem., 40, 1576 (1968). (2) D. T. Clay and S. Lynn, Lawrence Berkeley Laboratory Report, No. 3059,
(3) W. Joithe, A. T. Bell, and S. Lynn, I 8 EC, Proc. Des. Develop., 11, 434
David T. Clay' Scott Lynn
University of California, Berkeley, CA. June 1974.
(1972).
Department of Chemical Engineering University of California Berkeley, CA 94720
RECEIVED for review October 30, 1974. Accepted January 27, 1975.
Present address, Weyerheuser Corp., Longview, WA 96822.
Rapid, Instrumental Neutron Activation Analysis for the Determination of Uranium in Environmental Matrices: Exchange of Comments
Sir: Recently, Weaver ( I ) published a procedure for the determination of uranium in environmental matrices by neutron activation analysis. The author's procedure con- sists of a 4-hour thermal neutron irradiation and gamma spectrometry with a LEPD Ge(Li) detector after a decay period of 48 hours. The author claims the detection and measurement of the fission isotope 1331 (2'112 = 21 hr) by way of photopeaks at 14.4, 18.32, 21.40, 100.08, 106.80, and
109.32 keV. This is illustrated by gamma spectra obtained from an irradiated uranium standard and an irradiated coal sample. These spectra are, in fact, dominated by peaks in the proximity of the energies listed before.
The decay scheme of 1331 (2-4) does however not indicate transitions at energies lower than 150 keV. On the other hand is a Ge(Li) gamma spectrum of the isotope 239Np ( 2 ' 1 ~ 2 = 2.35 d) dominated by a photopeak at 106.13 keV
1206 ANALYTICAL CHEMISTRY, VOL. 47, NO. 7, JUNE 1975