Embed Size (px)
Citation preview

Presented by:
You Are Your Biggest BarrierWhy Cross-Channel Measurement Should Be the Standard and Not the Exception
Albert Chou

2
• Enterprise software change mgmt
• Low risk Day trader (BABA)
• Avid surfer
• Go Gators
Who we are
• Digital marketing consultant
• NY Times best-selling author
• Blogger, podcaster, speaker
• MarketingPodcasts.com
• Certified BBQ judge
The Challenge
4
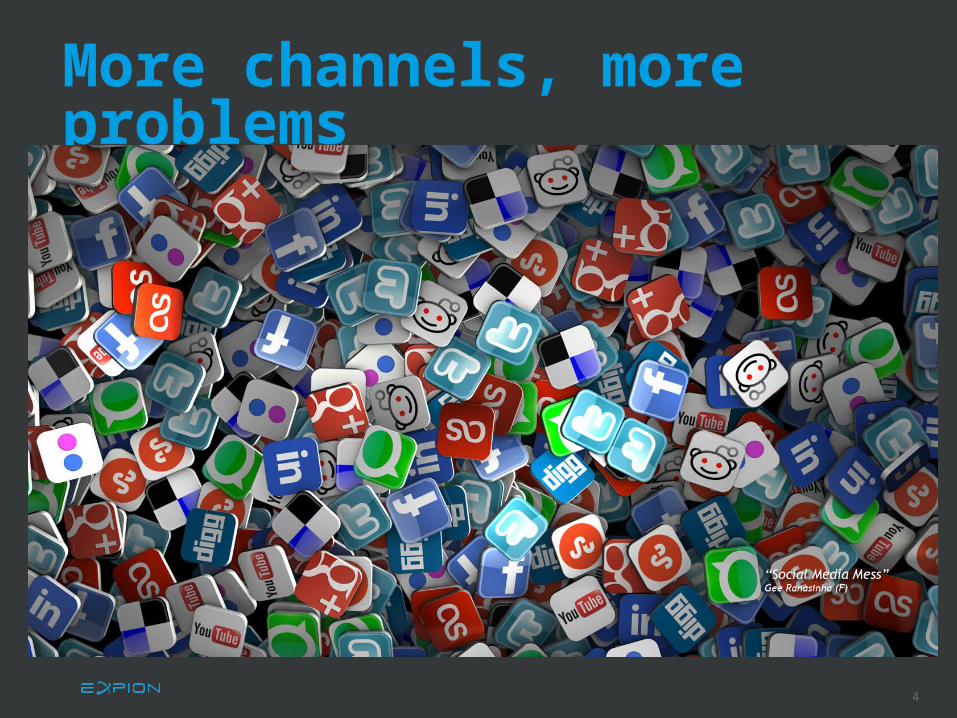
More channels, more problems

5
I need ONE number

6
Which one?

When you start with “but,” you startthe confusion.

“But I have a different strategy!”
“But Twitter is different from Facebook!”
“But the audiences are different!”
“But we did a special campaign!”
“But my brand has more fans than that!”

Get a grip!You can only
compare like things.

10
Case Example: Supply Chain at Yamaha

11
Yamaha = Diverse Products
Look at these products! How can they measure production efficiency?

12
• Cost of Production
• Revenue per Hour of Labor
• Cost of Goods Sold
• Profit Margin
• Operating Margin
• Capacity to Manufacture
• Profit & Loss
Common
• Market Size
• Competitor Share
• Turn time
• Sales
• Sales by unique SKU
Unique (By Product, By Vertical)
How it’s Done:Focus on the Common

13
Overall Manager
Common
Specialist
Unique (By Product, By Vertical)
Who needs which metric type?
Please compare thisto social media
examples

15
• Likes, favorites, +1
• Shares, retweets, reblogs, repins
• Reach and impressions
• Cost of reach and impressions
• Cost to support
• Outcomes of channels
• Click-through purchases
• Profit & Loss
Common
• Unique metrics (consumptions)
• People by demographic
• People by location
• Mentions by platform
Unique (By Platform)
Joined Metrics = Commonality

16
• Likes
• Comments
• Shares
• Wall Posts
• Replies
• Private Message
• Favorite
• Retweet
• Replies
• Mentions
• Direct Message
• Comment
• Like
• Mentions
• Views
• Like
• Comment
• Shares
Measuring apples to oranges

17
• Likes
• Comments
• Shares
• Wall Posts
• Replies
• Private Message
• Favorite
• Retweet
• Replies
• Mentions
• @Mentions
• Direct Message
• Comment
• Like
• Mentions
• Views
• Like
• Comment
• Shares
Start: Identify Common Outcomes

18
One standard for all channels
• Glossaries standardize how to talk about outcomes• Formulas educate the group about expectations• Common language allows for applicable learning

19
Example: Shopify

Outputs have costs.Costs = Inputs.
What is your input per output?

21
Supporting Social Carries Costs

22
Key Factors for Costs
(Wages)(% time on social) + Agency Fees + Media Spend + Miscellaneous Creative Fees
365
= Average Daily Costs

23
How can you do more while controlling costs?
Average Daily Cost = $1,000FB Posts Per Week = 5Tweets Per Week = 20
+
• Can you afford the lift in cost to support a new channel• Will the costs net you a greater output• Will you sacrifice from other channels• Will your outputs per dollar of cost improve

24
Are we engaging or selling?
• Highest area of traffic comes from Facebook• FB costs < Total Sales = Very Nice

Trending > Reporting

26
You don’t need a data scientist.

27
You need a trend: Better or worse than before?

Executives: Multi-Brand Scorecards

29

Community Manager:Multi-Channel Brand
Scorecard

31
Community managers prefer landscapes

Most Common Need:High-Performing, Quality Content Per Dollar Spent

33
This is bad:
Inputs
Outputs

34
This is good:
Costs
Outputs

35
This is really bad:Inputs
Outputs

36
This is really good:
Inputs
Outputs

1. A single source of measurement
2. Find common grounds and standardize
3. Support brand uniqueness
4. Share knowledge to change the trend
5. Enforce Cost/Input standards
How to Get There: