Embed Size (px)
Citation preview

Prospects and challenges ofSolar Power in India
Bibek BandyopadhyayBibek Bandyopadhyay
J d U i iJadavpur UniversityOctober 28, 2013

It i tIt is trueThe Earth’s climate is warming up g p


Each of the last three decades has been successively warmer at the Earth’s surfacethan any preceding decade since 1850.
Ocean warming dominates the increase in d h lenergy stored in the climate system,
accounting for more than 90% of the energy accumulated between 1971 and 2010.
CO2 concentrations have increased by 40% since pre‐industrial times, primarily from fossil fuel emissions and secondarilyfossil fuel emissions and secondarilyfrom net land use change emissions.
Historically 280 ppm
1950 310 ppm
2000 365 ppm
2025 about 425 ppm
2050 450-550 ppm

Th b i f l l d il f l i i d hThe burning of coal, natural gas, and oil for electricity and heat is the largest single source of global greenhouse gas emissions.
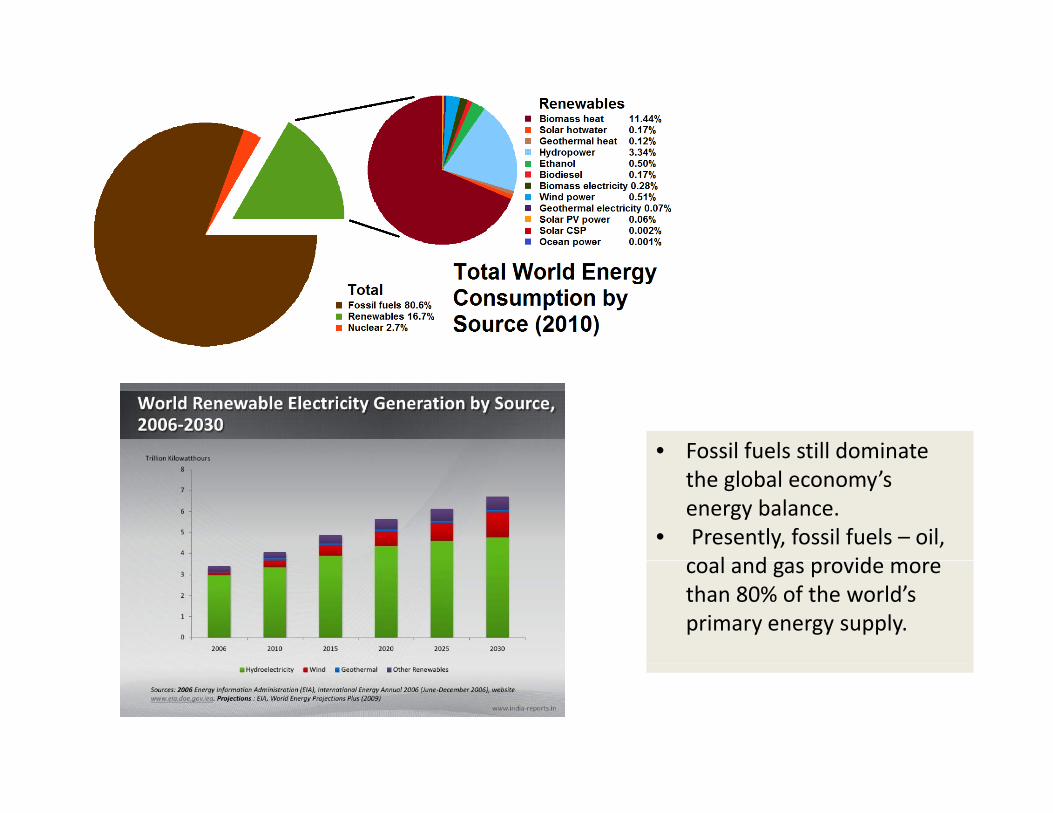
• Fossil fuels still dominateFossil fuels still dominate the global economy’s energy balance.
• Presently, fossil fuels – oil, l d idcoal and gas provide more
than 80% of the world’s primary energy supply.
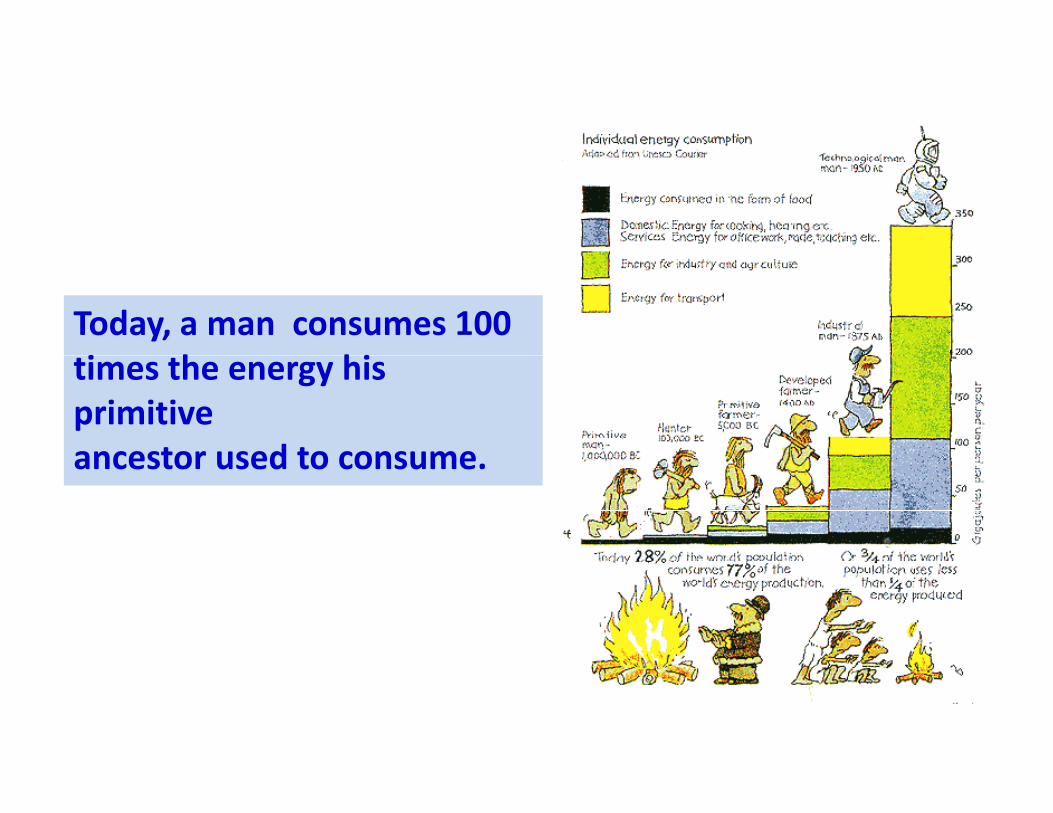
Today, a man consumes 100 i h hitimes the energy his primitive ancestor used to consumeancestor used to consume.

Life cycle carbon intensity of electricity source IEA vision on Solar Energy
Source Carbon intensity (g/kWh)
gy• Least cost energy mix by 2050• Reducing energy related carbon dioxide emission
levels by half from 2005 levels• High renewable scenario
Coal 920
Oil 730
Natural gas 470
• High renewable scenario : PV and CSP can provide 25 % of global electricity
by 2050: Levelised cost $ 0.1 per unit by 2030
Natural gas 470
Solar PV 46
Solar thermal 22
Biomass 18
Nuclear 16
Wind 12Wind 12
Hydroelectric 4
Hydrogen from 4renewables

Decarbonisation of FuelsDecarbonisation of FuelsDecarbonization is the progressive lightening of the amount of carbon used to produce a given amount of energy, as the energy system favors
l l th t f h d bmolecules that favor hydrogen over carbon
8
910
4
5678
of C
arbo
n at
oms
01
23
Wood Coal Oil Gas Hydrogen
No.
o
Hydrogen completes decarbonisationt end that has accompanied e ol tion
Wood Coal Oil Gas Hydrogen
Wood H:C=0.125 to 0.1:1trend that has accompanied evolution of energy sources for mankind over the centuries

India’s per capita CO2 emissions are 1.39 tonne as against world average of 4.44 tonne

Plan‐wise Renewable Capacity Addition
11

India’s National Action Plan on Climate Change (NAPCC)Climate Change (NAPCC)
• National Action Plan on Climate Change was released on 30thJune, 2008.
• Eight Missions were envisaged on– Solar Energy,– Enhanced Energy Efficiency,gy y,– Sustainable Habitat,– Water,– Sustaining the Himalayan Eco‐system,– Green India– Green India,– Sustainable Agriculture and– Strategic knowledge for Climate Change
• Conceptualizes living in harmony with Nature
• Emphasizes on ecologically sustainable development
• Aims at significantly increasing the share of solar energy in the
12
• Aims at significantly increasing the share of solar energy in the
total energy mix

13Per capita electricity Consumption Per capita energy consumption: Renewable electricity:
India: 730 Units India: 0.59 tOe India: 30 %
12.55%
World: 2890 Units World: 0. 1.86 tOe World: 16 %
Indian Power Sector
Thermal
Nuclear
Hydro
17.48%
67.86%Hydro
Renewable2.10%
Thermal Hydro Nuclear Renewable Total1,53,847 MW
39,623 MW 4,780 MW 28,454 MW 2,26,704 MW
Installed Power Capacity: India:226.704 GW, World: 995 GW

Renewable Power Capacity
14
Renewable Power Capacity 7%
13%
Wind
Small Hydro
Bio mass13%
Solar 67%
Wind Small Hydro Solar Biomass Total19,051 MW 3,632 MW 2073 MW 3,698 MW 28,454 MW
14

*15
Policy and Regulatory Support
Regulatory measures‐ RPO/RECSupporting grid connected projects to bring volumes and reduce pp g g p j gpricesFinancial support for off‐gridSupport R&DSupport R&DEncourage manufacturingHuman resource development

Mission Road Map
2525000
20 2020
2000020000
10 10
15
10000
15000
7
10
5
10
5
10
1000
4000
2001000
2000
0
5000
0
Phase 1 Phase 2 Phase 3
0
Phase 1 Phase 2 Phase 3
Grid solar power (MW)
Off-grid Applicationa (MW)
Solar thermal collectors (million sq.m.)
Solar lighting (million)
In addition, 100 MW capacity distributed small grid connected power plants during Phase ‐1
16

SOLAR CONCENTRATING TECHNOLOGY LANDSCAPE

JNNSM (Phase 1) ‐ Key Deliverables
• 1 100 MW Grid Solar Power Projects• 1,100 MW Grid Solar Power Projects
• 200 MW Off‐grid Solar Applications
• 7 million Sq. m solar thermal collector area
• R&D and HRD; Centers of Excellence
• Domestic Manufacturing
• Institutional arrangements for implementation of activities• Institutional arrangements for implementation of activities under the Mission
19

Targets & Achievements of Phase‐I
20
Targets & Achievements of Phase I
Application Segment Target for Phase I Achievement for(2010‐13) Phase‐I
Grid solar power (large plants, roof top &
1,100 MW
1,684 MW (including those ( g p , p
distribution grid plants)( g
under state initiative)
Off‐grid solar applications 200 MW 252 5 MWOff grid solar applications allotment
200 MW 252.5 MW
Solar Thermal Collectors (SWHs, l ki l li
7 million t
7.001 million sq. tsolar cooking, solar cooling,
Industrial process heat applications, etc.)
sq. meters meters

Solar Plants in India (MW)
2010 35 MW
2011 190 MW2011 190 MW
2012 980 MW
2013 1000 MW (Expected)
1 MW SPV (Crystalline Silicon) Power Plant at New Delhi (Solar RPO arrangement)1 MW SPV Plant at Hissarin Haryana

Solar Projects in India (August 2013)
C i i dCommissioned
Solar PV 1801
Solar Thermal 56
Total 1857
Under development
Solar PV 2339Solar PV 2339
Solar Thermal 445
Total 2784

Cumulative Solar power plants: 2079 MW (September, 2013)(September, 2013)
Crystalline Thin film
Phase I Batch I 54 % 46 %
Phase I Batch II 29.63% 66.67 %
GenerationGeneration
5MWp 5MWp Plant Plant at at KhimsarKhimsar –– Energy Energy pp gygy

State‐wise Solar Installations
Gujarat 857 Orissa 13
Rajasthan 568 Punjab 9
State wise Solar Installations
Rajasthan 568 Punjab 9
Maharashtra 185 Haryana 8
Madhya Pradesh
37 Goa 7Pradesh
Andhra Pradesh
28 Uttarakhand 5
K t k 24 Chh ti h 4Karnataka 24 Chhatisgarh 4
Tamil Nadu 19 New Delhi 2.5
Uttar Pradesh 17 West Bengal 2
Jhakhand 16 Total ~1800 MW

Global cumulative solar PV Power capacity 2012 : 102 GW2012 : 102 GW• Eight nations added at least a gigawatt of grid‐connected capacity
in 2012: Germany, China, Italy, the U.S., Japan, France, the U.K., and India.
• Thirteen nations (up from 8 in 2011) are in the gigawatt club of cumulative solar installations: Germany, Italy, the U.S., China, Japan, Spain, France, Belgium, Australia, the Czech Republic, the U.K., Greece, and India.
2013 (July): 116.5 GW• Germany, Italy, China, US and Japan crossed more than 10 GW
l PV i t ll ti (S t b 2013)solar PV installations (September 2013).
The installations are concentrated only in a few countries.The installations are concentrated only in a few countries.The vast sunshine zones are still not active.

Germany : 34. 5 GW (July, 2013)
FITs in Germany sink further.€0.1006 per kWh for PV systems with more than 1 MW.
10 GW Solar PV Club
GW (July, 2013) €0.1006 per kWh for PV systems with more than 1 MW.For small rooftop systems: €0.1230 to €0.1454 per kWh.set a goal of subsidizing its solar program up to 52 GW.
Italy: 17 GW Conto Energia V, has come to an in July 2013.y g , yMost parts of Italy have reached grid parity
China: 7 GW (2012) + 1.8 GW
Target: 35 GW by 2015(one year ago the target was raised from 15 GW to 21 GW).
(first half) New tariffs for distributed solar projects at a rate of 0.42 Yuan ($0.07)/kWh. New manufacturing policy.
United States: Crossed 10 GW in September, 2013
U.S. residential solar demand continues to surge, and third‐party‐owned solar residential in particular.50 state‐based markets with a layer of federal policy. Market to p , y p yhit 17 GW by the end of 2014.
Japan: 10.5 GW Target: 28 GW by 2020.(September, ‘13) 89% rooftop.
FIT Program for accelerated deployment of large scale projects (July ‘13): ~0.38 $/kWh
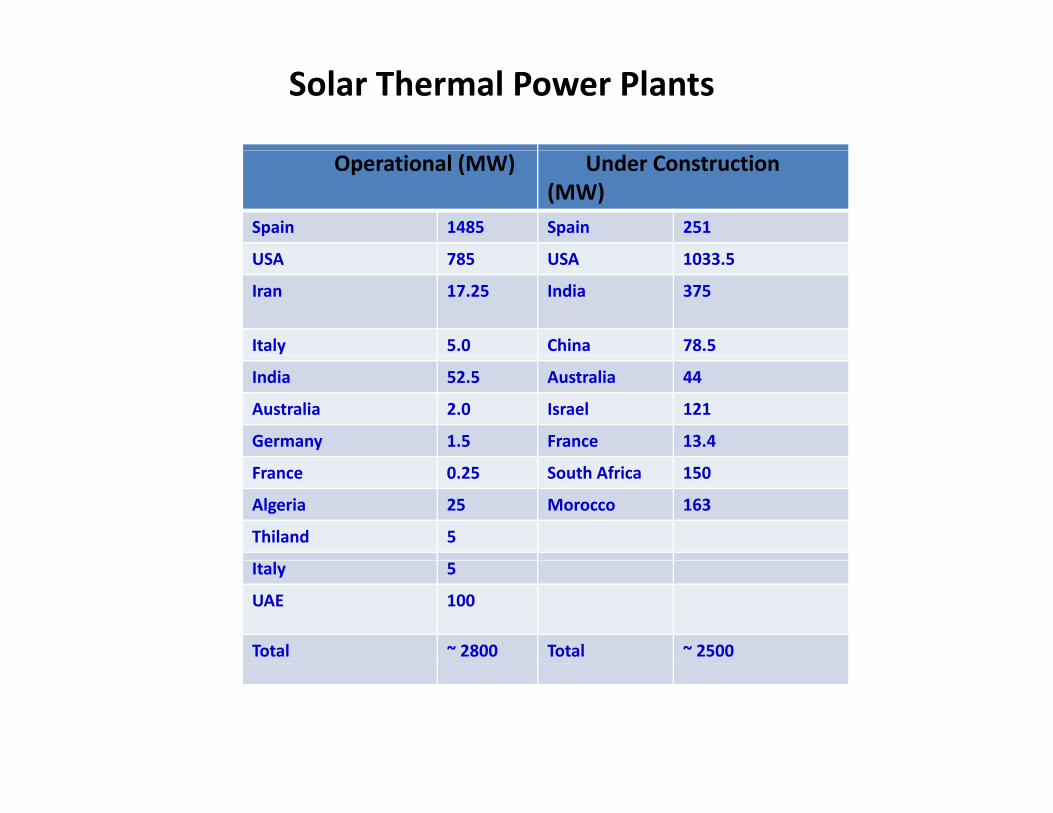
Solar Thermal Power Plants
Operational (MW) Under Construction (MW)
Spain 1485 Spain 251
S 8 S 1033USA 785 USA 1033.5
Iran 17.25 India 375
Italy 5.0 China 78.5
India 52.5 Australia 44
Australia 2.0 Israel 121
Germany 1.5 France 13.4
France 0.25 South Africa 150
Algeria 25 Morocco 163
Thiland 5
Italy 5
UAE 100
Total ~ 2800 Total ~ 2500
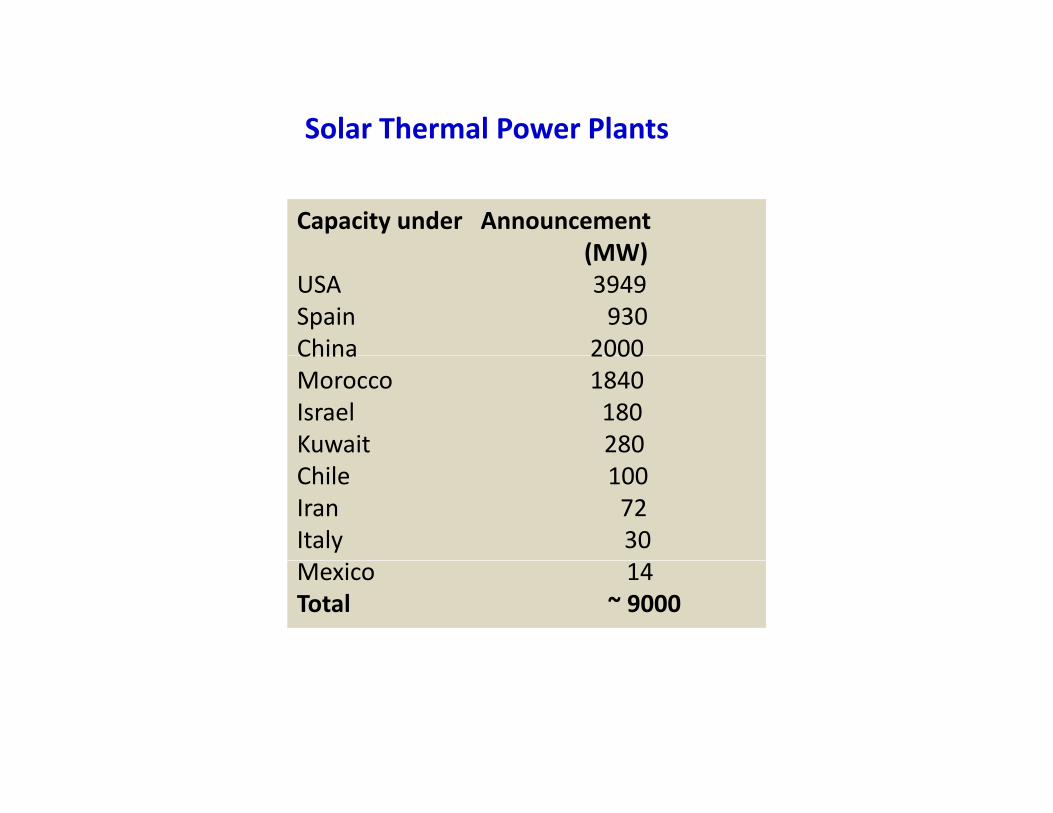
Solar Thermal Power Plants
Capacity under Announcement (MW)(MW)
USA 3949Spain 930China 2000China 2000Morocco 1840Israel 180Kuwait 280Chile 100Iran 72Italy 30Mexico 14Total ~ 9000
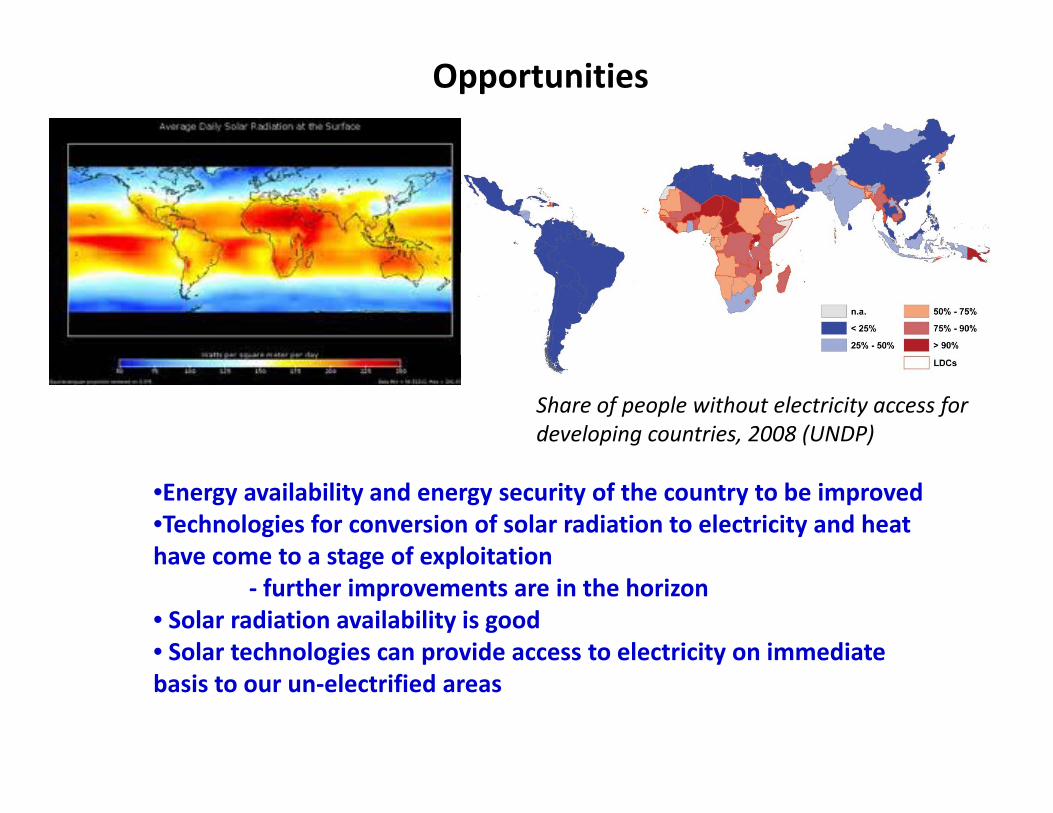
Opportunities
Share of people without electricity access for developing countries, 2008 (UNDP)
•Energy availability and energy security of the country to be improved•Technologies for conversion of solar radiation to electricity and heat have come to a stage of exploitationhave come to a stage of exploitation
‐ further improvements are in the horizon• Solar radiation availability is good• Solar technologies can provide access to electricity on immediate g p ybasis to our un‐electrified areas
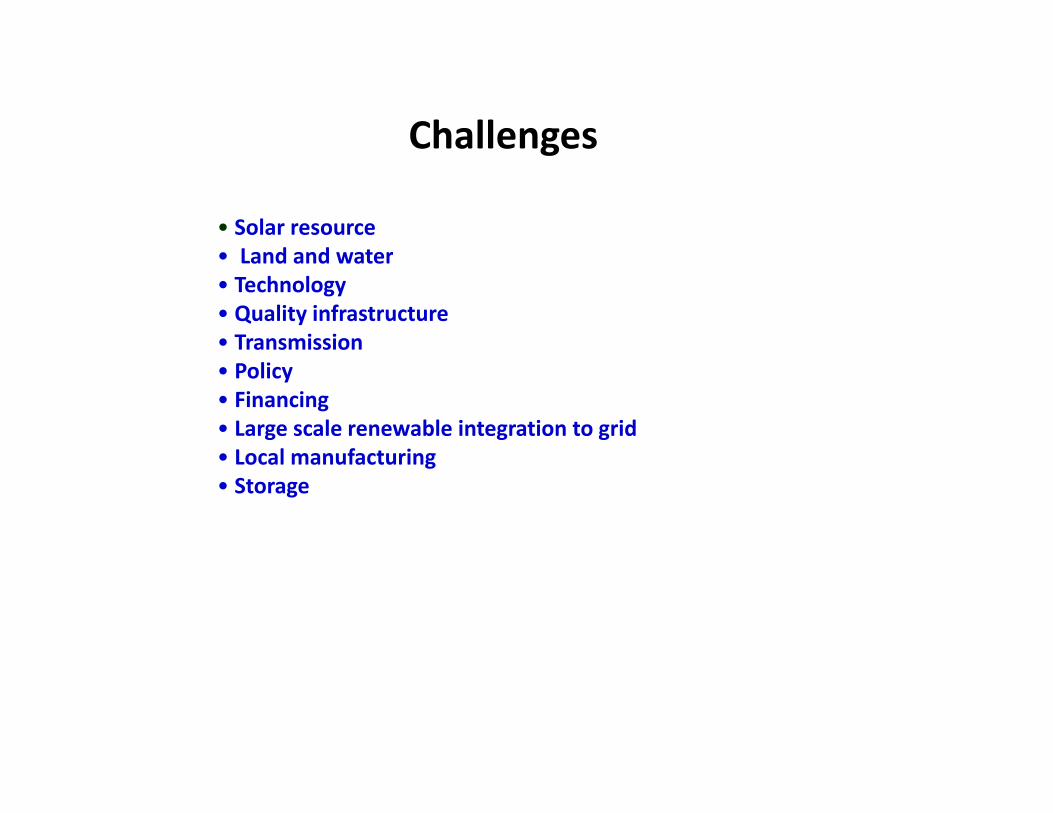
Challenges
• Solar resource• Land and water
g
• Land and water• Technology • Quality infrastructure• Transmission• Policy• Financing• Large scale renewable integration to grid• Local manufacturing• Local manufacturing• Storage

Solar radiation is the primary input for solar energy systems. It is necessary to know as precisely as possible the quantity and quality of solar radiation at the site of utilization.
Solar Resource Maps for India
31
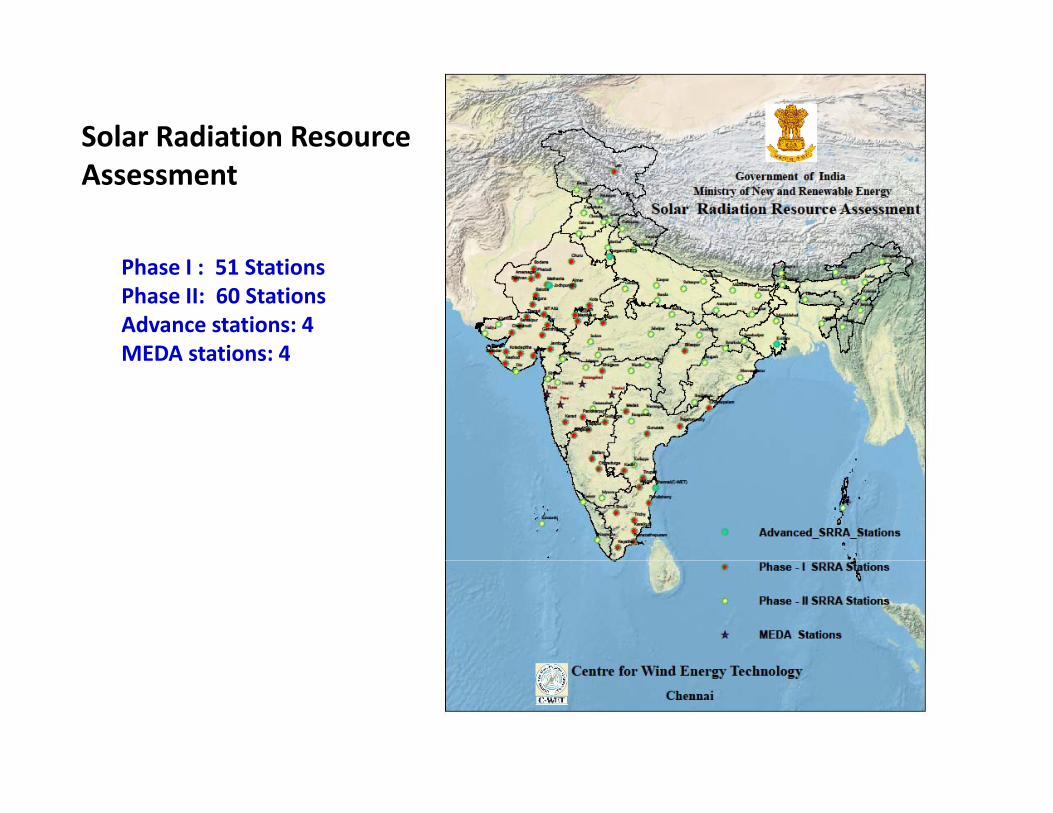
Solar Radiation Resource Assessment
Phase I : 51 StationsPhase II: 60 StationsAdvance stations: 4MEDA stations: 4MEDA stations: 4
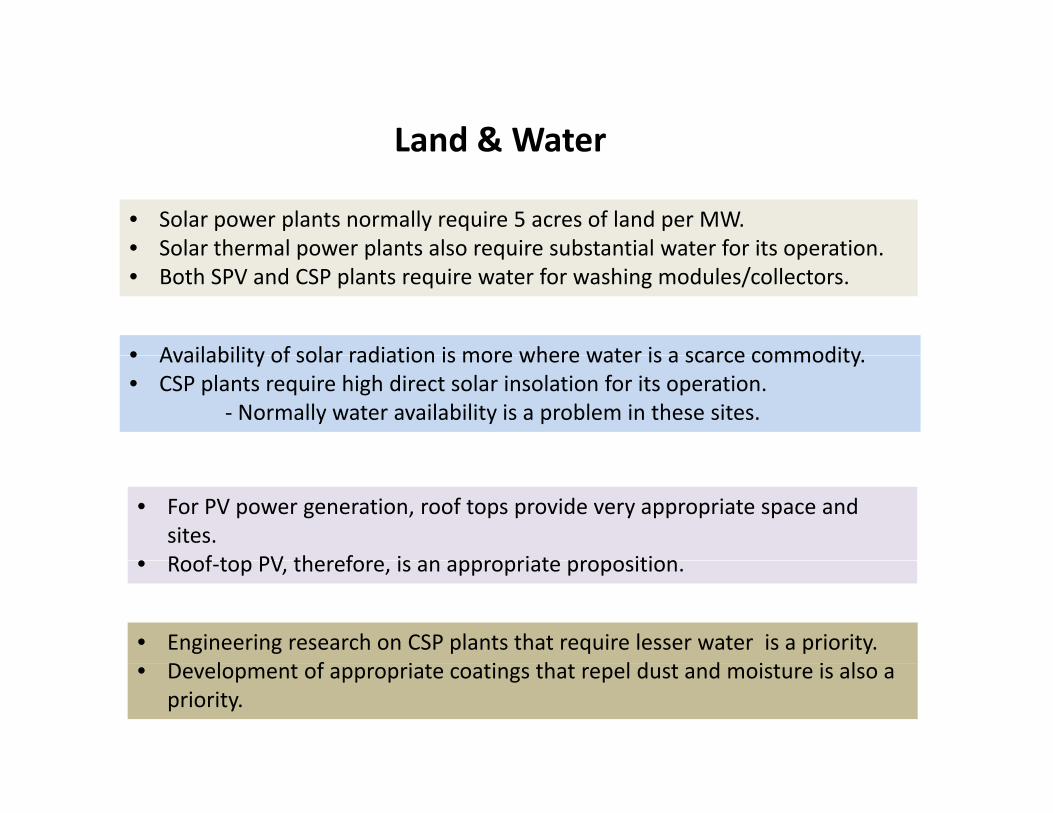
Land & WaterLand & Water
• Solar power plants normally require 5 acres of land per MW.• Solar thermal power plants also require substantial water for its operation.Solar thermal power plants also require substantial water for its operation.• Both SPV and CSP plants require water for washing modules/collectors.
• Availability of solar radiation is more where water is a scarce commodity• Availability of solar radiation is more where water is a scarce commodity.• CSP plants require high direct solar insolation for its operation.
‐ Normally water availability is a problem in these sites.
• For PV power generation, roof tops provide very appropriate space and sites.
• Roof top PV therefore is an appropriate proposition• Roof‐top PV, therefore, is an appropriate proposition.
• Engineering research on CSP plants that require lesser water is a priority.l f i i h l d d i i l• Development of appropriate coatings that repel dust and moisture is also a
priority.
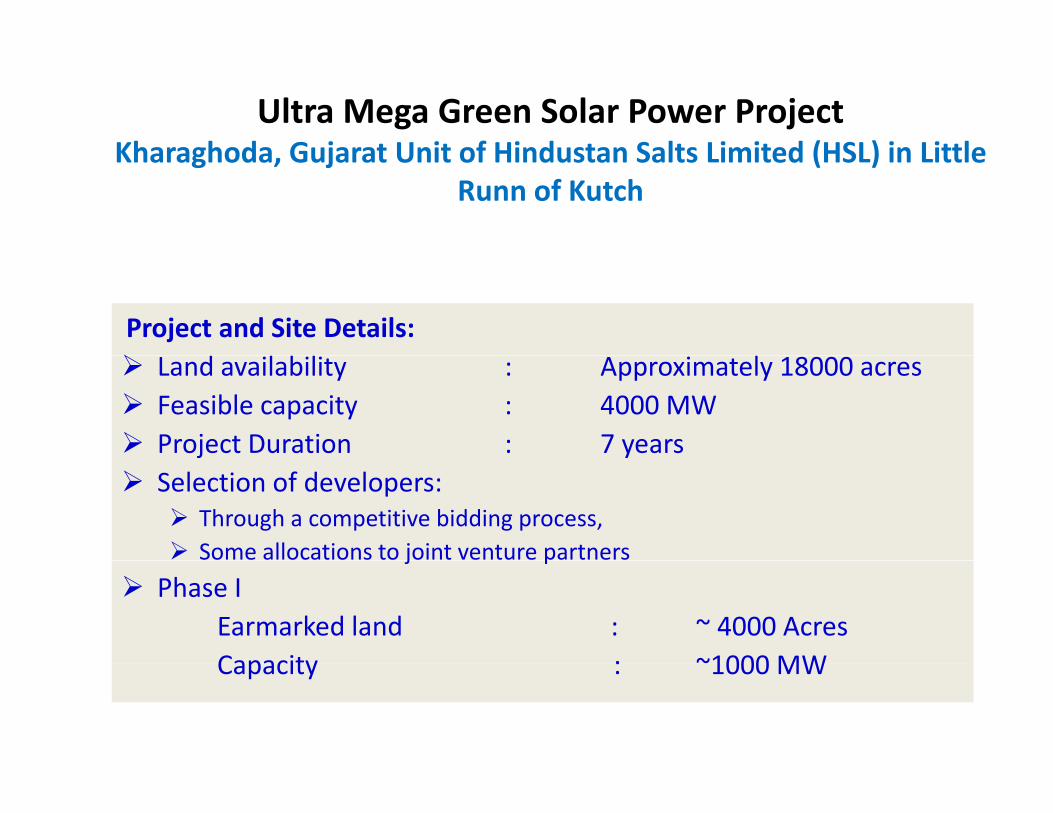
Ultra Mega Green Solar Power ProjectKharaghoda Gujarat Unit of Hindustan Salts Limited (HSL) in Little
34
Kharaghoda, Gujarat Unit of Hindustan Salts Limited (HSL) in Little Runn of Kutch
Project and Site Details:Land availability : Approximately 18000 acresFeasible capacity : 4000 MWProject Duration : 7 yearsj ySelection of developers:
Through a competitive bidding process,Some allocations to joint venture partnersj p
Phase IEarmarked land : ~ 4000 AcresCapacity : ~1000 MWCapacity : ~1000 MW
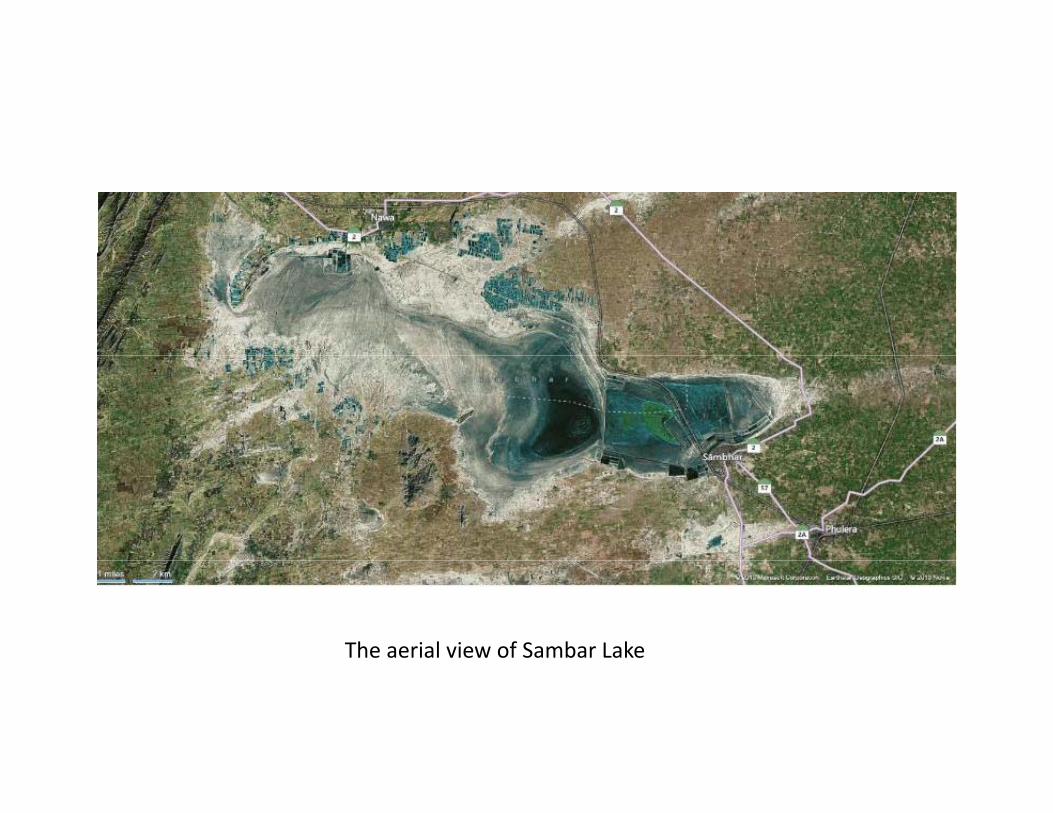
The aerial view of Sambar Lake
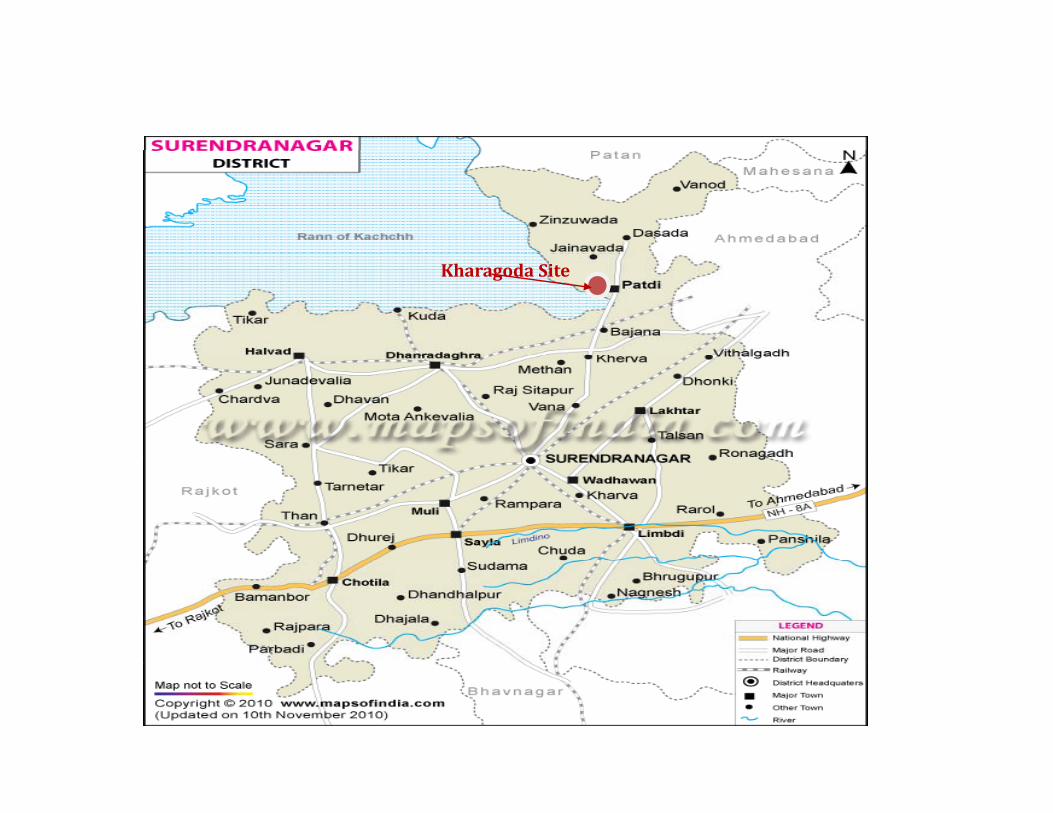
Kharagoda Site

37
Salt Production Process at Kharaghoda

Solar Power Project 1000 MWp in Kargil to includ 180 Kmstransmission line from Kargil to Alusten (Srinagar) ‐ ProposalBrief Project Details
38
Brief Project Details..
Expected Project Cost 9000 to 12000 Cr
Area Requirement 4000 to 5000 hectares
Expected Energy Yield(Approx) 83 Mn Units/MWp/Yr
Construction TimeIncluding 180 Kms transmission line From Kargil to Alusten (Srinagar) 36 to 48 Months g ( g )

Tentative Proposed sites for generation of Solar power up to 1000Mw in Kargil District
Name of Site Availability of Land Proposed Generation
39
Name of Site Availability of Land Proposed Generation
Sodh Area ( Kulubur to Hambutingla) 2000 hectare 500 Mw
Lahlung plateau 700 hectare 175 Mw
Akchamal via tharumsa upto Pushkum 500 hectare 125 MwAkchamal via tharumsa upto Pushkum 500 hectare 125 Mw
Brakarthang Mulbekh 300 hectare 125 Mw
Wado to Namkila Belt 2000 hectare 500 Mw
Mangbore to Haniskote 3000 hectare 750 MwMangbore to Haniskote 3000 hectare 750 Mw
Minji to Saliskote 1000 hectare 250 Mw
TOTAL 9700 Hectare 2425 Mw
Status of Grid as on date:• Kargil to Drass (proposed Grid receiving station connectivity through 66kVA for Chutukhydel project in the 2nd phase i,e 2014.
• Local grid of 11KVA is presently available from Kargil to Drass.• Present load on sub‐station Drass is 0.5 Mw of Morpochu Hydel Project within Drass block.• National Grid is only upto Alusting Srinagar.• Kangan to Sonamarg local grid of 11 KVA.

A tale of two solar collectors
Solar Green CollectorNatural evolution
Solar Photovoltaic CollectorEngineered product

Platinised TCO coated glass
I‐ / I2 redox electrolyteTCO
coated l
Nanocrystalline TiO2 film
Sensitizer dye
g
Light
glass
I3‐
I‐
External circuit
D e sensitised Photoelectrochemical Solar cellsDye sensitised Photoelectrochemical Solar cells

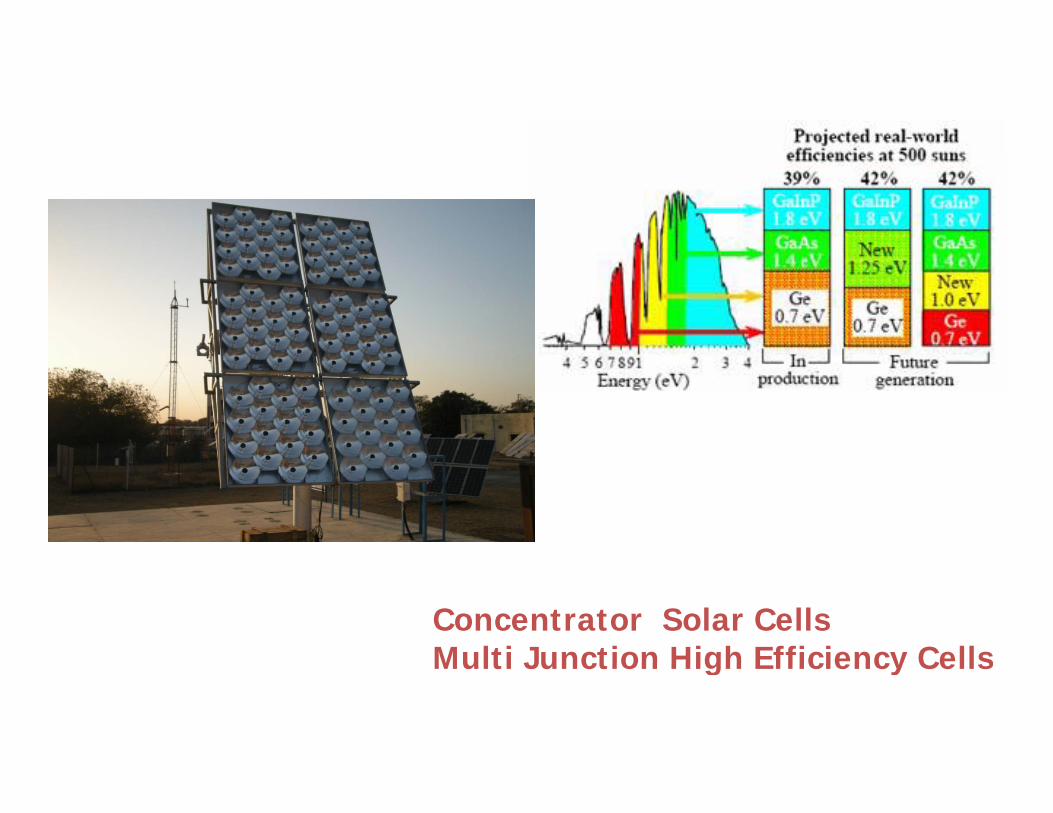
Concentrator Solar CellsMulti Junction High Efficiency CellsMulti Junction High Efficiency Cells

Factors influencing Solar Concentrated Technology
Direct normal AmbientIrradiance(DNI)
Ambient Temperature
EFFICIENCYEFFICIENCY
Latitude Effect Wind Velocity
Required Temperature

Solar thermal collectors

Applicationspp
• Heating• Dryingy g• Cooling• Power generation

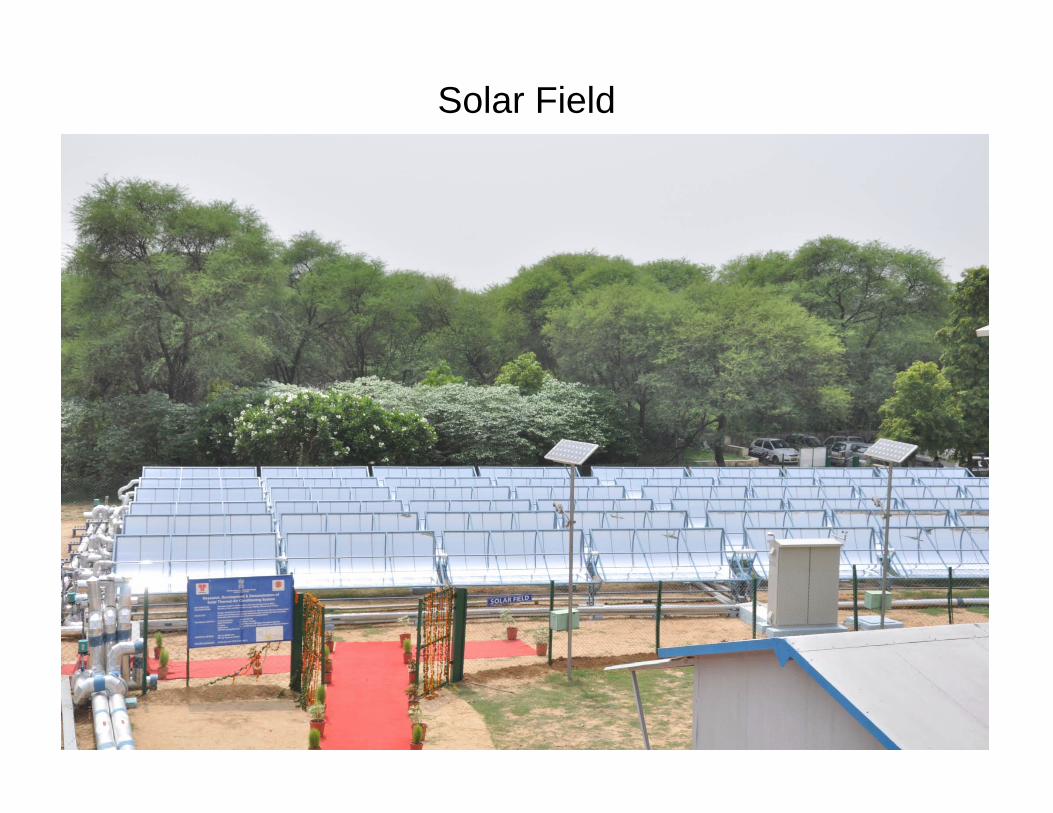
Solar Field

Triple Effect Vapour Absorption Machine

Hybridization
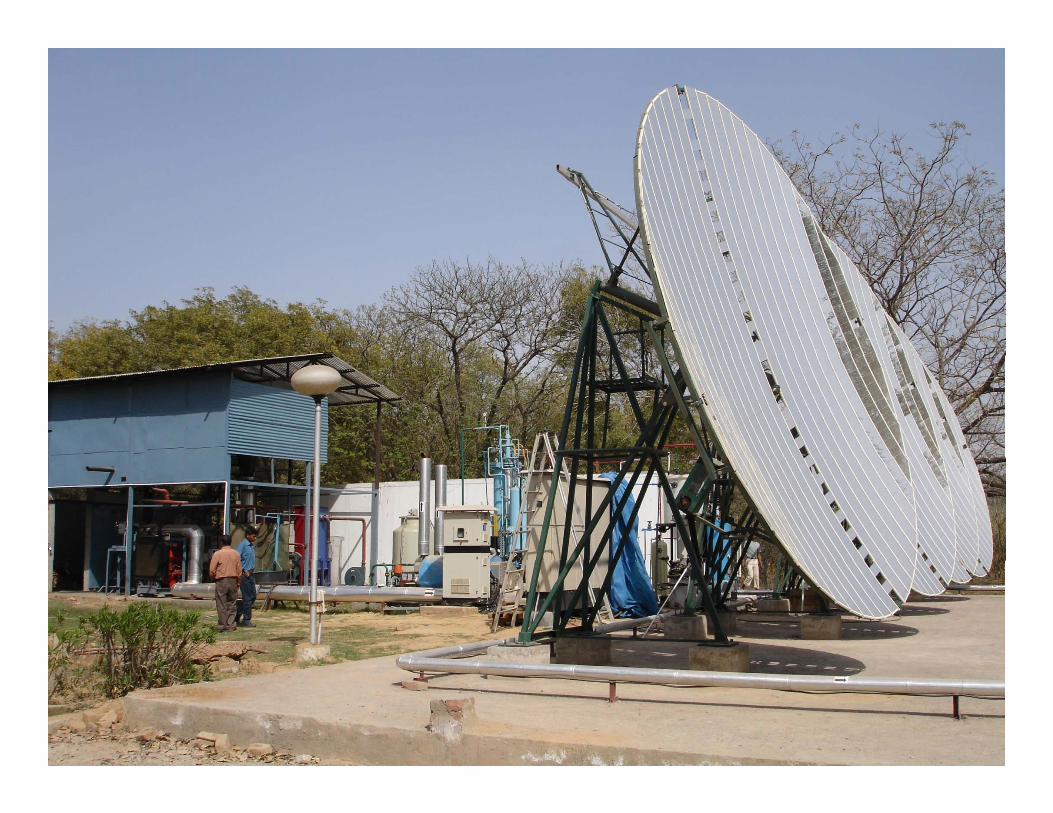

• Cost effectiveCost effective• Reliable• Lower carbon footprint
• Technology mapping• Hybridization• StorageStorage• Cogeneration
A considered decision is must for system efficacy, reliability and cost effective performance.

Stiriling EngineStiriling Engine
• External combustion engine‐ can work with any fuelcan work with any fuel
• High power conversion efficiency• Can be used for distributive power generation

Solar Hydrogen SystemProposed at SEC
5 Nm3/h capacity
100 kW
electrolyser
Simple water electrolysis00 W
Hydrogen storage
Hydrogen Dispenser
54
Hydrogen Dispenser
Applications of HydrogenVehicles Fuel Cells
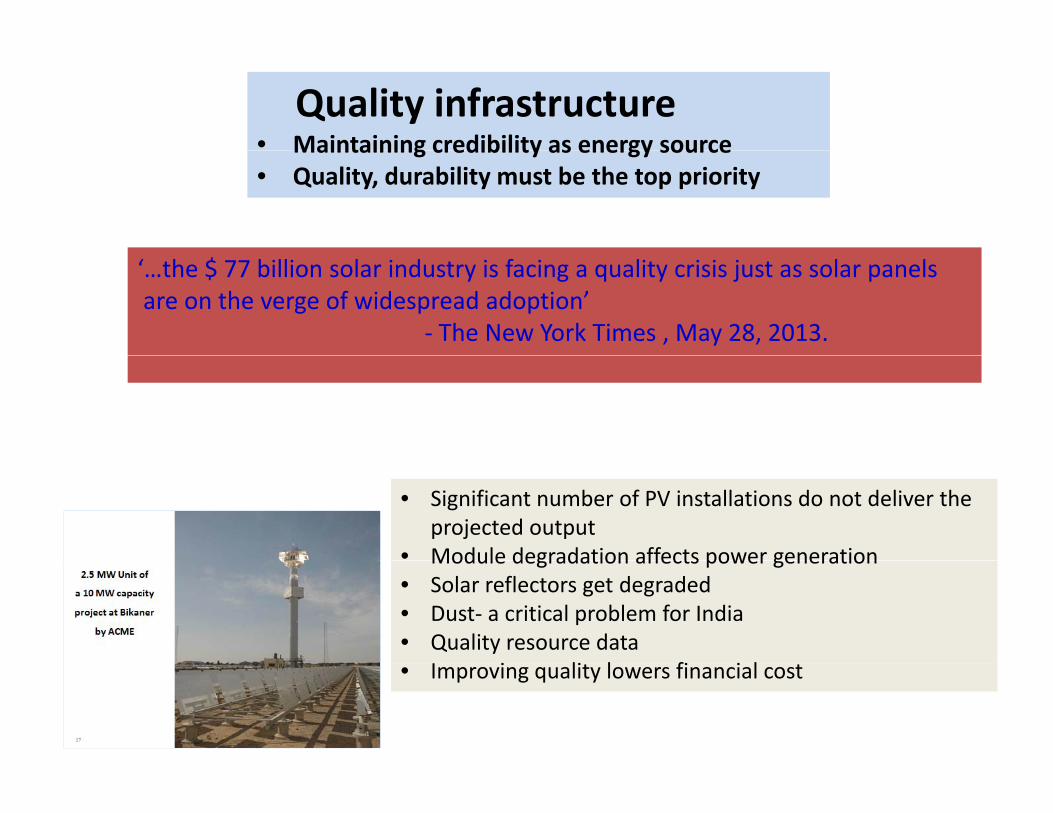
Quality infrastructure• Maintaining credibility as energy sourceMaintaining credibility as energy source• Quality, durability must be the top priority
‘…the $ 77 billion solar industry is facing a quality crisis just as solar panelsare on the verge of widespread adoption’
‐ The New York Times , May 28, 2013.
• Significant number of PV installations do not deliver the projected output
• Module degradation affects power generationModule degradation affects power generation• Solar reflectors get degraded• Dust‐ a critical problem for India• Quality resource data
i li l fi i l• Improving quality lowers financial cost

DEFECTS GENERATED IN CRYSTALLINE SILICON MODULES
C i f M lEVA Browning Effect
Corrosion of Metal Contacts
Corrosion of Solar Cell Grid
Delaminating of Solar Cell Module

GENERATION & GROWTH OF DELAMINATION DEFECTS IN PV MODULES
GENERATION GROWTH STAGE‐1 GROWTH STAGE‐2
GROWTH STAGE‐3GROWTH STAGE‐4FINAL STAGE

BROWNING IN CRYSTALLINE SILICON PV MODULES
INITIATION OF BROWNING DARKNING STAGE‐1 ADVANCED BROWNING‐ 2

Defects Growth in Thin film Modules (WITH and WITHOUT FRAME)
INITIAL STAGE ADVANCED STAGE
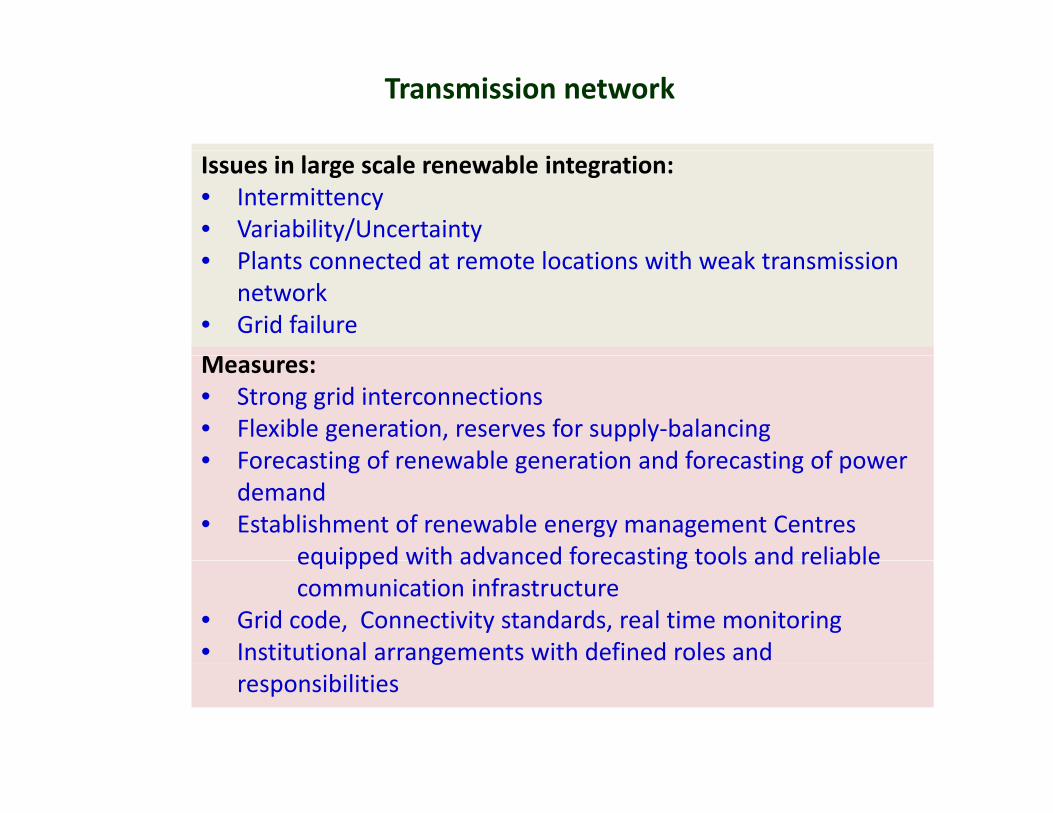
Transmission network
Issues in large scale renewable integration:• Intermittency• Variability/Uncertainty
Pl d l i i h k i i• Plants connected at remote locations with weak transmission network
• Grid failure
Measures:• Strong grid interconnections• Flexible generation, reserves for supply‐balancing• Forecasting of renewable generation and forecasting of power• Forecasting of renewable generation and forecasting of power
demand• Establishment of renewable energy management Centres
equipped with advanced forecasting tools and reliableequipped with advanced forecasting tools and reliable communication infrastructure
• Grid code, Connectivity standards, real time monitoring• Institutional arrangements with defined roles and g
responsibilities

Electricity Act (EA), 2003
RE Policy Framework
Electricity Act (EA), 2003 1.Section 86 ‐ promotes RE by ensuring grid connectivity & sale of RE. 2.Section 3 ‐ Central Government to develop a national policy for optimal utilization of resources including RE . g3.SERC’s to: •Section 86 ‐ fix a minimum percentage energy purchase from RE sources (RPO). •Section 61 – determine tariffs for the promotion of RE
National Electricity Policy (NEP), 2005 1.Section 5.2.20 of NEP promotes private participation in RE. 2.Section 5.12.1 of NEP targets capital cost reduction in RE through competition. 3.Section 5.12.2 of NEP states that SERCs should specify appropriate tariffs topromote RE and specify targets for RE.
National Tariff Policy (NTP), 2006 1.A minimum percentage procurement should be made latest by April 1, 2006 2 A preferential tariff to be determined by SERC to enable RET’s to compete2.A preferential tariff to be determined by SERC to enable RET s to compete 3.Procurement of RE by distribution licensee through competitive bidding

I t t d E P li (IEP) 2008Integrated Energy Policy (IEP), 2008
1.Design of incentive structures that are linked to energy generated 2 Regulators to mandate feed in laws for RE where appropriate2.Regulators to mandate feed‐in laws for RE, where appropriate. 3.Environmental subsidy for RE through cess on conventional energy generation 4.FI’s should be encouraged to set‐up Capital Funds for RE entrepreneurs. 5.Need to auction sites on public property for wind energy development5.Need to auction sites on public property for wind energy development 6.To encourage solar thermal a higher premium of feed‐in tariff needs to be provided
National Action Plan on Climate ChangeParagraph 4.2.2 : Starting 2009‐10, Renewable Purchase Obligations be set at 5% of total grids purchase, to increase by 1% each year for 10 years.
2011 Amendment in Tariff Policy :‐ 0.25% Solar RPO by 2013 and 3% by 2022

Regulatory Measures
• Renewable Purchase Obligation (RPO)• Feed in Tariffs (FiTs) • Renewable energy certificate (REC) mechanism• Renewable energy certificate (REC) mechanism•Transmission Infrastructure

Policy intervention
• Incentives‐ financial and fiscal• Removing non‐economic barriers• Public‐private partnershipPublic private partnership• Innovative business and financial models
Mandatory Solar RPO Mechanism• State Electricity Regulators to fix a percentage of energy purchased from
Solar Power under RPO.• The Solar RPO has to begin with 0.25 % of the energy procured
reaching 3% by 2022.• This requirement likely to go up to 30,000 MW by 2022.
Solar Power required to meet Solar RPOs (MW)
2011‐12 2012‐13 2013‐14 2014‐15 2015‐16 2016‐17
1465 3018 4659 6387 8204 10109
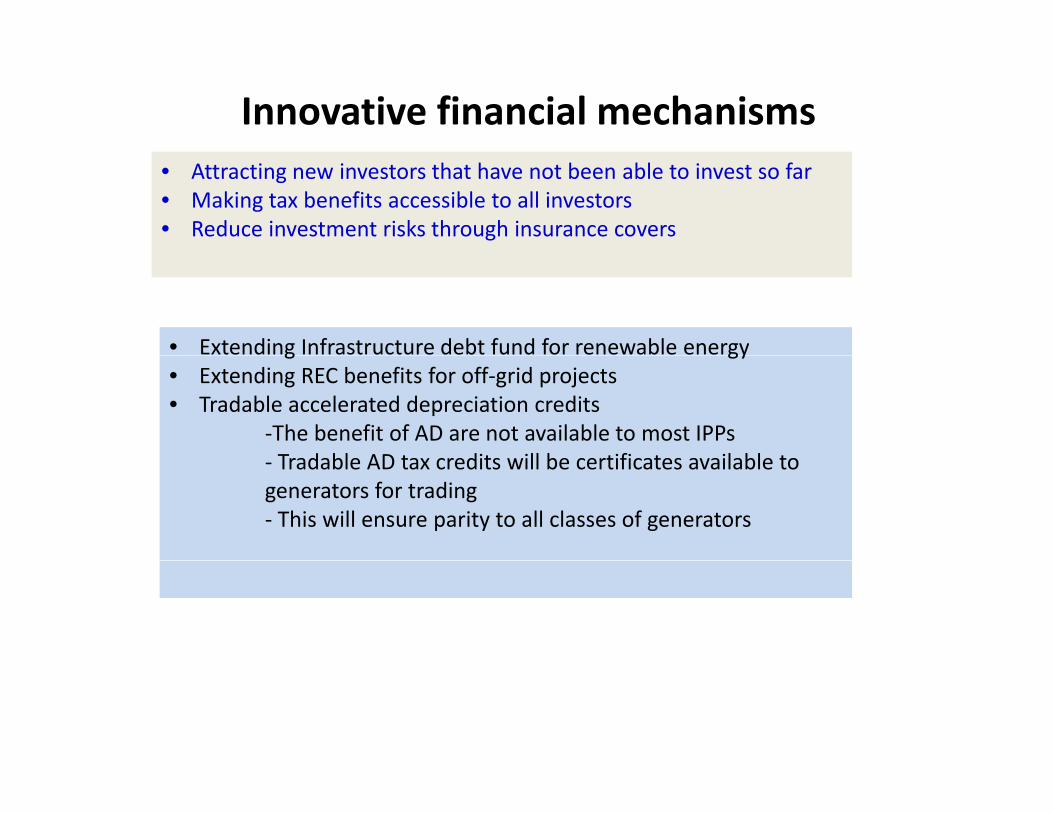
Innovative financial mechanisms• Attracting new investors that have not been able to invest so far• Making tax benefits accessible to all investors• Reduce investment risks through insurance covers
• Extending Infrastructure debt fund for renewable energyg gy• Extending REC benefits for off‐grid projects• Tradable accelerated depreciation credits
‐The benefit of AD are not available to most IPPsTradable AD ta credits ill be certificates a ailable to‐ Tradable AD tax credits will be certificates available to
generators for trading‐ This will ensure parity to all classes of generators
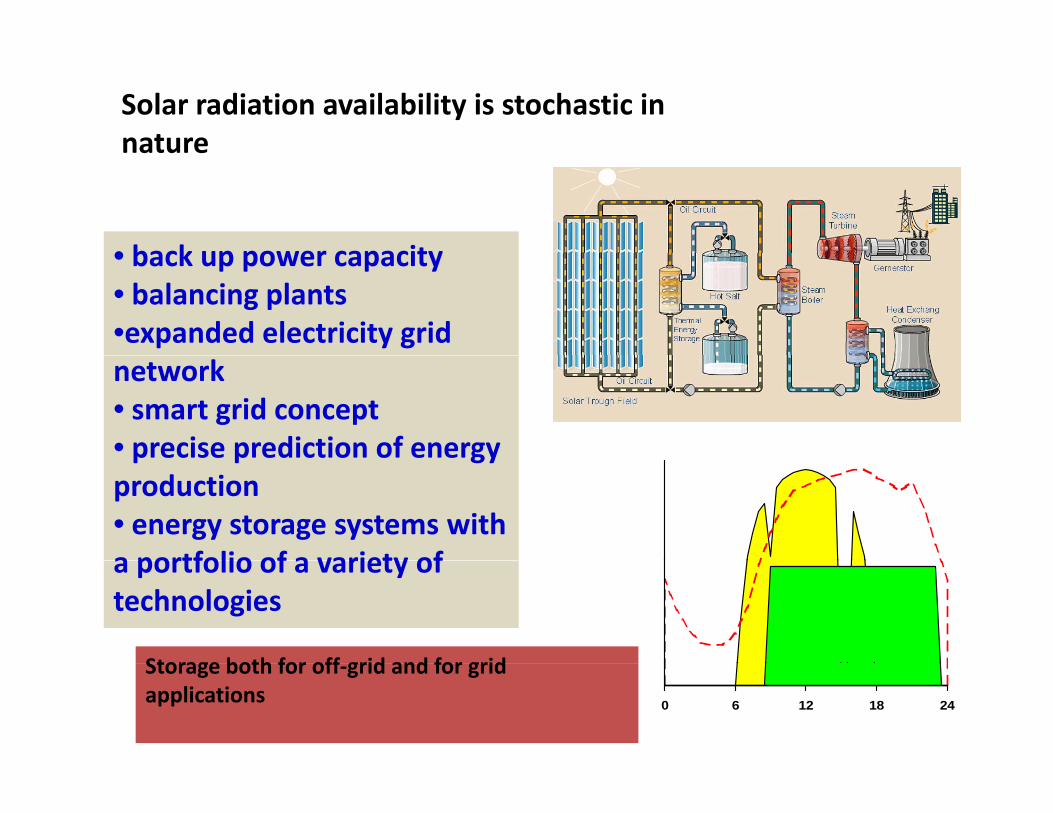
Solar radiation availability is stochastic in nature
• back up power capacity
nature
• back up power capacity• balancing plants•expanded electricity grid network• smart grid concept• precise prediction of energy p p gyproduction • energy storage systems with a portfolio of a variety ofa portfolio of a variety of technologies
Storage both for off grid and for grid
0 6 12 18 24
Storage both for off‐grid and for grid applications

JNNSM Phase II67
Grid‐connected
Cumulative target: ff idCumulative target:
10,000 MW (by March 2017)
‐4,000 MW under Central schemes
6 000 MW d S i i i i
Off‐gridTarget: 800 MW
Thrust areas: ‐6,000 MW under States initiatives
Thrust areas:
ENERGY ACCESSDIESEL REPLACEMENTTELECOM TOWERSCOLD STORAGE
Development of T&D network
Developing cluster of Solar Parks to reduce costs
COLD STORAGEWATER PURIFICATIONWATER PUMPINGNEW INNOVATIVE PRODUCTS
Grid‐connected Roof‐top
Achieving grid parity at the earliest

VIABILITY GAP FUNDING (VGF) SCHEME
68
Total capacity considered under Batch‐I : 750 MW in 2 categories:
With Domestic Content RequirementOpen; no restrictionOpen; no restriction.
Implementing Agency: Solar Energy Corporation of India (SECI)

VGF Mechanism
69
Tariff to be paid to the developer : ‐ Rs.5.45/kWh, fixed for 25 years‐ 10% less viz., Rs. 4.95/kWh for projects availing benefit of Accelerated Depreciation
VGF to be paid: up to 30% of project cost limited to Rs. 2.5 cr./MW, b d b dbased on bidDeveloper’s equity: minimum Rs.1.5 cr./MWBalance can be raised as Loan.
Min. Capacity of each project –:10 MW
Max capacity 50 MWMax. capacity :50 MW
Max. 3 projects at different locations by one developer, subject to a max. of 100 MW.

IndiaRenewable Energy Projections for 2027 Cumulative Installed Capacities in GWCumulative Installed Capacities in GW
71

Thank you for your attention


![Satyanweshi by Sharadindu Bandyopadhyay [Byomkesh Bakshi]](https://img.dokumen.tips/doc/110x75/55cf918e550346f57b8e75f9/satyanweshi-by-sharadindu-bandyopadhyay-byomkesh-bakshi.jpg)