Embed Size (px)
Citation preview

Presentation Materials for Investors
November 2017
2
Disclaimer • This presentation includes certain “forward-looking statements” within the meaning of The U.S.
Private Securities Litigation Reform Act of 1995.
• These statements are based on current expectations and currently available information.
• Actual results may differ materially from these expectations due to certain risks, uncertainties and other important factors, including the risk factors set forth in the most recent annual and periodic reports of Toyota Motor Corporation and Toyota Motor Credit Corporation.
• We do not undertake to update the forward-looking statements to reflect actual results or changes in the factors affecting the forward-looking statements.
• This presentation does not constitute an offer to sell or a solicitation of an offer to purchase any securities. Any offer or sale of securities will be made only by means of a prospectus and related documentation.
• Investors and others should note that we announce material financial information using the investor relations section of our corporate website (http://www.toyotafinancial.com) and SEC filings. We use these channels, press releases, as well as social media to communicate with our investors, customers and the general public about our company, our services and other issues. While not all of the information that we post on social media is of a material nature, some information could be material. Therefore, we encourage investors, the media, and others interested in our company to review the information we post on the Toyota Motor Credit Corporation Twitter Feed (http://www.twitter.com/toyotafinancial). We may update our social media channels from time to time on the investor relations section of our corporate website.
2
3
Disclaimer • This presentation includes certain “forward-looking statements” within the meaning of The U.S. Private Securities Litigation Reform Act of 1995.
• These statements are based on current expectations and currently available information.
• Actual results may differ materially from these expectations due to certain risks, uncertainties and other important factors, including the risk factors set forth in the most recent annual and periodic reports of Toyota Motor Corporation and Toyota Motor Credit Corporation (“TMCC”).
• We do not undertake to update the forward-looking statements to reflect actual results or changes in the factors affecting the forward-looking statements.
• This presentation does not constitute or form part of and should not be construed as, an offer to sell or issue or the solicitation of an offer to purchase or subscribe for securities of TMCC in any jurisdiction or an inducement to enter into investment activity in any jurisdiction. Neither this presentation nor any part thereof, nor the fact of its distribution, shall form the basis of, or be relied on in connection with, any contract or commitment or investment decision whatsoever. Any offer or sale of securities by TMCC will be made only by means of a prospectus and related documentation.
• Investors and prospective investors in securities of TMCC are required to make their own independent investigation and appraisal of the business and financial condition of TMCC and the nature of its securities. This presentation does not constitute a recommendation regarding securities of TMCC. Any prospective purchaser of securities in TMCC is recommended to seek its own independent financial advice.
• This presentation is made to and directed only at (i) persons outside the United Kingdom, or (ii) qualified investors or investment professionals falling within Article 19(5) and Article 49(2)(a) to (d) of the Financial Services and Markets Act 2000 (Financial Promotion) Order 2005 (the “Order”), or (iii) high net worth individuals, and other persons to whom it may lawfully be communicated, falling within Article 49(2)(a) to (d) of the Order, and (iv) persons who are “qualified investors” within the meaning of Article 2(1)(e) of the Prospectus Directive (Directive 2003/71/EC) as amended (such persons collectively being referred to as “Relevant Persons”). This presentation must not be acted or relied on by persons who are not Relevant Persons. Any investment or investment activity to which this presentation relates is available only to Relevant Persons and will be engaged in only with Relevant Persons.
• This presentation is an advertisement and not a prospectus and investors should not subscribe for or purchase any securities of TMCC referred to in this presentation or otherwise except on the basis of information in the base prospectus of Toyota Motor Finance (Netherlands) B.V., Toyota Credit Canada Inc., Toyota Finance Australia Limited and Toyota Motor Credit Corporation dated 8 September 2017 as supplemented from time to time together with the applicable final terms which are or will be, as applicable, available on the website of the London Stock Exchange plc at www.londonstockexchange.com/exchange/news/market-news/market-news-home.html.
• Investors and others should note that we announce material financial information using the investor relations section of our corporate website (http://www.toyotafinancial.com) and SEC filings. We use these channels, press releases, as well as social media to communicate with our investors, customers and the general public about our company, our services and other issues. While not all of the information that we post on social media is of a material nature, some information could be material. Therefore, we encourage investors, the media, and others interested in our company to review the information we post on the Toyota Motor Credit Corporation Twitter Feed (http://www.twitter.com/toyotafinancial). We may update our social media channels from time to time on the investor relations section of our corporate website.
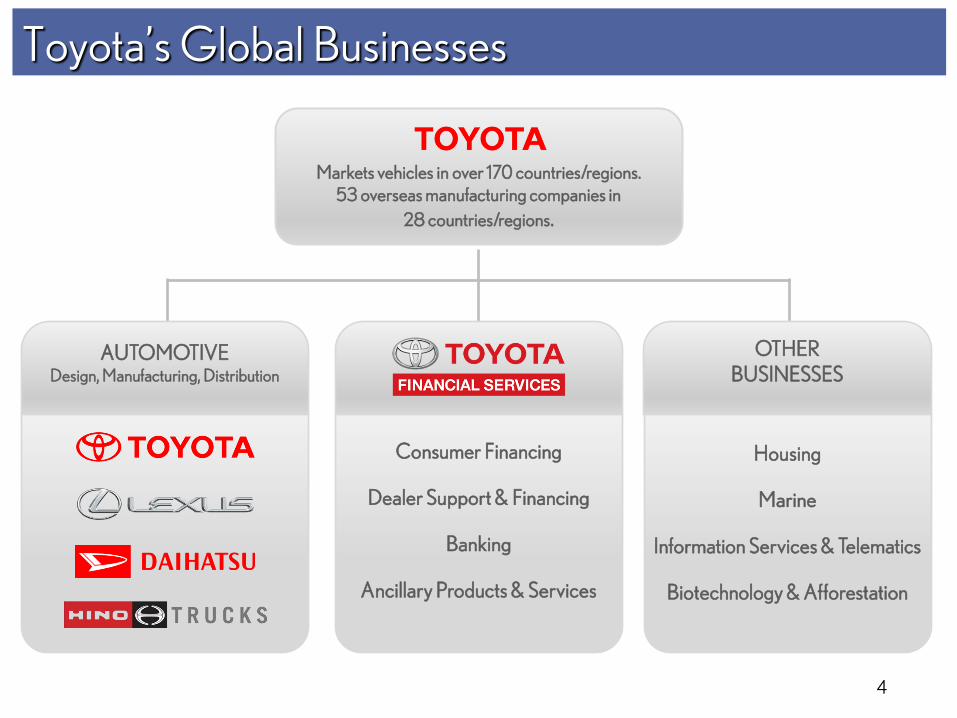
Toyota’s Global Businesses
Markets vehicles in over 170 countries/regions. 53 overseas manufacturing companies in
28 countries/regions.
OTHER BUSINESSES
AUTOMOTIVE Design, Manufacturing, Distribution
Consumer Financing
Dealer Support & Financing
Banking
Ancillary Products & Services
Housing
Marine
Information Services & Telematics
Biotechnology & Afforestation
4
5
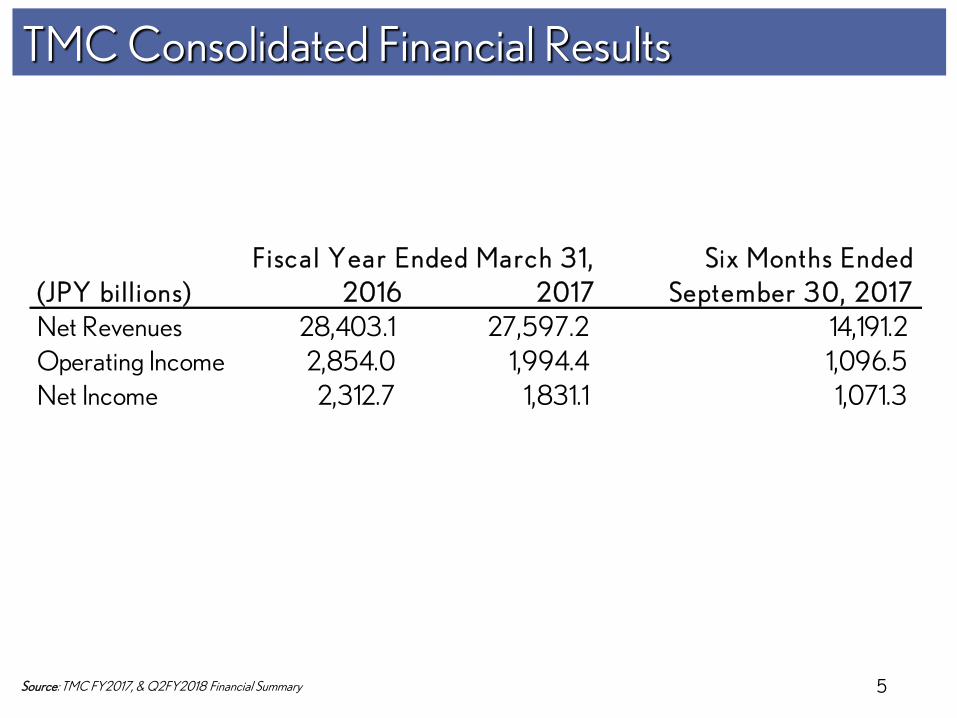
TMC Consolidated Financial Results
Source: TMC FY2017, & Q2FY2018 Financial Summary
Six Months Ended
(JPY bil l ions) 2016 2017 September 3 0, 2017
Net Revenues 28,403.1 27,597.2 14,191.2
Operating Income 2,854.0 1,994.4 1,096.5
Net Income 2,312.7 1,831.1 1,071.3
Fiscal Year Ended March 3 1,
6
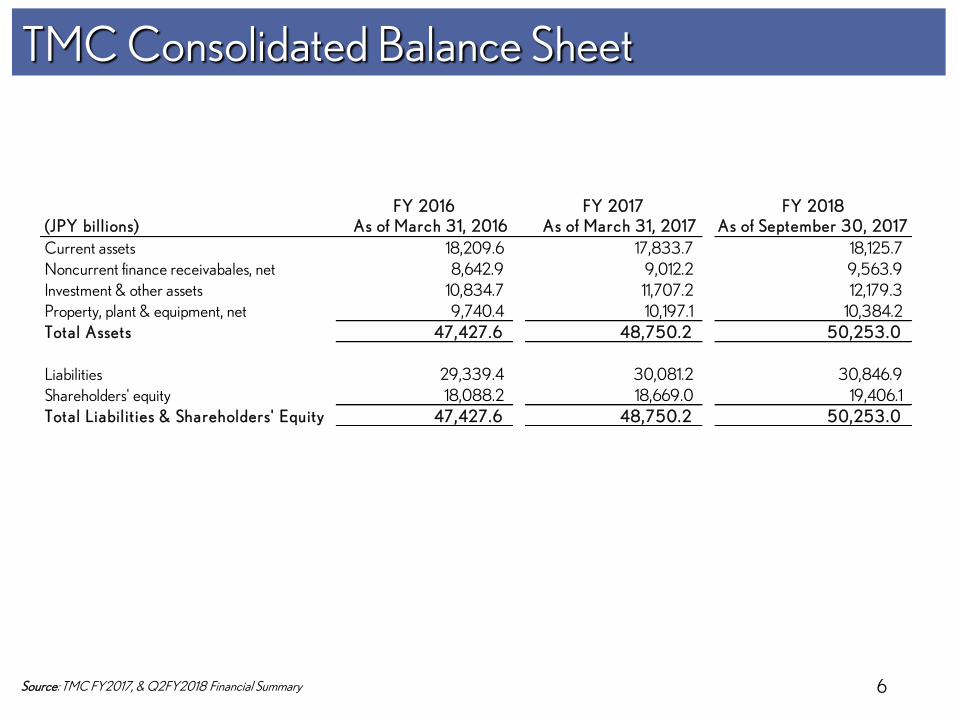
TMC Consolidated Balance Sheet
Source: TMC FY2017, & Q2FY2018 Financial Summary
FY 2016 FY 2017 FY 2018(JPY bil l ions) As of March 3 1, 2016 As of March 3 1, 2017 As of September 3 0, 2017
Current assets 18,209.6 17,833.7 18,125.7
Noncurrent finance receivabales, net 8,642.9 9,012.2 9,563.9
Investment & other assets 10,834.7 11,707.2 12,179.3
Property, plant & equipment, net 9,740.4 10,197.1 10,384.2
Tota l Assets 47,427.6 48,750.2 50,253 .0
Liabilities 29,339.4 30,081.2 30,846.9
Shareholders' equity 18,088.2 18,669.0 19,406.1
Tota l Liabil i t ies & Shareholders' Equity 47,427.6 48,750.2 50,253 .0
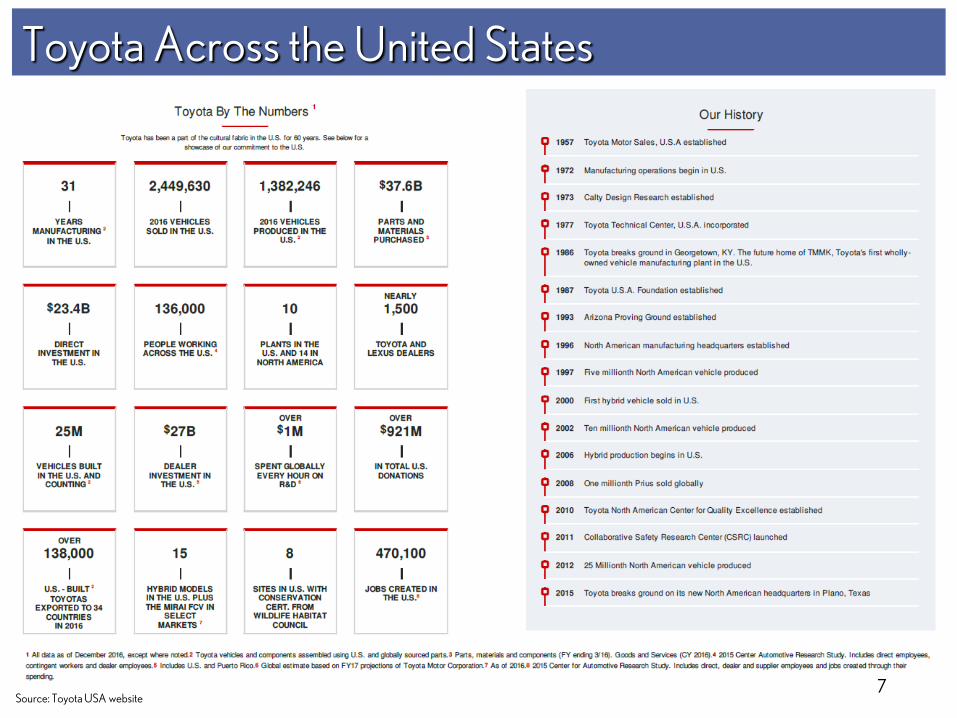
Toyota Across the United States
7 Source: Toyota USA website
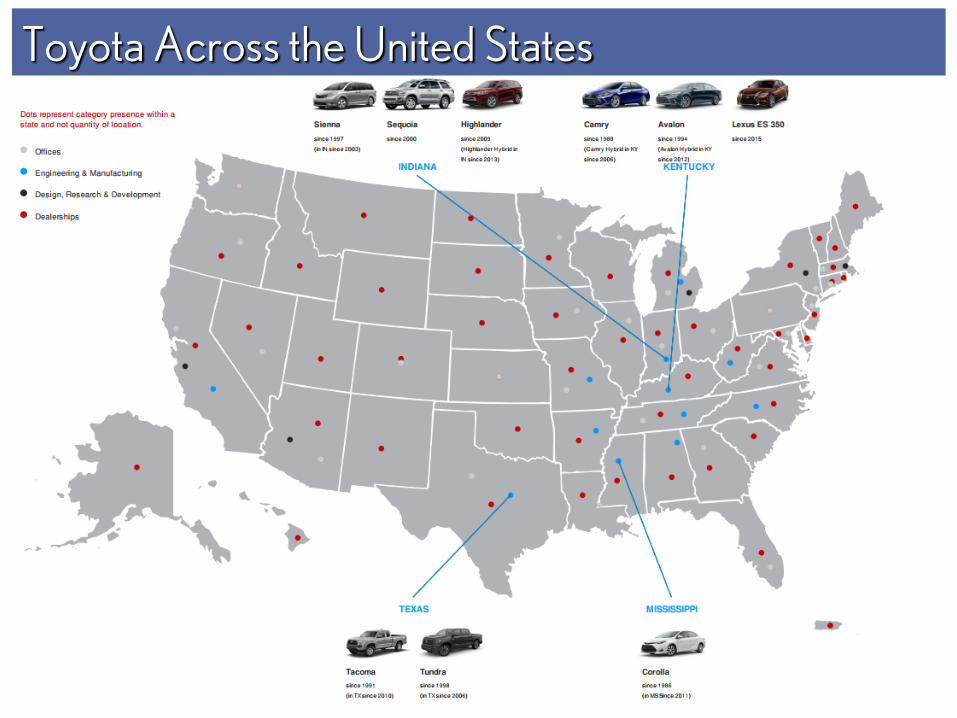
Toyota Across the United States
8
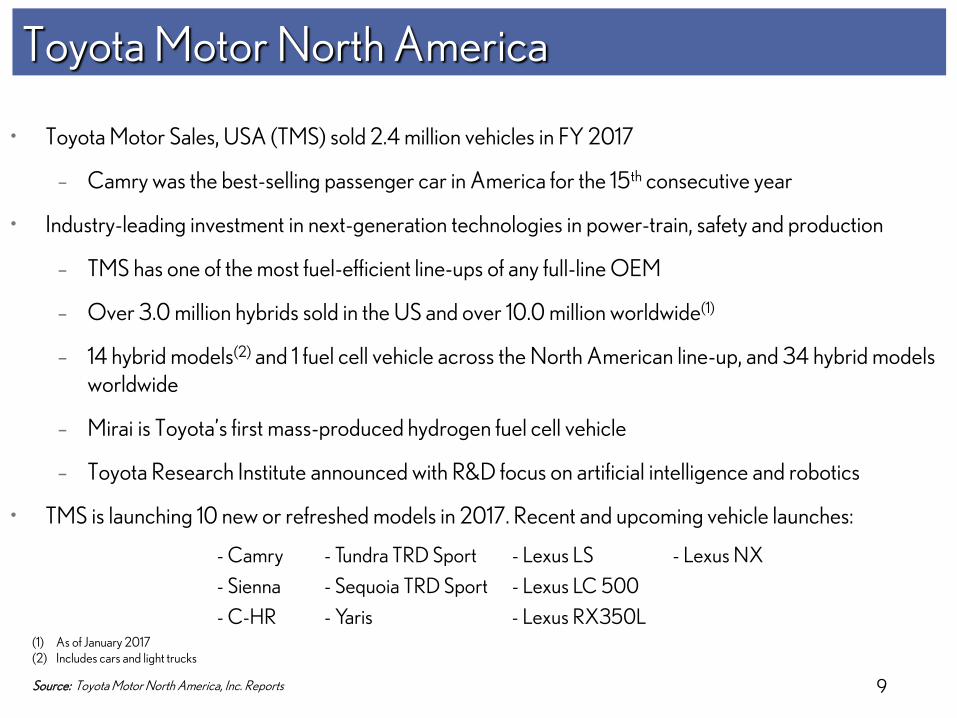
9
• Toyota Motor Sales, USA (TMS) sold 2.4 million vehicles in FY 2017
– Camry was the best-selling passenger car in America for the 15th consecutive year
• Industry-leading investment in next-generation technologies in power-train, safety and production
– TMS has one of the most fuel-efficient line-ups of any full-line OEM
– Over 3.0 million hybrids sold in the US and over 10.0 million worldwide(1)
– 14 hybrid models(2) and 1 fuel cell vehicle across the North American line-up, and 34 hybrid models worldwide
– Mirai is Toyota’s first mass-produced hydrogen fuel cell vehicle
– Toyota Research Institute announced with R&D focus on artificial intelligence and robotics
• TMS is launching 10 new or refreshed models in 2017. Recent and upcoming vehicle launches:
Toyota Motor North America
Source: Toyota Motor North America, Inc. Reports
- Camry - Tundra TRD Sport - Lexus LS - Lexus NX
- Sienna - Sequoia TRD Sport - Lexus LC 500
- C-HR - Yaris - Lexus RX350L
(1) As of January 2017 (2) Includes cars and light trucks
10
Toyota Motor North America (2)
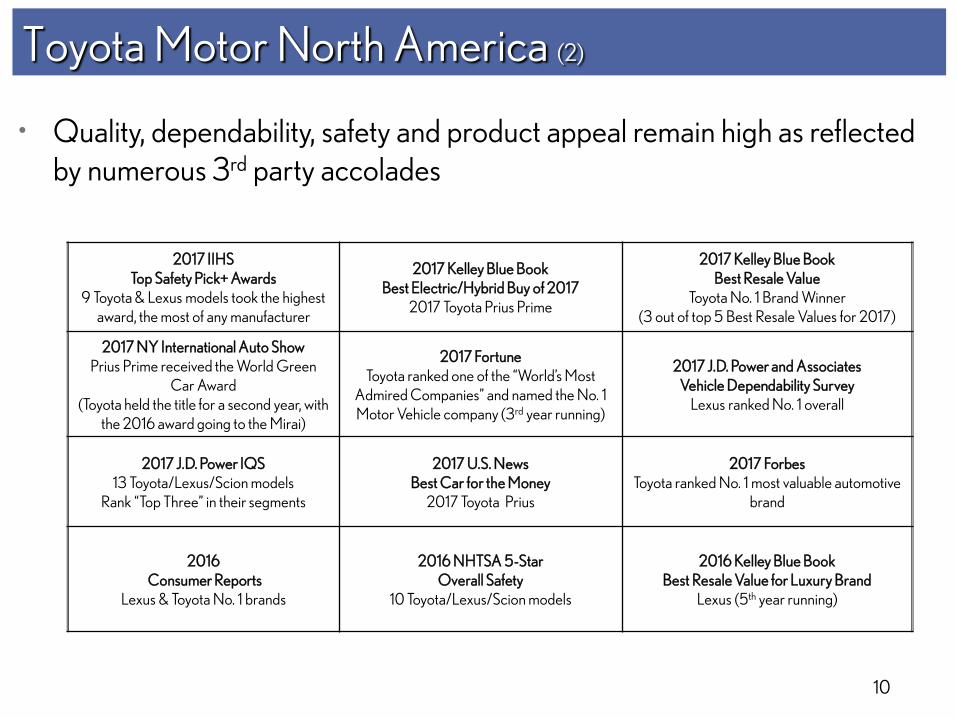
• Quality, dependability, safety and product appeal remain high as reflected by numerous 3rd party accolades
2017 IIHS Top Safety Pick+ Awards
9 Toyota & Lexus models took the highest award, the most of any manufacturer
2017 Kelley Blue Book Best Electric/Hybrid Buy of 2017
2017 Toyota Prius Prime
2017 Kelley Blue Book Best Resale Value
Toyota No. 1 Brand Winner (3 out of top 5 Best Resale Values for 2017)
2017 NY International Auto Show Prius Prime received the World Green
Car Award (Toyota held the title for a second year, with
the 2016 award going to the Mirai)
2017 Fortune Toyota ranked one of the “World’s Most
Admired Companies” and named the No. 1 Motor Vehicle company (3rd year running)
2017 J.D. Power and Associates Vehicle Dependability Survey
Lexus ranked No. 1 overall
2017 J.D. Power IQS 13 Toyota/Lexus/Scion models
Rank “Top Three” in their segments
2017 U.S. News Best Car for the Money
2017 Toyota Prius
2017 Forbes Toyota ranked No. 1 most valuable automotive
brand
2016
Consumer Reports Lexus & Toyota No. 1 brands
2016 NHTSA 5-Star
Overall Safety 10 Toyota/Lexus/Scion models
2016 Kelley Blue Book Best Resale Value for Luxury Brand
Lexus (5th year running)
11
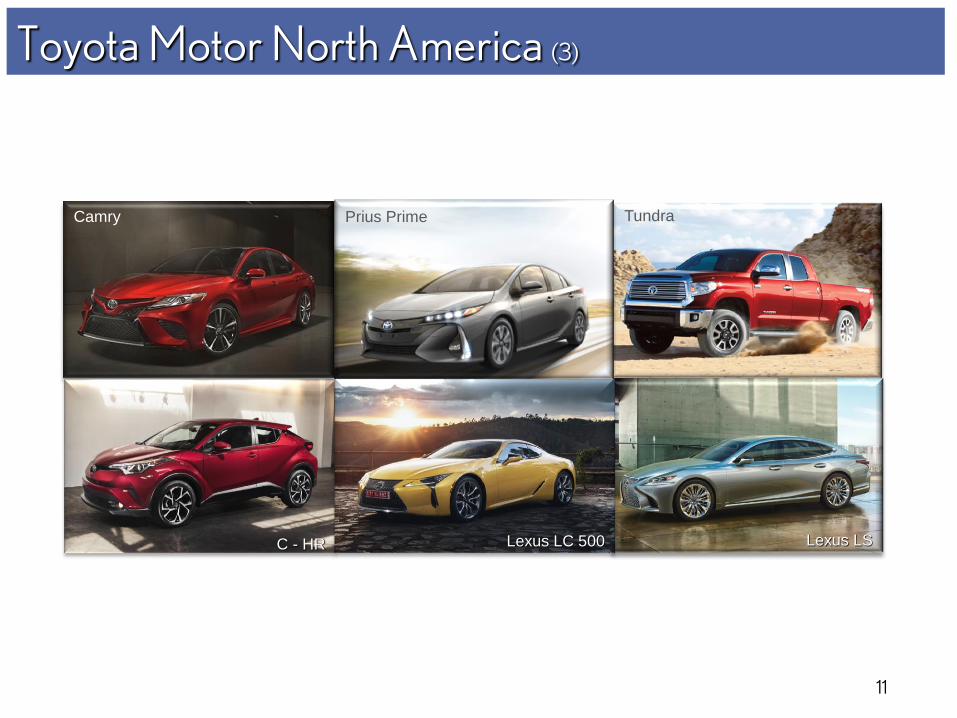
Toyota Motor North America (3)
Lexus LC 500
Camry Prius Prime Tundra
C - HR Lexus LS
12
Toyota Financial Services
13
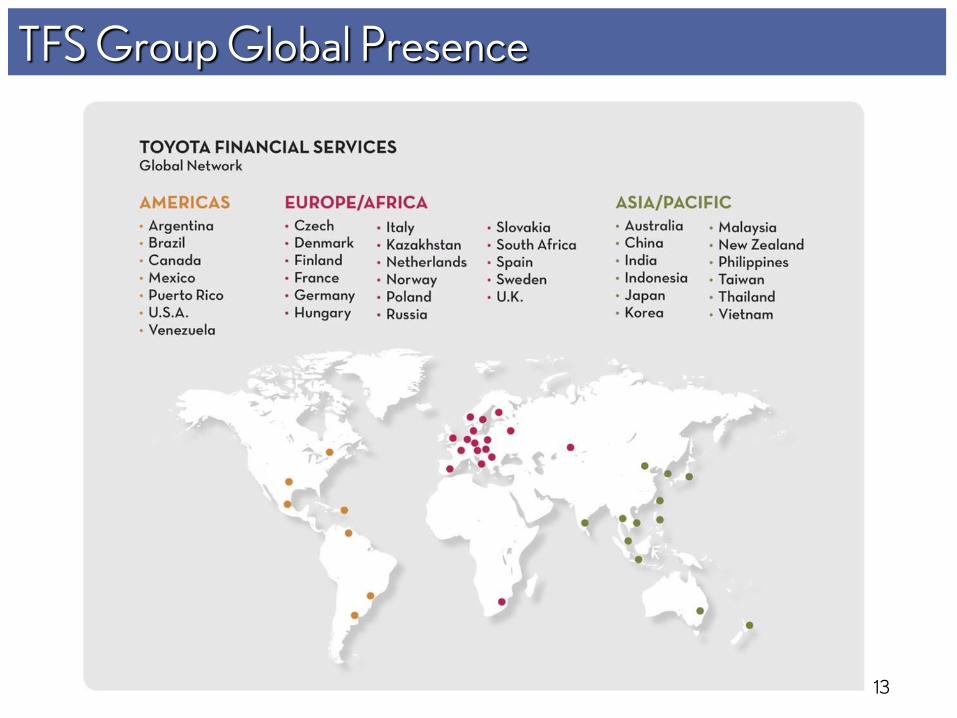
TFS Group Global Presence
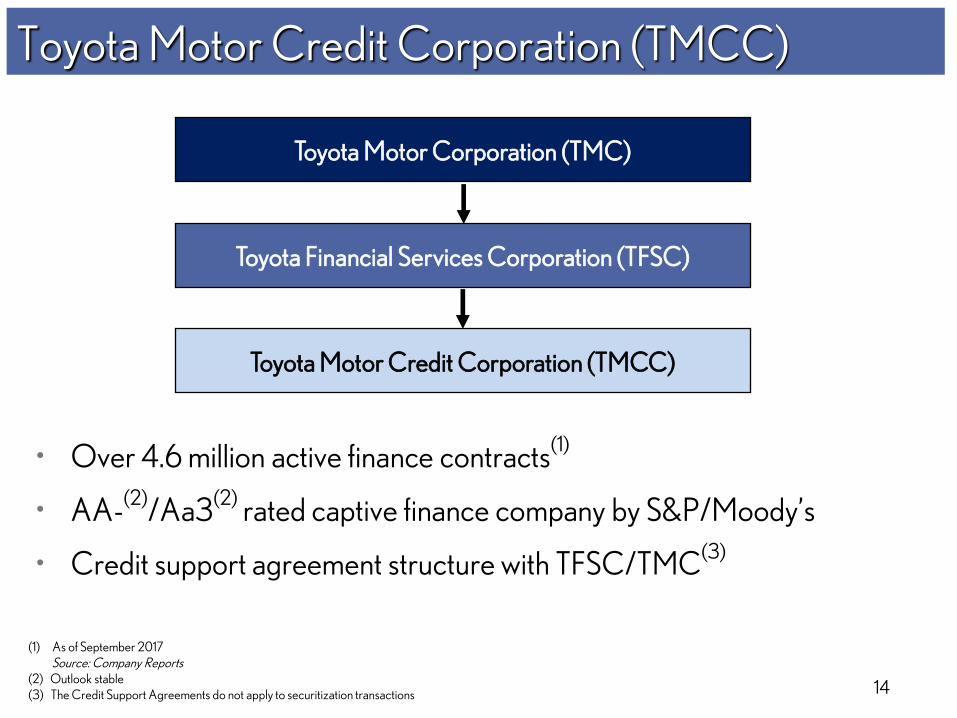
14
• Over 4.6 million active finance contracts(1)
• AA-(2)
/Aa3(2)
rated captive finance company by S&P/Moody’s
• Credit support agreement structure with TFSC/TMC(3)
Toyota Financial Services Corporation (TFSC)
Toyota Motor Credit Corporation (TMCC)
Toyota Motor Credit Corporation (TMCC)
Toyota Motor Corporation (TMC)
(1) As of September 2017 Source: Company Reports (2) Outlook stable (3) The Credit Support Agreements do not apply to securitization transactions

15
Credit Support Agreements • Securities* issued by TMCC (and various other TFSC subsidiaries) have the benefit of
a credit support agreement with TFSC
– TFSC will own 100% of TMCC
– TFSC will cause TMCC to maintain a tangible net worth of at least $100,000 as long as covered securities are outstanding
– If TMCC determines it will be unable to meet its payment obligations on any securities, TFSC will make sufficient funds available to TMCC to ensure that all such payment obligations are paid as due
– Agreement cannot be terminated until (1) repayment of all outstanding securities or (2) each rating agency requested by Toyota to provide a rating has confirmed no change in rating of all such securities
• TFSC in turn has the benefit of a credit support agreement with TMC
– Same key features as TFSC/TMCC credit support agreement
– TMC will cause TFSC to maintain a tangible net worth of at least JPY10mm as long as covered securities are outstanding
• TFSC’s and/or TMC's credit support obligations will rank pari passu with all other senior unsecured debt obligations
* “Securities” defined as outstanding bonds, debentures, notes and other investment securities and commercial paper, but does not include asset-backed securities issued by TMCC’s securitization trusts.
16
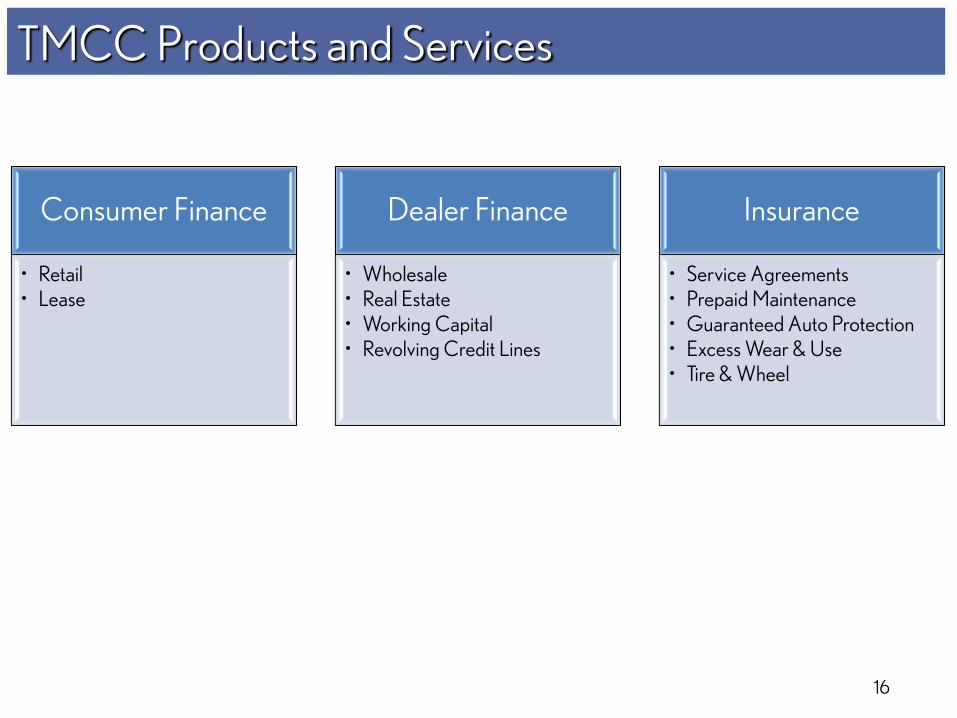
TMCC Products and Services
Consumer Finance
• Retail • Lease
Dealer Finance
• Wholesale • Real Estate • Working Capital • Revolving Credit Lines
Insurance
• Service Agreements • Prepaid Maintenance • Guaranteed Auto Protection • Excess Wear & Use • Tire & Wheel
17
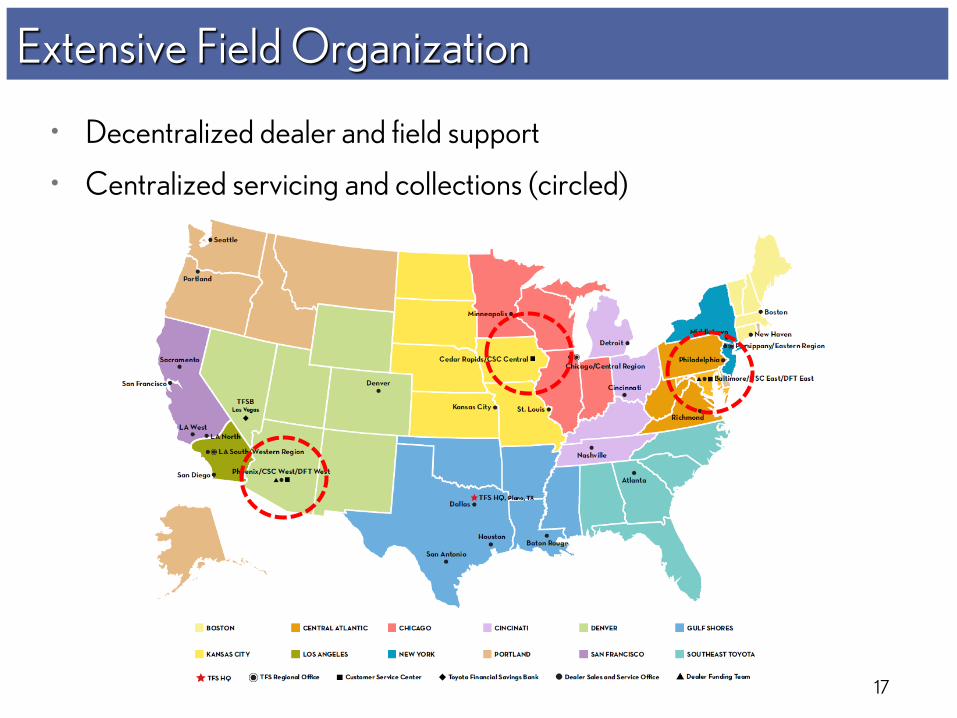
Extensive Field Organization
• Decentralized dealer and field support
• Centralized servicing and collections (circled)
18
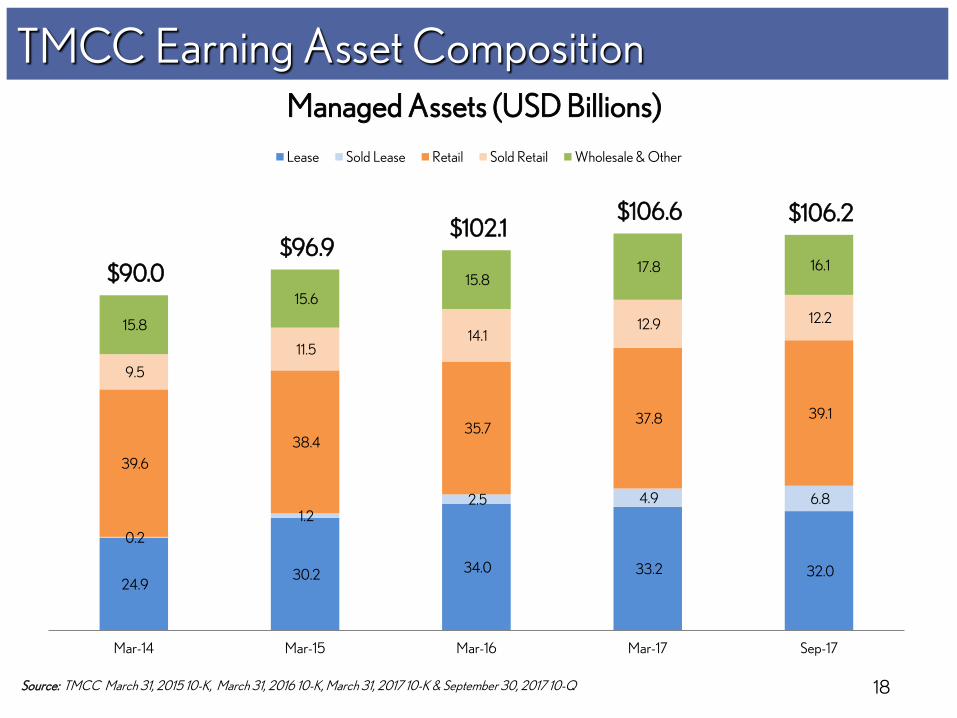
TMCC Earning Asset Composition
Source: TMCC March 31, 2015 10-K, March 31, 2016 10-K, March 31, 2017 10-K & September 30, 2017 10-Q
Managed Assets (USD Billions)
24.9 30.2 34.0 33.2 32.0
0.2
1.2 2.5 4.9 6.8
39.6
38.4 35.7
37.8 39.1
9.5
11.5 14.1
12.9 12.2 15.8
15.6
15.8 17.8 16.1 $90.0
$96.9 $102.1
$106.6 $106.2
Mar-14 Mar-15 Mar-16 Mar-17 Sep-17
Lease Sold Lease Retail Sold Retail Wholesale & Other
19
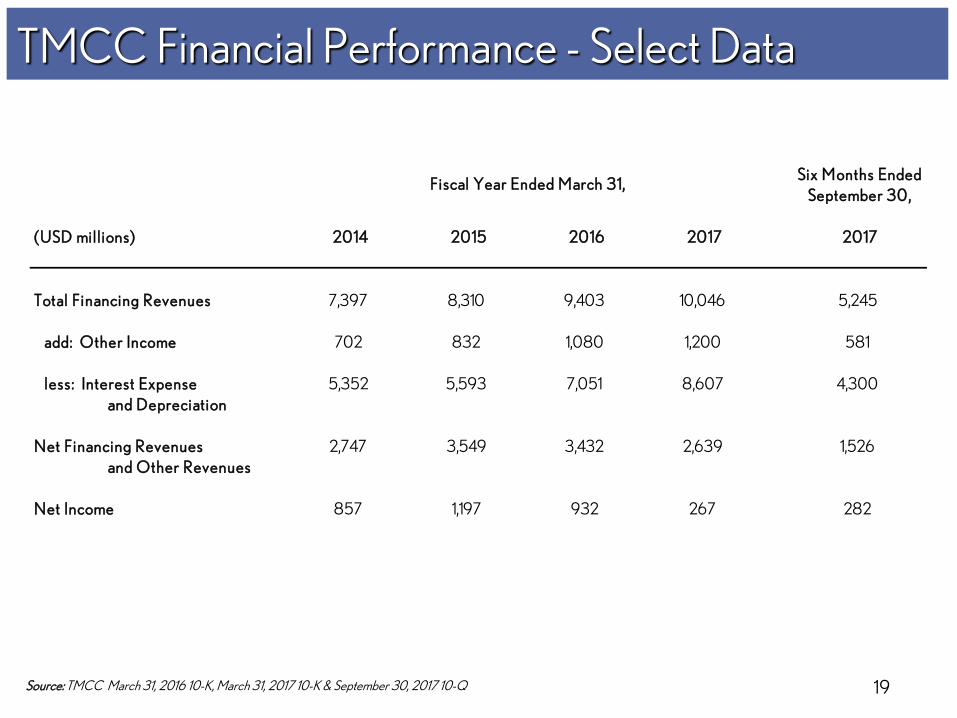
TMCC Financial Performance - Select Data
Source: TMCC March 31, 2016 10-K, March 31, 2017 10-K & September 30, 2017 10-Q
(USD mil l ions) 2014 2015 2016 2017 2017
Total Financing Revenues 7,397 8,310 9,403 10,046 5,245
add: Other Income 702 832 1,080 1,200 581
less: Interest Expense 5,352 5,593 7,051 8,607 4,300
and Depreciation
Net Financing Revenues 2,747 3,549 3,432 2,639 1,526
and Other Revenues
Net Income 857 1,197 932 267 282
Fiscal Year Ended March 31,Six Months Ended
September 30,
20
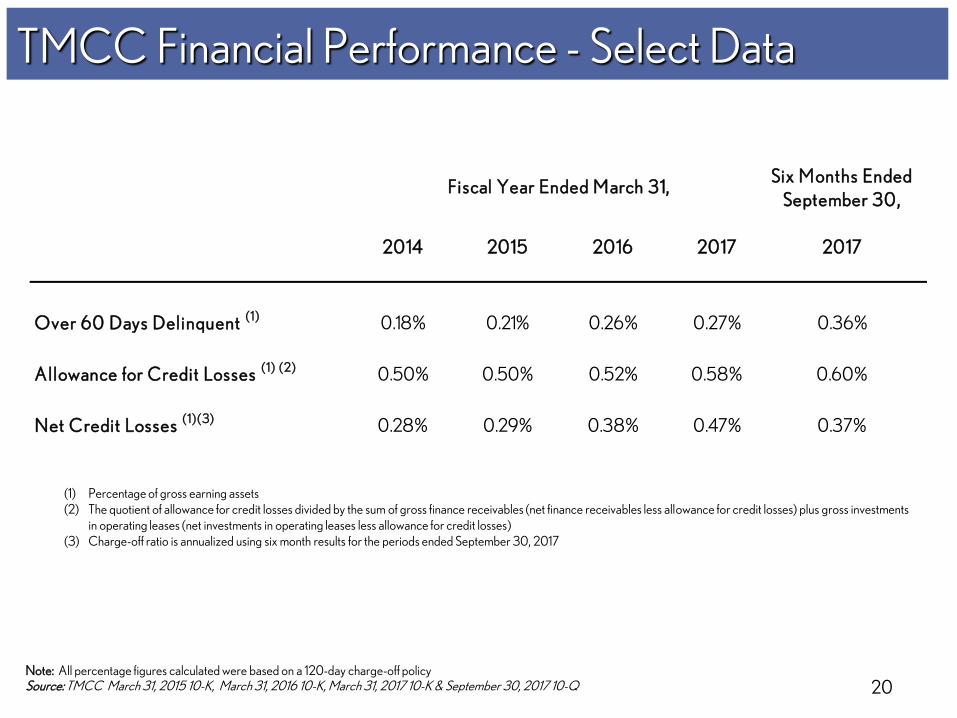
TMCC Financial Performance - Select Data
(1) Percentage of gross earning assets (2) The quotient of allowance for credit losses divided by the sum of gross finance receivables (net finance receivables less allowance for credit losses) plus gross investments
in operating leases (net investments in operating leases less allowance for credit losses) (3) Charge-off ratio is annualized using six month results for the periods ended September 30, 2017
Note: All percentage figures calculated were based on a 120-day charge-off policy Source: TMCC March 31, 2015 10-K, March 31, 2016 10-K, March 31, 2017 10-K & September 30, 2017 10-Q
2014 2015 2016 2017 2017
Over 60 Days Delinquent ( 1) 0.18% 0.21% 0.26% 0.27% 0.36%
Allowance for Credit Losses ( 1) ( 2) 0.50% 0.50% 0.52% 0.58% 0.60%
Net Credit Losses ( 1) ( 3) 0.28% 0.29% 0.38% 0.47% 0.37%
Fiscal Year Ended March 31,Six Months Ended
September 30,
21
TMCC Funding Programs
22
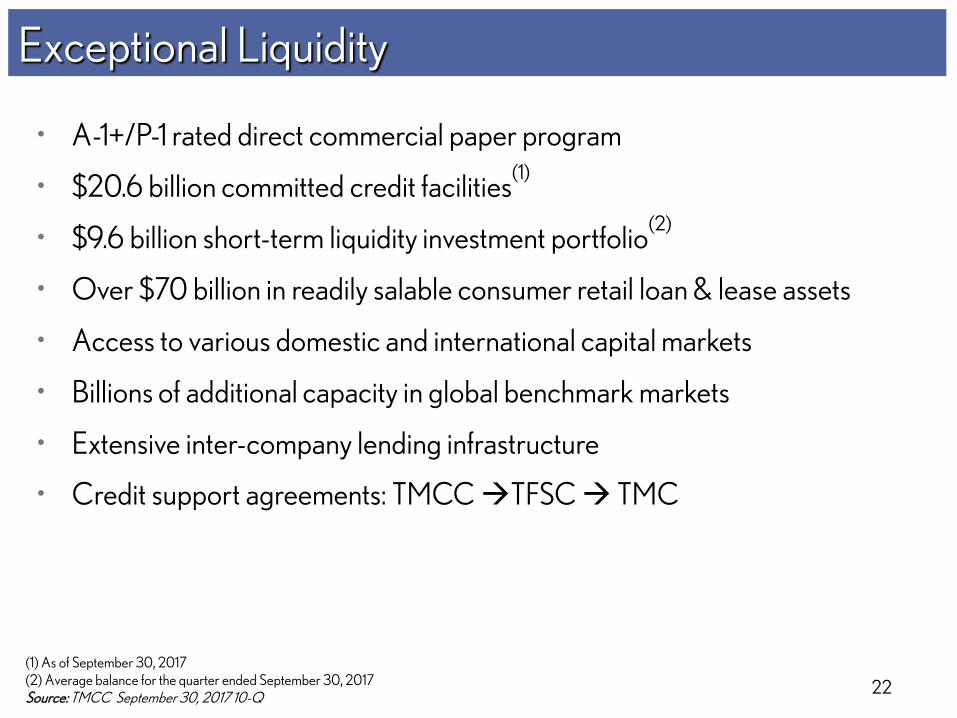
• A-1+/P-1 rated direct commercial paper program
• $20.6 billion committed credit facilities(1)
• $9.6 billion short-term liquidity investment portfolio(2)
• Over $70 billion in readily salable consumer retail loan & lease assets
• Access to various domestic and international capital markets
• Billions of additional capacity in global benchmark markets
• Extensive inter-company lending infrastructure
• Credit support agreements: TMCC TFSC TMC
Exceptional Liquidity
(1) As of September 30, 2017 (2) Average balance for the quarter ended September 30, 2017 Source: TMCC September 30, 2017 10-Q
23
• TMCC is committed to:
– Maintaining funding diversity and exceptional liquidity
– Issuing into strong demand with attractive deals
– Identifying & developing new markets and investor relationships
– Responding quickly to opportunities with best-in-class execution
– Managing our business and stakeholder relationships with a long-term view
TMCC Funding Program Objectives
Innovative Funding Platforms
24
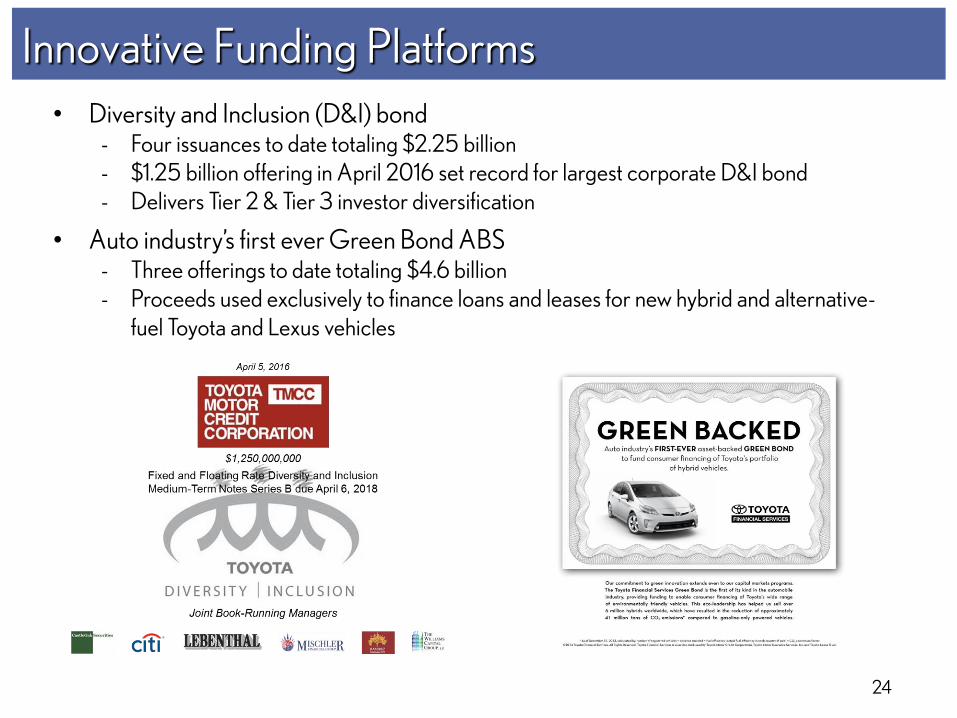
• Diversity and Inclusion (D&I) bond - Four issuances to date totaling $2.25 billion - $1.25 billion offering in April 2016 set record for largest corporate D&I bond - Delivers Tier 2 & Tier 3 investor diversification
• Auto industry’s first ever Green Bond ABS - Three offerings to date totaling $4.6 billion - Proceeds used exclusively to finance loans and leases for new hybrid and alternative-
fuel Toyota and Lexus vehicles
25
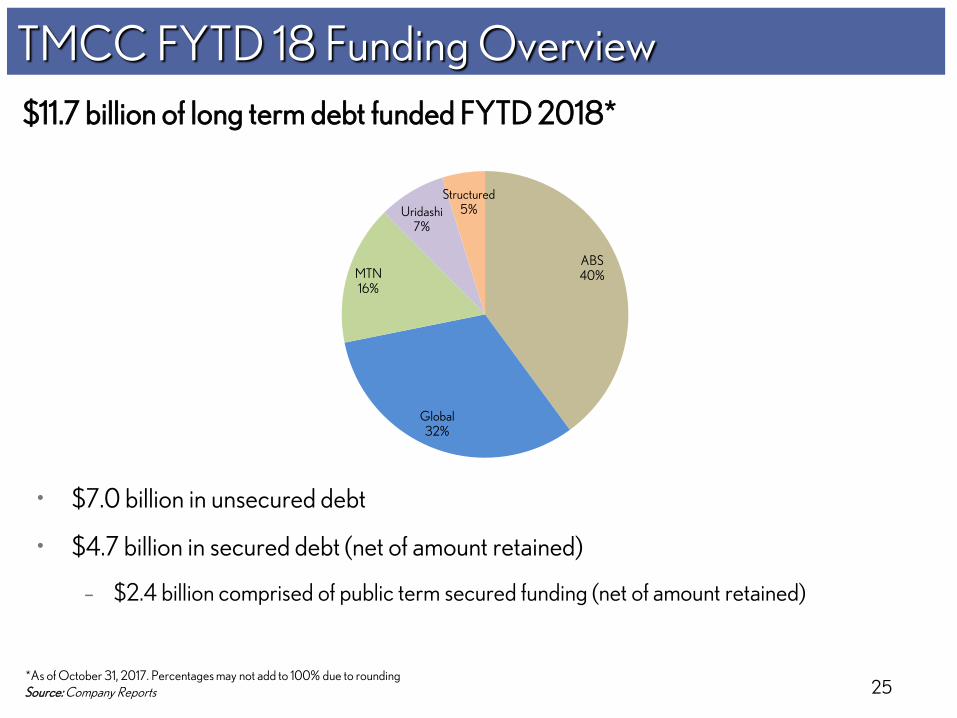
TMCC FYTD 18 Funding Overview
• $7.0 billion in unsecured debt
• $4.7 billion in secured debt (net of amount retained)
– $2.4 billion comprised of public term secured funding (net of amount retained)
Source: Company Reports
$11.7 billion of long term debt funded FYTD 2018*
*As of October 31, 2017. Percentages may not add to 100% due to rounding
ABS 40%
Global 32%
MTN 16%
Uridashi 7%
Structured 5%
26
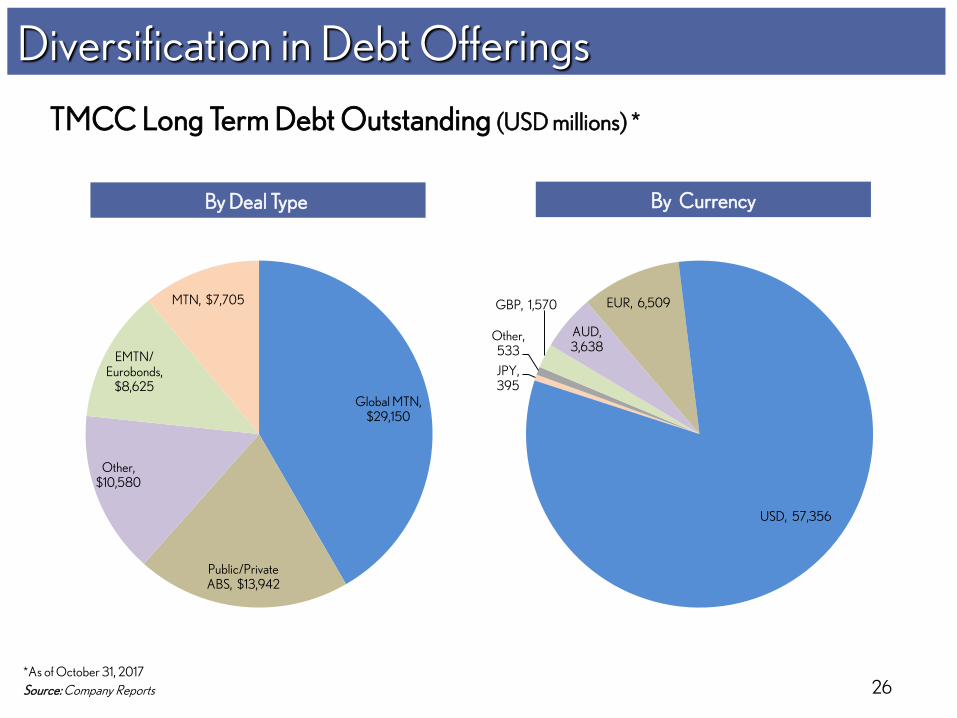
Diversification in Debt Offerings
TMCC Long Term Debt Outstanding (USD millions) *
*As of October 31, 2017
Source: Company Reports
By Deal Type By Currency
Global MTN, $29,150
Public/Private ABS, $13,942
Other, $10,580
EMTN/ Eurobonds,
$8,625
MTN, $7,705
JPY, 395
Other, 533
GBP, 1,570
AUD, 3,638
EUR, 6,509
USD, 57,356
27
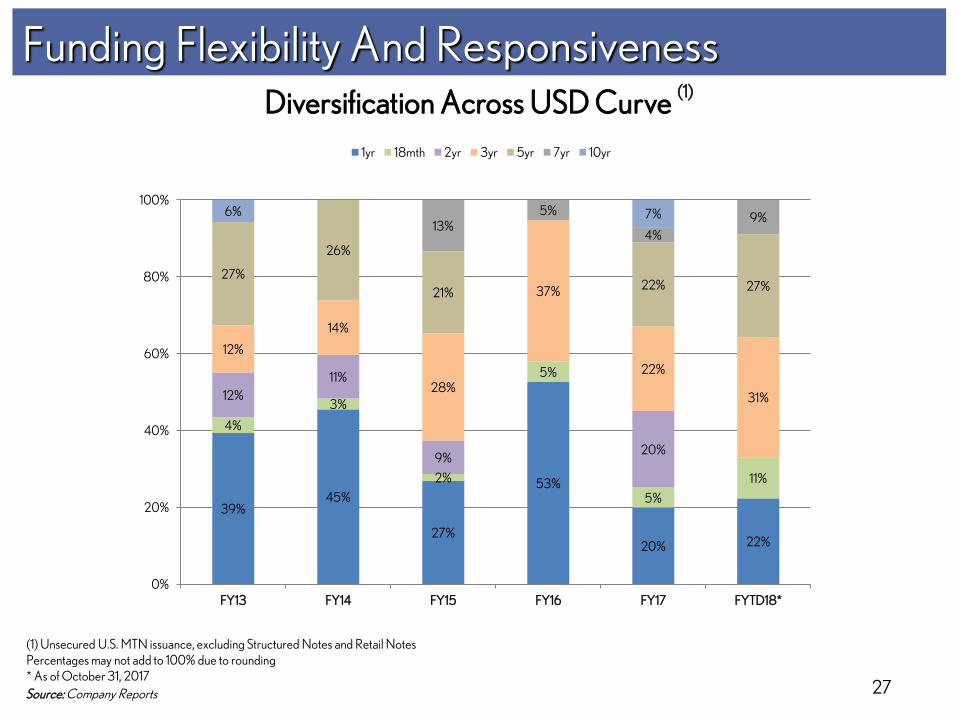
Funding Flexibility And Responsiveness
Source: Company Reports
Diversification Across USD Curve (1)
(1) Unsecured U.S. MTN issuance, excluding Structured Notes and Retail Notes Percentages may not add to 100% due to rounding * As of October 31, 2017
39% 45%
27%
53%
20% 22%
4%
3%
2%
5%
5%
11%
12%
11%
9% 20%
12%
14%
28%
37%
22%
31%
27%
26%
21% 22% 27%
13% 5%
4%
9% 6% 7%
0%
20%
40%
60%
80%
100%
FY13 FY14 FY15 FY16 FY17 FYTD18*
1yr 18mth 2yr 3yr 5yr 7yr 10yr
28
Key Investment Highlights
• Financial strength supported by strong credit ratings
• Transparent business model with exceptional liquidity
• Rational funding programs with long-term perspective
– Diversification in bond offerings
– Focus on proactively meeting needs of market
– Strong emphasis placed on flexibility and responsiveness
• Industry-leading in:
– Liquidity management framework
– Balance sheet strength
– Business model resiliency
29
TMCC Retail Loan Collateral & ABS Transactions
30
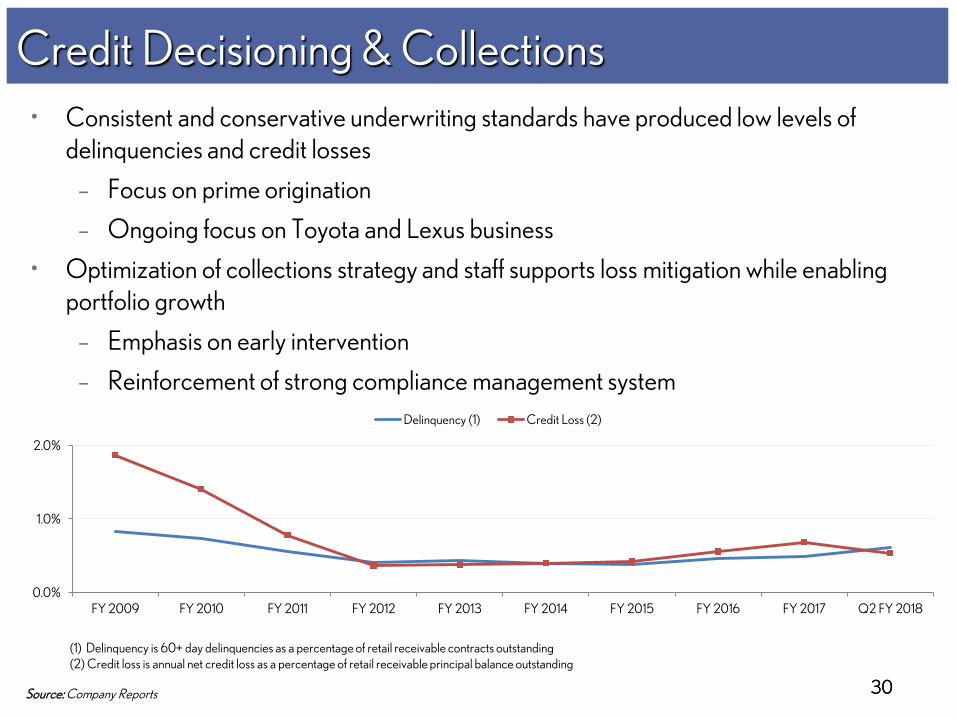
• Consistent and conservative underwriting standards have produced low levels of delinquencies and credit losses
– Focus on prime origination
– Ongoing focus on Toyota and Lexus business
• Optimization of collections strategy and staff supports loss mitigation while enabling portfolio growth
– Emphasis on early intervention
– Reinforcement of strong compliance management system
Credit Decisioning & Collections
30
(1) Delinquency is 60+ day delinquencies as a percentage of retail receivable contracts outstanding (2) Credit loss is annual net credit loss as a percentage of retail receivable principal balance outstanding
Source: Company Reports
0.0%
1.0%
2.0%
FY 2009 FY 2010 FY 2011 FY 2012 FY 2013 FY 2014 FY 2015 FY 2016 FY 2017 Q2 FY 2018
Delinquency (1) Credit Loss (2)
Source: Company Reports 31 31
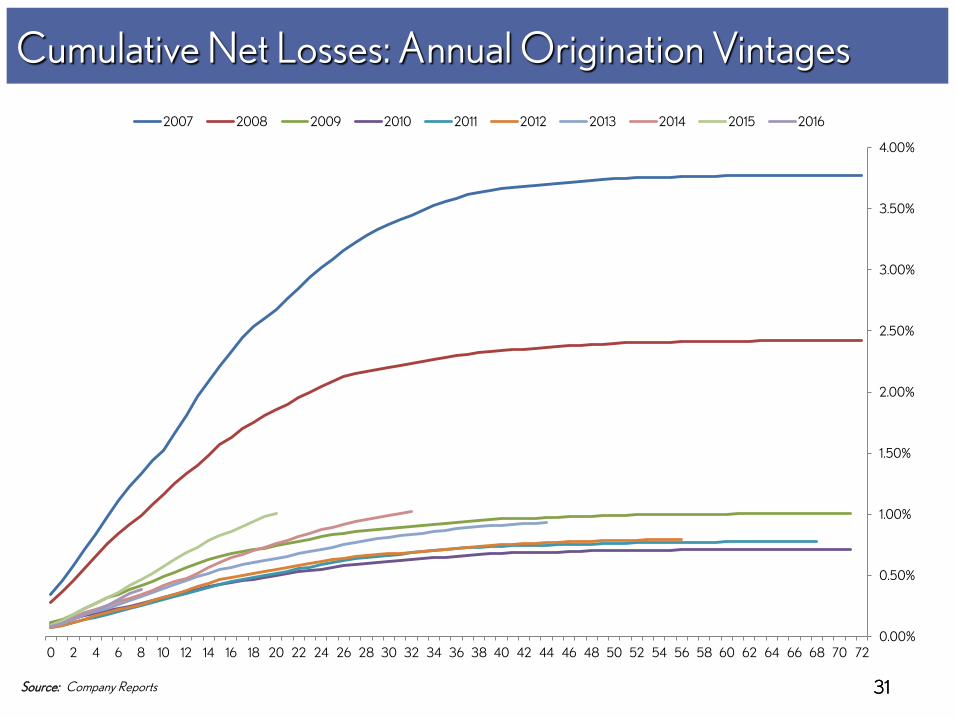
Cumulative Net Losses: Annual Origination Vintages
0.00%
0.50%
1.00%
1.50%
2.00%
2.50%
3.00%
3.50%
4.00%
0 2 4 6 8 10 12 14 16 18 20 22 24 26 28 30 32 34 36 38 40 42 44 46 48 50 52 54 56 58 60 62 64 66 68 70 72
2007 2008 2009 2010 2011 2012 2013 2014 2015 2016
32
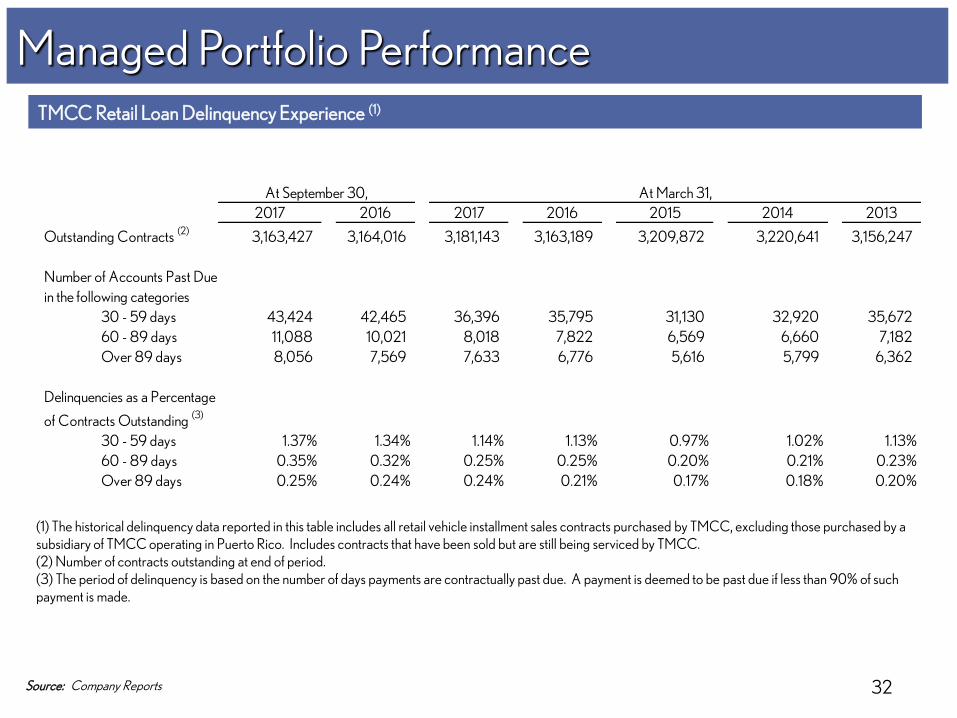
TMCC Retail Loan Delinquency Experience (1)
(1) The historical delinquency data reported in this table includes all retail vehicle installment sales contracts purchased by TMCC, excluding those purchased by a subsidiary of TMCC operating in Puerto Rico. Includes contracts that have been sold but are still being serviced by TMCC. (2) Number of contracts outstanding at end of period. (3) The period of delinquency is based on the number of days payments are contractually past due. A payment is deemed to be past due if less than 90% of such payment is made.
Managed Portfolio Performance
Source: Company Reports
2017 2016 2017 2016 2015 2014 2013
Outstanding Contracts (2)
3,163,427 3,164,016 3,181,143 3,163,189 3,209,872 3,220,641 3,156,247
Number of Accounts Past Due
in the following categories
30 - 59 days 43,424 42,465 36,396 35,795 31,130 32,920 35,672
60 - 89 days 11,088 10,021 8,018 7,822 6,569 6,660 7,182
Over 89 days 8,056 7,569 7,633 6,776 5,616 5,799 6,362
Delinquencies as a Percentage
of Contracts Outstanding (3)
30 - 59 days 1.37% 1.34% 1.14% 1.13% 0.97% 1.02% 1.13%
60 - 89 days 0.35% 0.32% 0.25% 0.25% 0.20% 0.21% 0.23%
Over 89 days 0.25% 0.24% 0.24% 0.21% 0.17% 0.18% 0.20%
At September 30, At March 31,
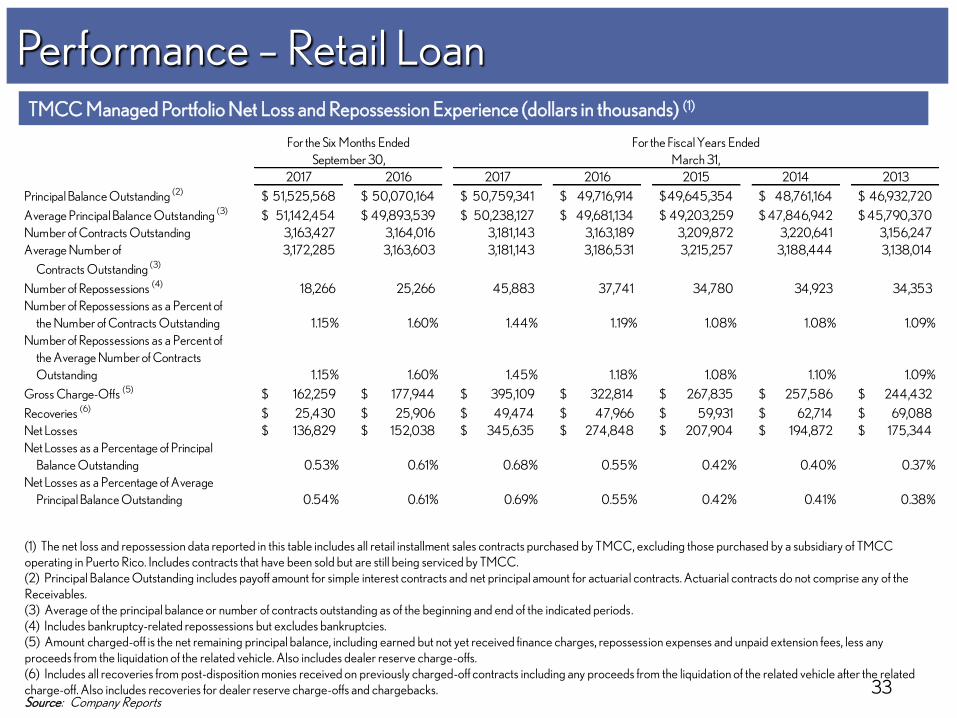
Performance – Retail Loan TMCC Managed Portfolio Net Loss and Repossession Experience (dollars in thousands) (1)
33 Source: Company Reports
(1) The net loss and repossession data reported in this table includes all retail installment sales contracts purchased by TMCC, excluding those purchased by a subsidiary of TMCC operating in Puerto Rico. Includes contracts that have been sold but are still being serviced by TMCC. (2) Principal Balance Outstanding includes payoff amount for simple interest contracts and net principal amount for actuarial contracts. Actuarial contracts do not comprise any of the Receivables. (3) Average of the principal balance or number of contracts outstanding as of the beginning and end of the indicated periods. (4) Includes bankruptcy-related repossessions but excludes bankruptcies. (5) Amount charged-off is the net remaining principal balance, including earned but not yet received finance charges, repossession expenses and unpaid extension fees, less any proceeds from the liquidation of the related vehicle. Also includes dealer reserve charge-offs. (6) Includes all recoveries from post-disposition monies received on previously charged-off contracts including any proceeds from the liquidation of the related vehicle after the related charge-off. Also includes recoveries for dealer reserve charge-offs and chargebacks.
2017 2016 2017 2016 2015 2014 2013
Principal Balance Outstanding (2) 51,525,568$ 50,070,164$ 50,759,341$ 49,716,914$ 49,645,354$ 48,761,164$ 46,932,720$
Average Principal Balance Outstanding (3) 51,142,454$ 49,893,539$ 50,238,127$ 49,681,134$ 49,203,259$ 47,846,942$ 45,790,370$
Number of Contracts Outstanding 3,163,427 3,164,016 3,181,143 3,163,189 3,209,872 3,220,641 3,156,247
Average Number of 3,172,285 3,163,603 3,181,143 3,186,531 3,215,257 3,188,444 3,138,014
Contracts Outstanding (3)
Number of Repossessions (4) 18,266 25,266 45,883 37,741 34,780 34,923 34,353
Number of Repossessions as a Percent of
the Number of Contracts Outstanding 1.15% 1.60% 1.44% 1.19% 1.08% 1.08% 1.09%
Number of Repossessions as a Percent of
the Average Number of Contracts
Outstanding 1.15% 1.60% 1.45% 1.18% 1.08% 1.10% 1.09%
Gross Charge-Offs (5) 162,259$ 177,944$ 395,109$ 322,814$ 267,835$ 257,586$ 244,432$
Recoveries (6) 25,430$ 25,906$ 49,474$ 47,966$ 59,931$ 62,714$ 69,088$
Net Losses 136,829$ 152,038$ 345,635$ 274,848$ 207,904$ 194,872$ 175,344$
Net Losses as a Percentage of Principal
Balance Outstanding 0.53% 0.61% 0.68% 0.55% 0.42% 0.40% 0.37%
Net Losses as a Percentage of Average
Principal Balance Outstanding 0.54% 0.61% 0.69% 0.55% 0.42% 0.41% 0.38%
For the Six Months Ended
September 30,
For the Fiscal Years Ended
March 31,
34
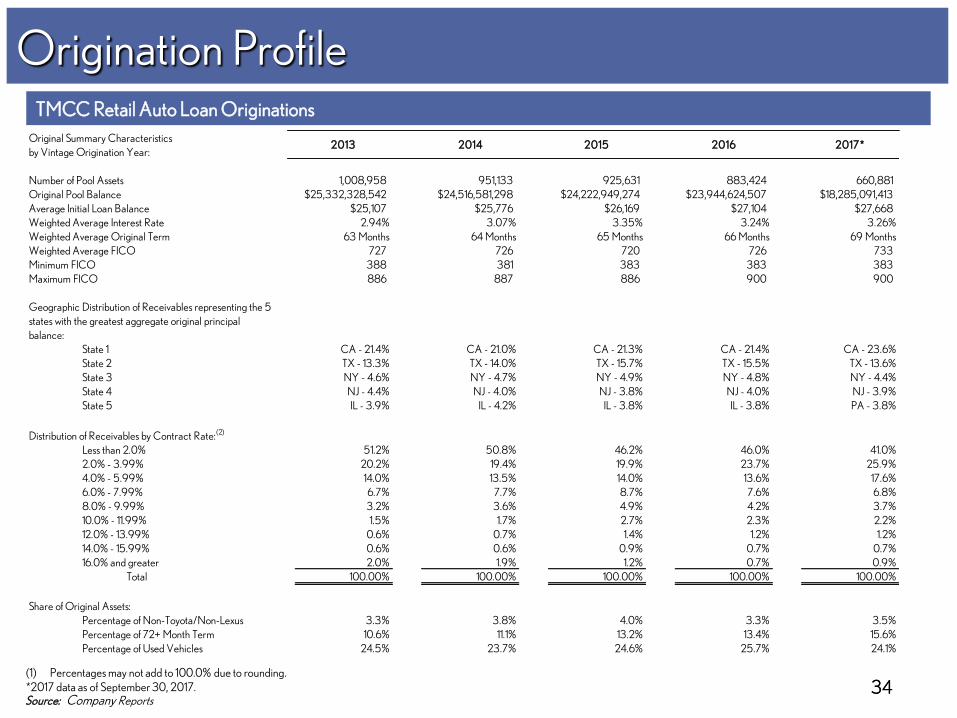
TMCC Retail Auto Loan Originations
(1) Percentages may not add to 100.0% due to rounding. *2017 data as of September 30, 2017.
Origination Profile
34 Source: Company Reports
Original Summary Characteristics
by Vintage Origination Year:2013 2014 2015 2016 2017*
Number of Pool Assets 1,008,958 951,133 925,631 883,424 660,881
Original Pool Balance $25,332,328,542 $24,516,581,298 $24,222,949,274 $23,944,624,507 $18,285,091,413
Average Initial Loan Balance $25,107 $25,776 $26,169 $27,104 $27,668
Weighted Average Interest Rate 2.94% 3.07% 3.35% 3.24% 3.26%
Weighted Average Original Term 63 Months 64 Months 65 Months 66 Months 69 Months
Weighted Average FICO 727 726 720 726 733
Minimum FICO 388 381 383 383 383
Maximum FICO 886 887 886 900 900
Geographic Distribution of Receivables representing the 5
states with the greatest aggregate original principal
balance:
State 1 CA - 21.4% CA - 21.0% CA - 21.3% CA - 21.4% CA - 23.6%
State 2 TX - 13.3% TX - 14.0% TX - 15.7% TX - 15.5% TX - 13.6%
State 3 NY - 4.6% NY - 4.7% NY - 4.9% NY - 4.8% NY - 4.4%
State 4 NJ - 4.4% NJ - 4.0% NJ - 3.8% NJ - 4.0% NJ - 3.9%
State 5 IL - 3.9% IL - 4.2% IL - 3.8% IL - 3.8% PA - 3.8%
Distribution of Receivables by Contract Rate:(2)
Less than 2.0% 51.2% 50.8% 46.2% 46.0% 41.0%
2.0% - 3.99% 20.2% 19.4% 19.9% 23.7% 25.9%
4.0% - 5.99% 14.0% 13.5% 14.0% 13.6% 17.6%
6.0% - 7.99% 6.7% 7.7% 8.7% 7.6% 6.8%
8.0% - 9.99% 3.2% 3.6% 4.9% 4.2% 3.7%
10.0% - 11.99% 1.5% 1.7% 2.7% 2.3% 2.2%
12.0% - 13.99% 0.6% 0.7% 1.4% 1.2% 1.2%
14.0% - 15.99% 0.6% 0.6% 0.9% 0.7% 0.7%
16.0% and greater 2.0% 1.9% 1.2% 0.7% 0.9%
Total 100.00% 100.00% 100.00% 100.00% 100.00%
Share of Original Assets:
Percentage of Non-Toyota/Non-Lexus 3.3% 3.8% 4.0% 3.3% 3.5%
Percentage of 72+ Month Term 10.6% 11.1% 13.2% 13.4% 15.6%
Percentage of Used Vehicles 24.5% 23.7% 24.6% 25.7% 24.1%
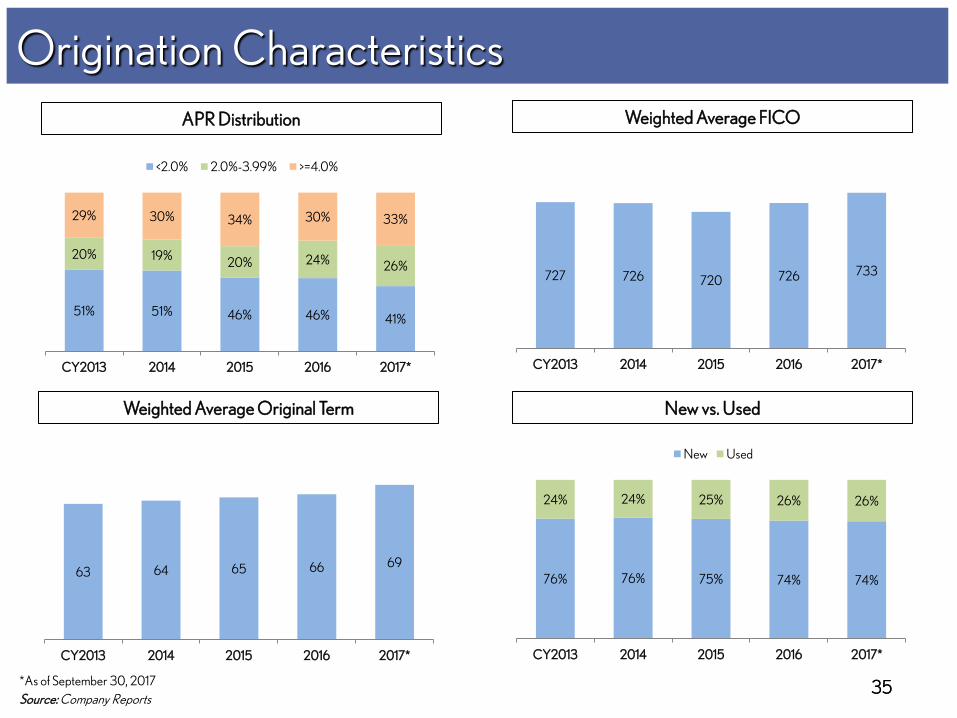
Origination Characteristics
APR Distribution
35 35
Weighted Average FICO
Weighted Average Original Term New vs. Used
*As of September 30, 2017
Source: Company Reports
51% 51% 46% 46% 41%
20% 19% 20% 24% 26%
29% 30% 34% 30% 33%
CY2013 2014 2015 2016 2017*
<2.0% 2.0%-3.99% >=4.0%
727 726 720 726 733
CY2013 2014 2015 2016 2017*
63 64 65 66 69
CY2013 2014 2015 2016 2017*
76% 76% 75% 74% 74%
24% 24% 25% 26% 26%
CY2013 2014 2015 2016 2017*
New Used
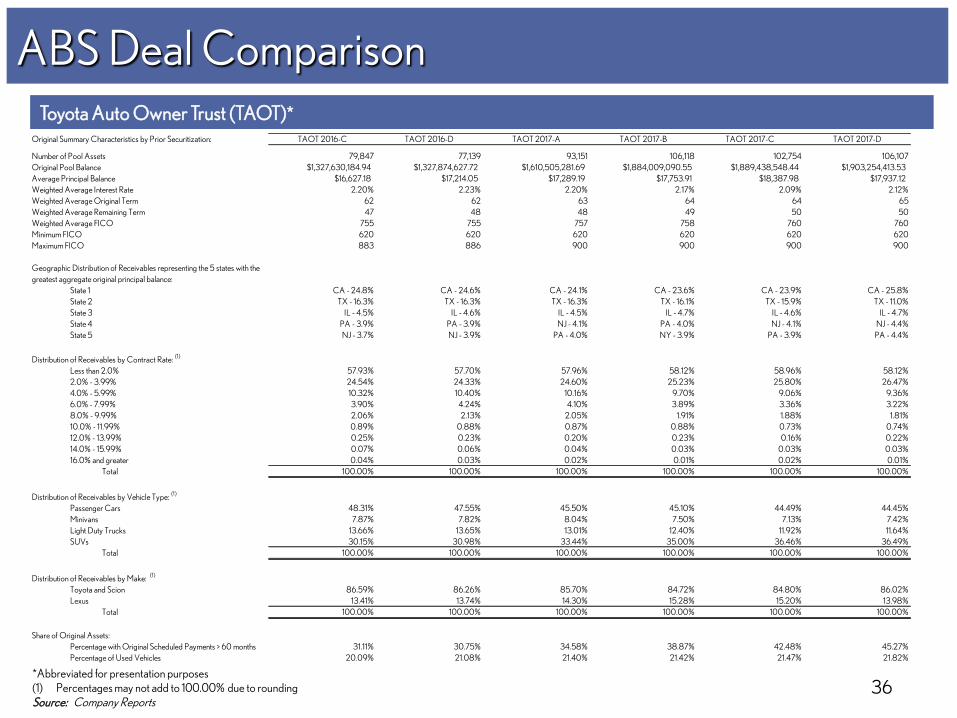
ABS Deal Comparison
Toyota Auto Owner Trust (TAOT)*
*Abbreviated for presentation purposes (1) Percentages may not add to 100.00% due to rounding Source: Company Reports
36
Original Summary Characteristics by Prior Securitization: TAOT 2016-C TAOT 2016-D TAOT 2017-A TAOT 2017-B TAOT 2017-C TAOT 2017-D
Number of Pool Assets 79,847 77,139 93,151 106,118 102,754 106,107
Original Pool Balance $1,327,630,184.94 $1,327,874,627.72 $1,610,505,281.69 $1,884,009,090.55 $1,889,438,548.44 $1,903,254,413.53
Average Principal Balance $16,627.18 $17,214.05 $17,289.19 $17,753.91 $18,387.98 $17,937.12
Weighted Average Interest Rate 2.20% 2.23% 2.20% 2.17% 2.09% 2.12%
Weighted Average Original Term 62 62 63 64 64 65
Weighted Average Remaining Term 47 48 48 49 50 50
Weighted Average FICO 755 755 757 758 760 760
Minimum FICO 620 620 620 620 620 620
Maximum FICO 883 886 900 900 900 900
Geographic Distribution of Receivables representing the 5 states with the
greatest aggregate original principal balance:
State 1 CA - 24.8% CA - 24.6% CA - 24.1% CA - 23.6% CA - 23.9% CA - 25.8%
State 2 TX - 16.3% TX - 16.3% TX - 16.3% TX - 16.1% TX - 15.9% TX - 11.0%
State 3 IL - 4.5% IL - 4.6% IL - 4.5% IL - 4.7% IL - 4.6% IL - 4.7%
State 4 PA - 3.9% PA - 3.9% NJ - 4.1% PA - 4.0% NJ - 4.1% NJ - 4.4%
State 5 NJ - 3.7% NJ - 3.9% PA - 4.0% NY - 3.9% PA - 3.9% PA - 4.4%
Distribution of Receivables by Contract Rate: (1)
Less than 2.0% 57.93% 57.70% 57.96% 58.12% 58.96% 58.12%
2.0% - 3.99% 24.54% 24.33% 24.60% 25.23% 25.80% 26.47%
4.0% - 5.99% 10.32% 10.40% 10.16% 9.70% 9.06% 9.36%
6.0% - 7.99% 3.90% 4.24% 4.10% 3.89% 3.36% 3.22%
8.0% - 9.99% 2.06% 2.13% 2.05% 1.91% 1.88% 1.81%
10.0% - 11.99% 0.89% 0.88% 0.87% 0.88% 0.73% 0.74%
12.0% - 13.99% 0.25% 0.23% 0.20% 0.23% 0.16% 0.22%
14.0% - 15.99% 0.07% 0.06% 0.04% 0.03% 0.03% 0.03%
16.0% and greater 0.04% 0.03% 0.02% 0.01% 0.02% 0.01%
Total 100.00% 100.00% 100.00% 100.00% 100.00% 100.00%
Distribution of Receivables by Vehicle Type: (1)
Passenger Cars 48.31% 47.55% 45.50% 45.10% 44.49% 44.45%
Minivans 7.87% 7.82% 8.04% 7.50% 7.13% 7.42%
Light Duty Trucks 13.66% 13.65% 13.01% 12.40% 11.92% 11.64%
SUVs 30.15% 30.98% 33.44% 35.00% 36.46% 36.49%
Total 100.00% 100.00% 100.00% 100.00% 100.00% 100.00%
Distribution of Receivables by Make: (1)
Toyota and Scion 86.59% 86.26% 85.70% 84.72% 84.80% 86.02%
Lexus 13.41% 13.74% 14.30% 15.28% 15.20% 13.98%
Total 100.00% 100.00% 100.00% 100.00% 100.00% 100.00%
Share of Original Assets:
Percentage with Original Scheduled Payments > 60 months 31.11% 30.75% 34.58% 38.87% 42.48% 45.27%
Percentage of Used Vehicles 20.09% 21.08% 21.40% 21.42% 21.47% 21.82%
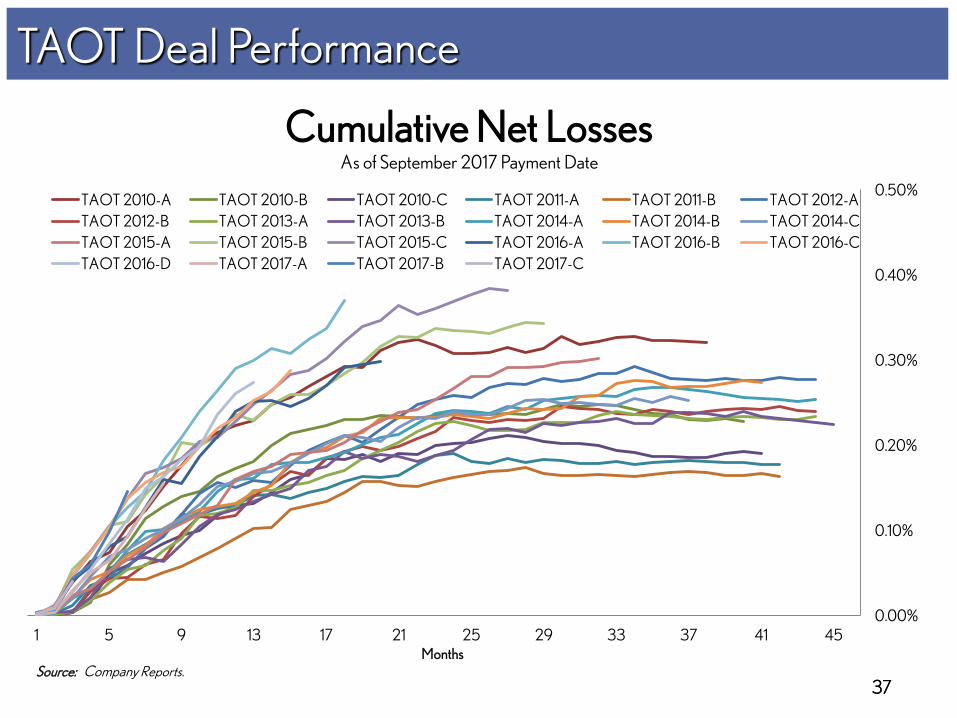
TAOT Deal Performance
37 37 Source: Company Reports.
Cumulative Net Losses As of September 2017 Payment Date
Months
0.00%
0.10%
0.20%
0.30%
0.40%
0.50%
1 5 9 13 17 21 25 29 33 37 41 45
TAOT 2010-A TAOT 2010-B TAOT 2010-C TAOT 2011-A TAOT 2011-B TAOT 2012-A
TAOT 2012-B TAOT 2013-A TAOT 2013-B TAOT 2014-A TAOT 2014-B TAOT 2014-C
TAOT 2015-A TAOT 2015-B TAOT 2015-C TAOT 2016-A TAOT 2016-B TAOT 2016-C
TAOT 2016-D TAOT 2017-A TAOT 2017-B TAOT 2017-C

38
Sales & Trading Update
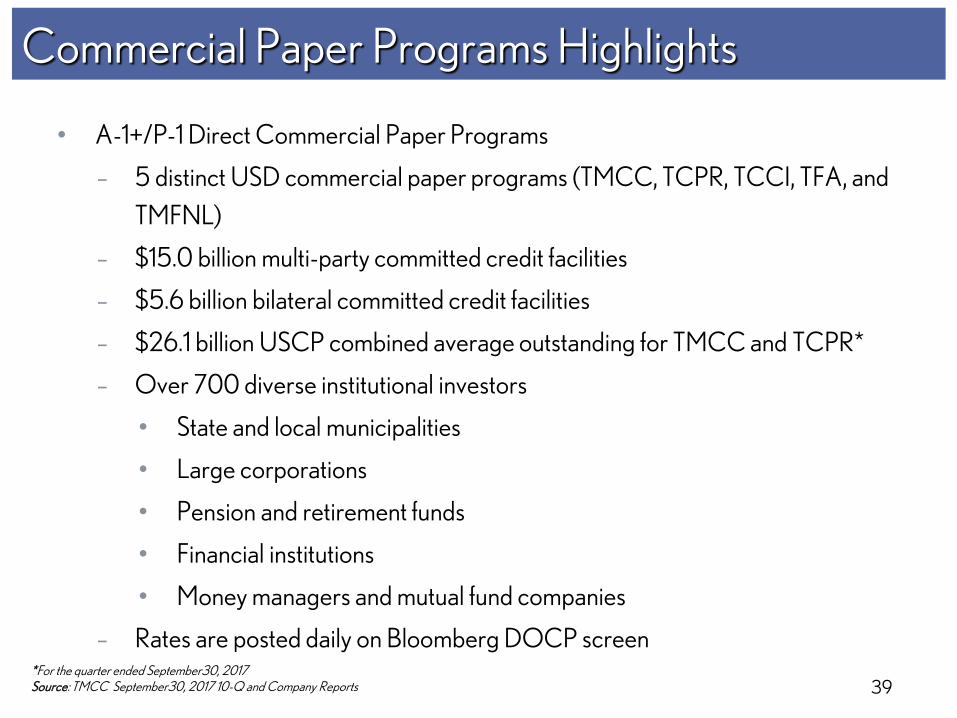
Commercial Paper Programs Highlights
• A-1+/P-1 Direct Commercial Paper Programs
– 5 distinct USD commercial paper programs (TMCC, TCPR, TCCI, TFA, and
TMFNL)
– $15.0 billion multi-party committed credit facilities
– $5.6 billion bilateral committed credit facilities
– $26.1 billion USCP combined average outstanding for TMCC and TCPR*
– Over 700 diverse institutional investors
• State and local municipalities
• Large corporations
• Pension and retirement funds
• Financial institutions
• Money managers and mutual fund companies
– Rates are posted daily on Bloomberg DOCP screen *For the quarter ended September30, 2017 Source: TMCC September30, 2017 10-Q and Company Reports 39