Embed Size (px)
Citation preview

Assemblée Générale -
Algemene Vergadering
IA|BE
13/09/2018

IA|BE – General Assembly – 2 – 13/09/2018
Assemblée Générale -Algemene Vergadering
Jean-François Hannosset
IA|BE – General Assembly – 3 – 13/09/2018
Sponsors IA|BE 2018

IA|BE – General Assembly – 4 – 13/09/2018
Assemblée Générale -Algemene Vergadering
Programme - Programma
Verwelkoming – Mot de bienvenue
Nieuwe leden – Nouveaux membres
Jean-François Hannosset
Approbation révision du système CPD
Goedkeuring herziening CPD systeem
Audrey Meganck / Guy Roelandt
Exposé – Uiteenzetting:
Solvency II, two years on
Olav Jones
Night of the Actuaries 2018 Fabian de Bilderling
Conclusions – Cocktail Jean-François Hannosset

IA|BE – General Assembly – 5 – 13/09/2018
Nieuwe leden - Nouveaux membres
• Paola AGRESTA (ULB)
• Mohamed AMGHAR (ULB)
• Alexia BREULS (UCL)
• Xenia LEFEBVRE (UCL)
• Olivier SOUPART (UCL)

IA|BE – General Assembly – 6 – 13/09/2018
“Approbation révision du système CPD –Goedkeuring herziening CPD systeem”
Audrey Meganck
Jean-François Hannosset

IA|BE – General Assembly – 7 – 13/09/2018
CPD
LessonsLearned
New Syllabus
Changing World
Quality IncreaseInteraction
WHY?

IA|BE – General Assembly – 8 – 13/09/2018
HOW?
AG 13 juin High Level
presentation
Next weekdetailled ROI will be sent
out
Organisation of twoconsultation sessions
26/6 & 4/9
Final ROI has been sent out
6/9
GA 13/9 final vote new ROI
(part CPD)
ROI: limited to the CPD part
Questions: [email protected]

IA|BE – General Assembly – 9 – 13/09/2018
CPD (vanaf 1/1/2019)
Deelname aan Actuarieel Technische opleidingen
(1): IA|BE / Actuariële departementen van universiteiten (Binnenlandse & Buitenlandse) / Actuariële Alumniverenigingen
Erkende actuariële associaties / AAE, IAA, EAA, AFIR, ASTIN, EAJ, IME… Anderen, mits akkoord ComAc
1 CPD / uur –2 CPD / uur als geslaagd voor examen
Min. 20 op 60 CPD punten
(2): Werkgevers / commerciële instellingen 1 CPD / uur Max. 30 op 60 CPD punten
Geven van Actuarieel Technische opleidingen
Zie (1) bij Deelname Actuarieel Technische opleidingen 2 CPD/uur
Zie (2) bij Deelname Actuarieel Technische opleidingen 1 CPD/uur
(3) E-learning Ad hoc toekenning

IA|BE – General Assembly – 10 – 13/09/2018
CPD (vanaf 1/1/2019)
Volgen van NIET-Technische opleidingen – Max. 10 op heel de categorie
Informaticatools, management skills, kennis van de markt, kennis van relevante wetgeving, …
IA|BE 1 CPD / uur
Others 0.25 CPD / uur
Volgen van opleidingen m.b.t. professionele vaardigheden – Max 10 op heel de categorie
Kennis van ethische, deontologische en professionele normen, …
IA|BE 1 CPD / uur
Others 0.25 CPD / uur
Afleggen van een test met betrekking tot bovenstaande kennis
1 CPD / uur

IA|BE – General Assembly – 11 – 13/09/2018
CPD (vanaf 1/1/2019)
Comité’s en werkgroepen – Max 20 op heel categorie
Technische WG (IA|BE,AAE en IAA) 1 CPD/uur –
Andere technische WG (Assuralia, PensioPlus) 0,5 CPD
Comité’s IA|BE, AAE en IAA
Voorzitter van bovenstaande WG + comité’s
0,5 CPD/uur
# CPD punten x 2
Vorming Actuariële studenten – Max 20 op heel categorie
Begeleiding Bedrijfsstage student actuariaatBegeleiding Meesterproef /Dissertatie binnen onderneming (student actuariaat)Begeleiding Meesterproef/Dissertatie binnen onderneming over actuarieel relevant onderwerp (andere studenten)
5 CPD10 CPD
5 CPD
Lezer masterproeven/ dissertatie IA|BE Prijs / Erkende universitaire instellingen
Lid jury IA|BE prijs / Erkende universitaire instellingen
2 CPD
3 CPD
Andere - Max 20
Publicatie wetenschappelijk artikel Ad hoc - Max 10 CPD / artikel
IA|BE – General Assembly – 12 – 13/09/2018
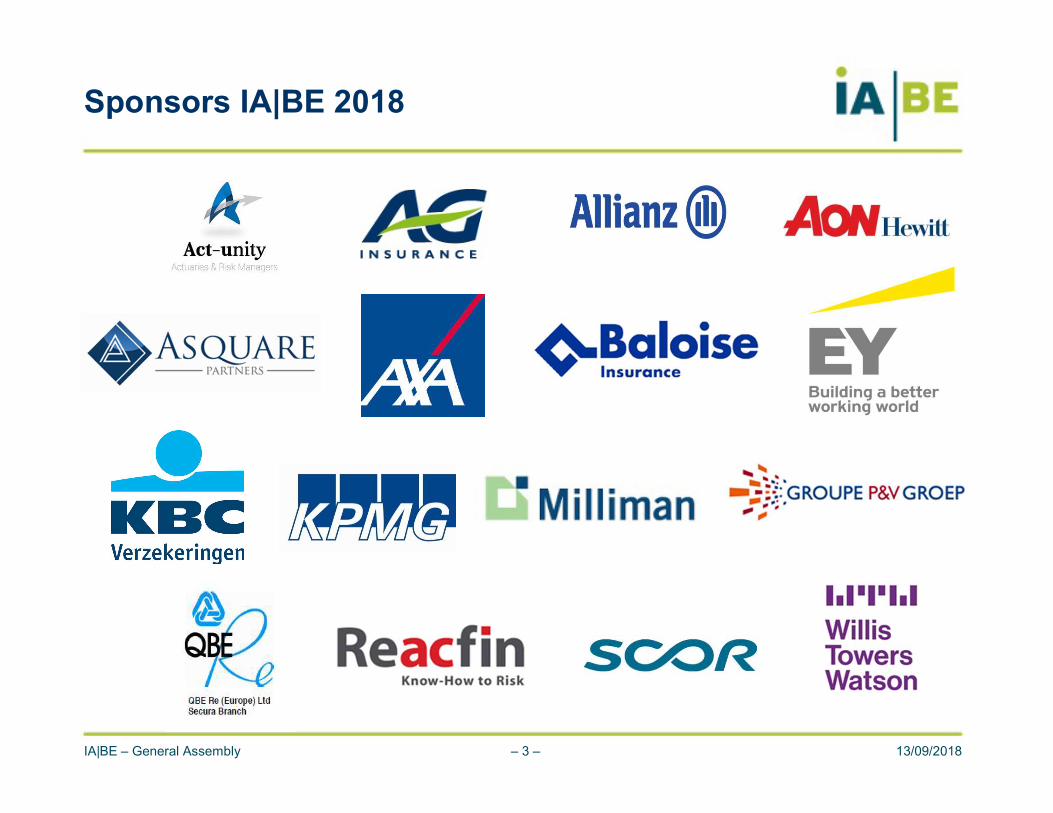
CPD (vanaf 1/1/2019)
Het nieuwe CPD systeem bevat meer dan alleen het puntensysteem:
• Accreditatie aspecten• Evaluatie periode

IA|BE – General Assembly – 13 – 13/09/2018
Olav Jones
“Solvency II, two years on”

14
General Assembly of the IA|BE
Solvency II, two years on

Presentation
Olav Jones
Deputy director general
Insurance Europe
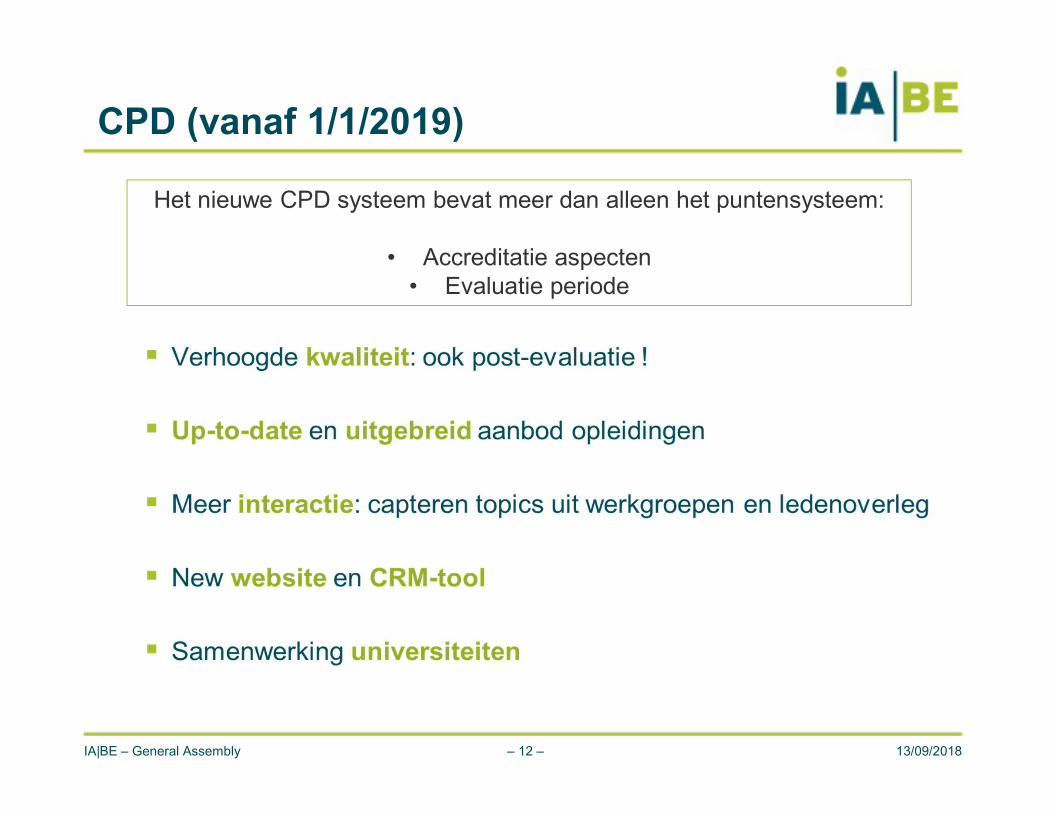
Agenda
16
Successful launch
Impact survey
Concerns about excessive capital
Case studies
Solvency II reviews
1
2
3
4
5
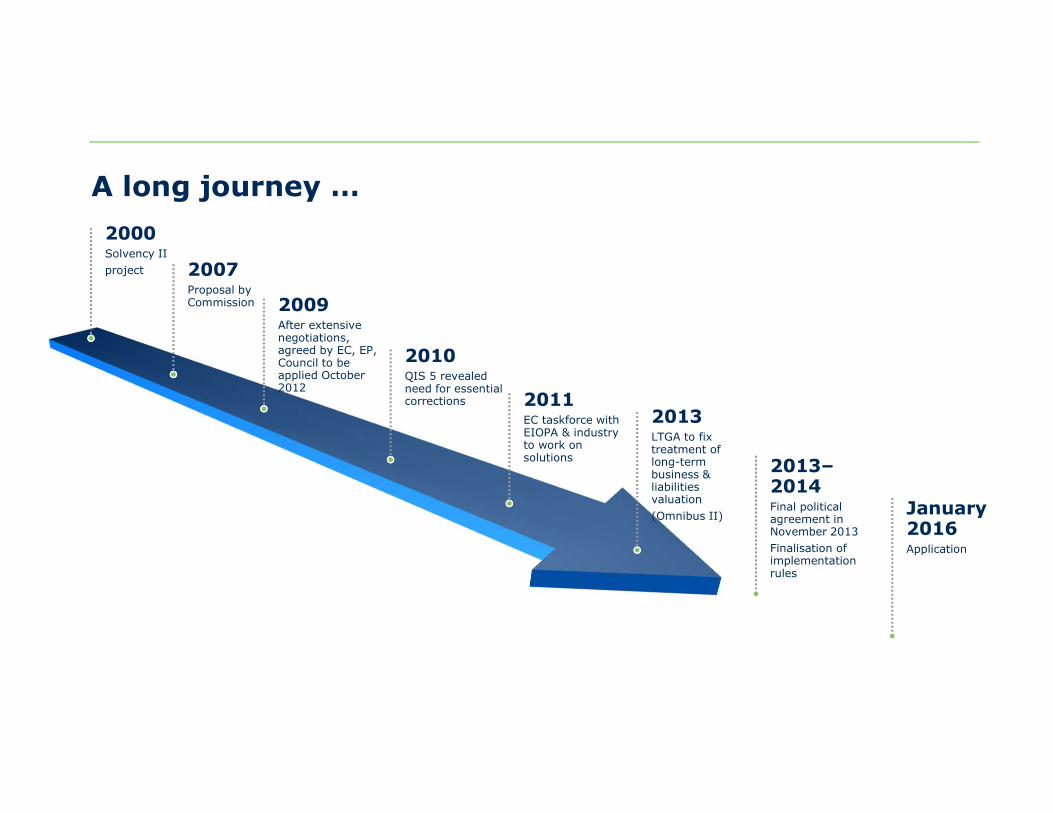
A long journey …
2000Solvency II project 2007
Proposal by Commission 2009
After extensive negotiations, agreed by EC, EP, Council to be applied October 2012
2010QIS 5 revealed need for essential corrections 2011
EC taskforce with EIOPA & industry to work on solutions
2013LTGA to fix treatment of long-term business & liabilities valuation(Omnibus II)
2013–2014Final political agreement in November 2013Finalisation of implementation rules
January 2016Application

A long journey … and it is not over yet
18
Application of Solvency II
(January 2016) Infrastructure
(April 2016)
STS securitisations
(June 2016)2018 review (Level 2)
(December 2018)EC fitness check on supervisory reporting
(December 2019) 2020 review (Levels 1+2)
(December 2020)

Huge implementation challenge
19
Revolution not evolution
3000 companies with €10trn of assets
Sophisticated modelling required even for standard formula users
3500+ pages of requirements
184 reporting templates

Successful implementation was not by chance
Industry already:
very strongly capitalised
with risk management as core focus
with widespread development of ERM & economic capital concepts
Significant preparation over many years:
helped by many QISs
very significant efforts by industry, national supervisors & EIOPA
huge investment
20

World-class frameworkThree pillars
Group & solo measures
Economic valuation of assets & liabilities
Best estimates of liabilities
All risks (28 in standard formula)
Most risks use scenario (stress test) approach
Internal models allowed
Two levels of capital (SCR & MCR) allowing early supervisory intervention
Strong & clear target level of protection: 99.5%
Significant testing & transitional measures
21

Some improvements still needed
Specific technical issues/calibrations
Proportionality
Treatment of long-term business

Agenda
23
Successful launch
Impact survey
Concerns about excessive capital
Case studies
Solvency II reviews
1
2
3
4
5

Positive impacts
24
% of respondents reporting improvements due to Solvency II
0% 20% 40% 60% 80% 100%
Any other benefits
Internal models
Harmonisation
ALM
Data quality
Risk management/governance

Unintended consequences
25
58%
“SII contributed to negative impact on guarantee business”
48%
“We invested less than optimally in real economy due to SII capital requirements”

Unintended consequences
26
“Increased SII requirements would make investment strategies for clients too conservative if they have guarantees”
“SII has led to a stronger focus on capital light products”
“The current offer of guaranteed capital products will not be sustainable … strategic plan envisages the gradual decline in the supply of guaranteed products with the growth of unit-linked products”
“We have prioritised the sales of unit-linked business with low capital requirements compared to other guaranteed products”

Agenda
27
Successful launch
Impact survey
Concerns about excessive capital
Case studies
Solvency II reviews
1
2
3
4
5
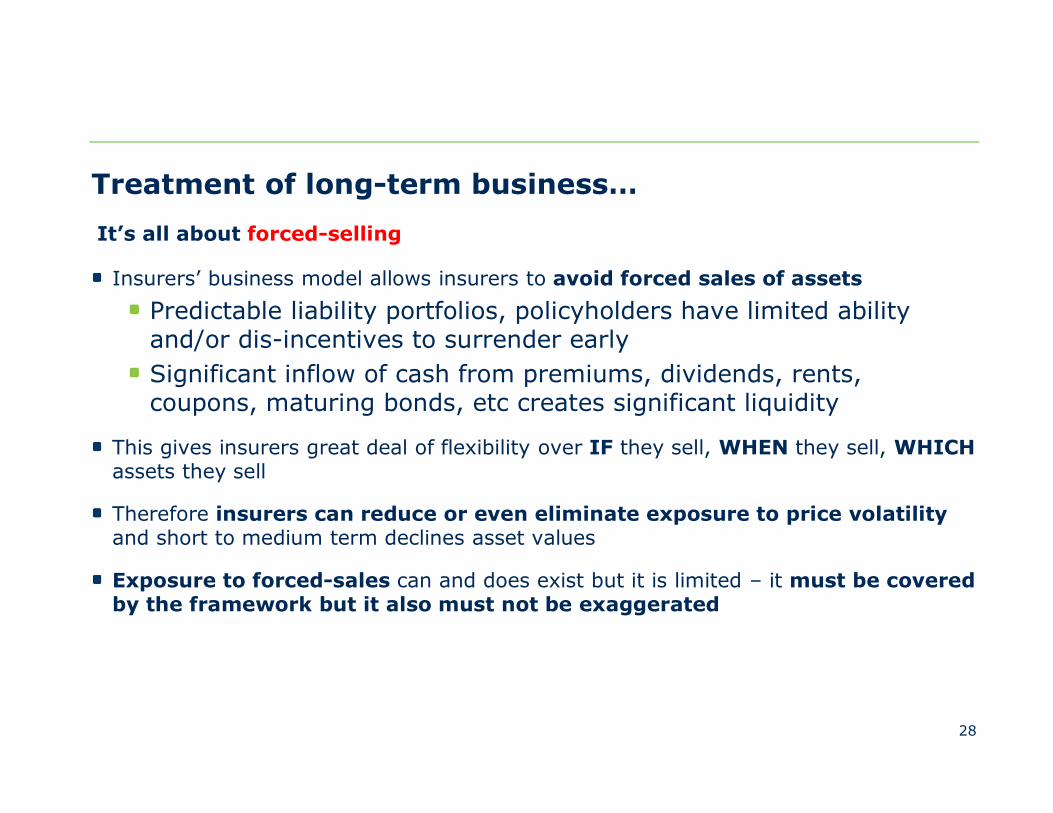
Insurers’ business model allows insurers to avoid forced sales of assets
Predictable liability portfolios, policyholders have limited ability and/or dis-incentives to surrender earlySignificant inflow of cash from premiums, dividends, rents, coupons, maturing bonds, etc creates significant liquidity
This gives insurers great deal of flexibility over IF they sell, WHEN they sell, WHICHassets they sell
Therefore insurers can reduce or even eliminate exposure to price volatility and short to medium term declines asset values
Exposure to forced-sales can and does exist but it is limited – it must be covered by the framework but it also must not be exaggerated
28
It’s all about forced-selling
Treatment of long-term business…

It is NOT about defining certain assets as long-term (e.g. asset must be of duration > 3 or 5 or 10 years, or asset must not be traded) and calibrating only these in a different way
It is about how the nature of the liabilities can allow the insurer to avoid forced-selling of the assets
Insurers can hold individual assets to maturity or long-term – but that does not mean they do or should always do in practice
There are good reasons for not doing so (changes in liability, concerns about individual performance/risks relating to individual assets or sectors, better opportunities for returns/diversification from other assets sectors)
In fact the insurer has a duty to customers/shareholders to obtain the best returns from their investments
The flexibility to choose whether to sell, what to sell and when to sell is a key benefit of the insurance business model
29
It’s all about forced-selling
Treatment of long-term business…

Three causes
30
Regulatory Technical provisions
(Amount needed to cover payment of claims and other
liabilities)
1. Liabilities exaggerated
Illustrative not to scale

Three causes
31
Amount needed to cover payment of claims and other
liabilities
Illustrative not to scale
1. Liabilities exaggerated
• Discounting close to risk free• Risk Margin

Three causes
32
Regulatory Technical provisions
(Amount needed to cover payment of claims and other
liabilities)
Company target Solvency buffer
Company surplus
1. Liabilities exaggerated• Risk Margin• Discounting close to risk free
3. Artificial volatility• Larger buffers than necessary
2. Excessive SCR requirements • Wrongly based on “trading risk”
instead of “long-term investment risk”
Total amount needed by SII
can be excessive
Regulatory SolvencyCapital
Requirement(SCR)
Illustrative not to scale

Agenda
33
Successful launch
Impact survey
Concerns about excessive capital
Case studies
Solvency II reviews
1
2
3
4
5

34
Long-term risk ≠ trading
Long-term investment ≠ trading

Importance of measuring risk correctly
35
Trader can be forced to sell entire portfolio after worst-case, 1-year price fall
Insurer can invest for 10 years and get dividends
Insurer can invest for 10 years, get dividends and use pooling/smoothing, diversifying across customers/time
1
2
3
-43%
-26%
+9%
1-in-200 outcome
Equity example
Analysis based on 100 years of US stock market data

Credit example
Importance of measuring risk correctly
36
Forced sales COULD NOT be avoided so exposure to losses was on price drops caused by spread changes which were
very high
Forced sales COULD be avoided so exposure to losses was on actual
defaults which were very low
Long-term investor losses
Short-term investor (“Trader”) losses
0.2% losses*
30% losses**
Losses during financial crisis (2007-2008)Example for AA corporate bond portfolio
* Assumes a 50% recovery rate. Actual defaults were about 0.4% in 2008** Assumes a long-term bond portfolio

Excessive capital requirements
37
Simple, long-term product with guarantee€10,000 single premiumFully matched (no interest rate risk)Standard Formula and Volatility AdjustmentOnly invested in A-rated corporate bonds Risk Margin = 40% of SCR in line with EU average for life companies
CASE STUDY

Total additional amount shareholders need to inject
Preliminary analysis
1 Risk-free rate is 0.50% Credit spread is 1.25%Volatility adjustment is 0.04% (Dec. 2017)Charges are 0.50%
0%
5%
10%
15%
20%
25%
30%
35%
40%
Guaranteed product
Volatilitybuffer
Solvencycapitalrequirement(SCR)
Risk Margin
1

Total additional amount shareholders need to inject
Preliminary analysis
1 Risk-free rate is 0.50% Credit spread is 1.25%Volatility adjustment is 0.04%(Dec. 2017)Charges are 0.50%
0%
5%
10%
15%
20%
25%
30%
35%
40%
Guaranteedproduct
Guaranteedproduct
(Solvency I)
Correct capitalrequirements
Volatility buffer
Solvency capitalrequirement(SCR)Risk Margin
1

Unnecessarily high capital = unnecessary impact
40
Too highsolvency capital
and/or
Higher premiums
or charges
Lower benefits paid
Fewer products available
Less optimal long-term
investmente.g. equities
Procyclical behaviour
and/or

Solvency II = shifting the risks on to individuals
41
RISK
INSURANCE COMPANY

Further work needed
42
Industry, academics, supervisors and regulators need to work together to fully understand different measures & their impact
Examine improvements:
VA/MA/dynamic VA/Country adjustments
Risk Margin
SCR for investments
Test against different products & market conditions

Agenda
43
Successful launch
Impact survey
Concerns about excessive capital
Case studies
Solvency II reviews
1
2
3
4
5

A long journey … and it is not over yet
44
Application of Solvency II
(January 2016) Infrastructure
(April 2016)
STS securitisations
(June 2016)2018 review (Level 2)
(December 2018)EC fitness check on supervisory reporting
(December 2019) 2020 review (Levels 1+2)
(December 2020)

EC action can make a difference
45
% of respondents who said EC action has had/would have positiveimpact on investment
3%
16%
29%
36%
43%
43%
0% 10% 20% 30% 40% 50%
ELTIFs
STS securitisation
Unlisted equity
Unrated debt
Infrastructure
Long-term equity

On the path to improvement
46
Solvency II doesn’t reflect long-term
business
PROBLEMSSOLUTIONSSOLUTIONS
Proportionality/
reporting
Other technical issues
Infrastructure
STS securitisations
Capital Markets Union
Equity (unlisted and listed)
Unrated debt
2018 review
Risk Margin — cost of capital
Simplifications
Address flaws/inconsistencies
Other long-term investments
2020 review
Risk Margin
Discount rates (MA, VA, etc.)
Streamlining
Address flaws/inconsistencies

IA|BE – General Assembly – 47 – 13/09/2018
Fabian de Bilderling
Night of the Actuaries 2018

IA|BE – General Assembly – 48 – 13/09/2018
Assemblée Générale -Algemene Vergadering
Jean-François Hannosset

IA|BE – General Assembly – 49 – 13/09/2018
Cocktail
![Presentatie Geothermie 12 maart 2019 .pptx [Alleen-lezen]Microsoft PowerPoint - Presentatie Geothermie 12 maart 2019_.pptx [Alleen-lezen] Author: Z026198 Created Date: 3/13/2019 2:04:07](https://img.dokumen.tips/doc/110x75/5fcefaf5cae02647b819b9d5/presentatie-geothermie-12-maart-2019-pptx-alleen-lezen-microsoft-powerpoint-.jpg)


![[MS-PPTX]: PowerPoint (.pptx) Extensions to the Office ...interoperability.blob.core.windows.net/files/MS-PPTX/[MS-PPTX... · 1 / 76 [MS-PPTX] — v20140428 PowerPoint (.pptx) Extensions](https://img.dokumen.tips/doc/110x75/5ae7f6357f8b9a6d4f8ed3b3/ms-pptx-powerpoint-pptx-extensions-to-the-office-ms-pptx1-76-ms-pptx.jpg)