Embed Size (px)
Citation preview

Seguimiento en alto
riesgo
GonzaloTabares
Mastólogo
CEMA
Hospital Centenario Rosario
14 de septiembre de 2019
XVII CURSO BIANUAL DE LA SOCIEDAD DE PATOLOGÍA
MAMARIA 2019

Criterios
• A quien?
• Con que?
• Desde cuando?

Prevención secundaria?
Población de alto riesgo definida por • Historia familiar y reproductiva
• Patología
• Densidad mamográfica
• RT mediastino entre los 10-30 años
• Estudio genético
A partir de que nivel de riesgo
Con que metodología?
Desde cuando?

Cuestión de umbrales
• 20-30% de riesgo (USA-UK)
• Desde 30-35 años ó
• 10 años antes del diagnóstico mas
temprano

Seguimiento
RMI en riesgo moderado/alto estudios incluidos en revision ACS
Promedio de pacientes incluidas con test BRCA +: 15-20%
Holanda Canada UK Alemania US Italia
Nº Mujeres 1909 236 649 529 390 105
Edad 25-70 25-65 35-49 >30 >25 >25
Sensibilidad
RMI
Sx
Eco
80
33
--
77
36
33
77
40
--
91
33
40
100
25
--
100
16
16
ACS- Ca C Journal Clin 2007

Seguimiento – imágenes
• Los estudios incluyeron pacientes de alto riesgo por historia familiar
• 15% BRCA+
• La modalidad dual (RMI+mamografia):
Se demostró como la mas efectiva
La ecografia no aporto mayor tasa de detección
La alternancia no fue evaluada (cada 6 meses)
Cuanto tiempo?: no esta claro por el momento

Tamizaje con RMI en alto riesgo
Definido por:
• Historia familiar
• Variantes patogénicas en BRCA
• NO estudiado en alto riesgo por patología benigna (HA)
(HA hiperplasia atípica)

RMI como único estudio en ARF?
Kuhl JCO 2009 – EVA TRIAL
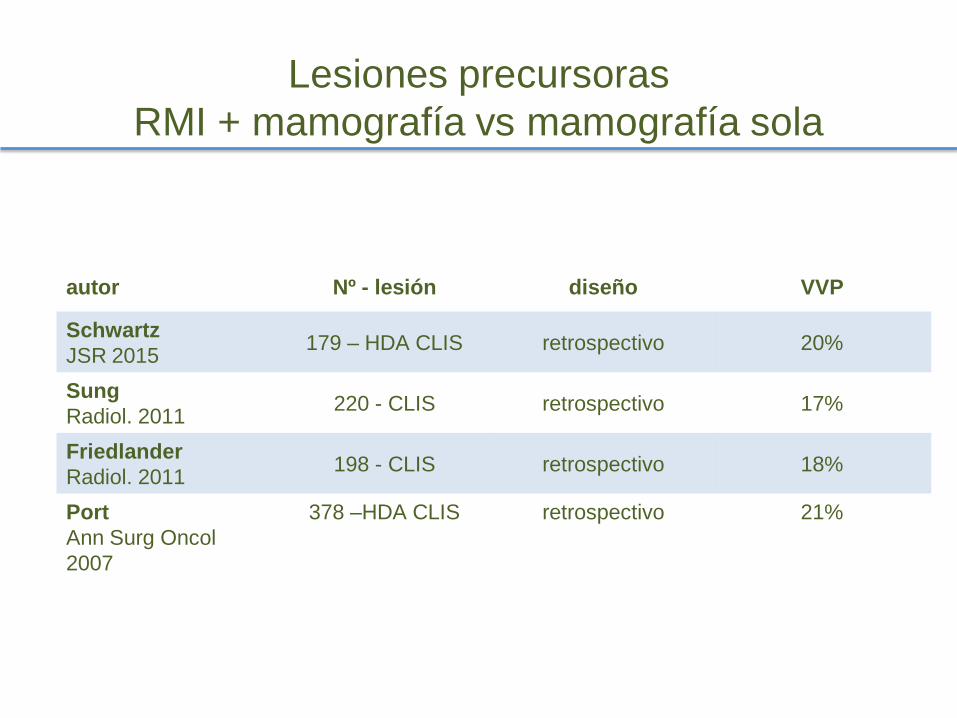
Lesiones precursoras
RMI + mamografía vs mamografía sola
autor Nº - lesión diseño VVP
Schwartz
JSR 2015 179 – HDA CLIS retrospectivo 20%
Sung
Radiol. 2011 220 - CLIS retrospectivo 17%
Friedlander
Radiol. 2011 198 - CLIS retrospectivo 18%
Port
Ann Surg Oncol
2007
378 –HDA CLIS retrospectivo 21%

RT por linfomas : riesgo acumulado/edad al tratamiento
De Broin JCO 2009

RMI (otra vez):
(RT en linfoma juvenil)
Hodson JNCI 2016
MODELO MATEMATICO teorico

COMO Y DESDE CUANDO LOS
CONTROLES?
BRCA

Protocolo de seguimiento
• RMI desde 25 años
• RMI + senog. Desde los 30
• Eco TV desde los 30 años

COMO Y DESDE CUANDO LOS
CONTROLES?
Riesgo moderado, definido por test genético:

Estratos de riesgo
• Promedio - Moderado - Alto riesgo
• Parámetros:
• Riesgo absoluto (20-30-50%)
• Edad promedio de cáncer según el gen
afectado
• Edad de la paciente

Población general - mamografia:
AGENCIA
ACS US prev Task F INC
INICIO 45 50 50
INTERVALO anual bianual bianual
FINAL Espectat <10 75 ?
ACS: Am. Cancer Society -INC: Ins Nac Cáncer

“Umbral de riesgo”
• Inicio de controles es a los 45-50 años en
población general:
• Riesgo a 5 años: 1%
• Cuando se llega al umbral del 1% en 5
años en genes de riesgo moderado?
TungN Nat Rev Clin Oncol 2016

SENOGRAFIA - RMI - inicio
SENOG/RMI edad de inicio
PALB2 30
CHEK2 35
ATM 35
BARD1 40
RAD51D* 40*
CHEK2 missense (SIN HF) Nunca!?
NF1 35 (50 suspender RMI)
Se alcanza umbral del 1% a 5 años para iniciar controles
Robson SABCS 2015 Tung Nature Rev Clin Oncol 2016

RIESGO CÁNCER
SUBSIGUIENTE
Paciente con cáncer de mama?
Es un individuo de alto riesgo?

Cáncer contralateral
Evento cada vez mas INFRECUENTE
Nicholls JCO 2011
!
Age-Specific IR for CBC
Age-specificratesfor CBCoverall werenot constant but instead
showed early and late incidencepeaksnear ages30 and 70 years,
respectively(Fig2C).CBCIRper 100woman-yearswere0.81(95%
CI,0.7to0.9),0.48(95%CI,0.4to0.5),and0.63(95%CI,0.6to0.7)
nearages30,45,and70years,respectively.Theoverall 22%declinein
CBCratesfromage30to70correspondstoa0.5%dropinincidence
witheachyearlyincreaseof ageat thefirst breast cancer diagnosis.A
similar bimodal pattern wasobserved after an ER-positivebut not
ER-negativebreast cancer (Fig2D).
Theage-specificratesshowninFigure2areaveragedacrossall
timeperiods. Estimatedcurrent CBCrates(per 100/year) after first
breast cancersdiagnosed between 2001 and 2005 arepresented in
Table2.EstimatedcurrentCBCratesafteranER-positivecancerwere:
0.45fordiagnosesbeforeage30yearsand0.25to0.37fordiagnosesat
age30yearsorolder (Table2).RatesafteranER-negativecancerwere
higher:1.26beforeage30years,0.85atage30to35years,and0.45to
0.64for diagnosesat age40or older.
Sensitivity Analyses
EAPCforCBCwasattenuatedbutnotalteredqualitativelyif the
CBCwasexpanded to includein situ tumors(EAPC, 1.30%per
year;95%CI, 1.5to 1.1).Resultsalsodidnot changemateriallyif
thecutoff periodfor CBCwasreducedfrom12to6months(EAPC,
1.92%per year;95%CI, 2.2to 1.7) or expandedfrom12to24
months(EAPC, 1.79%per year; 95%CI, 2.1to 1.5) after the
BA
CBC after first
breast cancer
1975–2005Haza
rd R
ate
(%
per ye
ar)
Year of Diagnosis for First Breast Cancer
1.0
0.8
0.6
0.4
0.2
01980 1990 2000
CBC after first ER positi ve breast cancer
CBC after first ER negative breast cancer
1990–2005
Haza
rd R
ate
(%
per ye
ar)
Year of Diagnosis for First Breast Cancer
1.0
0.8
0.6
0.4
0.2
01980 1990 2000
DC
CBC after first
breast cancer
1975–2005
Haza
rd R
ate
(%
per ye
ar)
Age of Diagnosis for First Breast Cancer
1.0
0.8
0.6
0.4
0.2
030 40 50 60 70 80 30 40 50 60 70 80
CBC after first ER
positive breast cancer
CBC after first ER
negative breast cancer
1990–2005
Haza
rd R
ate
(%
per ye
ar)
Age of Diagnosis for First Breast Cancer
1.0
0.8
0.6
0.4
0.2
0
1985
EAPC = -3.07%/yr (95% CI, -3.5 to -2.7)
EAPC = 0.27%/yr (range, -0.4 to 0.9)
EAPC = 1.68%/yr (95% CI, 0.0 to 3.4)
EAPC = -3.18%/yr (range, -4.2 to -2.2)
Fig2. Annual hazard rates for contralateral breast cancer (CBC) over time and across age from 1975 to 2005 after afirst breast cancer (A,C). Annual hazard rates for
CBCover time and across age from 1990 to 2005 after afirst estrogen receptor (ER)–positive or first ER-negative breast cancer (B, D). Estimated annual percentage
change (EAPC) is the EAPCin the hazard rates per year of calendar-time.
Declining Incidence of Contralateral Breast Cancer
www.jco.org © 2011 by American Society of Clinical Oncology 1567
Downloaded from jco.ascopubs.org on June 18, 2012. For personal use only. No other uses without permission.Copyright © 2011 American Society of Clinical Oncology. All rights reserved.
Año de diagnóstico del primer cáncer
Cáncer Contralateral luego del
primer evento

Recaída local Cx conservadora 2do evento IPSILATERAL
estudio año n Recaída local
anual
NASBP( 5 estudios) 80-90s 3800 0.5%
TARGIT rama RT 2014 3400 0.26%
SOFT TEXT 2014 4690 0.19%
Anderson JCO 2009
Vaidya Lancet 2014
Pagani NEJM 2014

Riesgo menor a 0.5% anual
• Paradoja: son pacientes de AR?
• Riesgo justifica seguimiento RMI?

FUTURO?
-Uso combinado de MD y tomosíntesis
-Centellografía mamaria (sestamibi scan)
-RMI ultrarrápida

Conclusiones
• Incorporamos controles con RMI en
jóvenes portadoras : ATM CHEK2 PALB2
• “nuevos” genes de riesgo moderado:
BARD 1 - RAD51D - NF1

Conclusiones
Antecedente
preponderante Edad inicio metodología
H familiar 30-35 RMI /senografía-
tomosintesis?1-2
HDA /CLIS Desde diagnóstico SENOG/ RMI?
RT mediastino 10 años post tto RMI / Senog –
Tomosíntesis?
1: Ciatto (STORM) Lancet Oncol 2013 2: Gilbert (TOMMY) Radiology 2015
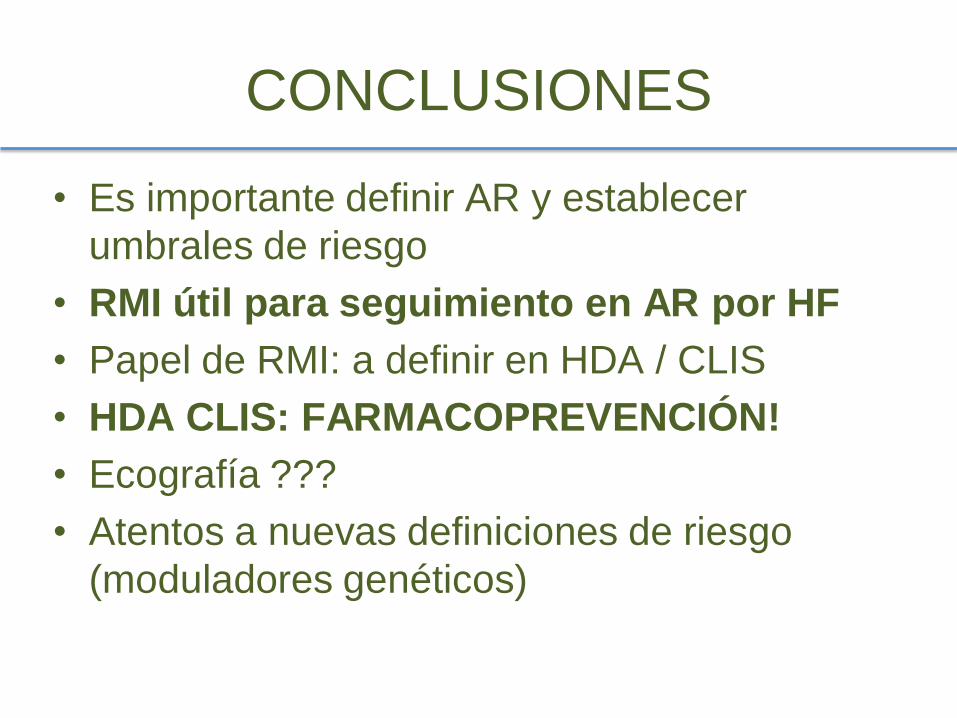
CONCLUSIONES
• Es importante definir AR y establecer
umbrales de riesgo
• RMI útil para seguimiento en AR por HF
• Papel de RMI: a definir en HDA / CLIS
• HDA CLIS: FARMACOPREVENCIÓN!
• Ecografía ???
• Atentos a nuevas definiciones de riesgo
(moduladores genéticos)