Embed Size (px)
Citation preview
PRESENCE OF UNDERSTORY SHRUBS CONSTRAINS CARBON GAIN IN SUNFLECKSBY ADVANCE-REGENERATION SEEDLINGS: EVIDENCE FROM QUERCUS RUBRA
SEEDLINGS GROWING IN UNDERSTORY FOREST PATCHES WITH ORWITHOUT EVERGREEN SHRUBS PRESENT
E. T. Nilsen,1,* T. T. Lei,y and S. W. Semonesz
*Department of Biological Sciences, Virginia Tech, Blacksburg, Virginia 24061-0406, U.S.A.; yDepartment of EnvironmentalSolution Technology, Faculty of Science and Technology, Ryukoku University, Otsu, Japan; and
zRoots Plant Care Group, Novozymes Biologicals, Salem, Virginia 24153, U.S.A.
We investigated whether dynamic photosynthesis of understory Quercus rubra L. (Fagaceae) seedlings canacclimate to the altered pattern of sunflecks in forest patches with Rhododendron maximum L. (Ericaceae), anunderstory evergreen shrub. Maximum photosynthesis (A) and total CO2 accumulated during lightflecks wasgreatest for 400-s lightflecks, intermediate for 150-s lightflecks, and lowest for 50- and 75-s lightflecks. For the 400-slightflecks only, maximum A and total CO2 accumulated were significantly lower for seedlings in forest patcheswith shrubs present (SF) than for seedlings in forest patches without shrubs (F). These effects were found onlywhen Awas calculated on a leaf-area basis because the specific leaf area of seedlings in F patches was 16% lowerthan it was for seedlings in SF patches. Photosynthesis reached 50% induction in 159 s for seedlings in F patchescompared with 226 s for seedlings in SF patches. The faster induction of A for seedlings in F patches resulted in asignificantly higher lightfleck use efficiency than for seedlings in SF patches. The inefficient use of lightflecks byQ. rubra seedlings in SF patches may be a primary mechanism by which Q. rubra seedlings are inhibited bysubcanopy thickets of R. maximum.
Keywords: dynamic photosynthesis, sunfleck responses, transient light, advance regeneration, deciduous forest,Quercus rubra, Rhododendron maximum.
Introduction
Canopy tree seedlings that are present in the understory beforeforest disturbance, referred to as advance-regeneration seedlings,replace many canopy tree species following disturbance (Dillawayet al. 2007; Frey et al. 2007; Madsen and Hahn 2008). Importantforest traits such as resilience to disturbance, productivity, andbiodiversity are significantly affected by the health and abundanceof advance-regeneration seedlings (Canham 1989; Ashton andLarson 1996). Also, advance-regeneration trees refill canopy gapscreated by the death of individual or small groups of canopy treesin many different forest ecosystems (Shure et al. 2006; Colletet al. 2008). Therefore, understanding the processes that regu-late the survival of advance-regeneration seedlings is valuablein understanding forest dynamics and appropriately managingforest resources.
Advance regeneration is inhibited by understory evergreenplants in tropical forests (Veblen 1989; Denslow et al. 1991),temperate deciduous forests (Taylor and Qin 1992; Beckageet al. 2000; Lei et al. 2002), coniferous forests (Klinka et al.1989; Messier 1993), and boreal forests (Mallik 2003). In fact,some understory evergreen species can completely preclude anycanopy tree reestablishment in the understory following large-scale disturbance to the canopy (Mitchell et al. 1997; Ito and
Hino 2004) or small canopy-gap disturbance (Beckage and Clark2003). Therefore, the influence of understory vegetation onadvance-regeneration seedlings will have significant consequencesfor forest regeneration following disturbance worldwide. Learn-ing the mechanisms by which understory vegetation inhibits ad-vance regeneration will lead to a better understanding of forestdynamics and to more effective forest management programs.
Advance-regeneration seedlings can contribute to forest struc-ture when they are released from suppression by an increase inphoton flux density (PFD) following disturbance to the forestcanopy. However, advance-regeneration seedlings can respondto disturbance only if they can survive and persist in the under-story before the disturbance occurs. Recruitment and persis-tence of canopy tree seedlings into the advance-regenerationpool can depend on the relationship between resource availabil-ity in the forest understory and physiological and structuraltraits of the seedlings (Walters and Reich 1996). Resources suchas light, nutrients, and water can be limiting and are spatiallyand temporally heterogeneous in the forest understory. Hence,the ability of advance-regeneration seedlings to alter their physi-ological traits among microsites that have different patterns ofresource availability will help the seedlings persist in the under-story (Runkle 1990; Royo and Carson 2006).
Spatial and temporal availability of PFD, nutrients, and wa-ter depend on a complex relationship among soil parent mate-rial, topography, climate, disturbance, and biotic factors (Abeet al. 2002; Griscom and Ashton 2003; Boerner 2006). In par-
1 Author for correspondence; e-mail: [email protected].
Manuscript received November 2008; revised manuscript received March 2009.
735
Int. J. Plant Sci. 170(6):735–747. 2009.
� 2009 by The University of Chicago. All rights reserved.
1058-5893/2009/17006-0004$15.00 DOI: 10.1086/599240
ticular, the PFD and its heterogeneity in understory patches oftemperate forest are contingent on the composition of tree andshrub canopies over the patches (Messier et al. 1989; Nilsenet al. 2001; Lei et al. 2002, 2006). Patches with both canopytrees and understory evergreen shrubs can result in as little as1% of full-sun PFD reaching the height of advance-regenerationseedlings (Nakashizuka 1987; Kelly and Canham 1992; Georgeand Bazzaz 1999; Aubin et al. 2000; Lei et al. 2002). Moreover,the frequency, duration, and intensity of transient periods ofhigh light (sunflecks) may be less in understory patches withtrees and understory evergreen shrubs compared with those inforest patches with canopy trees but no understory evergreenshrubs (Nilsen et al. 2001; Beier et al. 2005; Lei et al. 2006).
The availability of belowground resources in different patchescould influence the efficiency of utilizing transient high light (dy-namic photosynthesis) by advance-regeneration seedlings. Nutri-ent availability in forest soils is heterogeneous (Jackson andCaldwell 1993; Gross et al. 1995; Gallardo 2003; Messaoudand Houle 2006). Moreover, understory shrubs in mature foreststands reduce nutrient resource availability (Nilsen et al. 2001;Beier et al. 2005; Royo and Carson 2006; Wurzburger and Hen-drick 2006), which creates some of the heterogeneity of nutrientavailability among understory patches. Soils in locations with ev-ergreen shrubs in the understory often have a lower soil pH, alower cation availability, a lower available nitrogen, a highercarbon-to-nitrogen ratio, and a higher concentration of alumi-num and iron ions (Monk et al. 1985; Nilsen et al. 2001; Beieret al. 2005) than do soils in forest locations without shrubs. Inaddition, water availability in the seedling rooting zone can belower in sites with understory shrubs than in sites without under-story shrubs (Nilsen et al. 2001), although this is not consistentlytrue (Clinton 2003). Therefore, the presence of understory shrubsin a forest patch is associated with both reduced belowgroundnutrient availability and reduced PFD compared with forestpatches without understory evergreen shrubs.
In previous research at our research site, we have determinedthe negative influence of subcanopy thickets of Rhododendronmaximum L. (Ericaceae) on nutrients (Beier et al. 2005) andPFD (Lei et al. 2006). The objective of this research project wasto evaluate dynamic photosynthetic responses to heterogeneouslight (sunflecks) for seedlings in patches that differed in the pres-ence of understory evergreen shrubs. On the basis of our previ-ous research at the same location, we predicted that Quercusrubra L. (Fagaceae) seedlings growing in patches without under-story evergreen shrubs would utilize transient high PFD moreefficiently than seedlings growing in patches where understoryevergreen shrubs are present. Seedlings that do not use dynamiclight efficiently are not likely to persist in the understory (Chaz-don 1988). Therefore, we propose that shrubs in the understoryinhibit advance-regeneration seedlings by impairing the abilityof seedlings to utilize dynamic light in the understory. On thebasis of this proposal, we formulated the following hypotheses.
1. The response of maximum CO2 assimilation (A) and to-tal CO2 gain per leaf area to increasing intensity and durationof PFD during transient periods of high light (lightflecks) isgreater for seedlings growing in patches without understoryevergreen shrubs present (F) compared with seedlings growingin patches with understory evergreen shrubs present (SF).
2. Seedlings growing in F patches have a more rapid in-crease in induction state (IS), which results in higher light-
fleck use efficiency (LUE), compared with seedlings growingin SF patches.
3. As total PFD of a forest patch increases (on the basis ofweighted canopy openness [WCO]), the total carbon gain perleaf area during transient light will be greater for seedlings inF patches compared with seedlings in SF patches.
We focus on dynamic photosynthesis because efficient use ofdynamic light is crucial for carbon gain and survival of under-story seedlings (Pearcy et al. 1987; Chazdon 1988; Montgomeryand Givnish 2008). Our goal was to understand the effects ofdifferent forest patch types on advance-regeneration seedling re-sponse to non–steady state PFD. The systems we selected werenaturally occurring and artificially planted Q. rubra seedlingsgrowing in a deciduous forest with or without patches of R.maximum L. in the understory. We selected Q. rubra as our ex-ample of an advance-regeneration species because it is the mostimportant component of advance regeneration in the southernAppalachian forest (Monk et al. 1985; Beckage and Clark 2003).We selected R. maximum as our understory shrub because itis the most abundant evergreen shrub in the southern Appa-lachian forest (Elliott et al. 1999).
Material and Methods
Study Species and Sites
This study was conducted at Coweeta Hydrologic Labora-tory, a 2185-ha U.S. Forest Service experimental station that isa member site of the Long Term Ecological Research (LTER)network. The basin is located in the Nantahala Mountains ofthe Blue Ridge Mountain physiographic province near Otto,North Carolina (lat. 35�029N, long. 83�249W). Vegetation hasbeen described as including northern hardwood, cove hard-wood, oak, and oak-pine communities (Day et al. 1988). Eleva-tions range from 675 to 1592 m. Yearly average precipitation is1800 mm at the base climate station, and it increases with ele-vation to >2200 mm (Swank and Crossley 1988; Yeakley et al.1998). High moisture levels and mild temperatures, which arecharacteristic of the basin, place Coweeta in the marine, humid,temperate category of Koppen’s climatic classification scheme.The study site selected was a mature, mixed-hardwood forestlocated on a north-facing slope at an elevation of 1000 m.Patches of Rhododendron maximum shrubs are found in theunderstory throughout the site. Dominant tree species at oursite include mature reproductive Quercus rubra.
Quercus rubra, northern red oak, is a large (18.3–24.4 m inheight) deciduous canopy tree in the eastern deciduous forest ofthe northeast and north central United States. Northern red oakoccurs in mixed forests at low to moderate elevations. It can bea dominant forest tree, but usually Q. rubra grows in associa-tion with other codominant trees of the southeastern mixed for-est. In Coweeta Hydrologic lab, Q. rubra is common at middleelevations on north- and east-facing slopes (Elliott and Swank2008). Acorns are dropped in the fall and germinate the follow-ing spring (Garcia and Houle 2005). Seedlings of Q. rubra arescattered in the understory and have relatively high survivor-ship in comparison with seedlings of other important canopytrees (Elliott et al. 1999; Beckage and Clark 2003).
Experiment 1: photosynthetic response to lightfleck dura-tion and intensity. We identified all regions of the research
736 INTERNATIONAL JOURNAL OF PLANT SCIENCES

site with the same aspect (northeast) and slope (26�). Six loca-tions were randomly selected from the identified regions, andone 25 3 25-m plot was installed in each of the six locations.Three of the plots did not have understory evergreen shrubspresent (F patches), and three plots were located where under-story evergreen shrubs were present (SF patches). In each plot,15 2 3 2-m experimental subplots were placed in a regular de-sign, with a 2-m buffer around each subplot.
Quercus rubra acorns were collected from parent trees in thevicinity of the study site and subsequently cold stratified for 3 mo.In March of 1998, 15 randomly chosen Q. rubra acorns were di-rectly planted in each subplot. Emerged seedlings were tagged andutilized for growth analysis (Lei et al. 2002) and gas exchange(Lei et al. 2006). The second year after planting acorns, 72 Q. ru-bra seedlings were randomly selected from F subplots, and 72were selected from SF subplots. All leaves used were those thatwere produced on seedlings in May 1999, and they were fully ma-ture when photosynthetic measurements were taken (June–July).
Each Q. rubra seedling was assigned one of three lightfleckintensities (PFD ¼ 100, 500, or 1000 mmol m�2 s�1) and oneof four lightfleck durations (50, 75, 150, or 400 s). Thesevalues were selected to represent the range of maximum PFDand the duration of many sunflecks at these plots, as previ-ously reported (Lei et al. 2002, 2006). Each lightfleck dura-tion and intensity were replicated six times for a total of 144analyses (two forest patch types 3 three PFD intensities 3
four lightfleck durations 3 six replicate seedlings ¼ 144 light-fleck simulations).
Lightflecks were created and net photosynthesis (A) of seed-ling leaves was measured using a portable gas-exchange systemfitted with an LED light source (model 6400; LI-COR, Lin-coln, NE). An internal program was coded in the gas-exchangesystem to create lightflecks by the LED source and to analyzegas-exchange response to lightfleck conditions. No correctionfor the response time of the gas-exchange system to transientlight was necessary because the response of this gas-exchangesystem is fast enough for determining IS and LUE for light-flecks of 50–300 s. Carbon dioxide concentration within theleaf chamber (Ca) was set to 390 ppm CO2 using an externalCO2 source assembly (model 6400-01, LI-COR). Relative hu-midity of the leaf chamber and vapor pressure deficit weremaintained within 1% over the duration of the simulation bymanually adjusting the system flow rate through the desiccant.Leaves were exposed to PFD ¼ 10 mmol m�2 s�1 light (a com-mon diffuse radiation value in the understory) for 600 s beforeeach lightfleck. Each lightfleck response recording consisted of(1) the final 120 s of the preliminary exposure to PFD ¼ 10mmol m�2 s�1 and (2) a transient high-PFD period (lightfleck)of a randomly selected maximum PFD value (100, 500, or1000 mmol m�2 s�1) and duration (50, 75, 150, or 400 s), fol-lowed by (3) 120 s at PFD ¼ 10 mmol m�2 s�1. Net photosyn-thetic rate (A) was logged every 2 s during the entire lightfleckresponse recording. Total CO2 uptake from the lightfleck þ120 s at 10 mmol m�2 s�1 following the lightfleck was deter-mined for all measured leaves. A second batch of 144 seed-lings was randomly selected for the same analysis as describedfor experiment 1, except these seedlings were dark adaptedovernight before the initiation of the lightfleck protocols.
In the late summer, after all gas-exchange measurements werecomplete, 15 seedlings from each plot (one per subplot, includ-
ing some of the seedlings used for gas-exchange measurements)were harvested and separated into leaves, stems, and roots. Wemeasured the following parameters: (1) seedling height, (2) totalleaf area, (3) total leaf dry mass, (4) specific leaf area (SLA), (5)total root mass, and (6) total plant mass.
Experiment 2: IS and LUE. We selected different researchsites for our second experiment. Paired sites (20 pairs) wererandomly chosen in the broader region of our research regionsuch that in one part of each paired site there were no under-story evergreen shrubs present (F) and in another part of thesame paired site there were understory evergreen shrubs present(SF). Paired sites were selected so they were at least 20 m apartfrom each other and possessed naturally regenerating Q. rubraseedlings. Five even-sized Q. rubra seedlings, located at least 10m apart from each other, were randomly assigned for measure-ments in the two designated parts of each paired site. Of thefive assigned seedlings, three were randomly selected for light-fleck simulations, giving a sample size of 60 seedlings (i.e., threein each of 10 F patches and three in each of 10 SF patches).
The availability of PFD above each subject seedling was esti-mated using hemispherical canopy photography. Photographswere taken at a height of 0.5 m using a leveled Nikon 8-mm fish-eye lens (180� field of view) mounted on a Nikon F3HP body di-rectly above each seedling used for lightfleck simulations. Thelens was fitted with a compass for indicating magnetic north. Ahigh-contrast black-and-white film (ASA 400, Tri X; EastmanKodak, Rochester, NY) and a red built-in filter were used for tak-ing pictures with enhanced contrast. Black-and-white negativeswere digitized using a slide scanner (Polaroid SprintScan 35 ES)and saved as bitmap files until they were analyzed. Canopy photoswere analyzed using FEW4.0 (Lei et al. 2006) to obtain WCO,an index that represents light availability to seedlings and thatweights canopy gaps above the seedling higher than those closeto the horizon (Chazdon and Field 1987).
All gas-exchange measurements were performed on recentlymature leaves of the subject seedlings during June–July 2000. Arepetition of eight identical lightflecks was used to ensure thatcomplete photosynthetic activation was attained during theanalysis without photoinhibition. Following exposure to low-intensity light (PFD ¼ 10 mmol m�2 s�1) for 600 s, leaves wereexposed to a sequence of eight replicate lightflecks. This light-fleck duration is representative of that which commonly occursin the forest understory of this region. Each lightfleck simulationin the series consisted of (1) 60 s at low PFD (10 mmol m�2
s�1), (2) 90 s at high PFD (500 mmol m�2 s�1), and (3) 60 s atlow PFD (10 mmol m�2 s�1). The 60-s period at low PFD fol-lowing each lightfleck was also the 60-s period of low PFD be-fore the next lightfleck, resulting in a total of 60 s betweenlightflecks. After the sequential lightfleck simulations, we checkedthat maximum A had been attained by allowing leaves to reachmaximum steady state A values at PFD ¼ 500 mmol m�2 s�1.We determined that maximum A had been achieved after thelightfleck simulation when A remained constant for at least 300s. Net photosynthetic rate (A), stomatal conductance (gst), and in-tercellular CO2 concentration (Ci) was logged every 2 s for theentire sequential lightfleck simulation.
Maximum A and total CO2 uptake during the lightfleck þ30 s of low PFD was determined for each lightfleck in the se-ries. In addition, total CO2 uptake encompassing the entire se-quence of eight lightflecks was determined. Leaf IS values at
737NILSEN ET AL.—UNDERSTORY SHRUBS AND SUNFLECK RESPONSE
three time periods (IS0, IS60, and IS90) were calculated usingthe equation
IS ¼ ALF � AL
AH � AL
3 100;
where ALF is A at 0, 60, or 90 s and AL and AH are steadystate A values at low and high PFD, respectively (Chazdonand Pearcy 1986a). PFD during lightflecks was greater thanlight saturation, as determined from steady state light-responsecurves generated for Q. rubra seedlings at our research site in aprevious study (Lei et al. 2006), but it did not induce photoinhi-bition. Also, low PFD was just above the light compensationpoint as measured previously (Lei et al. 2006), and it repre-sented common diffuse PFD found in these understory plots.
The LUE during each lightfleck was calculated by compar-ing the measured total CO2 uptake during the lightfleck plus30 s at low PFD following the lightfleck with the predicted to-tal CO2 uptake for a square wave calculated from steady staterates measured at low and high PFDs (Chazdon and Pearcy1986b):
LUE ¼ measured CO2 uptakeþ 30 s
predicted CO2 uptake3 100:
Data Analysis
Of the six randomly selected, noncontiguous blocks (threeinside the R. maximum thickets [SF patches] and three whereR. maximum was absent [F patches]) used for experiment 1,we found no systematic bias of edaphic and environmentalcharacteristics among blocks within each canopy type (Leiet al. 2002, 2006). Hence, the blocks were treated as repli-cates of the main effect in the ANOVA. All statistical analyseswere completed using SAS PROC GLM (SAS/STAT system,ver. 8 for Windows; SAS Institute, Cary, NC). We acknowl-edge (Lei et al. 2002) that the two factors in the main effect(i.e., F or SF) are not strictly experimental treatments but rep-resent naturally occurring heterogeneity in the forest environ-ment. Therefore, the main effects of treatment (F vs. SF) onplant traits were determined using the following sums ofsquare (SS) ratio to calculate the F statistic, with df ¼ 1; 4:
F ¼ SS canopy type=1
SS main plot canopy typeð Þ=4 :
Two-way ANOVA was used for experiment 1 to determinethe effects of treatment (F or SF), lightfleck duration in sec-onds (25, 50, 150, or 400 s), and their interaction on maxi-mum photosynthesis, and total carbon gain for each lightfleckPFD individually. Data were transformed when necessary tomeet normality and equal-variance tests. Differences amongmeans of all lightfleck durations, within PFD levels, weretested with the Tukey method. We utilize a significance levelof 0.10 for all analyses because of the inherent heterogeneityof environmental conditions within forest understory patchtypes. The growth data were analyzed by a Kruskal-WallaceANOVA on ranks because normality tests could not be met.
All parameters attained during the sequential lightflecks ofexperiment 2 were analyzed for each individual lightfleck, andnot across lightflecks, using ANOVA with F and SF as thetreatment factor. Linear regression was used to relate WCOderived from canopy photographic analysis with total CO2
uptake from the sequence of eight lightflecks in experiment 2.
Results
Experiment 1: Gas Exchange
We detected no significant effects of dark adaptation versusambient adaptation on maximum A or total carbon gain withinany sunfleck intensity or duration. Therefore, results for dark-adapted and ambient-adapted seedlings were lumped (n ¼ 288)for all further analyses.
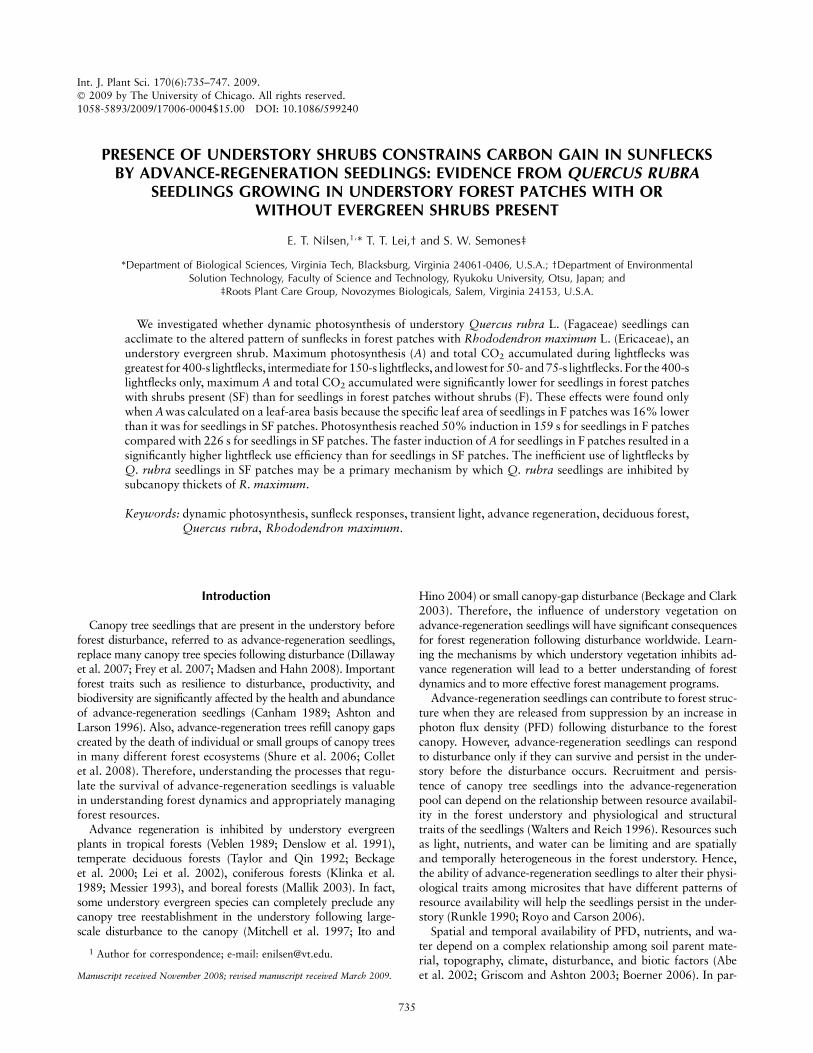
For lightflecks of 100 mmol m�2 s�1. The effect of forestpatch type on mean maximum A per leaf area was significant(P ¼ 0:009), as was the effect of lightfleck duration (P <0:001), but their interaction was not significant (P ¼ 0:727).Seedlings in both patch types had a significantly higher meanmaximum A value during 400-s lightflecks than did seedlingsexperiencing all other shorter-duration lightflecks (fig. 1A).There were no significant differences in mean maximum A valueamong any other lightfleck durations. For lightflecks of a 400-sduration only, seedlings in F patches accumulated a significantlyhigher amount of CO2 than did seedlings in SF patches (fig. 1B).
In order to meet the Kolmogorov-Smirnov normality test, thedata for total CO2 accumulation were transformed by the squareroot. The effect of forest patch type on total CO2 accumulatedduring the lightflecks per leaf area was significant (P ¼ 0:009),as was the effect of lightfleck duration (P < 0:001), but their in-teraction was not significant (P ¼ 0:244). For both forest types,mean total CO2 accumulated by seedlings during the 400-slightfleck was significantly higher than mean total CO2 accu-mulated by seedlings experiencing all other shorter-durationlightflecks (fig. 1B). In addition, for both forest types, meantotal CO2 accumulated by seedlings during the 150-s light-fleck was significantly higher than mean total CO2 accumu-lated by seedlings during lightflecks of 50 and 75 s. Forlightflecks of a 400-s duration only, seedlings in F patches ac-cumulated a significantly higher amount of CO2 than didseedlings in SF patches (fig. 1B).
For lightflecks of 500 mmol m�2 s�1. The effect of forestpatch type on mean maximum A per leaf area was significant(P ¼ 0:002), as was the effect of lightfleck duration (P <0:001), but their interaction was not significant (P ¼ 0:418).For both forest types, mean maximum A attained during a400-s lightfleck was significantly higher than mean maximumA attained by seedlings experiencing all other shorter-durationlightflecks (fig. 1A). For lightflecks of a 400-s duration only,seedlings in F patches attained a significantly higher meanmaximum A value than did seedlings in SF patches (fig. 1A).
In order to meet the equal-variance test, the data for totalCO2 accumulation during lightflecks were transformed by thenatural log. The effect of forest patch type on mean total CO2
accumulated during the lightflecks per leaf area was not signifi-cant (P ¼ 0:192), but the effect of lightfleck duration on meantotal CO2 accumulated during the lightflecks was significant(P < 0:001). The interaction between forest patch type and
738 INTERNATIONAL JOURNAL OF PLANT SCIENCES
lightfleck duration on mean total CO2 accumulated by seed-lings during the lightflecks was not significant (P ¼ 0:781). Forboth forest types, mean total CO2 accumulated by seedlingsduring the 400-s lightfleck was significantly higher than meantotal CO2 accumulated by seedlings for shorter-duration light-flecks (fig. 1B). For lightflecks of a 400-s duration only, seed-lings in F patches accumulated a significantly higher amount ofCO2 than seedlings in SF patches (fig. 1B).
For lightflecks of 1000 mmol m�2 s�1. The effect of for-est patch type on mean maximum A per leaf area was signifi-cant (P ¼ 0:009), as were the effect of lightfleck duration(P < 0:001) and the interaction of the two effects (P ¼0:032). For both forest types, mean maximum A attained byseedlings during a 400-s lightfleck was significantly higherthan mean maximum A attained by seedlings experiencing allother shorter-duration lightflecks (fig. 1A). In addition, mean
maximum A attained by seedlings in F patches during 150-slightflecks was significantly higher than mean maximum A ofseedlings in F patches experiencing 50- or 75-s lightflecks. Forlightflecks of a 400-s duration only, seedlings in F patches at-tained a significantly higher mean maximum A value than didseedlings in SF patches (fig. 1A).
In order to meet the Kolmogorov-Smirnov normality test, thedata for total CO2 accumulation during lightflecks were square-root transformed. The effect of forest patch type on total CO2
accumulated during the lightflecks per leaf area was signifi-cant (P ¼ 0:100), as were the effect of lightfleck duration (P <0:001) and the interaction of the two effects (P ¼ 0:011). Forboth forest types, mean total CO2 accumulated by seedlingsduring the 400-s lightfleck was significantly higher than meantotal CO2 accumulated by seedlings experiencing all othershorter-duration lightflecks (fig. 1B). Moreover, for both for-est types, mean total CO2 accumulated by seedlings duringthe 150-s lightfleck was significantly higher than mean totalCO2 accumulated by seedlings for 50- and 75-s lightflecks(fig. 1B). For lightflecks of a 400-s duration only, seedlings inF patches accumulated a significantly higher amount of CO2
than did seedlings in SF patches (fig. 1B).
Experiment 1: Plant Growth
Total plant leaf area and all measures of plant mass weresignificantly lower for seedlings in SF plots compared withseedlings in F plots (table 1). Plant height was not significantlydifferent between forest patch types. SLA was significantlyhigher for seedlings in SF plots compared with seedlings in Fplots (table 1).
Experiment 2: Photosynthesis and Carbon Gain
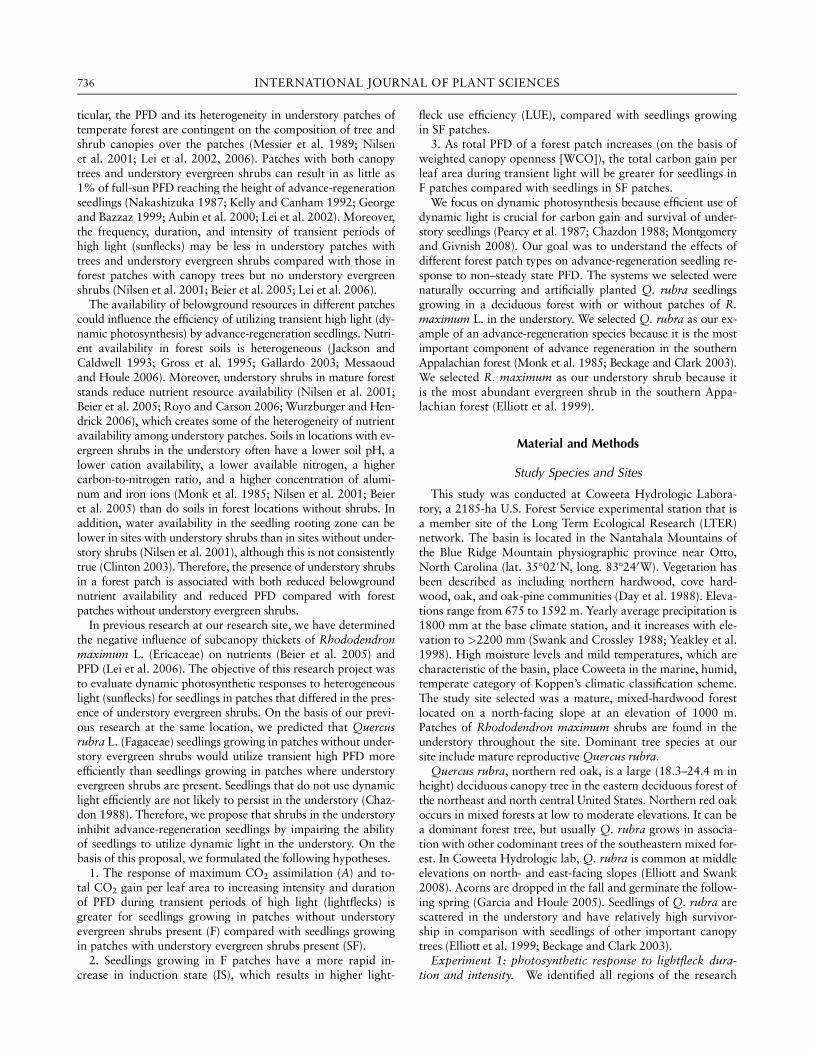
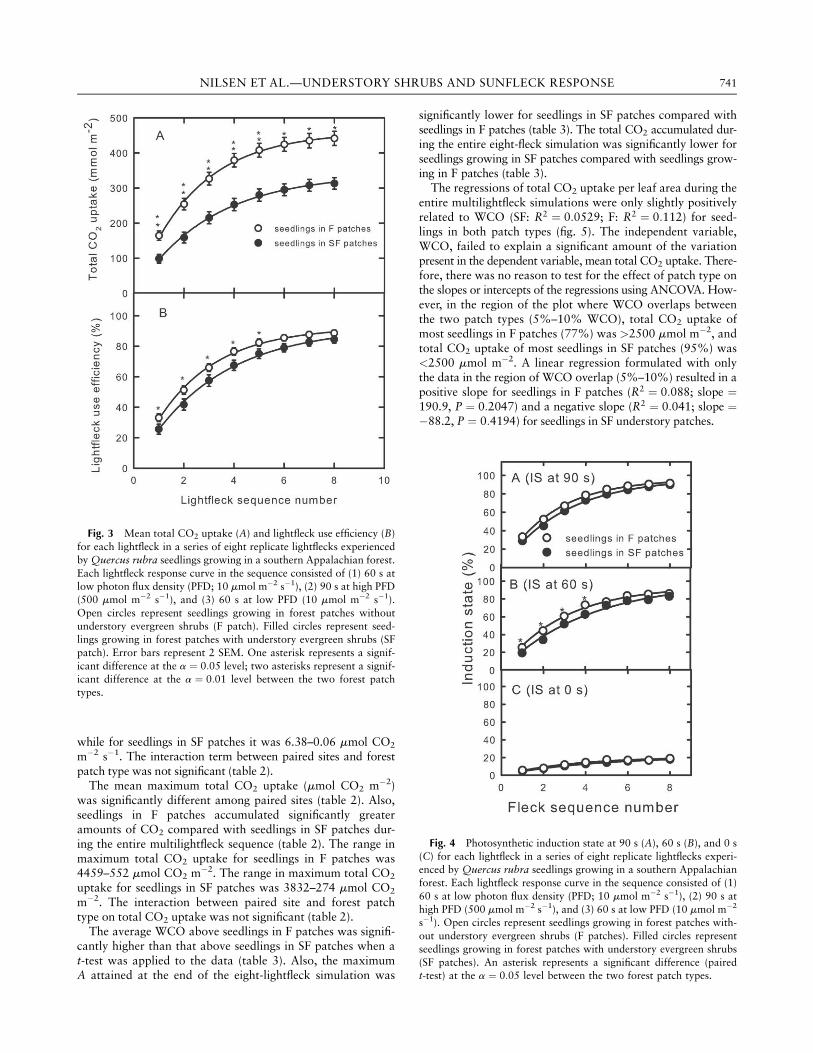
The general patterns of gas exchange were the same for leaveson seedlings in F or SF patches during the sequence of eight re-peated lightflecks. Here we present an example of a gas-exchangeresponse for a leaf on a seedling in an F patch, which repre-sents the general patterns observed for all leaves (fig. 2). Maxi-mum net photosynthesis (A) during each lightfleck increasedas the lightfleck sequence progressed, until lightfleck 5 (fig.2A); following this, A gradually increased through lightfleck8. Stomatal conductance (gst) gradually increased from the ini-tiation of lightfleck 2 until the end of lightfleck 4 (fig. 2A). Sto-matal conductance (gst) gradually decreased from lightfleck 5through lightfleck 8. The ratio of intercellular CO2 concentra-tion to ambient CO2 concentration (Ci=Ca) decreased rapidly atthe initiation of each lightfleck and increased rapidly at the endof each lightfleck (fig. 2B). Between each successive lightfleck,the Ci=Ca ratio was the same as it was before the lightfleck se-quence began. The lowest attained Ci=Ca ratio in each lightfleckincreased during the first four lightflecks and decreased fromlightfleck 5 to lightfleck 8 (fig. 2B). Patterns similar to thesewere observed in all other F and SF samples (data not shown).
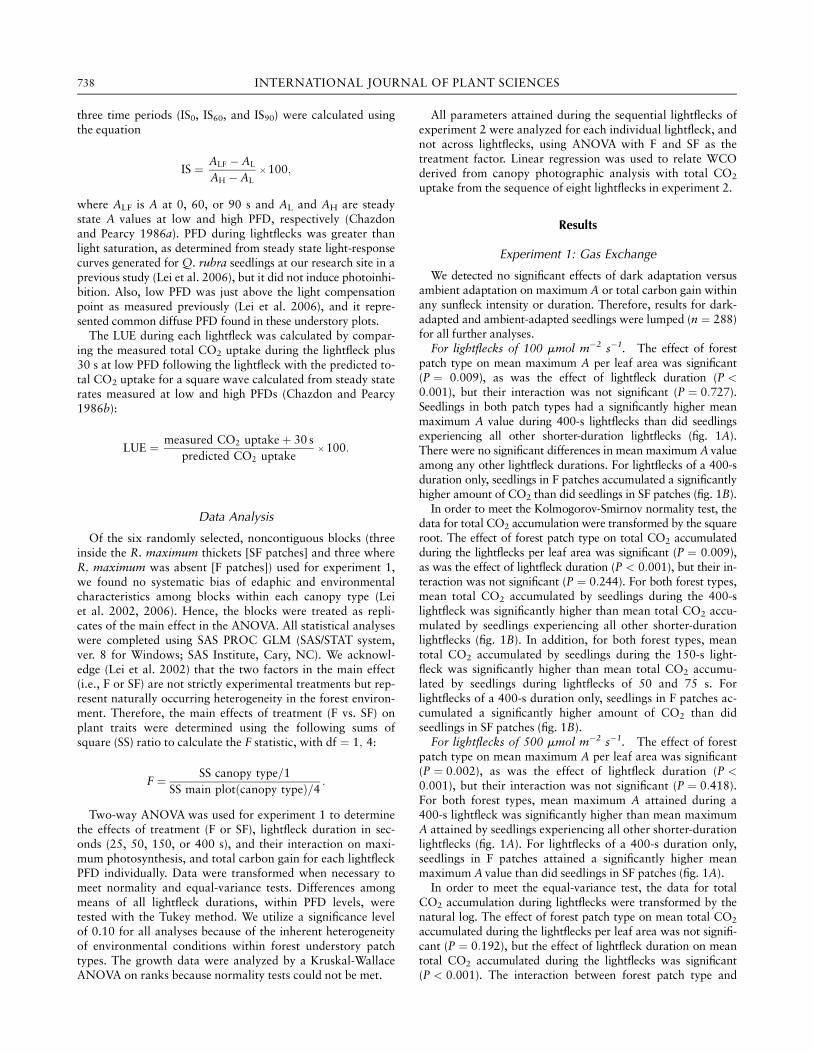
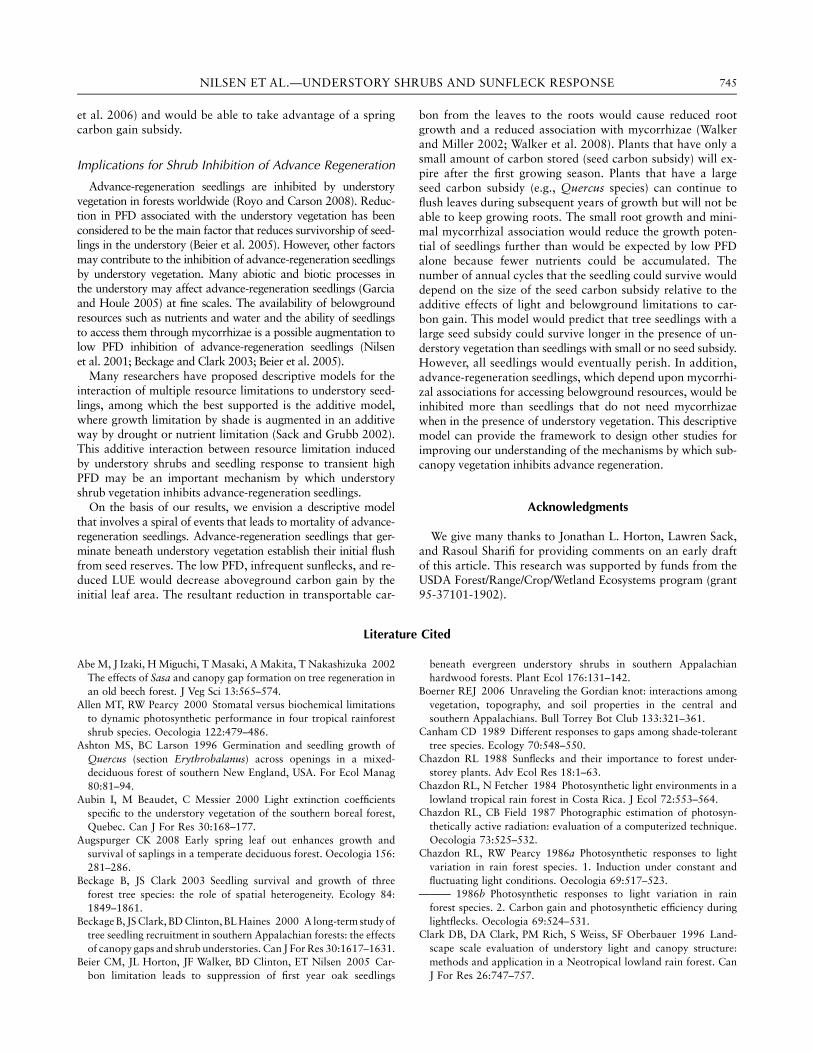
Mean total CO2 uptake per leaf area, measured in each light-fleck, increased as the lightfleck sequence progressed (fig. 3A).Most of the increase in total CO2 uptake per leaf area (calcu-lated as the percentage of maximum attained CO2 uptake fol-lowing each lightfleck) occurred by lightfleck 5 (80% for F, 72%for SF). Across all eight lightflecks, mean total CO2 uptake perleaf area during each lightfleck was significantly higher for seed-
Fig. 1 Mean net photosynthetic rate (A) or mean total CO2 uptake
(B) for Quercus rubra seedlings growing in the understory of a
southern Appalachian forest in lightflecks of photon flux density
(PFD) ¼ 100 mmol m�2 s�1, PFD ¼ 500 mmol m�2 s�1, and PFD ¼1000 mmol m�2 s�1. Open bars represent seedlings growing in forest
patches without understory evergreen shrubs (F patches). Filled bars
represent seedlings growing in forest patches with understory ever-green shrubs (SF patches). Error bars represent 1 SEM. The first two
bars in each group represent 50-s lightflecks, the second pair repre-
sents 75-s lightflecks, the third pair represents 150-s lightflecks, and
the fourth pair represents 400-s lightflecks. Filled bars with a differentlowercase letter are significantly different from each other within each
PFD group. Open bars with different uppercase letters are significantly
different from each other within each PFD group. An asterisk repre-
sents a significant difference between treatments (F vs. SF) at the a ¼0:05 level.
739NILSEN ET AL.—UNDERSTORY SHRUBS AND SUNFLECK RESPONSE
lings in F sites than for seedlings in SF sites (fig. 3A). An exponen-tial function of the form y ¼ a 1� bxð Þ could be used to describethe relationship between fleck sequence number (x) and seedlingtotal CO2 uptake per leaf area (y) for seedlings growing in bothpatch types (seedlings in F patches: y ¼ 34 1� 0:717xð Þ, R2 ¼0:99, P < 0:0001; seedlings in SF patches: y ¼ 460 1�ð 0:657xÞ,R2 ¼ 0:99, P < 0:0001). Similar exponential relationships werefound for maximum A in each lightfleck and A during lowPFD between lightflecks (data not shown).
Experiment 2: LUE and IS
Seedling LUE increased as the lightfleck simulation pro-gressed in both F and SF patches (fig. 3B). An exponential func-tion of the form y ¼ a 1� bxð Þ could be used to describe therelationship between lightfleck sequence number (x) and seed-ling LUE (y) for seedlings growing in both patch types (seedlingsin F patches: y ¼ 92:6 1� 0:726xð Þ, R2 ¼ 0:99, P < 0:0001;seedlings in SF patches: y ¼ 92:5 1� 0:650xð Þ, R2 ¼ 0:99,P < 0:0001). Seedlings in both patch types attained a LUE at orjust above 80% by lightfleck 7. For lightflecks 1–5 only, LUEfor seedlings in F patches was significantly higher than it wasfor seedlings in SF sites. There were no significant interactionsbetween patch type and paired site (data not shown).
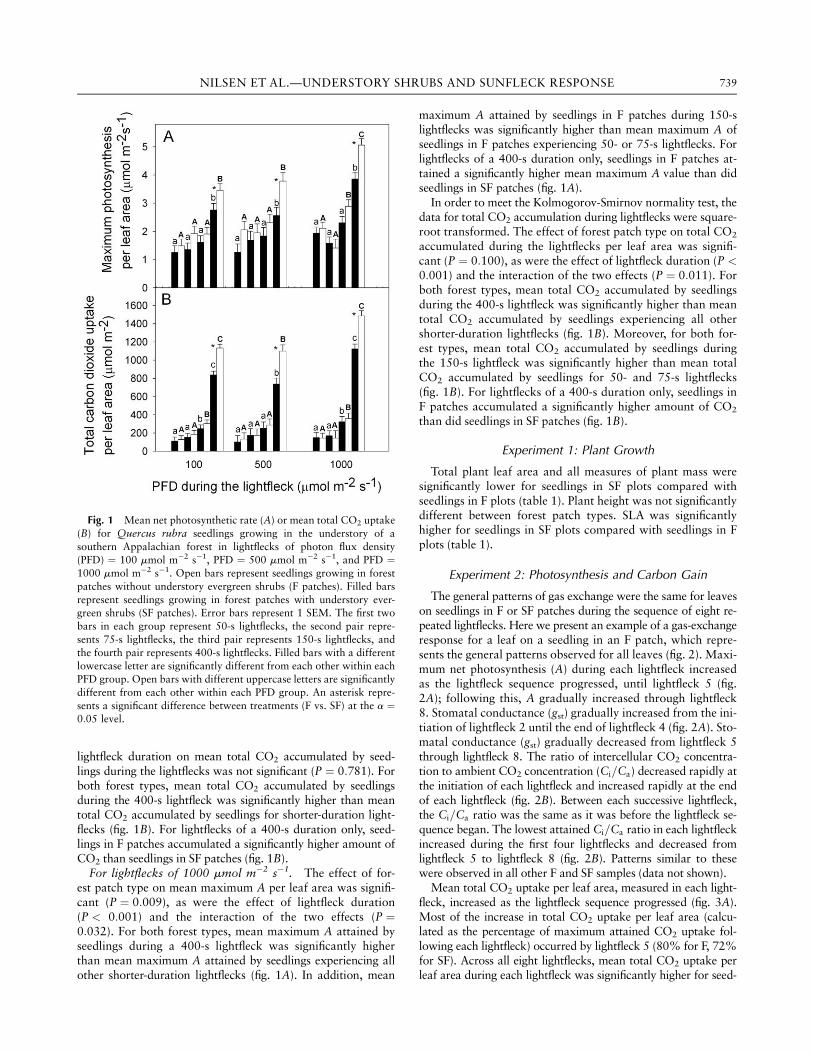
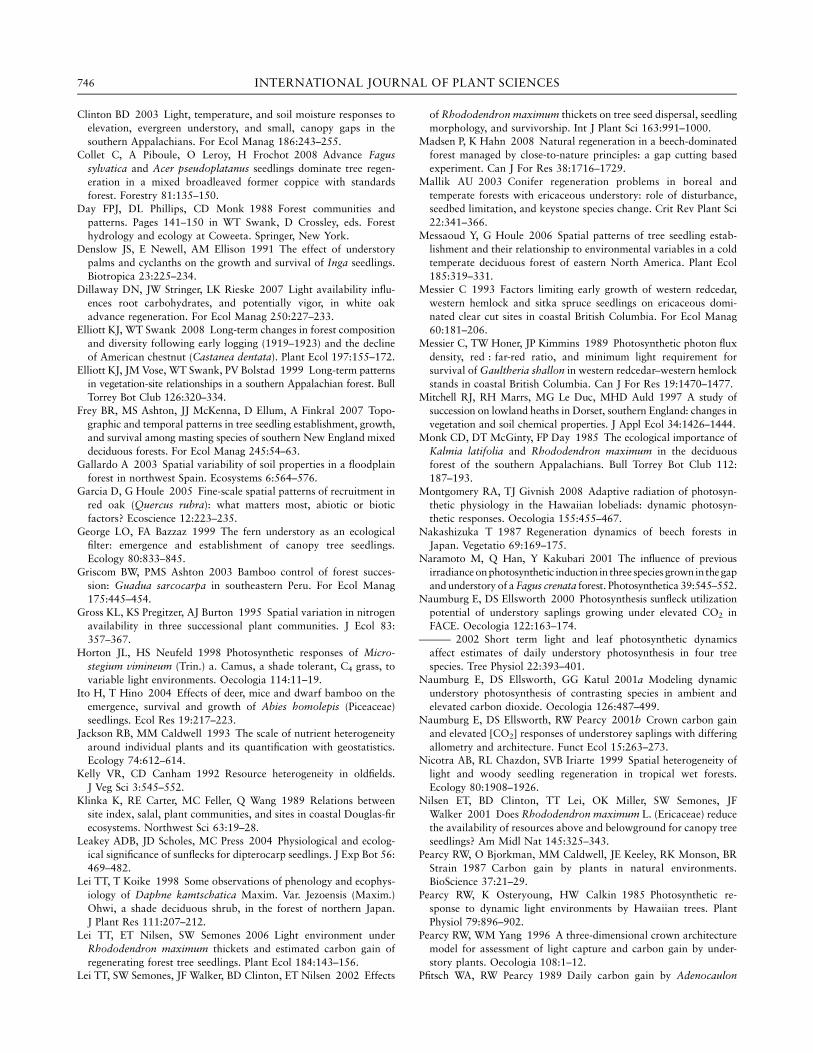
Leaf IS of seedlings during each lightfleck in the sequence in-creased from 0 to 60 to 90 s. All three IS values for seedlings in-creased as the lightfleck sequence progressed (fig. 4). For all ISindices, seedlings in F patches tended to maintain higher IS rela-tive to that of seedlings in SF patches. The mean IS0 values werelow (<20%) and not significantly different between seedlingsgrowing in F or SF patches, regardless of lightfleck sequencenumber. For lightflecks 1–4 only, mean IS60 values for seedlingslocated in F patches were significantly higher compared withmean IS60 values for seedlings in SF patches (fig. 4). Mean IS ofseedlings during lightfleck 1 increased by 20% from IS0 to IS60
and by 10% from IS60 to IS90 in both patch types. However, forseedlings in both patch types, mean IS of seedlings during light-fleck 8 increased by 60% from IS0 to IS60 and by 8% from IS60
to IS90. Therefore, as lightfleck sequence progressed, mean IS60
and mean IS90 increased in parallel for seedlings in both patchtypes, while mean IS0 remained fairly constant.
Experiment 2: WCO and Total Carbon Gain
There was a significant effect of the different paired sites onWCO (table 2), indicating that there was a significant varia-tion in WCO among different forest locations for reasonsother than the effect of shrubs on WCO. This forest scale spa-tial variation in WCO resulted in a high degree of overlap inWCO between F and SF patches (fig. 5). The range of WCOwas 4.7%–17.2% in F patches (only one measurement was>12%) and 3.1%–12.3% for seedlings in SF sites. Most seed-lings of both patch types (60% of all seedlings for F and 73%of all seedlings for SF) experienced a similar range of canopyopenness (between 5% and 10%). There was a significant ef-fect of forest patch type (F vs. SF) on WCO (table 2). Also,the interaction term between forest paired sites and patch typewas significantly different (table 2). This significant interactionindicates that the relationship between WCO and patch typewas significantly different among forest paired sites.
Paired sites had a significant effect on mean maximum A (ta-ble 2). Also, the mean maximum A value attained during themultifleck sequence was significantly higher for seedlings grow-ing in F patches compared with seedlings growing in SF patches(table 2). The range in maximum A logged for Quercus rubraseedlings in F patches was 7.84–0.339 mmol CO2 m�2 s�1,
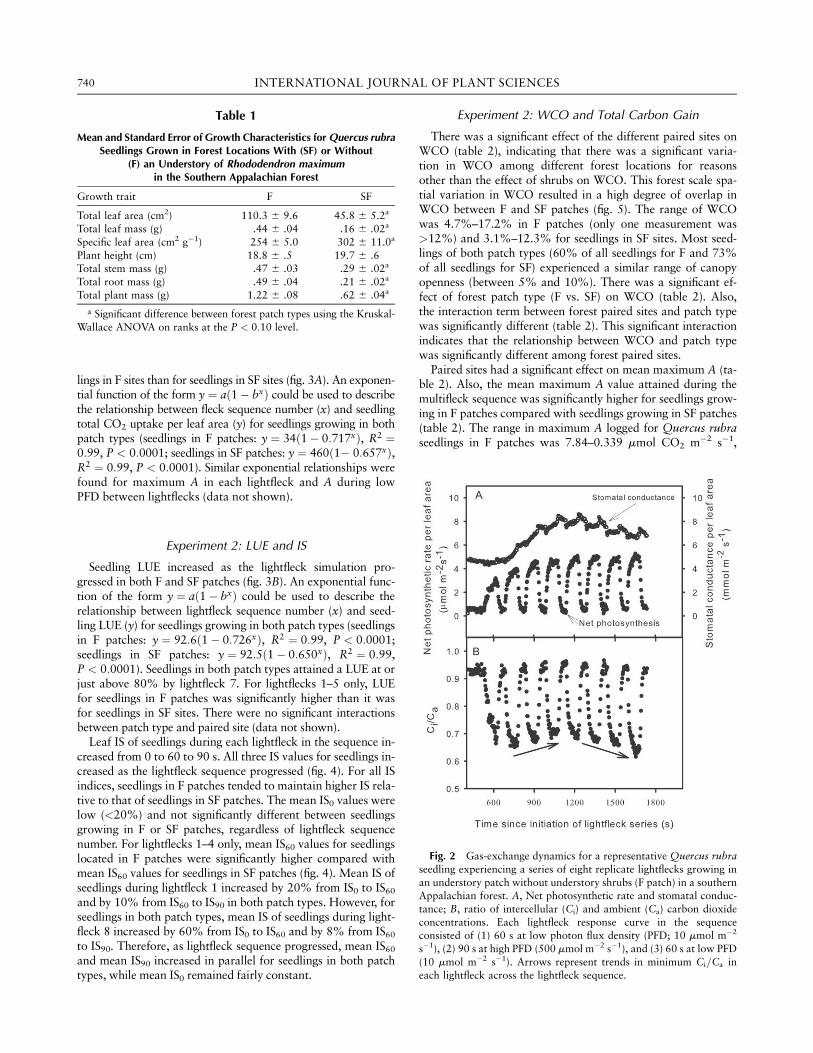
Table 1
Mean and Standard Error of Growth Characteristics for Quercus rubraSeedlings Grown in Forest Locations With (SF) or Without
(F) an Understory of Rhododendron maximumin the Southern Appalachian Forest
Growth trait F SF
Total leaf area (cm2) 110.3 6 9.6 45.8 6 5.2a
Total leaf mass (g) .44 6 .04 .16 6 .02a
Specific leaf area (cm2 g�1) 254 6 5.0 302 6 11.0a
Plant height (cm) 18.8 6 .5 19.7 6 .6Total stem mass (g) .47 6 .03 .29 6 .02a
Total root mass (g) .49 6 .04 .21 6 .02a
Total plant mass (g) 1.22 6 .08 .62 6 .04a
a Significant difference between forest patch types using the Kruskal-
Wallace ANOVA on ranks at the P < 0:10 level.
Fig. 2 Gas-exchange dynamics for a representative Quercus rubraseedling experiencing a series of eight replicate lightflecks growing in
an understory patch without understory shrubs (F patch) in a southernAppalachian forest. A, Net photosynthetic rate and stomatal conduc-
tance; B, ratio of intercellular (Ci) and ambient (Ca) carbon dioxide
concentrations. Each lightfleck response curve in the sequenceconsisted of (1) 60 s at low photon flux density (PFD; 10 mmol m�2
s�1), (2) 90 s at high PFD (500 mmol m�2 s�1), and (3) 60 s at low PFD
(10 mmol m�2 s�1). Arrows represent trends in minimum Ci=Ca in
each lightfleck across the lightfleck sequence.
740 INTERNATIONAL JOURNAL OF PLANT SCIENCES
while for seedlings in SF patches it was 6.38–0.06 mmol CO2
m�2 s�1. The interaction term between paired sites and forestpatch type was not significant (table 2).
The mean maximum total CO2 uptake (mmol CO2 m�2)was significantly different among paired sites (table 2). Also,seedlings in F patches accumulated significantly greateramounts of CO2 compared with seedlings in SF patches dur-ing the entire multilightfleck sequence (table 2). The range inmaximum total CO2 uptake for seedlings in F patches was4459–552 mmol CO2 m�2. The range in maximum total CO2
uptake for seedlings in SF patches was 3832–274 mmol CO2
m�2. The interaction between paired site and forest patchtype on total CO2 uptake was not significant (table 2).
The average WCO above seedlings in F patches was signifi-cantly higher than that above seedlings in SF patches when at-test was applied to the data (table 3). Also, the maximumA attained at the end of the eight-lightfleck simulation was
significantly lower for seedlings in SF patches compared withseedlings in F patches (table 3). The total CO2 accumulated dur-ing the entire eight-fleck simulation was significantly lower forseedlings growing in SF patches compared with seedlings grow-ing in F patches (table 3).
The regressions of total CO2 uptake per leaf area during theentire multilightfleck simulations were only slightly positivelyrelated to WCO (SF: R2 ¼ 0:0529; F: R2 ¼ 0:112) for seed-lings in both patch types (fig. 5). The independent variable,WCO, failed to explain a significant amount of the variationpresent in the dependent variable, mean total CO2 uptake. There-fore, there was no reason to test for the effect of patch type onthe slopes or intercepts of the regressions using ANCOVA. How-ever, in the region of the plot where WCO overlaps betweenthe two patch types (5%–10% WCO), total CO2 uptake ofmost seedlings in F patches (77%) was >2500 mmol m�2, andtotal CO2 uptake of most seedlings in SF patches (95%) was<2500 mmol m�2. A linear regression formulated with onlythe data in the region of WCO overlap (5%–10%) resulted in apositive slope for seedlings in F patches (R2 ¼ 0:088; slope ¼190.9, P ¼ 0:2047) and a negative slope (R2 ¼ 0:041; slope ¼�88.2, P ¼ 0:4194) for seedlings in SF understory patches.
Fig. 3 Mean total CO2 uptake (A) and lightfleck use efficiency (B)
for each lightfleck in a series of eight replicate lightflecks experienced
by Quercus rubra seedlings growing in a southern Appalachian forest.
Each lightfleck response curve in the sequence consisted of (1) 60 s atlow photon flux density (PFD; 10 mmol m�2 s�1), (2) 90 s at high PFD
(500 mmol m�2 s�1), and (3) 60 s at low PFD (10 mmol m�2 s�1).
Open circles represent seedlings growing in forest patches withoutunderstory evergreen shrubs (F patch). Filled circles represent seed-
lings growing in forest patches with understory evergreen shrubs (SF
patch). Error bars represent 2 SEM. One asterisk represents a signif-
icant difference at the a ¼ 0:05 level; two asterisks represent a signif-icant difference at the a ¼ 0:01 level between the two forest patch
types.
Fig. 4 Photosynthetic induction state at 90 s (A), 60 s (B), and 0 s
(C) for each lightfleck in a series of eight replicate lightflecks experi-enced by Quercus rubra seedlings growing in a southern Appalachian
forest. Each lightfleck response curve in the sequence consisted of (1)
60 s at low photon flux density (PFD; 10 mmol m�2 s�1), (2) 90 s at
high PFD (500 mmol m�2 s�1), and (3) 60 s at low PFD (10 mmol m�2
s�1). Open circles represent seedlings growing in forest patches with-
out understory evergreen shrubs (F patches). Filled circles represent
seedlings growing in forest patches with understory evergreen shrubs
(SF patches). An asterisk represents a significant difference (pairedt-test) at the a ¼ 0:05 level between the two forest patch types.
741NILSEN ET AL.—UNDERSTORY SHRUBS AND SUNFLECK RESPONSE

Discussion
Site Dynamic Light Environment
In the forest understory, 90% of daily PFD occurs duringtransient periods of high light (Chazdon 1988; Naumburget al. 2001a; Montgomery and Givnish 2008). Dynamic pho-tosynthetic response to transient light can account for >65%of total carbon gain for understory plants (Pfitsch and Pearcy1989). Therefore, it is critical to understand the relationshipbetween understory heterogeneous light and dynamic photosyn-thesis when evaluating the persistence of advance-regenerationseedlings. In previous research, we established that total PFDin our forest sites where understory shrubs were not present (Fsites) averaged 0.5 mol m�2 d�1 (Lei et al. 2006) and that to-tal PFD in forest sites where understory shrubs were present(SF sites) averaged 0.1 mol m�2 d�1. These values correspondto light penetration through the canopy of 0.9%–1.9% (Leiet al. 2006), and they are similar to the WCO values we re-corded in this study. These total PFD and WCO values arecomparable with those measured in tropical rain forests(Chazdon and Fetcher 1984; Clark et al. 1996) and are lowerthan those measured in most other forests (Leakey et al. 2004;Montgomery and Givnish 2008). Hence, the PFDs of our re-search sites are reflective of tropical rain forest and are dimcompared with those of other deciduous forests.
Diffuse radiation during the growing season at our researchsite averaged 40 mmol m�2 s�1 in F sites and 10 mmol m�2 s�1
in SF sites (Lei et al. 2006). These values are close to the com-pensation point for Quercus rubra seedlings growing in this for-est (Lei et al. 2006). Therefore, Q. rubra seedlings are unlikelyto persist in the understory without efficiently using the tran-sient periods of high radiation that they experience. Similarly,the survival of many understory seedlings in other forests is de-pendent on efficient use of sunfleck radiation (Chazdon and Pearcy
1986b; Chazdon 1988; Naumburg and Ellsworth 2002). More-over, sunfleck PFD is of greater importance to daily leaf carbongain for seedlings in deeply shaded microhabitats like those ofour sites (Naumburg and Ellsworth 2002; Montgomery andGivnish 2008), compared with that of seedlings in higher-lightunderstory locations. Thus, it is most likely that dynamic lightis critical to Q. rubra seedling persistence.
Sunflecks measured at our research site in previous studieswere more abundant and often had higher PFD values in Fpatches than in SF patches. In fact, an average of 18.3 sunflecksd�1 reached PFD of 100 mmol m�2 s�1 in F patches, comparedwith only 0.79 sunflecks d�1 in SF patches (Nilsen et al. 2001;Lei et al. 2006). Therefore, the lightfleck simulations we per-formed at 100 mmol m�2 s�1 PFD in this study represent sun-fleck PFD values experienced by seedlings in both F and SFpatches. However, lightfleck simulations performed at or above500 mmol m�2 s�1 PFD represent light-saturating sunfleckscommonly experienced by seedlings growing in F patches andrarely experienced by seedlings in SF patches (Q. rubra lightsaturation points; F ¼ 400 6 68 mmol m�2 s�1 PFD; SF ¼360 6 54 mmol m�2 s�1 PFD; Lei et al. 2006). We found thatseedlings in both understory patch types were not able to attaintheir maximum A values in light-saturating lightflecks <400 sor when exposed to fewer than five sequential lightflecks of a90-s duration. Therefore, natural sunflecks must be above lightsaturation (400 mmol m�2 s�1 PFD), last longer than 400 s, orbe very frequent (more than five sunflecks of 90 s in durationwithin 600 s) for Q. rubra seedlings to attain full A inductionin the forest understory.
The number of sunflecks that seedlings encountered in F un-derstory patches ranged from 2 to 43 (mean of 19.3) and from0 to 10 (mean of 0.75) per 12 h in SF understory patches (Nil-sen et al. 2001). Also, during diurnal cycles in the growingseason, our previous research found that 180 min of light was
Table 2
ANOVA Results for the Effects of Paired Site and Patch Type and the Interaction of the Two onWeighted Canopy Openness (WCO), Maximum CO2 Assimilation, and
Total CO2 Uptake during Eight Repeated Lightflecks
Source df F P
WCO above seedlings used for lightfleck simulations:
Paired site 9 3.99 .0011Patch type 1 10.4 .0029
Paired site 3 patch type 9 3.66 .0020
Maximum A (mmol m�2 s�1) rate attained during the lightfleck simulation:Paired site 9 4.5 .0004
Patch type 1 43.60 .0001
Paired site 3 patch type 9 1.39 .2252
Total CO2 uptake (mmol m�2) from the lightfleck simulation:Paired site 9 2.95 .0088
Patch type 1 28.43 .0001
Paired site 3 patch type 9 1.25 .2920
Note. Paired site refers to different forest locations in which pairs of patch types were studied. Patch
type refers to the effect of the different understory patch types. Patch types differ by the presence or ab-
sence of the understory evergreen shrub Rhododendron maximum. Results are presented for degrees of
freedom, F statistic, and P values for Quercus rubra seedlings growing in the southern Appalachian for-est. Each lightfleck response curve, in the sequence of eight repeated lightflecks, consisted of (1) a 60-s
period at low light (photon flux density [PFD] ¼ 10 mmol m�2 s�1), (2) 90 s at high light (PFD ¼ 500
mmol m�2 s�1), and (3) a 60-s period postlightfleck at low light (PFD ¼ 10 mmol m�2 s�1).
742 INTERNATIONAL JOURNAL OF PLANT SCIENCES

>100 mmol m�2 s�1 in F patches, while in SF patches only anaverage of 8 min was >100 mmol m�2 s�1 (Nilsen et al. 2001).These values correspond to the lowest frequencies of sunflecksfor forests in Hawaii (Montgomery and Givnish 2008) and aresimilar to sunfleck frequencies in tropical rain forests (Chazdonand Fetcher 1984). Given the light intensity and duration ofsunflecks in understory environments (Nicotra et al. 1999;Nilsen et al. 2001), rapid photosynthetic induction and opti-mization of LUE is important for persistence of advance-regeneration seedlings in the understory of deciduous forest.Seedlings in patches with evergreen shrubs will experience fewersunflecks of lower PFDs. Therefore, to maximize growth and
survival, seedlings in SF patches should respond more efficientlyto fewer sunflecks than seedlings in F patches.
Dynamic Photosynthesis of Q. rubra Seedlings
We utilized lightflecks that ranged in duration from 50 s(0.8 min) to 400 s (6.7 min). These durations correspond tothe range of durations experienced by seedlings in the south-ern Appalachian forest (Lei et al. 2006). The sunfleck dura-tions we used correspond to sites with PFD <7 mol m�2 d�1
in Hawaiian forests (Montgomery and Givnish 2008), whichis comparable with the total PFD found at our sites (Lei et al.2006). Dynamic photosynthesis is affected by both dynamiclight and total PFD. Both of these were relatively low at oursite. Thus, our research sites are relatively dim compared withthose used in many other studies of dynamic photosynthesis.
We found that values of maximum attained A and total CO2
uptake during lightflecks were relatively constant at lightflecksof 50–150 s. However, for seedlings experiencing 400-s light-flecks, A and total CO2 uptake per leaf area were significantlyhigher than they were for seedlings experiencing shorter-durationlightflecks. This result is comparable to dipterocarp seedlings,for which maximum A in 360–480-s sunflecks was twice thatof seedlings in 120–240-s lightflecks (Leakey et al. 2004).
The effect of subcanopy shrubs on A and total CO2 uptakeper leaf area during lightflecks was only significant at the 400-slightfleck duration. The significant difference in dynamic gasexchange between seedlings in F and SF sites observed for longer-duration lightflecks could have been due to a lower IS attainedduring 400-s sunflecks for seedlings in SF sites. These resultsagree with previous studies that have demonstrated that IS in-creases with an increase in site PFD (Naramoto et al. 2001).However, the reverse relationship (decreasing induction withincreasing PFD) has been found in other studies of dynamicphotosynthesis (Montgomery and Givnish 2008). The rela-tively low-range PFD experienced by all the seedlings in ourstudy may be the reason why our results seem to oppose thosefound when a large range of PFDs is used.
If A is calculated on a mass basis rather than an area basis,there are no differences in dynamic photosynthesis betweenseedlings in F and in SF. The 16% higher SLA value for seed-
Fig. 5 Total CO2 uptake from a series of eight replicate lightflecks
plotted against the weighted canopy openness (WCO) above Quercusrubra seedlings growing in a southern Appalachian forest. Each
lightfleck response curve in the sequence consisted of (1) 60 s at lowphoton flux density (PFD; 10 mmol m�2 s�1), (2) 90 s at high PFD (500
mmol m�2 s�1), and (3) 60 s at low PFD (10 mmol m�2 s�1). Open circles
represent seedlings growing in forest patches without understoryevergreen shrubs (F patches). Filled circles represent seedlings growing
in forest patches with understory evergreen shrubs (SF patches). Dotted
line represents total CO2 uptake of 2500 mmol m�2.
Table 3
Weighted Canopy Openness (WCO), Maximum Net Photosynthetic Rate (Amax), and Total CO2 Uptakefor Quercus rubra Seedlings Exposed to Eight Sequential Lightflecks
Patch type
Characteristic Unit F SF P (T � t)
WCO % 8.17 6 .49 6.17 6 .48 .0011
Amax mmol m�2 s�1 5.49 6 .20 4.11 6 .18 .0004
Total CO2 uptake mmol m�2 2907 6 156 1955 6 136 .0088
Note. Each lightfleck response curve in the sequence consisted of (1) a 60-s period at low light
(photon flux density [PFD] ¼ 10 mmol m�2 s�1), (2) 90 s at high light (PFD ¼ 500 mmol m�2 s�1), and
(3) a 60-s period postlightfleck at low light (PFD ¼ 10 mmol m�2 s�1). Means 6 SE are presented foreach characteristic. Patch type refers to the effect of the different understory patch types. Patch types
differ by the presence or absence of the understory evergreen shrub Rhododendron maximum. F ¼ for-
est locations without an understory thicket of evergreen shrubs; SF ¼ forest locations with an under-
story of evergreen shrubs. P values denote significant differences between means of the two understorypatch types (two-tailed t-test).
743NILSEN ET AL.—UNDERSTORY SHRUBS AND SUNFLECK RESPONSE

lings in SF patches negated the significant difference in maxi-mum A attained during 400-s sunflecks. Therefore, the differ-ence we found in total CO2 uptake on a leaf area basis waspartly due to a difference in leaf thickness.
It takes between 10 and 30 min for A to reach its maximumvalue during a single sunfleck (Chazdon 1988; Naramotoet al. 2001). Therefore, the sunfleck durations we used in ex-periment 1 (maximum of 6.5 min) did not cause our seedlingsto reach their maximum attainable photosynthesis (full induc-tion). It is well known that a series of shorter sunflecks can in-duce maximum photosynthesis in a time frame comparable toa single long sunfleck (Pearcy et al. 1985; Leakey et al. 2004).It is better to use a sequence of moderate-length lightflecks toinduce maximum A to avoid leaf overheating and photoinhi-bition (Leakey et al. 2004). Therefore, we utilized a sequenceof eight lightflecks of a 90-s duration each to ensure that ourseedlings would reach maximum A during lightflecks.
Our multilightfleck simulations indicated that seedlings in Fsites and SF sites were at the same IS before experiencing alightfleck. During lightflecks, seedlings in F patches attained ahigh IS faster than seedlings growing in SF patches. The timeto 50% of maximum A (A50) in transient light is highly corre-lated with the rate of photosynthetic induction (Allen andPearcy 2000). We calculated A50 for our sequential lightflecksimulation. This is an unconventional but not unprecedented(Horton and Neufeld 1998) technique, because A50 is usuallydetermined for a single lightfleck and not a sequence of light-flecks. Therefore, our measurements of A50 are longer thanthose in studies of individual lightflecks because IS decreasesduring the period of low irradiance between each lightfleck inthe sequence. However, we use this determination to compareA50 between treatments rather than to compare A50 with datafrom other studies. Seedlings in F patches attain A50 signifi-cantly faster (mean time to A50 in F ¼ 159 s; mean time to A50
in SF ¼ 226 s; P ¼ :04117, two-tailed t-test with n ¼ 30) thando seedlings growing in SF patches during the lightfleck se-quence. The faster increase in IS during lightflecks for seed-lings in F patches was associated with higher LUE comparedwith seedlings in SF patches. Therefore, our second hypothesiswas supported because seedlings growing in F patches attain ahigher IS more quickly in lightflecks, resulting in higher LUEcompared with seedlings in SF patches.
Implications for Advance-Regeneration Carbon Gain
Our data suggest that differences in response to heterogeneouslight will be important to carbon accumulation by advance-regeneration seedlings in forest understory patches affected bycanopy gaps. Canopy gaps cause longer sunflecks with higherPFD in the forest understory than do nongap forests. Wefound a significantly higher carbon accumulation per leaf areaby seedlings in F patches than by seedlings in SF patches whenthey experience long (400-s) sunflecks. Therefore, shrub presencein the understory under canopy gaps may significantly reducecarbon gain per leaf area of advance-generation seedlings com-pared with seedlings in canopy gaps without evergreen shrubspresent. Studies of forest understory in or out of canopy gapssupport this concept (Beckage et al. 2000) because shrubs ingaps have a larger effect on advance-regeneration seedlings thandoes the gap itself.
We hypothesized that the slope of the relationship betweenWCO and total carbon gain in a multilightfleck sequence wouldbe greater for seedlings in F patches compared with seedlingsgrowing in SF patches. The slopes of these regressions wereweakly positive and not significantly different between seedlingsin different patch types. The lack of significance was most likelydue to a large variation in total CO2 accumulation in the rangeof WCO overlap between the two forest patch types. Our datashowed that WCO above seedlings in F patches was often highercompared with that above seedlings in SF patches, but therewas a large overlap in WCO between the two understorypatch types. Seventy percent of seedlings in F patches and 60%of seedlings in SF patches had WCO values between 5% and10%. This means that there are many locations under the shrubcanopy that have similar canopy openness to sites in forestswithout shrubs. Therefore, factors other than WCO in SF forestpatches contribute to inhibition of advance regeneration. Withinthat range of WCO overlap, most seedlings in F patches hadhigher total CO2 uptake per leaf area compared with seedlingsin SF patches. These data suggest that other factors associatedwith the presence of shrubs inhibit efficient use of sunflecks forcarbon gain by advance-regeneration shrubs.
Simulation models for seedling total carbon gain in forestunderstory have focused on dynamic photosynthesis on a leafarea basis (Naumburg et al. 2001b). These models calculatetotal carbon gain on the basis of site dynamic light, dynamicphotosynthesis, and plant leaf architecture (Pearcy and Yang1996; Naumburg and Ellsworth 2000; Naumburg et al.2001a). On the basis of our results, seedlings in F patchesshould have greater carbon gain per seedling per day becausethey have faster induction of photosynthesis and more leafarea than seedlings in SF patches. Even if canopy openness isequivalent between seedlings in SF and F patches, our resultssuggest that the seedling in the F patch should still have ahigher daily carbon gain than the seedling in the SF patch.Also, seedling carbon gain could be affected by nocturnal res-piration of leaves and the mass of nonphotosynthetic, respir-ing tissues. Leaf respiration rates were found to be similarfor seedlings in F and SF patches (Lei et al. 2006). The higherleaf area of seedlings in F patches would result in a highernocturnal leaf respiratory loss per plant than that of seedlingsin SF patches. Moreover, seedlings in F patches had a highermass of roots and stems than did seedlings in SF patches.The carbon loss by respiration due to the combination ofmore nonphotosynthetic mass and higher leaf area of seed-lings in F patches could reduce the difference in seedling car-bon gain between seedlings in F and SF patches.
Models of annual carbon gain for understory seedlings arenormally parameterized by dynamic photosynthesis and dy-namic light during the growing season when the tree canopyis closed. However, understory plants can gain a significantamount of their annual carbon gain in the early spring (springcarbon gain subsidy) before the tree canopy closes above them(Lei and Koike 1998; Augspurger 2008) if the seedlings flushleaves before the tree canopy closes. During the early spring,canopy openness in F patches is 2.5 times that in SF patches atour research site (Lei et al. 2006). Advance-regeneration seed-lings in F patches would be able to take advantage of the springsubsidy more than seedlings in SF patches would. Quercusrubra seedlings did leaf out before the canopy at our site (Lei
744 INTERNATIONAL JOURNAL OF PLANT SCIENCES
et al. 2006) and would be able to take advantage of a springcarbon gain subsidy.
Implications for Shrub Inhibition of Advance Regeneration
Advance-regeneration seedlings are inhibited by understoryvegetation in forests worldwide (Royo and Carson 2008). Reduc-tion in PFD associated with the understory vegetation has beenconsidered to be the main factor that reduces survivorship of seed-lings in the understory (Beier et al. 2005). However, other factorsmay contribute to the inhibition of advance-regeneration seedlingsby understory vegetation. Many abiotic and biotic processes inthe understory may affect advance-regeneration seedlings (Garciaand Houle 2005) at fine scales. The availability of belowgroundresources such as nutrients and water and the ability of seedlingsto access them through mycorrhizae is a possible augmentation tolow PFD inhibition of advance-regeneration seedlings (Nilsenet al. 2001; Beckage and Clark 2003; Beier et al. 2005).
Many researchers have proposed descriptive models for theinteraction of multiple resource limitations to understory seed-lings, among which the best supported is the additive model,where growth limitation by shade is augmented in an additiveway by drought or nutrient limitation (Sack and Grubb 2002).This additive interaction between resource limitation inducedby understory shrubs and seedling response to transient highPFD may be an important mechanism by which understoryshrub vegetation inhibits advance-regeneration seedlings.
On the basis of our results, we envision a descriptive modelthat involves a spiral of events that leads to mortality of advance-regeneration seedlings. Advance-regeneration seedlings that ger-minate beneath understory vegetation establish their initial flushfrom seed reserves. The low PFD, infrequent sunflecks, and re-duced LUE would decrease aboveground carbon gain by theinitial leaf area. The resultant reduction in transportable car-
bon from the leaves to the roots would cause reduced rootgrowth and a reduced association with mycorrhizae (Walkerand Miller 2002; Walker et al. 2008). Plants that have only asmall amount of carbon stored (seed carbon subsidy) will ex-pire after the first growing season. Plants that have a largeseed carbon subsidy (e.g., Quercus species) can continue toflush leaves during subsequent years of growth but will not beable to keep growing roots. The small root growth and mini-mal mycorrhizal association would reduce the growth poten-tial of seedlings further than would be expected by low PFDalone because fewer nutrients could be accumulated. Thenumber of annual cycles that the seedling could survive woulddepend on the size of the seed carbon subsidy relative to theadditive effects of light and belowground limitations to car-bon gain. This model would predict that tree seedlings with alarge seed subsidy could survive longer in the presence of un-derstory vegetation than seedlings with small or no seed subsidy.However, all seedlings would eventually perish. In addition,advance-regeneration seedlings, which depend upon mycorrhi-zal associations for accessing belowground resources, would beinhibited more than seedlings that do not need mycorrhizaewhen in the presence of understory vegetation. This descriptivemodel can provide the framework to design other studies forimproving our understanding of the mechanisms by which sub-canopy vegetation inhibits advance regeneration.
Acknowledgments
We give many thanks to Jonathan L. Horton, Lawren Sack,and Rasoul Sharifi for providing comments on an early draftof this article. This research was supported by funds from theUSDA Forest/Range/Crop/Wetland Ecosystems program (grant95-37101-1902).
Literature Cited
Abe M, J Izaki, H Miguchi, T Masaki, A Makita, T Nakashizuka 2002
The effects of Sasa and canopy gap formation on tree regeneration in
an old beech forest. J Veg Sci 13:565–574.
Allen MT, RW Pearcy 2000 Stomatal versus biochemical limitations
to dynamic photosynthetic performance in four tropical rainforest
shrub species. Oecologia 122:479–486.Ashton MS, BC Larson 1996 Germination and seedling growth of
Quercus (section Erythrobalanus) across openings in a mixed-
deciduous forest of southern New England, USA. For Ecol Manag
80:81–94.
Aubin I, M Beaudet, C Messier 2000 Light extinction coefficients
specific to the understory vegetation of the southern boreal forest,
Quebec. Can J For Res 30:168–177.
Augspurger CK 2008 Early spring leaf out enhances growth and
survival of saplings in a temperate deciduous forest. Oecologia 156:
281–286.Beckage B, JS Clark 2003 Seedling survival and growth of three
forest tree species: the role of spatial heterogeneity. Ecology 84:
1849–1861.
Beckage B, JS Clark, BD Clinton, BL Haines 2000 A long-term study of
tree seedling recruitment in southern Appalachian forests: the effects
of canopy gaps and shrub understories. Can J For Res 30:1617–1631.
Beier CM, JL Horton, JF Walker, BD Clinton, ET Nilsen 2005 Car-
bon limitation leads to suppression of first year oak seedlings
beneath evergreen understory shrubs in southern Appalachian
hardwood forests. Plant Ecol 176:131–142.
Boerner REJ 2006 Unraveling the Gordian knot: interactions among
vegetation, topography, and soil properties in the central and
southern Appalachians. Bull Torrey Bot Club 133:321–361.Canham CD 1989 Different responses to gaps among shade-tolerant
tree species. Ecology 70:548–550.
Chazdon RL 1988 Sunflecks and their importance to forest under-
storey plants. Adv Ecol Res 18:1–63.
Chazdon RL, N Fetcher 1984 Photosynthetic light environments in a
lowland tropical rain forest in Costa Rica. J Ecol 72:553–564.Chazdon RL, CB Field 1987 Photographic estimation of photosyn-
thetically active radiation: evaluation of a computerized technique.
Oecologia 73:525–532.Chazdon RL, RW Pearcy 1986a Photosynthetic responses to light
variation in rain forest species. 1. Induction under constant and
fluctuating light conditions. Oecologia 69:517–523.——— 1986b Photosynthetic responses to light variation in rain
forest species. 2. Carbon gain and photosynthetic efficiency during
lightflecks. Oecologia 69:524–531.Clark DB, DA Clark, PM Rich, S Weiss, SF Oberbauer 1996 Land-
scape scale evaluation of understory light and canopy structure:
methods and application in a Neotropical lowland rain forest. Can
J For Res 26:747–757.
745NILSEN ET AL.—UNDERSTORY SHRUBS AND SUNFLECK RESPONSE
Clinton BD 2003 Light, temperature, and soil moisture responses to
elevation, evergreen understory, and small, canopy gaps in the
southern Appalachians. For Ecol Manag 186:243–255.
Collet C, A Piboule, O Leroy, H Frochot 2008 Advance Fagus
sylvatica and Acer pseudoplatanus seedlings dominate tree regen-
eration in a mixed broadleaved former coppice with standards
forest. Forestry 81:135–150.
Day FPJ, DL Phillips, CD Monk 1988 Forest communities and
patterns. Pages 141–150 in WT Swank, D Crossley, eds. Forest
hydrology and ecology at Coweeta. Springer, New York.
Denslow JS, E Newell, AM Ellison 1991 The effect of understory
palms and cyclanths on the growth and survival of Inga seedlings.
Biotropica 23:225–234.
Dillaway DN, JW Stringer, LK Rieske 2007 Light availability influ-
ences root carbohydrates, and potentially vigor, in white oak
advance regeneration. For Ecol Manag 250:227–233.Elliott KJ, WT Swank 2008 Long-term changes in forest composition
and diversity following early logging (1919–1923) and the decline
of American chestnut (Castanea dentata). Plant Ecol 197:155–172.
Elliott KJ, JM Vose, WT Swank, PV Bolstad 1999 Long-term patterns
in vegetation-site relationships in a southern Appalachian forest. Bull
Torrey Bot Club 126:320–334.
Frey BR, MS Ashton, JJ McKenna, D Ellum, A Finkral 2007 Topo-
graphic and temporal patterns in tree seedling establishment, growth,
and survival among masting species of southern New England mixed
deciduous forests. For Ecol Manag 245:54–63.
Gallardo A 2003 Spatial variability of soil properties in a floodplain
forest in northwest Spain. Ecosystems 6:564–576.Garcia D, G Houle 2005 Fine-scale spatial patterns of recruitment in
red oak (Quercus rubra): what matters most, abiotic or biotic
factors? Ecoscience 12:223–235.
George LO, FA Bazzaz 1999 The fern understory as an ecological
filter: emergence and establishment of canopy tree seedlings.
Ecology 80:833–845.
Griscom BW, PMS Ashton 2003 Bamboo control of forest succes-
sion: Guadua sarcocarpa in southeastern Peru. For Ecol Manag
175:445–454.
Gross KL, KS Pregitzer, AJ Burton 1995 Spatial variation in nitrogen
availability in three successional plant communities. J Ecol 83:
357–367.Horton JL, HS Neufeld 1998 Photosynthetic responses of Micro-
stegium vimineum (Trin.) a. Camus, a shade tolerant, C4 grass, to
variable light environments. Oecologia 114:11–19.
Ito H, T Hino 2004 Effects of deer, mice and dwarf bamboo on the
emergence, survival and growth of Abies homolepis (Piceaceae)
seedlings. Ecol Res 19:217–223.
Jackson RB, MM Caldwell 1993 The scale of nutrient heterogeneity
around individual plants and its quantification with geostatistics.
Ecology 74:612–614.
Kelly VR, CD Canham 1992 Resource heterogeneity in oldfields.
J Veg Sci 3:545–552.
Klinka K, RE Carter, MC Feller, Q Wang 1989 Relations between
site index, salal, plant communities, and sites in coastal Douglas-fir
ecosystems. Northwest Sci 63:19–28.
Leakey ADB, JD Scholes, MC Press 2004 Physiological and ecolog-
ical significance of sunflecks for dipterocarp seedlings. J Exp Bot 56:
469–482.
Lei TT, T Koike 1998 Some observations of phenology and ecophys-
iology of Daphne kamtschatica Maxim. Var. Jezoensis (Maxim.)
Ohwi, a shade deciduous shrub, in the forest of northern Japan.
J Plant Res 111:207–212.
Lei TT, ET Nilsen, SW Semones 2006 Light environment under
Rhododendron maximum thickets and estimated carbon gain of
regenerating forest tree seedlings. Plant Ecol 184:143–156.Lei TT, SW Semones, JF Walker, BD Clinton, ET Nilsen 2002 Effects
of Rhododendron maximum thickets on tree seed dispersal, seedling
morphology, and survivorship. Int J Plant Sci 163:991–1000.
Madsen P, K Hahn 2008 Natural regeneration in a beech-dominated
forest managed by close-to-nature principles: a gap cutting based
experiment. Can J For Res 38:1716–1729.
Mallik AU 2003 Conifer regeneration problems in boreal and
temperate forests with ericaceous understory: role of disturbance,
seedbed limitation, and keystone species change. Crit Rev Plant Sci
22:341–366.
Messaoud Y, G Houle 2006 Spatial patterns of tree seedling estab-
lishment and their relationship to environmental variables in a cold
temperate deciduous forest of eastern North America. Plant Ecol
185:319–331.Messier C 1993 Factors limiting early growth of western redcedar,
western hemlock and sitka spruce seedlings on ericaceous domi-
nated clear cut sites in coastal British Columbia. For Ecol Manag
60:181–206.
Messier C, TW Honer, JP Kimmins 1989 Photosynthetic photon flux
density, red : far-red ratio, and minimum light requirement for
survival of Gaultheria shallon in western redcedar–western hemlock
stands in coastal British Columbia. Can J For Res 19:1470–1477.
Mitchell RJ, RH Marrs, MG Le Duc, MHD Auld 1997 A study of
succession on lowland heaths in Dorset, southern England: changes in
vegetation and soil chemical properties. J Appl Ecol 34:1426–1444.
Monk CD, DT McGinty, FP Day 1985 The ecological importance of
Kalmia latifolia and Rhododendron maximum in the deciduous
forest of the southern Appalachians. Bull Torrey Bot Club 112:
187–193.
Montgomery RA, TJ Givnish 2008 Adaptive radiation of photosyn-
thetic physiology in the Hawaiian lobeliads: dynamic photosyn-
thetic responses. Oecologia 155:455–467.
Nakashizuka T 1987 Regeneration dynamics of beech forests in
Japan. Vegetatio 69:169–175.
Naramoto M, Q Han, Y Kakubari 2001 The influence of previous
irradianceonphotosynthetic induction in three species grownin the gap
and understory of a Fagus crenata forest. Photosynthetica 39:545–552.
Naumburg E, DS Ellsworth 2000 Photosynthesis sunfleck utilization
potential of understory saplings growing under elevated CO2 in
FACE. Oecologia 122:163–174.
——— 2002 Short term light and leaf photosynthetic dynamics
affect estimates of daily understory photosynthesis in four tree
species. Tree Physiol 22:393–401.
Naumburg E, DS Ellsworth, GG Katul 2001a Modeling dynamic
understory photosynthesis of contrasting species in ambient and
elevated carbon dioxide. Oecologia 126:487–499.
Naumburg E, DS Ellsworth, RW Pearcy 2001b Crown carbon gain
and elevated [CO2] responses of understorey saplings with differing
allometry and architecture. Funct Ecol 15:263–273.Nicotra AB, RL Chazdon, SVB Iriarte 1999 Spatial heterogeneity of
light and woody seedling regeneration in tropical wet forests.
Ecology 80:1908–1926.Nilsen ET, BD Clinton, TT Lei, OK Miller, SW Semones, JF
Walker 2001 Does Rhododendron maximum L. (Ericaceae) reduce
the availability of resources above and belowground for canopy tree
seedlings? Am Midl Nat 145:325–343.
Pearcy RW, O Bjorkman, MM Caldwell, JE Keeley, RK Monson, BR
Strain 1987 Carbon gain by plants in natural environments.
BioScience 37:21–29.
Pearcy RW, K Osteryoung, HW Calkin 1985 Photosynthetic re-
sponse to dynamic light environments by Hawaiian trees. Plant
Physiol 79:896–902.
Pearcy RW, WM Yang 1996 A three-dimensional crown architecture
model for assessment of light capture and carbon gain by under-
story plants. Oecologia 108:1–12.
Pfitsch WA, RW Pearcy 1989 Daily carbon gain by Adenocaulon
746 INTERNATIONAL JOURNAL OF PLANT SCIENCES
bicolor (Asteraceae), a redwood forest understory herb, in relationto its light environment. Oecologia 80:465–470.
Royo AA, WP Carson 2006 On the formation of dense understory
layers in forests worldwide: consequences and implications forforest dynamics, biodiversity, and succession. Can J For Res 36:
1345–1362.
——— 2008 Direct and indirect effects of a dense understory on tree
seedling recruitment in temperate forests: habitat-mediated preda-tion versus competition. Can J For Res 38:1634–1645.
Runkle JR 1990 Gap dynamics in an Ohio Acer-Fagus forest and
speculations on the geography of disturbance. Can J For Res 20:
632–641.Sack L, PJ Grubb 2002 The combined impacts of deep shade and
drought on the growth and biomass allocation of shade-tolerant
woody seedlings. Oecologia 131:175–185.Shure DJ, DL Phillips, PE Bostick 2006 Gap size and succession in
cutover southern Appalachian forests: an 18 year study of vegeta-
tion dynamics. Plant Ecol 185:299–318.
Swank W, D Crossley 1988 Forest hydrology and ecology at Co-weeta. Springer, New York.
Taylor AH, ZS Qin 1992 Tree regeneration after bamboo dieback inChinese Abies-Betula forests. J Veg Sci 3:253–260.
Veblen TT 1989 Tree regeneration responses to gaps along a trans-
andean gradient. Ecology 70:541–543.Walker JF, OK Miller 2002 Ectomycorrhizal sporophore distribu-
tions in a southeastern Appalachian mixed hardwood/conifer forest
with thickets of Rhododendron maximum. Mycologia 94:221–229.
Walker JF, OK Miller, JL Horton 2008 Seasonal dynamics of ecto-mycorrhizal fungus assemblages on oak seedlings in the southeast-
ern Appalachian mountains. Mycorrhiza 18:123–132.
Walters MB, PB Reich 1996 Are shade tolerance, survival, and growth
linked? low light and nitrogen effects on hardwood seedlings.Ecology 77:841–853.
Wurzburger N, RL Hendrick 2006 Rhododendron thickets alter N
cycling and soil extracellular enzyme activities in southern Appa-lachian hardwood forests. Pedobiologia 50:563–576.
Yeakley JA, WT Swank, LW Swift, GM Hornberger, HH Shugart 1998
Soil moisture gradients and controls on a southern Appalachian
hillslope from drought through recharge. Hydrol Earth Syst Sci 2:41–49.
747NILSEN ET AL.—UNDERSTORY SHRUBS AND SUNFLECK RESPONSE