Embed Size (px)
Citation preview
Preparation of Activated Carbon: Forest residues
activated with Phosphoric Acid and Zinc Sulfate
MSc. thesis
Daniella Birbas
Department of Chemical Engineering
Royal Institute of Technology (KTH)
Stockholm, Sweden
April 2011
Preparation of Activated Carbon: Forest residues
activated with Phosphoric Acid and Zinc Sulfate
MSc. thesis
Daniella Birbas
Supervisors
Rolando Zanzi Vigouroux
Department of Chemical Engineering
Royal Institute of Technology (KTH)
Stockholm, Sweden
Francisco Márquez Montesino
Facultad de Forestal y Agronomia
Departamento de Química
Universidad de Pinar del Río ¨Hermanos Saiz Montes de Oca¨
Pinar del Río, Cuba
Examiner
Joaquín Martínez
Department of Chemical Engineering
Royal Institute of Technology (KTH)
Stockholm, Sweden
April 2011
2
ABSTRACT
Activated carbon is a highly adsorbing material and has various scopes of uses depending on needs. It is used in many industries and applications e.g. to clean industrial wastewater, in medicine, discolor sugar and so on. What makes AC such a good adsorbent is its porous structure which gives it a high surface area. This report consists of three parts; general information about Activated Carbon (AC) and its characteristics, to give the reader a sufficient background about AC for continuous understanding throughout the report, an experimental investigation in chemical activation of carbon with phosphoric acid as the chemical reagent and sawdust from both Cuban and Swedish Pine tree as precursors, and a second experimental investigation in chemical activation of carbon with Zinc Sulfate as the chemical reagent and sawdust from Cuban Pine tree as the precursor. For the first experimental part as well as for the second the objective is how to best combine the three parameters; acid concentration, impregnation ratio and activation temperature in order to get the best adsorption performance when preparing activated carbon with different precursor specimens and chemical reagents. The experiments with phosphoric acid activation show that treatment with 40% acid concentration at 400 °C produce an activated carbon with good properties for ammonia adsorption and good iodine number. If a 30% phosphoric acid is used for activation, an activation temperature of 500 °C is recommended. With an impregnation ratio of 1, good adsorption was obtained in the activated carbon produced from Swedish pine while using Cuban pine a higher adsorption was obtained with an impregnation ratio of 2. The experiments with Zinc Sulfate activation show that influence of the sulfate concentration (between 10 % and 40 %) and temperature (between 400 °C and 500°C) on the properties for ammonia adsorption in the produced activated carbon was considerable for low impregnation ratio (0.5 and 1). In general, activation conditions of 20% zinc sulfate concentration, 400 °C and impregnation ratio: 1 are enough to produce an activated carbon with good properties for ammonia adsorption. The adsorption of carbon tetrachloride was lower. Activated carbons produced with 10 % zinc sulfate concentration, 0.5 impregnation ratio and 400 °C activation temperature (the mildest studied conditions) show already good iodine number and BET surface area. The main conclusion from the thesis work is that the optimal conditions vary widely with wanted results. Therefore a suggestion for future work is to narrow the research to fewer variables and more repetition of the samples.
3
SAMMANFATTNING
Aktivt kol är ett mycket absorberande material och har många olika användningsområden beroende på behov. Det används i olika industrier och applikationer, t.ex. för att rena industriellt vatten, inom medicin, avfärga socker osv. Det som gör aktivt kol till en så bra absorbent är dess porösa struktur vilket ger det en stor ytarea. Den här rapporten består av tre delar; generell information om aktivt kol och dess egenskaper för att ge läsaren tillräckligt med bakgrund och förståelse genom hela rapporten, en experimentell undersökning i kemisk aktivering av kol med fosforsyra som reagens och sågspån från både kubansk och svensk tall som grundsubstanser, samt en undersökning i kemisk aktivering av kol med zinksulfat som kemisk reagens och kubansk tall som grundsubstans. För den första experimentella delen, såsom för den andra, så är syftet att undersöka hur man bäst kombinerar de tre parametrarna syrakoncentration, impregneringsförhållande och aktiveringstemperatur, för att få bästa möjliga prestanda vid preparering av aktivt kol med olika grundsubstanser och kemiska reagenser. Experimenten med aktivering med fosforsyra visar på att impregnering med 40-procentig syra och en temperatur på 400 °C genererar ett aktivt kol med goda egenskaper för adsorbering av ammoniak samt ett högt jodnummer. Vid användning av 30-procentig fosforsyra genererar 500 °C bäst resultat. Med impregneringsförhållandet 1 fås goda adsorberingsegenskaper för svensk tall men för kubansk tall erhålls högre adsorptionsförmåga vid impregneringsförhållandet 2. Experimenten gjorda med zinksulfat som kemisk reagens visar stora variationer i ammoniakadsorption vid låga impregneringsförhållanden (0,5-1) när sulfatkoncentrationen (10-40%) och temperatur (400-500°C) varieras. Generellt så räcker det med vid 20-procentig sulfat och 400 °C aktiveringstemperatur för en bra ammoniakadsorption. Adsorption av tetraklorid är dock lägre. Redan vid de mest milda omständigheterna (10% och 400 °C) så erhölls goda värden på jodnummer och BET ytarea. Den överhängande slutsatsen av undersökningarna är dock att optimala omständigheter varierar vitt med omständigheter och analysmetod. Därför ges också förslaget att för kommande undersökningar begränsa experimenten till färre variabler och fler repetitioner av proven.

4
ACKNOWLEDGEMENT
I wish to express my sincere gratitude to my supervisor Prof. Rolando A Zanzi Vigouroux for his
constant support, general guidance and 100 percent availability when I needed him. I also would
like to thank Frank Marquez for administrative and organizational support as well as supervision
while at The University of Pinar del Rio. Special thanks go to Frank Marquez son, also named
Frank, for welcoming me at the university in Pinar and for his support throughout this project
helping me with numerous things, everything from speaking Spanish to finding the fruitmarket.
Of course I wish to send a huge thanks to all my newly found friends at the university who talked
to me when I understood nothing, understood me when I couldn't speak and helped me with my
everyday life in the fantastic country Cuba, which is so different from what I'm use to. Last but
not least I would like to thank Maria Molander, who worked with me on the first experimental part
of this project, for an efficient, constructive and motivating working atmosphere.

5
Contents
ABSTRACT 2
SAMMANFATTNING 3
ACKNOWLEDGEMENT 4
1. INTRODUCTION 8
1.1 Objective 8
2. BACKGROUND INFORMATION 8
2.1 Activated Carbon 9 2.1.1Physical Activation 9
2.1.2Chemical Activation 9 2.1.3Structure of AC 10
2.2 Specific Reagent &Precursor 11
2.2.1Chemical Reagents 11 2.2.2Precursors 11
3. EXPERIMENTAL 12
3.1 Activation using phosphoric acid 12 3.1.1Production of AC 12
3.1.2Analysis of AC 14 3.2 Activation using zinc suphate 15
3.2.1Analysis of sawdust composition 15 3.2.2Production of AC 16
3.2.3Analysis of AC 18
4. RESULTS AND DISCUSSION 19
4.1 Activation using phosphoric acid 19
4.1.1Gas Adsorption 19 4.1.2Iodine Number 20 4.1.3Discussion 21
4.1.4Iodine Number 24 4.2 Activation using zinc sulphate 28
4.2.1Sawdust Composition 28
4.2.2Yield 28
4.2.3Gas Adsorption 29 4.2.4Iodine Number 31 4.2.5BET-Analysis 32
4.2.6Discussion . 33
5. CONCLUSIONS 43
6. CONTINUED WORK 46
6
7. REFERENCES 47
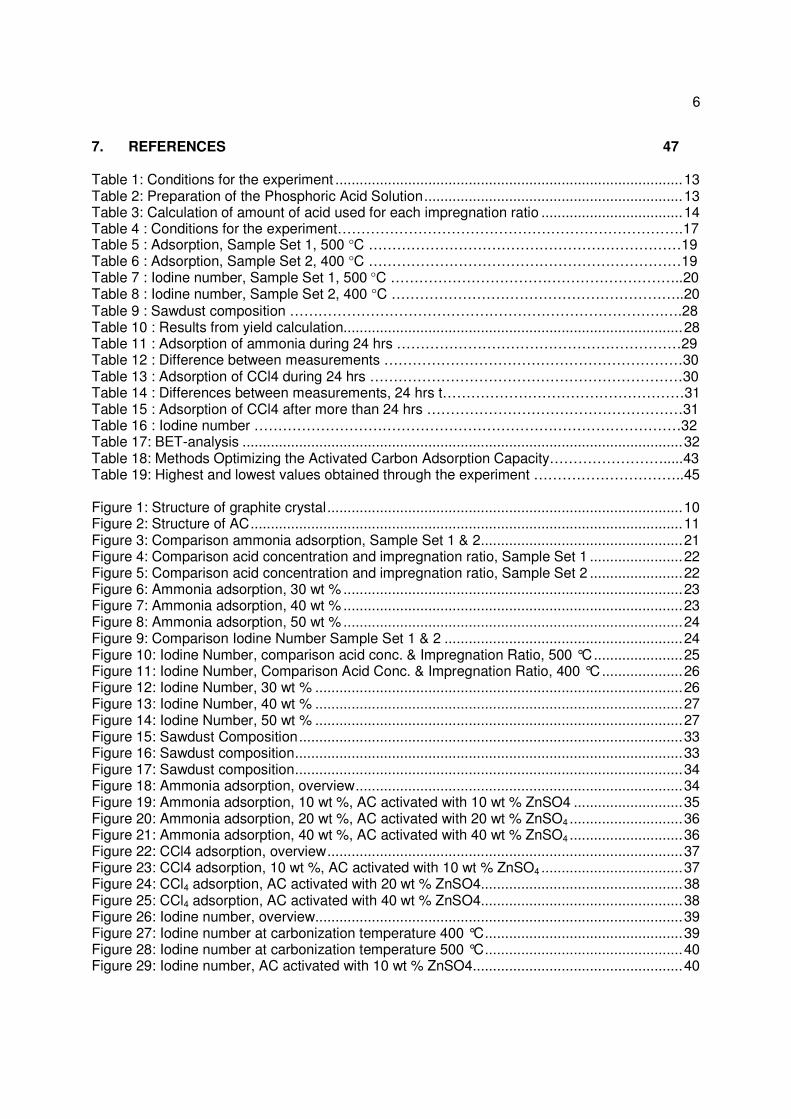
Table 1: Conditions for the experiment ...................................................................................... 13
Table 2: Preparation of the Phosphoric Acid Solution ................................................................ 13 Table 3: Calculation of amount of acid used for each impregnation ratio ................................... 14 Table 4 : Conditions for the experiment……………………………………………………………….17 Table 5 : Adsorption, Sample Set 1, 500 °C …………………………………………………………19 Table 6 : Adsorption, Sample Set 2, 400 °C …………………………………………………………19 Table 7 : Iodine number, Sample Set 1, 500 °C ……………………………………………………..20 Table 8 : Iodine number, Sample Set 2, 400 °C ……………………………………………………..20 Table 9 : Sawdust composition …………………………………………………………………….….28 Table 10 : Results from yield calculation.................................................................................... 28 Table 11 : Adsorption of ammonia during 24 hrs ……………………………………………………29 Table 12 : Difference between measurements ………………………………………………………30 Table 13 : Adsorption of CCl4 during 24 hrs …………………………………………………………30 Table 14 : Differences between measurements, 24 hrs t……………………………………………31 Table 15 : Adsorption of CCl4 after more than 24 hrs ………………………………………………31 Table 16 : Iodine number ………………………………………………………………………………32 Table 17: BET-analysis ............................................................................................................. 32 Table 18: Methods Optimizing the Activated Carbon Adsorption Capacity…………………….....43 Table 19: Highest and lowest values obtained through the experiment …………………………..45
Figure 1: Structure of graphite crystal ........................................................................................ 10 Figure 2: Structure of AC ........................................................................................................... 11
Figure 3: Comparison ammonia adsorption, Sample Set 1 & 2 .................................................. 21 Figure 4: Comparison acid concentration and impregnation ratio, Sample Set 1 ....................... 22
Figure 5: Comparison acid concentration and impregnation ratio, Sample Set 2 ....................... 22 Figure 6: Ammonia adsorption, 30 wt % .................................................................................... 23 Figure 7: Ammonia adsorption, 40 wt % .................................................................................... 23
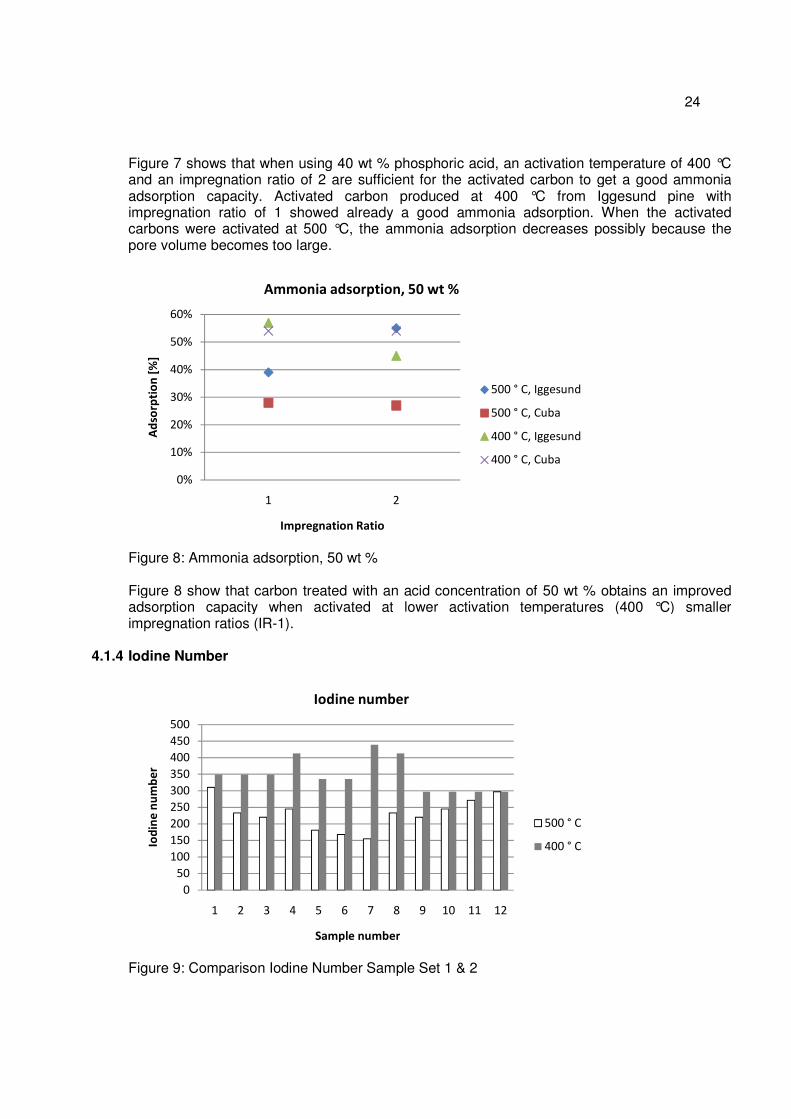
Figure 8: Ammonia adsorption, 50 wt % .................................................................................... 24
Figure 9: Comparison Iodine Number Sample Set 1 & 2 ........................................................... 24
Figure 10: Iodine Number, comparison acid conc. & Impregnation Ratio, 500 °C ...................... 25 Figure 11: Iodine Number, Comparison Acid Conc. & Impregnation Ratio, 400 °C .................... 26 Figure 12: Iodine Number, 30 wt % ........................................................................................... 26
Figure 13: Iodine Number, 40 wt % ........................................................................................... 27
Figure 14: Iodine Number, 50 wt % ........................................................................................... 27
Figure 15: Sawdust Composition ............................................................................................... 33 Figure 16: Sawdust composition ................................................................................................ 33
Figure 17: Sawdust composition ................................................................................................ 34 Figure 18: Ammonia adsorption, overview ................................................................................. 34
Figure 19: Ammonia adsorption, 10 wt %, AC activated with 10 wt % ZnSO4 ........................... 35
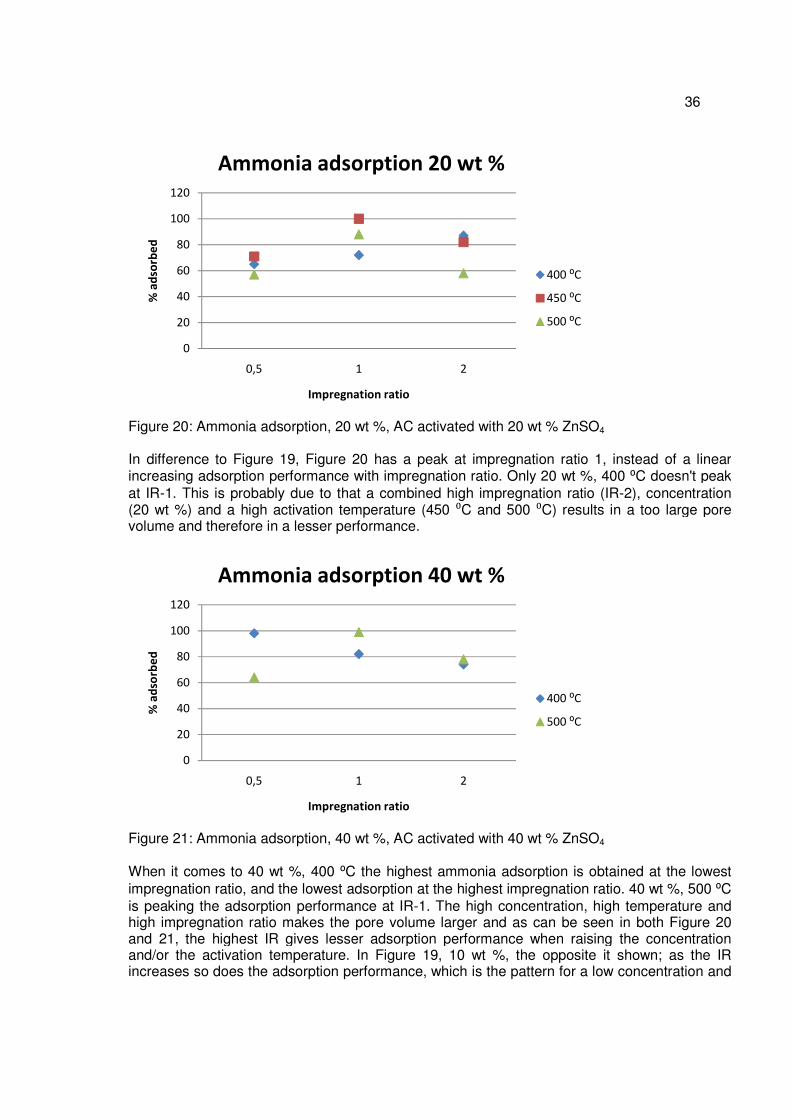
Figure 20: Ammonia adsorption, 20 wt %, AC activated with 20 wt % ZnSO4 ............................ 36 Figure 21: Ammonia adsorption, 40 wt %, AC activated with 40 wt % ZnSO4 ............................ 36
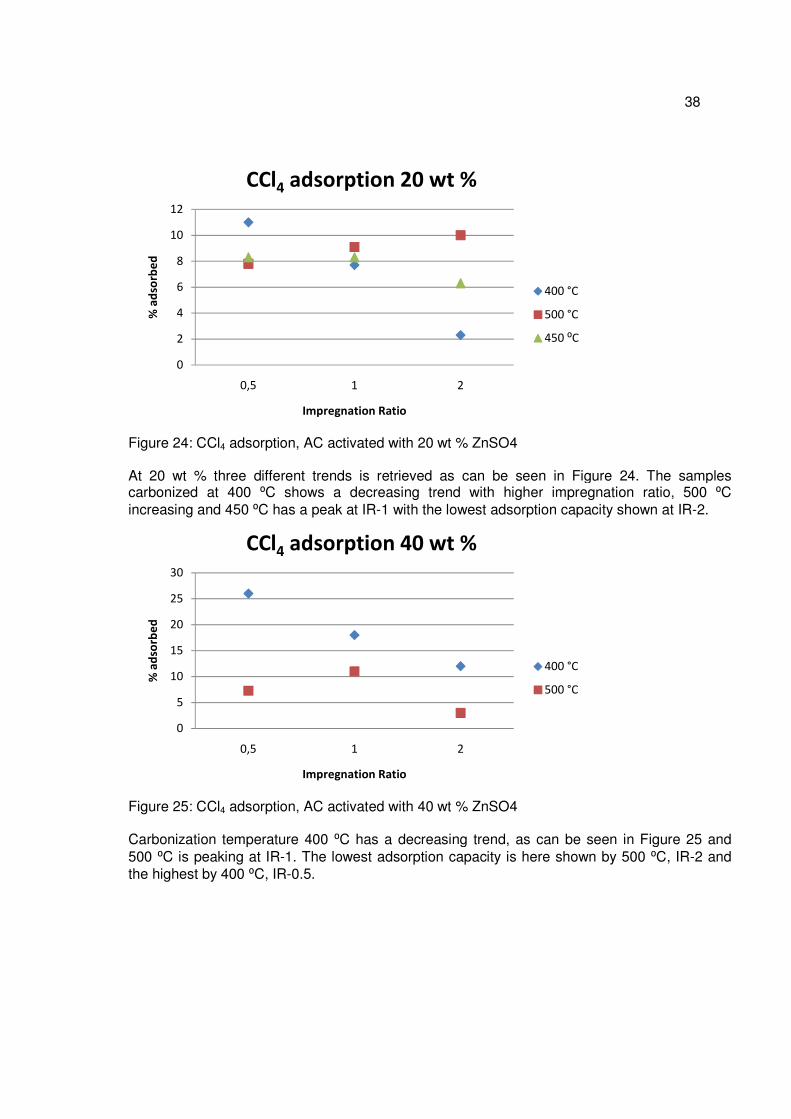
Figure 22: CCl4 adsorption, overview ........................................................................................ 37 Figure 23: CCl4 adsorption, 10 wt %, AC activated with 10 wt % ZnSO4 ................................... 37 Figure 24: CCl4 adsorption, AC activated with 20 wt % ZnSO4.................................................. 38
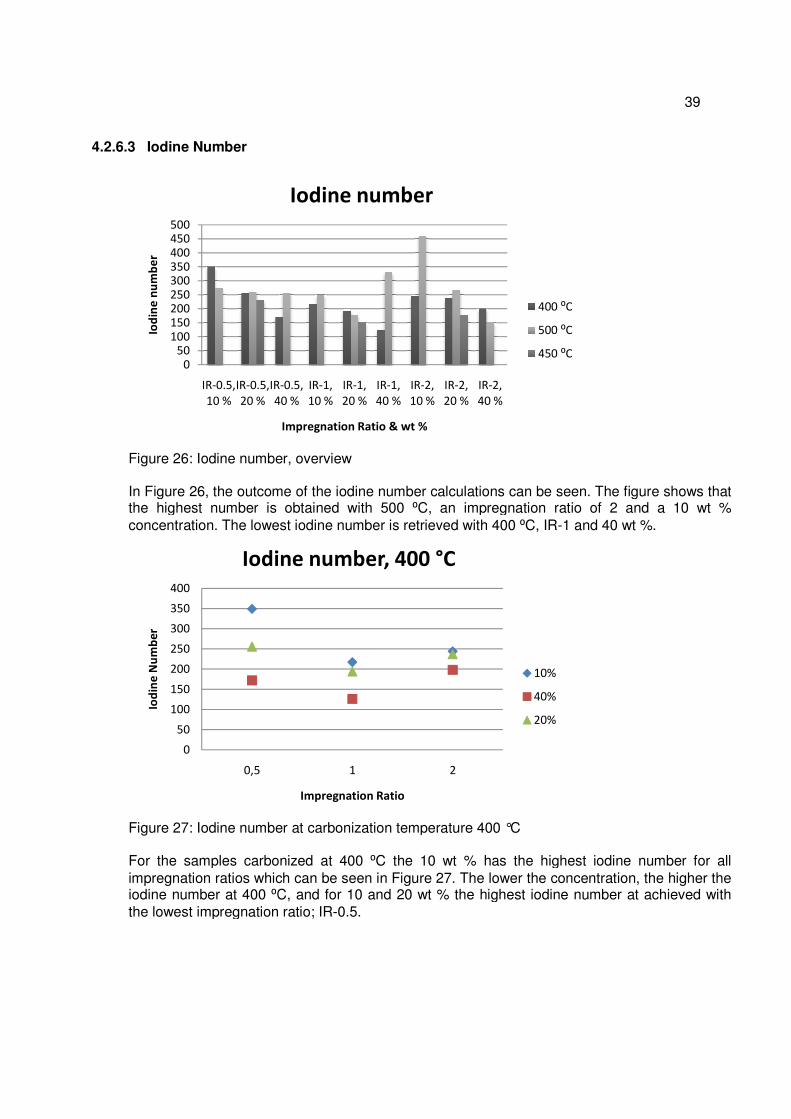
Figure 25: CCl4 adsorption, AC activated with 40 wt % ZnSO4.................................................. 38 Figure 26: Iodine number, overview ........................................................................................... 39
Figure 27: Iodine number at carbonization temperature 400 °C ................................................. 39 Figure 28: Iodine number at carbonization temperature 500 °C ................................................. 40 Figure 29: Iodine number, AC activated with 10 wt % ZnSO4 .................................................... 40

7
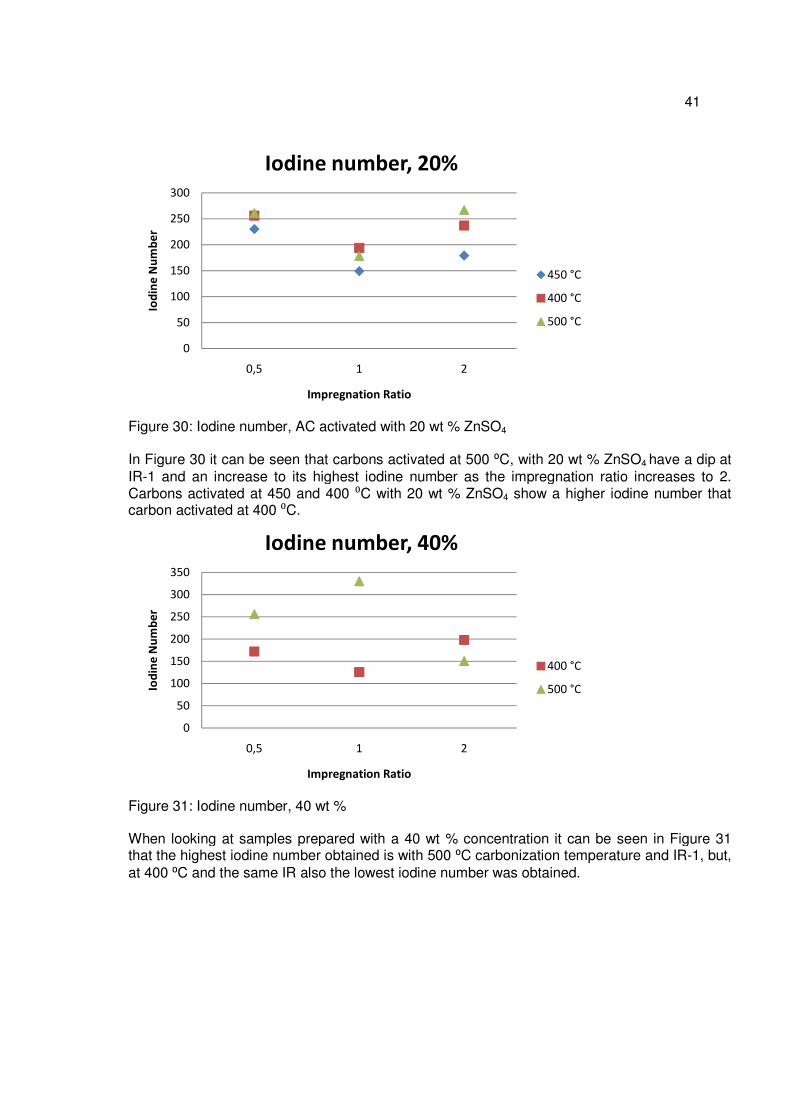
Figure 30: Iodine number, AC activated with 20 wt % ZnSO4 .................................................... 41
Figure 31: Iodine number, 40 wt % ............................................................................................ 41 Figure 32: BET surface area, overview ...................................................................................... 42
Figure 33: BET surface area, 10 wt % ....................................................................................... 42 Figure 34: Total pore volume ..................................................................................................... 43
8
1. INTRODUCTION
This thesis work is a product of cooperation between The University of Pinar del Rio, in the west of Cuba and The Royal Institute of Technology (KTH), Sweden. Further it was partly financed by a scholarship from the Swedish International Development Cooperation Agency (SIDA), called MFS, Minor Field Studies. The report contains several experiments in chemical production of activated carbon. Activated Carbon is a form of carbon that has been processed in order to make it extremely porous and thus to have a very large surface area available for adsorption or chemical reactions. It has many applications in today’s society in areas like gas purification, gold purification, water purification, medicine, air filters in gas masks and so on. One gram of activated carbon can have a surface area f more than 500 m2, with 1500 m2 being well achievable. Wood is the most commonly used precursor for chemical activation. The report consists of three parts; general information about Activated Carbon (AC) and its characteristics, to give the reader a sufficient background about AC for continuous understanding throughout the report, an experimental investigation in chemical activation of carbon with phosphoric acid as the chemical reagent and sawdust from both Cuban and Swedish Pine tree as precursors, and a second experimental investigation in chemical activation of carbon with Zinc Sulfate as the chemical reagent and sawdust from Cuban Pine tree as the precursor. The first experiment was conducted entirely at KTH and the second experimental part was mostly performed at the University of Pinar del Rio in Cuba. As not all equipment and substances was available, some parts, in analyzing the AC in Experiment 2, were conducted at KTH as well. As the experimental process differs significantly between the two experiments they are described, discussed and concluded in individual chapters.
1.1 Objective
For the first experimental part as well as for the second the objective is how to best combine the three parameters; acid concentration, impregnation ratio and activation temperature in order to get the best adsorption performance when preparing activated carbon with different precursor specimens and chemical reagents.
2. BACKGROUND INFORMATION
For a good understanding of the information presented in this project, a short and general part, providing the reader with some background facts, is here presented.
9
2.1 Activated Carbon
Activated carbon is a highly adsorbing material and has various scopes of uses depending on needs. It´s used in many industries and applications e.g. to clean industrial wastewater, in medicine, discolor sugar and so on. What makes AC such a good adsorbent is its porous structure which gives it a high surface area; one kilogram of AC can have approximately 4000 square meters of surface area (Kan-Carbon Private Limited, 2011). The size of the pores is determining what type of usage the AC is suitable for. Anything that has a carbon content can be made to activated carbon, and depending on different aspects such as economy and characteristics of the material it might be suitable or not for manufacturing of AC. In the process of manufacturing AC there are two methods of activation, physical and chemical. When activating chemically the carbonization and activation happens simultaneously. For carbonization the carbonaceous material is heated in the absence of oxygen, also called pyrolysis. In this process most of the oxygen, hydrogen and volatiles are eliminated, leaving the carbon groups structured so that pores are present giving the adsorbing characteristic of the carbon. After the raw material has been carbonized it needs to be activated, when activated the pore structure gets enhanced increasing the adsorbing qualities further by enlarging the pores and burning off tars. A description of physical and chemical activation follows. (Bansal et al 1988)
2.1.1 Physical Activation
There are two steps in the activation process when coming to physical activation. The first one is heat treatment in an inert environment, pyrolysis. This is done at a temperature of about 1100 ⁰C. In this process the volatile matters leave the material and mostly carbon in form of char is left, with an initial carbonaceous structure. The second step is the activation, then a gas stream of carbon dioxide and steam treats the char and by oxidizing with the carbon creating pores in the material. (Bansal et al 1988) Advantages and disadvantages with regards to chemical activation are presented in 2.1.2 Chemical Activation.
2.1.2 Chemical Activation
When the raw material is wood it is more common to use chemical activation. The raw material is first impregnated with the activating reagent, which degrades the cellulosic material. This enables the precursor to carbonize at lower temperatures. Chemical activation is preferred over physical activation because of the lower temperatures and shorter time needed in activating the material. After the impregnation, in absence of air, the impregnated material is then heated in a rotary kiln between 400 and 800 ⁰C. After the activation the material is cooled, washed and dried. The most commonly used activating agents are phosphoric acid, zinc chloride and sulfuric acid. The pore size in the carbon is set by the impregnation ratio; the larger the impregnation ratio the larger the pore diameter becomes. The characteristics of the AC obtained vary with impregnation ratio, activation temperature and composition of the gas used for heating.
10
Some advantages of chemical activation versus physical activation are
• It generally gives a more porous structure • Gives a higher yield • Needs lower activation temperature
The impregnation gives a few disadvantages, such as:
• Cost of reactant • Environmentally unfriendly properties of the reactant • Need of washing off the reactant
(Bansal et al 1988)
2.1.3 Structure of AC
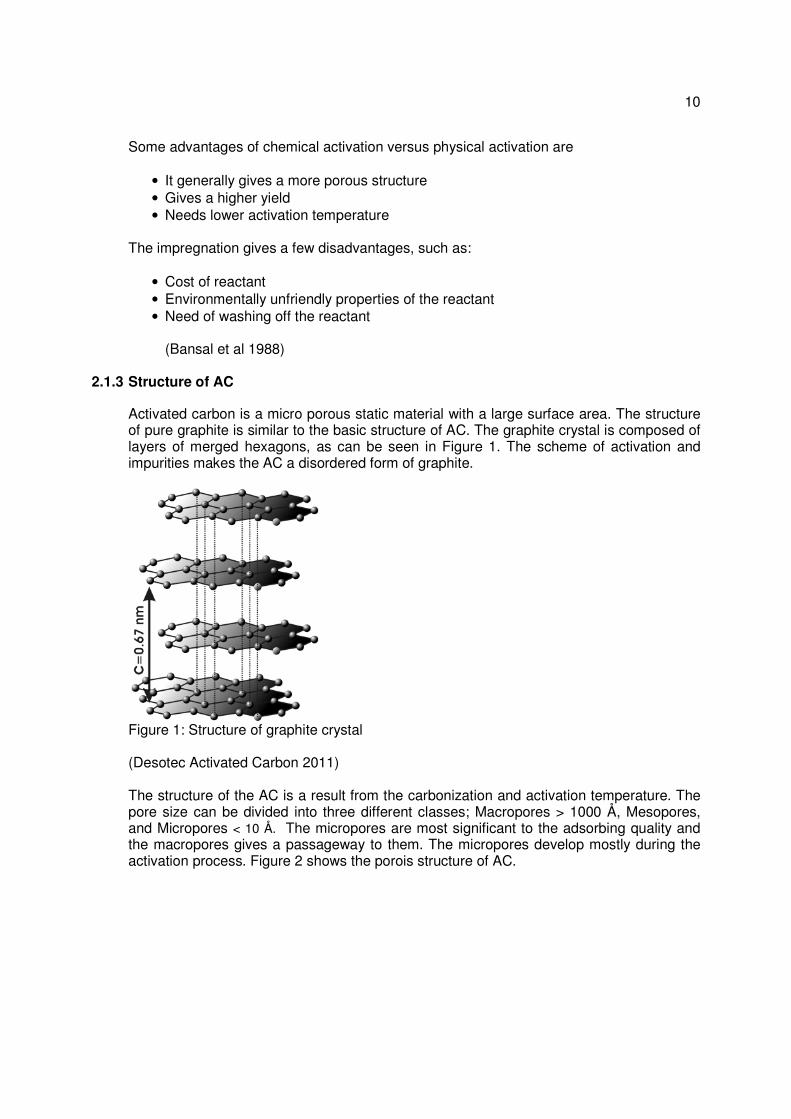
Activated carbon is a micro porous static material with a large surface area. The structure of pure graphite is similar to the basic structure of AC. The graphite crystal is composed of layers of merged hexagons, as can be seen in Figure 1. The scheme of activation and impurities makes the AC a disordered form of graphite.
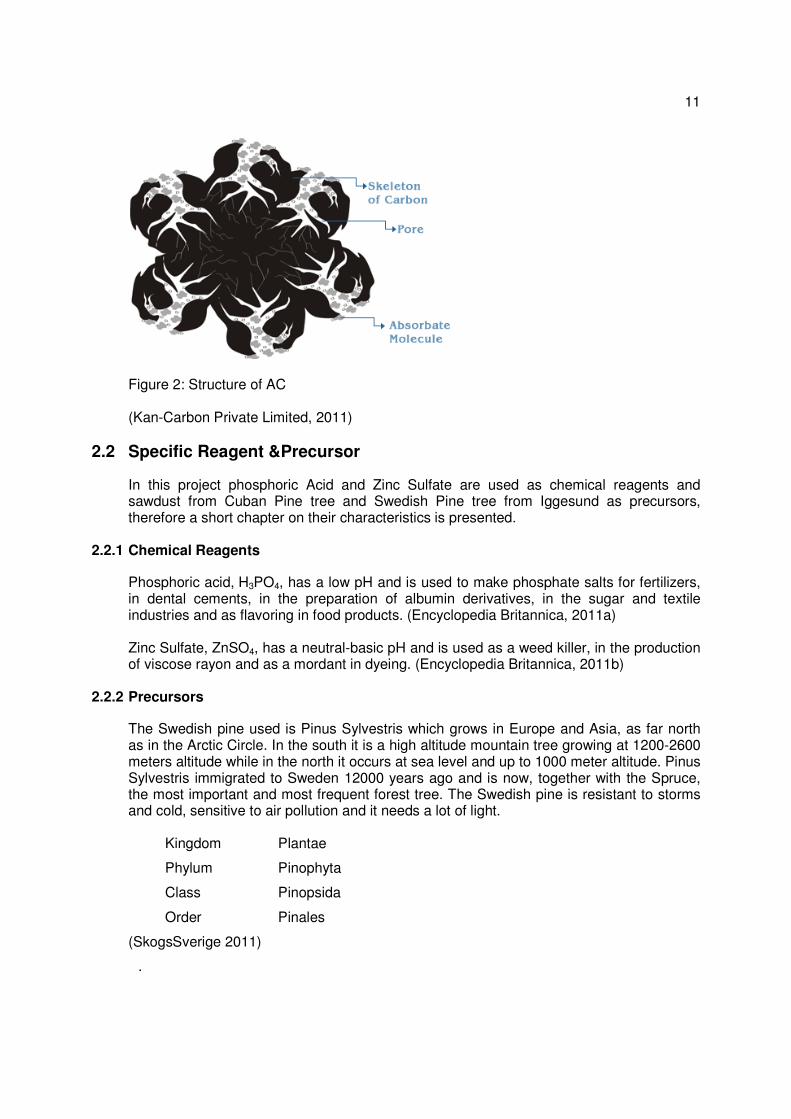
Figure 1: Structure of graphite crystal (Desotec Activated Carbon 2011) The structure of the AC is a result from the carbonization and activation temperature. The pore size can be divided into three different classes; Macropores > 1000 Å, Mesopores, and Micropores < 10 Å. The micropores are most significant to the adsorbing quality and the macropores gives a passageway to them. The micropores develop mostly during the activation process. Figure 2 shows the porois structure of AC.
11
Figure 2: Structure of AC (Kan-Carbon Private Limited, 2011)
2.2 Specific Reagent &Precursor
In this project phosphoric Acid and Zinc Sulfate are used as chemical reagents and sawdust from Cuban Pine tree and Swedish Pine tree from Iggesund as precursors, therefore a short chapter on their characteristics is presented.
2.2.1 Chemical Reagents
Phosphoric acid, H3PO4, has a low pH and is used to make phosphate salts for fertilizers, in dental cements, in the preparation of albumin derivatives, in the sugar and textile industries and as flavoring in food products. (Encyclopedia Britannica, 2011a) Zinc Sulfate, ZnSO4, has a neutral-basic pH and is used as a weed killer, in the production of viscose rayon and as a mordant in dyeing. (Encyclopedia Britannica, 2011b)
2.2.2 Precursors
The Swedish pine used is Pinus Sylvestris which grows in Europe and Asia, as far north as in the Arctic Circle. In the south it is a high altitude mountain tree growing at 1200-2600 meters altitude while in the north it occurs at sea level and up to 1000 meter altitude. Pinus Sylvestris immigrated to Sweden 12000 years ago and is now, together with the Spruce, the most important and most frequent forest tree. The Swedish pine is resistant to storms and cold, sensitive to air pollution and it needs a lot of light.
Kingdom Plantae
Phylum Pinophyta
Class Pinopsida
Order Pinales
(SkogsSverige 2011)
.
12
Cuba has four species of pine trees and two regions with pine tree forests. One region is located in the west with mainly Caribbean pine (Ambrosio U, D. 2011). The Caribbean Pine, Pinus Caribaea, is a hard pine which inhabits tropical and subtropical coniferous forests, lowlands and mountain forests. (Barrett & Golf 1962): The type of Caribbean Pine growing in Cuba has been red listed as vulnerable specie due to burning and logging pine forests.
Kingdom Plantae
Phylum Tracheophyta
Class Coniferopsida
Order Coniferales
(Conifer Specialist Group 1998)
3. EXPERIMENTAL
3.1 Activation using phosphoric acid
The activated carbon is prepared chemically using phosphoric acid as chemically reactant and two granular wood specimens as precursor, Cuban Pine wood and Swedish pine tree from Iggesund. The activated carbons adsorption capacity analyses will be done based on varying impregnation ratio (IR), acid concentration, activation temperature (T) and precursor specimen. The precursor, wood particles from Cuba, and Iggesund differs somewhat in granular size, dryness and texture. This makes it likely for them to show different adsorption performance with different preparation.
3.1.1 Production of AC
The samples produced and analyzed with properties can be seen in Table 1. Sample 1 to 12 was repeated for 500 °C in Sample Set 1 and 400 °C in Sample Set 2. The first step in the chemical activation process is to prepare twelve different samples, each containing of 1 gram of wood particles, distributed as in table 1 i.e. six with Cuban Pine wood and six with Swedish Pine tree from Iggesund. Next the samples are dried in an electrical oven at 100 °C for 24 hours. For this experiment the wood was already dried and prepared. The samples are prepared by mixing an activating agent, in this case phosphoric acid (30, 40 and 50 wt %), with the pre dried wood particles. The required amount of phosphoric acid is based on the dry weight of the sampled wood particles and the dry weight of the phosphoric acid. The impregnation ratio that is used for chemical activation is 1 and 2. When the phosphoric acid has been stirred and worked into the granular the mixture of phosphoric acid and wood is left to soak overnight so that the reagents are fully absorbed by the precursor.
13
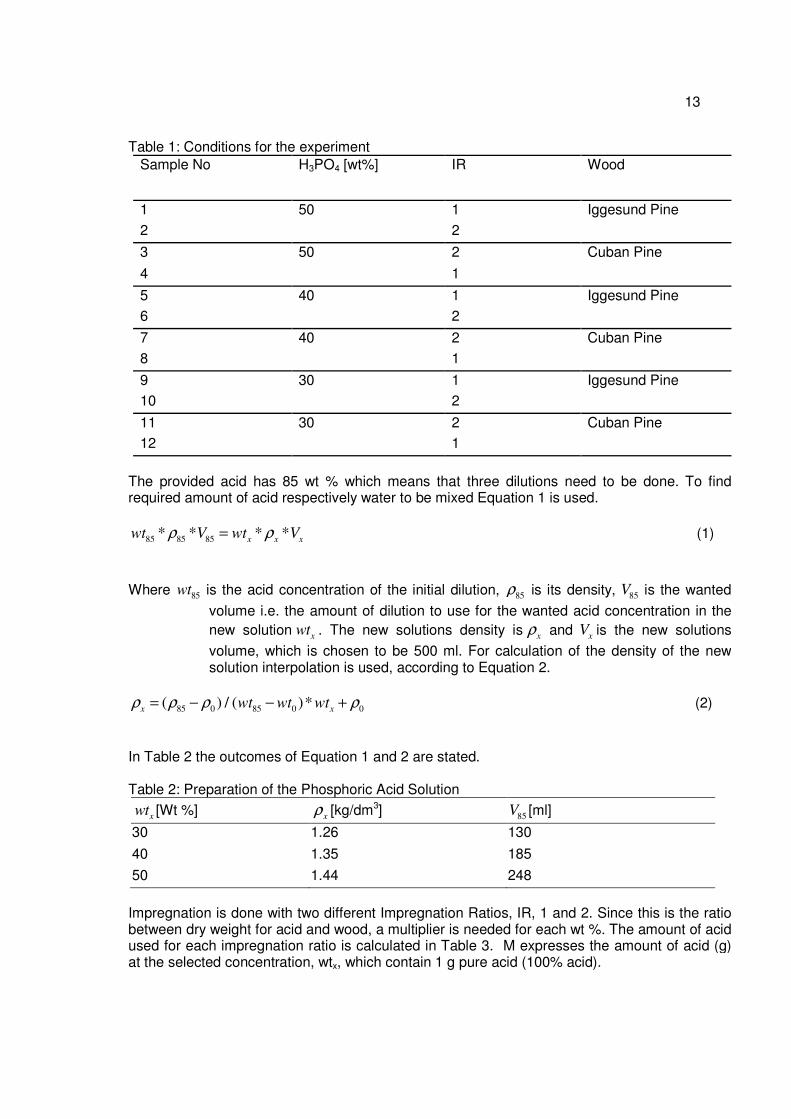
Table 1: Conditions for the experiment Sample No H3PO4 [wt%] IR Wood
1 50 1 Iggesund Pine 2 2
3 50 2 Cuban Pine
4 1
5 40 1 Iggesund Pine 6 2
7 40 2 Cuban Pine 8 1
9 30 1 Iggesund Pine 10 2
11 30 2 Cuban Pine 12 1
The provided acid has 85 wt % which means that three dilutions need to be done. To find required amount of acid respectively water to be mixed Equation 1 is used.
85 85 85* * * *
x x xwt V wt Vρ ρ= (1) Where
85wt is the acid concentration of the initial dilution,
85ρ is its density,
85V is the wanted
volume i.e. the amount of dilution to use for the wanted acid concentration in the new solution
xwt . The new solutions density is
xρ and
xV is the new solutions
volume, which is chosen to be 500 ml. For calculation of the density of the new solution interpolation is used, according to Equation 2.
85 0 85 0 0( ) / ( )*
x xwt wt wtρ ρ ρ ρ= − − + (2)
In Table 2 the outcomes of Equation 1 and 2 are stated. Table 2: Preparation of the Phosphoric Acid Solution
xwt [Wt %]
xρ [kg/dm3]
85V [ml]
30 1.26 130
40 1.35 185
50 1.44 248
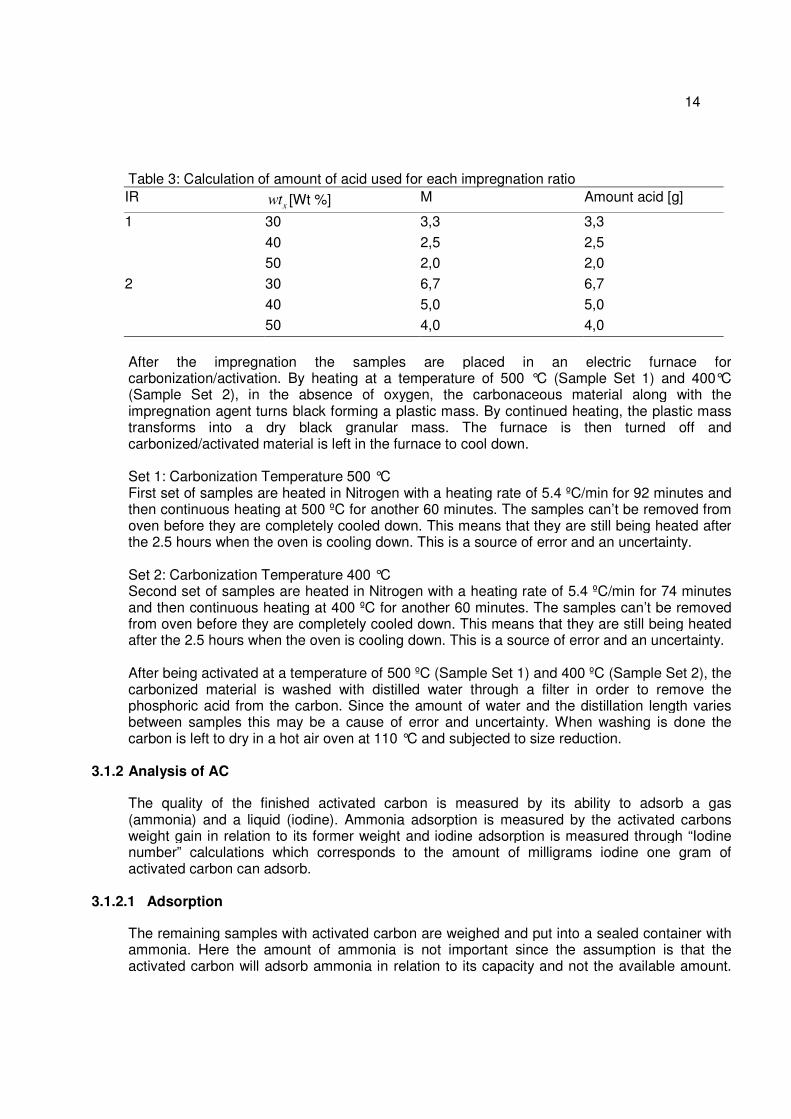
Impregnation is done with two different Impregnation Ratios, IR, 1 and 2. Since this is the ratio between dry weight for acid and wood, a multiplier is needed for each wt %. The amount of acid used for each impregnation ratio is calculated in Table 3. M expresses the amount of acid (g) at the selected concentration, wtx, which contain 1 g pure acid (100% acid).
14
Table 3: Calculation of amount of acid used for each impregnation ratio IR
xwt [Wt %] M Amount acid [g]
1 30 3,3 3,3 40 2,5 2,5 50 2,0 2,0
2 30 6,7 6,7 40 5,0 5,0 50 4,0 4,0
After the impregnation the samples are placed in an electric furnace for carbonization/activation. By heating at a temperature of 500 °C (Sample Set 1) and 400°C (Sample Set 2), in the absence of oxygen, the carbonaceous material along with the impregnation agent turns black forming a plastic mass. By continued heating, the plastic mass transforms into a dry black granular mass. The furnace is then turned off and carbonized/activated material is left in the furnace to cool down. Set 1: Carbonization Temperature 500 °C First set of samples are heated in Nitrogen with a heating rate of 5.4 ºC/min for 92 minutes and then continuous heating at 500 ºC for another 60 minutes. The samples can’t be removed from oven before they are completely cooled down. This means that they are still being heated after the 2.5 hours when the oven is cooling down. This is a source of error and an uncertainty. Set 2: Carbonization Temperature 400 °C Second set of samples are heated in Nitrogen with a heating rate of 5.4 ºC/min for 74 minutes and then continuous heating at 400 ºC for another 60 minutes. The samples can’t be removed from oven before they are completely cooled down. This means that they are still being heated after the 2.5 hours when the oven is cooling down. This is a source of error and an uncertainty. After being activated at a temperature of 500 ºC (Sample Set 1) and 400 ºC (Sample Set 2), the carbonized material is washed with distilled water through a filter in order to remove the phosphoric acid from the carbon. Since the amount of water and the distillation length varies between samples this may be a cause of error and uncertainty. When washing is done the carbon is left to dry in a hot air oven at 110 °C and subjected to size reduction.
3.1.2 Analysis of AC
The quality of the finished activated carbon is measured by its ability to adsorb a gas (ammonia) and a liquid (iodine). Ammonia adsorption is measured by the activated carbons weight gain in relation to its former weight and iodine adsorption is measured through “Iodine number” calculations which corresponds to the amount of milligrams iodine one gram of activated carbon can adsorb.
3.1.2.1 Adsorption
The remaining samples with activated carbon are weighed and put into a sealed container with ammonia. Here the amount of ammonia is not important since the assumption is that the activated carbon will adsorb ammonia in relation to its capacity and not the available amount.
15
After 24 hours it is assumed that the samples have adsorbed all the ammonia they can. Thus the samples are taken out of the container and weighed once more. The weight difference between before wb and after wa adsorption determines the samples adsorption capacity. The adsorption capacity in percentage is obtained by Equation 3. Adsorption [%] = (wa-wb)/ wb (3)
3.1.2.2 Iodine Number
Iodine number is the most fundamental parameter used to characterize activated carbon performance. It is the standard measure for liquid phase applications. Iodine number is defined as the milligrams of iodine adsorbed by one gram of carbon when the iodine concentration in the residual filtrate is 0.02 normal. Basically, iodine number is a measure of the iodine adsorbed in the pores and, as such, is an indication of the pore volume available in the activated carbon of interest. To determine the Iodine number, 0.1 grams of activated carbon from the finished sample is put in to a flask which contains 25 ml of Iodine solution. The sample is then mixed with the iodine solution by circulating the bottle during one minute. After the mixing, the activated carbon-iodine solution is filtered and 10 ml of the filtered solution is put into another bottle using a volumetric pipette. Finally the filtered solution is titrated with sodium thio-sulphate solution 0.04 N until it becomes clear. The Iodine number obtained from Equation 4 is related to the activated carbon pore volume i.e. surface area and represents the number of milligrams iodine one gram of activated carbon can adsorb. Iodine number = v * (Ti –Tf) * Ci * Mi /(Ti * g) (4) where v = 25 ml (ml iodine) Ti = 11.3 ml (ml NaSO4 solution used for titration of 10 ml iodine solution) Tf (ml NaSO4 solution used for titration of 10 ml filtrate solution) g = 0.1 g (weight of the sample in grams) Mi = 126.9044 g/mol (molar weight iodine) Ci = 0.046 N (concentration iodine)
3.2 Activation using zinc suphate
In the experiments involving production of activated carbon using zinc sulphate for aactivation, the selected raw material was sawdust, residues from a Cuban sawmill. The experimental procedures when analyzing the sawdust, producing the activated carbon and finally analyzing the qualities of the produced activated carbon are described in this part, as well as the equations used for calculations.
3.2.1 Analysis of sawdust composition
Three different contents were determined by different methods as described in coming chapters; moisture content, ash content and volatile matter.
16
3.2.1.1 Moisture Content
1. Crucible is weighed empty (B). 2. Crucible is weighed with sawdust (C). 3. Crucible with sawdust is put in the muffle furnace at approximately 103 degrees C for 3 hrs. 4. The sample is left to cool to room temperature in a desiccator. 5. The sample is weighed with the crucible (D) and the moisture content is determined in weight % according to Equation 5. Moisture content = 100*(C – D)/(C - B) (5) (ASTM, 2010a)
3.2.1.2 Ash Content
1. Crucible is weighed empty (B). 2. Crucible is weighed with sawdust (C). 3. Crucible with sawdust is put in the muffle furnace at approximately 600 degrees C for 3 hrs. 4. The sample is left to cool to room temperature in a desiccator. 5. The sample is weighed with the crucible (D) and the ash content is determined in % according to Equation 6. Ash content = 100*(D - B)/(C - B) (6) (ASTM, 2010b)
3.2.1.3 Volatile matter
1. Crucible is weighed empty (B). 2. Crucible is weighed with sawdust (C). 3. Crucible with sawdust is put in the muffle furnace at approximately 900 °C for 7 minutes. 4. The sample is left to cool to room temperature in a desiccator. 5. The sample is weighed with the crucible (D) and the volatile matter content (VM) is determined in % according to equation 7 and 8, where E is weight loss in % and F is moisture content in % as defined in Equation 5. E = 100*(C-D)/(C - B) (7) VM = E – F (8) (ASTM, 2010c)
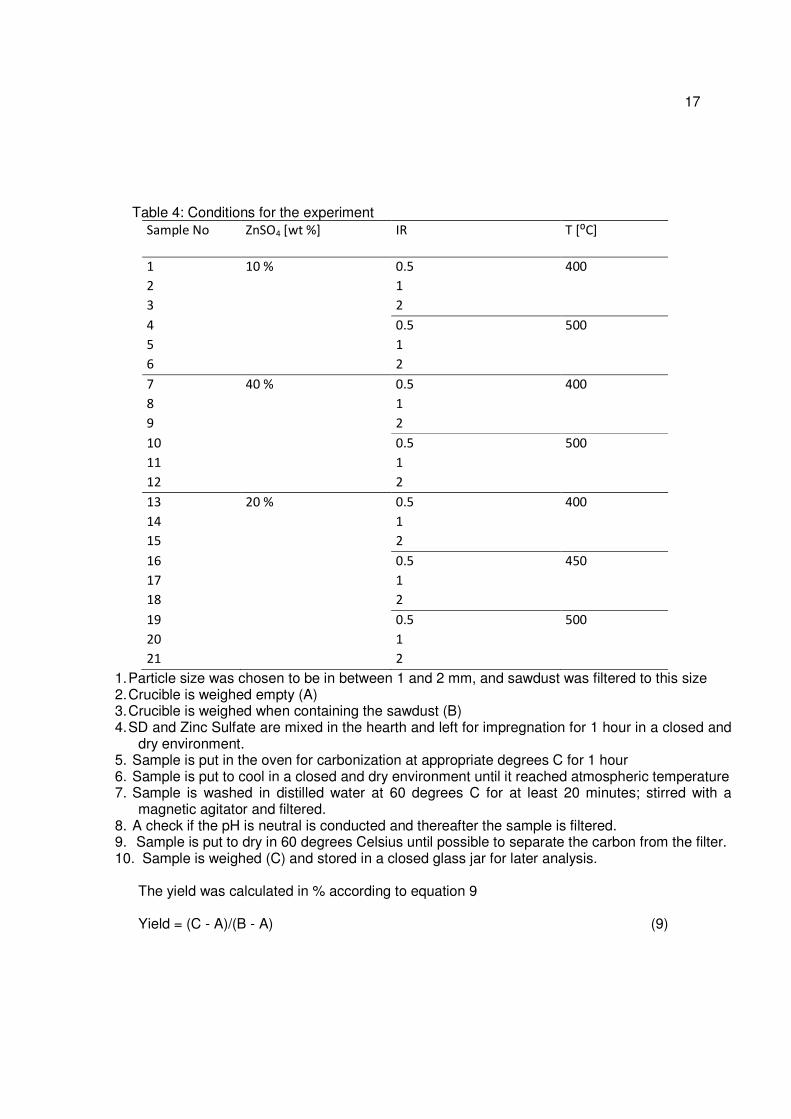
3.2.2 Production of AC
Three variables were used when producing the AC; Concentration of the Zinc Sulfate solution (S), Relationship of Impregnation mixture, Zinc Sulfate by wood (RI) and Temperature of Carbonization (T) (table 4). 21 samples were produced according to table 1, for which the experimental procedure was repeated.
17
Table 4: Conditions for the experiment
Sample No ZnSO4 [wt %] IR T [⁰C]
1 10 % 0.5 400
2 1
3 2
4 0.5 500
5 1
6 2
7 40 % 0.5 400
8 1
9 2
10 0.5 500
11 1
12 2
13 20 % 0.5 400
14 1
15 2
16 0.5 450
17 1
18 2
19 0.5 500
20 1
21 2
1. Particle size was chosen to be in between 1 and 2 mm, and sawdust was filtered to this size 2. Crucible is weighed empty (A) 3. Crucible is weighed when containing the sawdust (B) 4. SD and Zinc Sulfate are mixed in the hearth and left for impregnation for 1 hour in a closed and
dry environment. 5. Sample is put in the oven for carbonization at appropriate degrees C for 1 hour 6. Sample is put to cool in a closed and dry environment until it reached atmospheric temperature 7. Sample is washed in distilled water at 60 degrees C for at least 20 minutes; stirred with a
magnetic agitator and filtered. 8. A check if the pH is neutral is conducted and thereafter the sample is filtered. 9. Sample is put to dry in 60 degrees Celsius until possible to separate the carbon from the filter. 10. Sample is weighed (C) and stored in a closed glass jar for later analysis.
The yield was calculated in % according to equation 9 Yield = (C - A)/(B - A) (9)
18
3.2.3 Analysis of AC
The AC was analyzed with three different methods; adsorption of gases (Ammonia and Tetrachloride), Iodine number and BET- analysis.
3.2.3.1 Gas Adsorption
The AC are weighed and put into a sealed container with the ammonia or the tetrachloride in liquid form for evaporation. Here the amount of the liquid substance is not important since the assumption is that the activated carbon will adsorb gas in relation to its capacity and not the available amount. After 24 hours it is assumed that the samples have adsorbed all the ammonia they can, why they are taken out of the container and weighed once more. The weight difference between before and after adsorption determines the samples adsorption capacity.
3.2.3.2 Iodine number
In order to decide Iodine number approximately 0.1 grams of activated carbon is taken and put in to a flask with 25 ml of Iodine solution. The sample is then being mixed with the iodine solution by circulating the bottle for one minute. Thereafter the activated carbon-iodine solution is filtered whereupon 10 ml of the filtered solution is put into another bottle using a volumetric pipette. Finally the filtered solution is titrated with sodium thio sulphate solution until it becomes clear. To find the Iodine number equation 10 is used.
Iodine number = (I*(A- V) * N* M)/ (A*B) (10) Where I = Amount of iodine mixed with the AC, ml A = Na2S2O4 solution used for titration of 10 ml iodine solution, ml V = Na2S2O4 solution used for titration of 10 ml filtrate solution, ml B = Weight of the samples in grams M = Molar weight of Iodine N = Iodine concentration
3.2.3.3 BET-analysis
To determine the gas adsorption properties of the AC a BET-analysis can be done. Firstly the sample is heated and degassed by vacuum force, removing foreign adsorbed molecules. Then controlled amounts of an inert gas, in this case nitrogen, are introduced and adsorbed. At the temperature of liquid nitrogen and in vacuum the sample is exposed to varying pressures to generate adsorption isotherms. Adsorbed molecules are determined by the pressure variations due to the adsorption by the sample. (Beckman Coulter 2010) For the BET analysis a Micrometritics ASAP 2010, computerised Accelerated Surface Area, Porosimetry and Chemisorption System was used and the experiments were conducted at KTH
19
4. RESULTS AND DISCUSSION
4.1 Activation using phosphoric acid
The properties of the produced activated carbon will be studied regarding the different conditions used during the preparation (different acid concentrations, activation temperatures, impregnation ratios and precursor type as it is shown in Table 1).
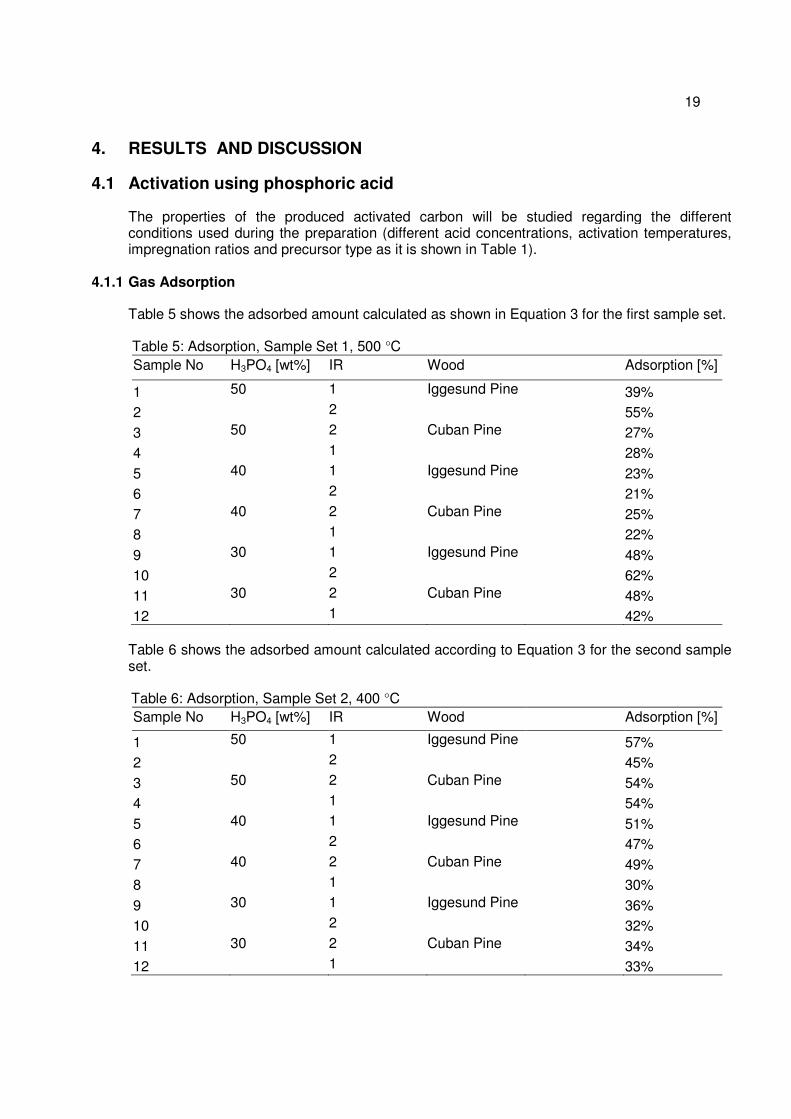
4.1.1 Gas Adsorption
Table 5 shows the adsorbed amount calculated as shown in Equation 3 for the first sample set. Table 5: Adsorption, Sample Set 1, 500 °C Sample No H3PO4 [wt%] IR Wood Adsorption [%]
1 50 1 Iggesund Pine 39% 2 2 55% 3 50 2 Cuban Pine 27% 4 1 28% 5 40 1 Iggesund Pine 23% 6 2 21% 7 40 2 Cuban Pine 25% 8 1 22% 9 30 1 Iggesund Pine 48% 10 2 62% 11 30 2 Cuban Pine 48% 12 1 42%
Table 6 shows the adsorbed amount calculated according to Equation 3 for the second sample set.
Table 6: Adsorption, Sample Set 2, 400 °C
Sample No H3PO4 [wt%] IR Wood Adsorption [%]
1 50 1 Iggesund Pine 57% 2 2 45% 3 50 2 Cuban Pine 54% 4 1 54% 5 40 1 Iggesund Pine 51% 6 2 47% 7 40 2 Cuban Pine 49% 8 1 30% 9 30 1 Iggesund Pine 36% 10 2 32% 11 30 2 Cuban Pine 34% 12 1 33%
20
4.1.2 Iodine Number
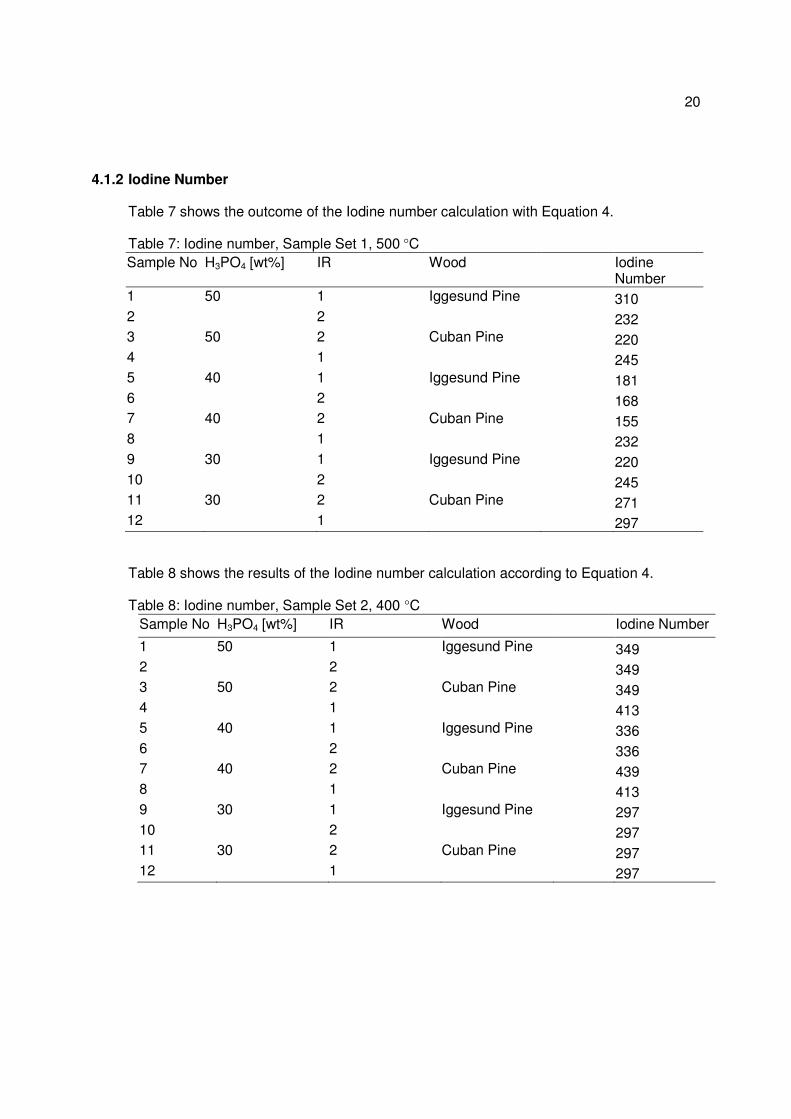
Table 7 shows the outcome of the Iodine number calculation with Equation 4. Table 7: Iodine number, Sample Set 1, 500 °C Sample No H3PO4 [wt%] IR Wood Iodine
Number 1 50 1 Iggesund Pine 310 2 2 232 3 50 2 Cuban Pine 220 4 1 245 5 40 1 Iggesund Pine 181 6 2 168 7 40 2 Cuban Pine 155 8 1 232 9 30 1 Iggesund Pine 220 10 2 245 11 30 2 Cuban Pine 271 12 1 297
Table 8 shows the results of the Iodine number calculation according to Equation 4. Table 8: Iodine number, Sample Set 2, 400 °C
Sample No H3PO4 [wt%] IR Wood Iodine Number
1 50 1 Iggesund Pine 349 2 2 349 3 50 2 Cuban Pine 349 4 1 413 5 40 1 Iggesund Pine 336 6 2 336 7 40 2 Cuban Pine 439 8 1 413 9 30 1 Iggesund Pine 297 10 2 297 11 30 2 Cuban Pine 297 12 1 297
21
4.1.3 Discussion
The results as presented in Tables 5, 6, 7 and 8 are here discussed with the previously mentioned parameters as a base. Each figure is discussed in the text following below the figure.
4.1.3.1 Gas Adsorption
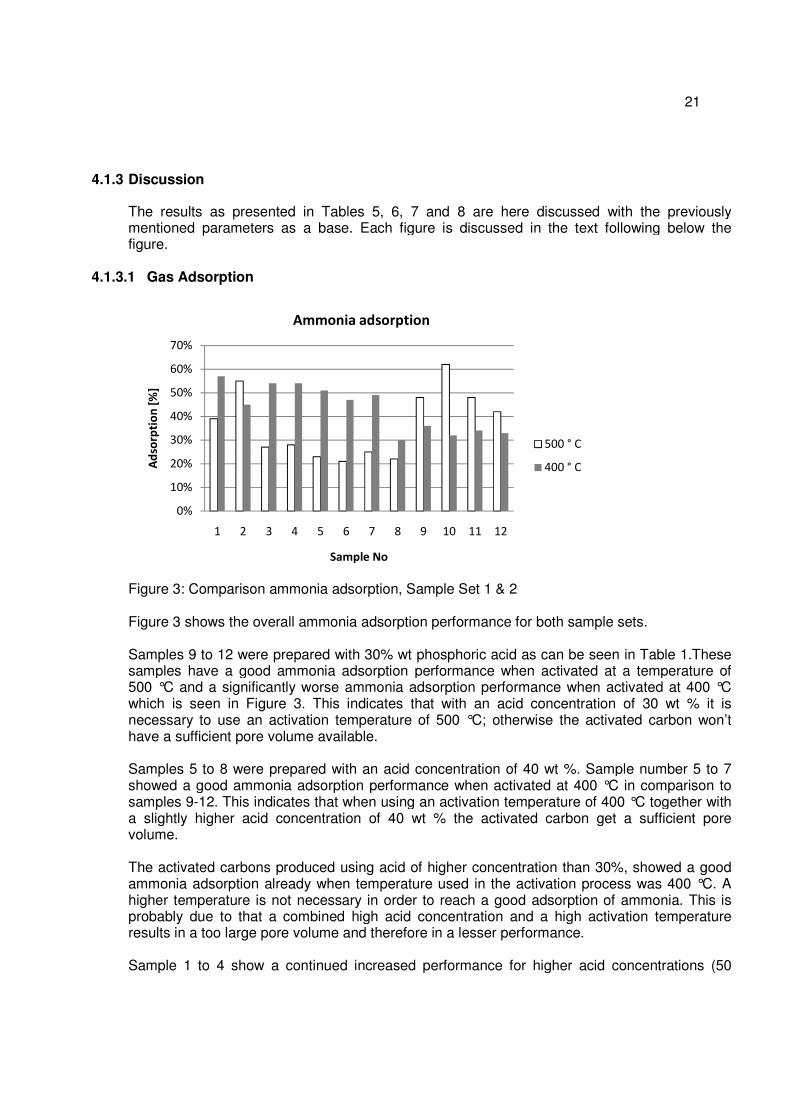
Figure 3: Comparison ammonia adsorption, Sample Set 1 & 2 Figure 3 shows the overall ammonia adsorption performance for both sample sets. Samples 9 to 12 were prepared with 30% wt phosphoric acid as can be seen in Table 1.These samples have a good ammonia adsorption performance when activated at a temperature of 500 °C and a significantly worse ammonia adsorption performance when activated at 400 °C which is seen in Figure 3. This indicates that with an acid concentration of 30 wt % it is necessary to use an activation temperature of 500 °C; otherwise the activated carbon won’t have a sufficient pore volume available. Samples 5 to 8 were prepared with an acid concentration of 40 wt %. Sample number 5 to 7 showed a good ammonia adsorption performance when activated at 400 °C in comparison to samples 9-12. This indicates that when using an activation temperature of 400 °C together with a slightly higher acid concentration of 40 wt % the activated carbon get a sufficient pore volume. The activated carbons produced using acid of higher concentration than 30%, showed a good ammonia adsorption already when temperature used in the activation process was 400 °C. A higher temperature is not necessary in order to reach a good adsorption of ammonia. This is probably due to that a combined high acid concentration and a high activation temperature results in a too large pore volume and therefore in a lesser performance. Sample 1 to 4 show a continued increased performance for higher acid concentrations (50
0%
10%
20%
30%
40%
50%
60%
70%
1 2 3 4 5 6 7 8 9 10 11 12
Ad
sorp
tio
n [
%]
Sample No
Ammonia adsorption
500 ° C
400 ° C
22
wt %) when activated at 400 °C. Though, since the increase of ammonia adsorption is not high enough, it can be concluded that an acid concentration of 40 wt % is sufficient for activation at 400°C.
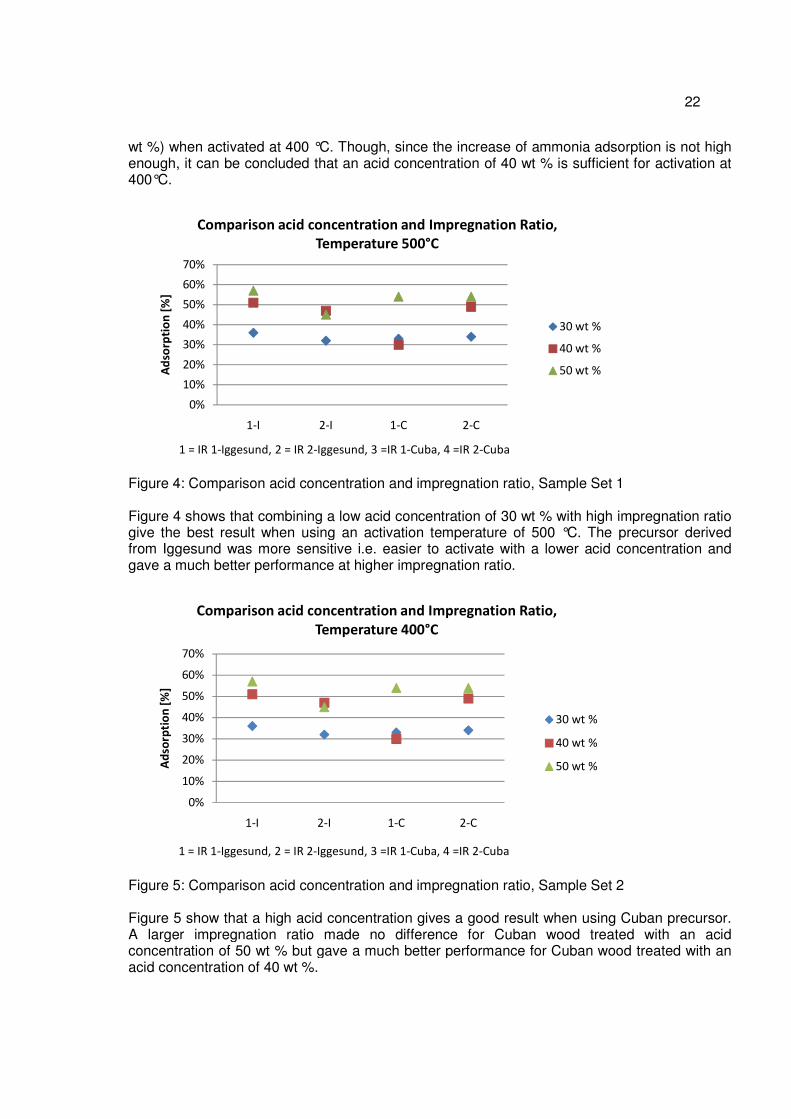
Figure 4: Comparison acid concentration and impregnation ratio, Sample Set 1 Figure 4 shows that combining a low acid concentration of 30 wt % with high impregnation ratio give the best result when using an activation temperature of 500 °C. The precursor derived from Iggesund was more sensitive i.e. easier to activate with a lower acid concentration and gave a much better performance at higher impregnation ratio.
Figure 5: Comparison acid concentration and impregnation ratio, Sample Set 2 Figure 5 show that a high acid concentration gives a good result when using Cuban precursor. A larger impregnation ratio made no difference for Cuban wood treated with an acid concentration of 50 wt % but gave a much better performance for Cuban wood treated with an acid concentration of 40 wt %.
0%
10%
20%
30%
40%
50%
60%
70%
1-I 2-I 1-C 2-C
Ad
sorp
tio
n [
%]
1 = IR 1-Iggesund, 2 = IR 2-Iggesund, 3 =IR 1-Cuba, 4 =IR 2-Cuba
Comparison acid concentration and Impregnation Ratio,
Temperature 500°C
30 wt %
40 wt %
50 wt %
0%
10%
20%
30%
40%
50%
60%
70%
1-I 2-I 1-C 2-C
Ad
sorp
tio
n [
%]
1 = IR 1-Iggesund, 2 = IR 2-Iggesund, 3 =IR 1-Cuba, 4 =IR 2-Cuba
Comparison acid concentration and Impregnation Ratio,
Temperature 400°C
30 wt %
40 wt %
50 wt %
23
By increasing the impregnation ratio from IR-1 to IR-2, the ammonia adsorption in activated carbon from Iggesund pine prepared with 50 wt % and 40 wt% phosphoric acid. It is possible that the pore volume of the activated carbon become too high in order to have the ability to adsorb ammonia. From figure 3 it may be concluded that a higher acid concentration is needed at lower activation temperatures and that the wood particles from Iggesund is more sensitive to acid concentration and need less impregnation ratio than the wood particles from Cuba.
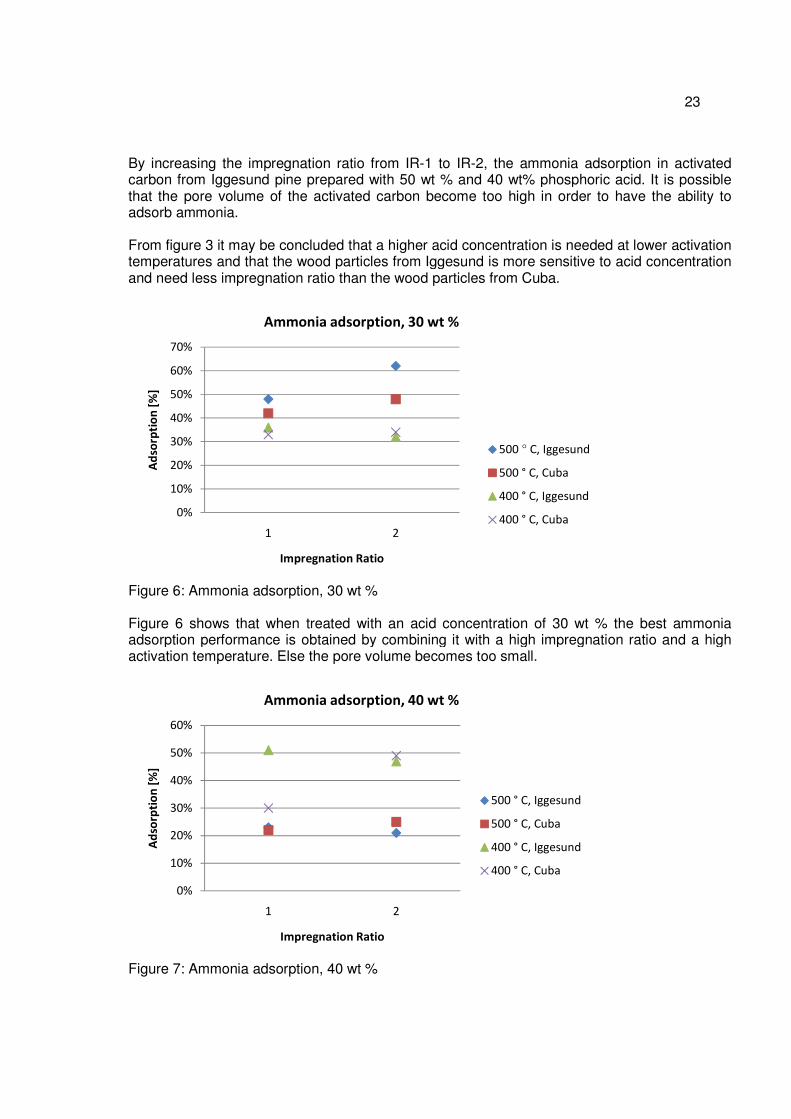
Figure 6: Ammonia adsorption, 30 wt % Figure 6 shows that when treated with an acid concentration of 30 wt % the best ammonia adsorption performance is obtained by combining it with a high impregnation ratio and a high activation temperature. Else the pore volume becomes too small.
Figure 7: Ammonia adsorption, 40 wt %
0%
10%
20%
30%
40%
50%
60%
70%
1 2
Ad
sorp
tio
n [
%]
Impregnation Ratio
Ammonia adsorption, 30 wt %
500 ° C, Iggesund
500 ° C, Cuba
400 ° C, Iggesund
400 ° C, Cuba
0%
10%
20%
30%
40%
50%
60%
1 2
Ad
sorp
tio
n [
%]
Impregnation Ratio
Ammonia adsorption, 40 wt %
500 ° C, Iggesund
500 ° C, Cuba
400 ° C, Iggesund
400 ° C, Cuba
24
Figure 7 shows that when using 40 wt % phosphoric acid, an activation temperature of 400 °C and an impregnation ratio of 2 are sufficient for the activated carbon to get a good ammonia adsorption capacity. Activated carbon produced at 400 °C from Iggesund pine with impregnation ratio of 1 showed already a good ammonia adsorption. When the activated carbons were activated at 500 °C, the ammonia adsorption decreases possibly because the pore volume becomes too large.
Figure 8: Ammonia adsorption, 50 wt % Figure 8 show that carbon treated with an acid concentration of 50 wt % obtains an improved adsorption capacity when activated at lower activation temperatures (400 °C) smaller impregnation ratios (IR-1).
4.1.4 Iodine Number
Figure 9: Comparison Iodine Number Sample Set 1 & 2
0%
10%
20%
30%
40%
50%
60%
1 2
Ad
sorp
tio
n [
%]
Impregnation Ratio
Ammonia adsorption, 50 wt %
500 ° C, Iggesund
500 ° C, Cuba
400 ° C, Iggesund
400 ° C, Cuba
0
50
100
150
200
250
300
350
400
450
500
1 2 3 4 5 6 7 8 9 10 11 12
Iod
ine
nu
mb
er
Sample number
Iodine number
500 ° C
400 ° C
25
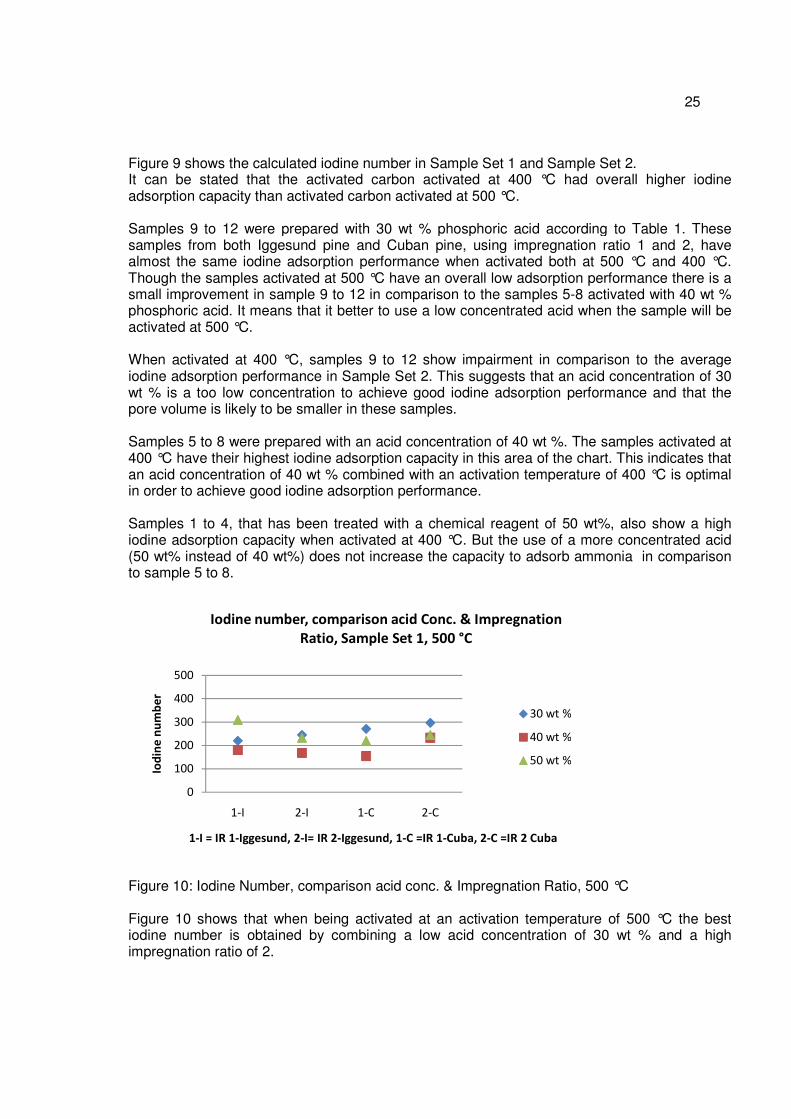
Figure 9 shows the calculated iodine number in Sample Set 1 and Sample Set 2. It can be stated that the activated carbon activated at 400 °C had overall higher iodine adsorption capacity than activated carbon activated at 500 °C. Samples 9 to 12 were prepared with 30 wt % phosphoric acid according to Table 1. These samples from both Iggesund pine and Cuban pine, using impregnation ratio 1 and 2, have almost the same iodine adsorption performance when activated both at 500 °C and 400 °C. Though the samples activated at 500 °C have an overall low adsorption performance there is a small improvement in sample 9 to 12 in comparison to the samples 5-8 activated with 40 wt % phosphoric acid. It means that it better to use a low concentrated acid when the sample will be activated at 500 °C. When activated at 400 °C, samples 9 to 12 show impairment in comparison to the average iodine adsorption performance in Sample Set 2. This suggests that an acid concentration of 30 wt % is a too low concentration to achieve good iodine adsorption performance and that the pore volume is likely to be smaller in these samples. Samples 5 to 8 were prepared with an acid concentration of 40 wt %. The samples activated at 400 °C have their highest iodine adsorption capacity in this area of the chart. This indicates that an acid concentration of 40 wt % combined with an activation temperature of 400 °C is optimal in order to achieve good iodine adsorption performance. Samples 1 to 4, that has been treated with a chemical reagent of 50 wt%, also show a high iodine adsorption capacity when activated at 400 °C. But the use of a more concentrated acid (50 wt% instead of 40 wt%) does not increase the capacity to adsorb ammonia in comparison to sample 5 to 8.
Figure 10: Iodine Number, comparison acid conc. & Impregnation Ratio, 500 °C Figure 10 shows that when being activated at an activation temperature of 500 °C the best iodine number is obtained by combining a low acid concentration of 30 wt % and a high impregnation ratio of 2.
0
100
200
300
400
500
1-I 2-I 1-C 2-C
Iod
ine
nu
mb
er
1-I = IR 1-Iggesund, 2-I= IR 2-Iggesund, 1-C =IR 1-Cuba, 2-C =IR 2 Cuba
Iodine number, comparison acid Conc. & Impregnation
Ratio, Sample Set 1, 500 °C
30 wt %
40 wt %
50 wt %
26
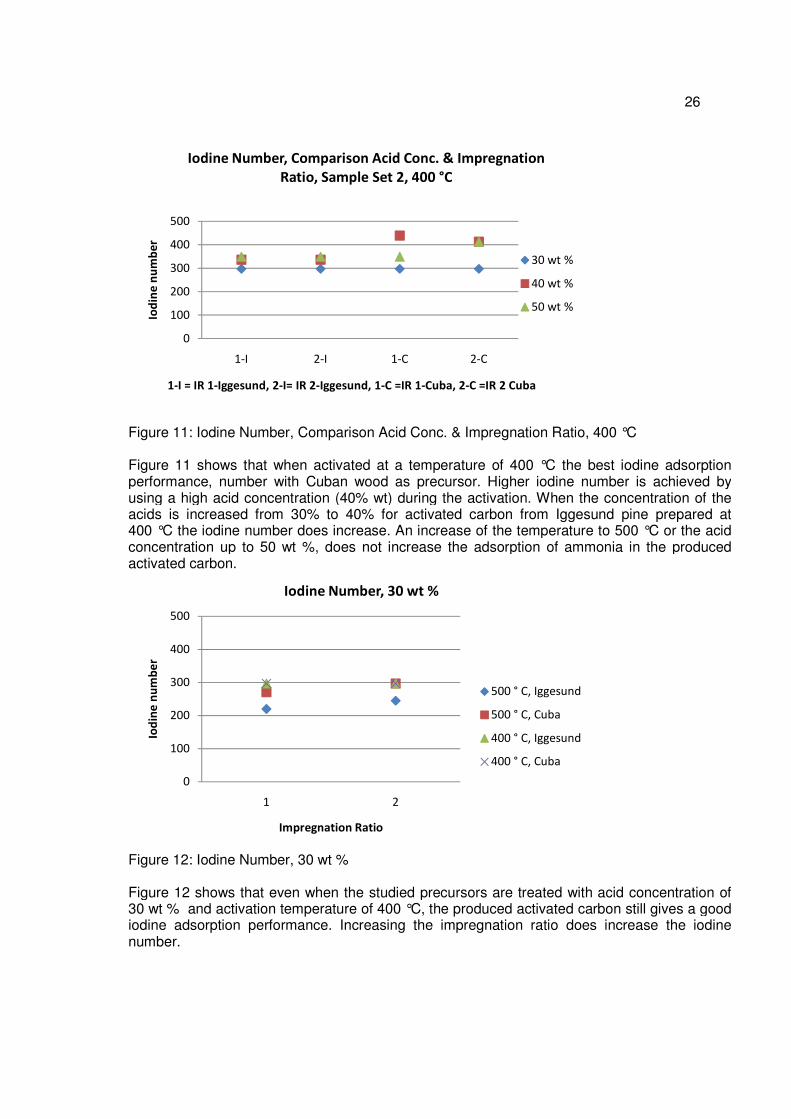
Figure 11: Iodine Number, Comparison Acid Conc. & Impregnation Ratio, 400 °C Figure 11 shows that when activated at a temperature of 400 °C the best iodine adsorption performance, number with Cuban wood as precursor. Higher iodine number is achieved by using a high acid concentration (40% wt) during the activation. When the concentration of the acids is increased from 30% to 40% for activated carbon from Iggesund pine prepared at 400 °C the iodine number does increase. An increase of the temperature to 500 °C or the acid concentration up to 50 wt %, does not increase the adsorption of ammonia in the produced activated carbon.
Figure 12: Iodine Number, 30 wt % Figure 12 shows that even when the studied precursors are treated with acid concentration of 30 wt % and activation temperature of 400 °C, the produced activated carbon still gives a good iodine adsorption performance. Increasing the impregnation ratio does increase the iodine number.
0
100
200
300
400
500
1-I 2-I 1-C 2-C
Iod
ine
nu
mb
er
1-I = IR 1-Iggesund, 2-I= IR 2-Iggesund, 1-C =IR 1-Cuba, 2-C =IR 2 Cuba
Iodine Number, Comparison Acid Conc. & Impregnation
Ratio, Sample Set 2, 400 °C
30 wt %
40 wt %
50 wt %
0
100
200
300
400
500
1 2
Iod
ine
nu
mb
er
Impregnation Ratio
Iodine Number, 30 wt %
500 ° C, Iggesund
500 ° C, Cuba
400 ° C, Iggesund
400 ° C, Cuba
27
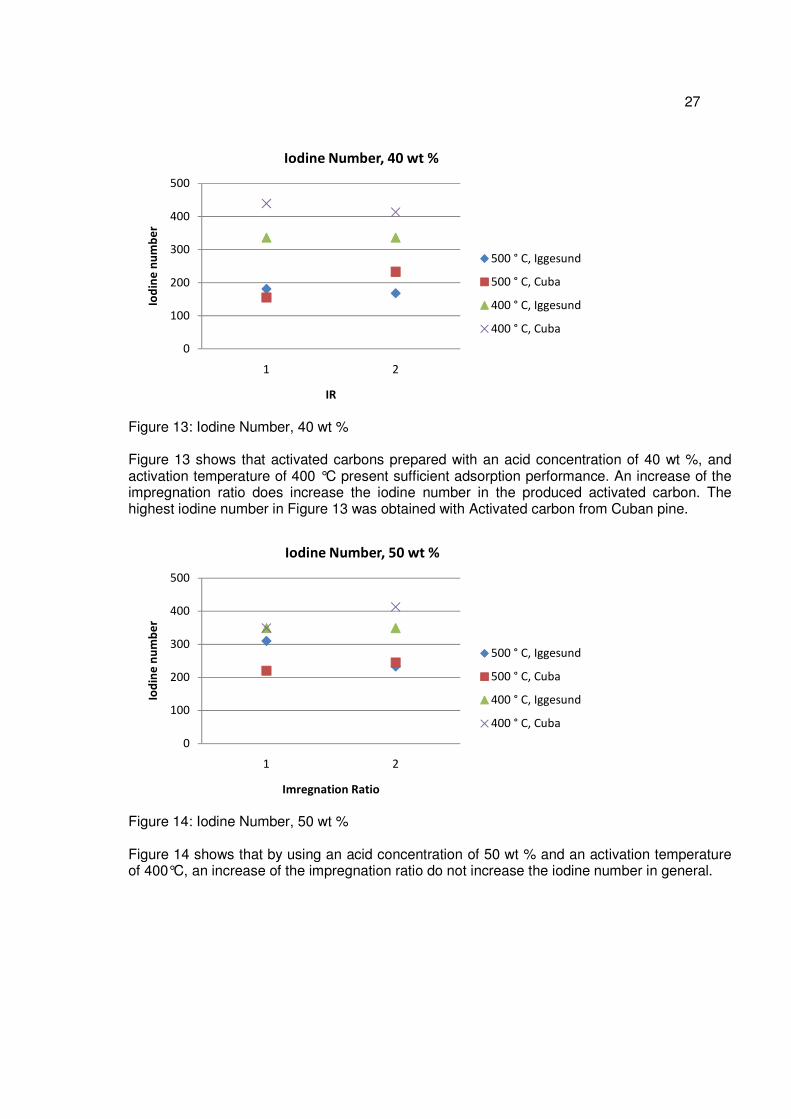
Figure 13: Iodine Number, 40 wt % Figure 13 shows that activated carbons prepared with an acid concentration of 40 wt %, and activation temperature of 400 °C present sufficient adsorption performance. An increase of the impregnation ratio does increase the iodine number in the produced activated carbon. The highest iodine number in Figure 13 was obtained with Activated carbon from Cuban pine.
Figure 14: Iodine Number, 50 wt % Figure 14 shows that by using an acid concentration of 50 wt % and an activation temperature of 400°C, an increase of the impregnation ratio do not increase the iodine number in general.
0
100
200
300
400
500
1 2
Iod
ine
nu
mb
er
IR
Iodine Number, 40 wt %
500 ° C, Iggesund
500 ° C, Cuba
400 ° C, Iggesund
400 ° C, Cuba
0
100
200
300
400
500
1 2
Iod
ine
nu
mb
er
Imregnation Ratio
Iodine Number, 50 wt %
500 ° C, Iggesund
500 ° C, Cuba
400 ° C, Iggesund
400 ° C, Cuba
28
4.2 Activation using zinc sulphate
4.2.1 Sawdust Composition
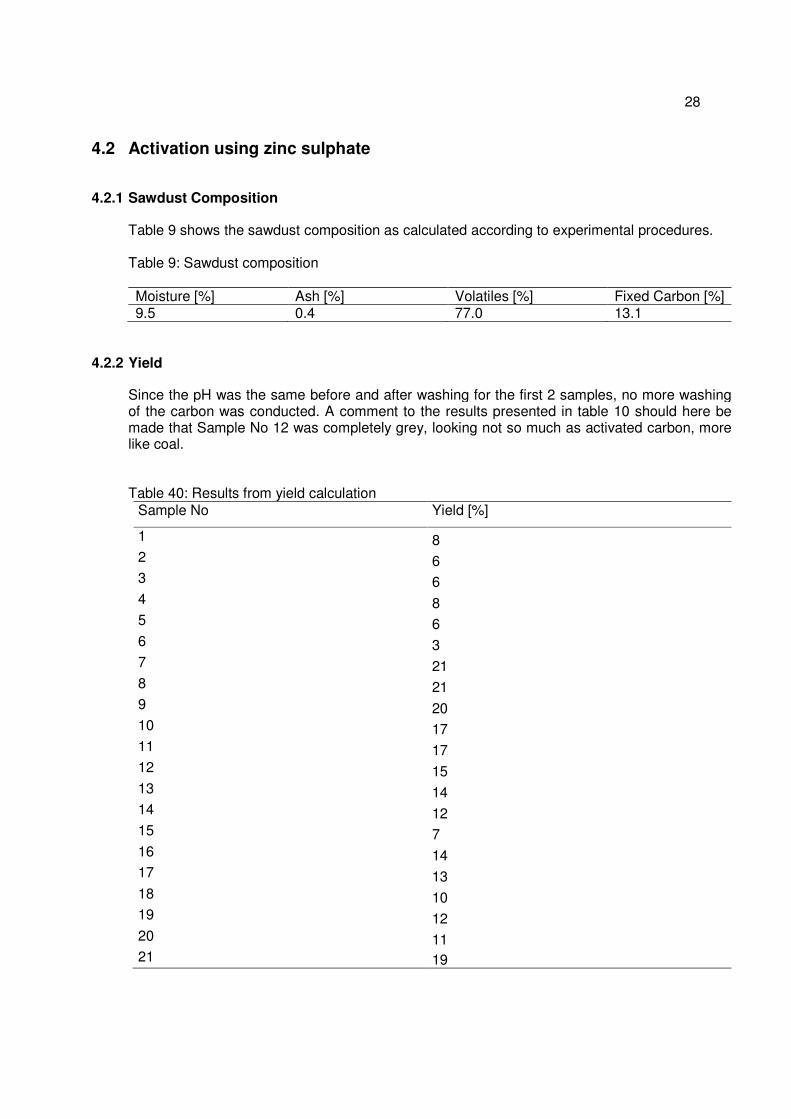
Table 9 shows the sawdust composition as calculated according to experimental procedures. Table 9: Sawdust composition Moisture [%] Ash [%] Volatiles [%] Fixed Carbon [%] 9.5 0.4 77.0 13.1
4.2.2 Yield
Since the pH was the same before and after washing for the first 2 samples, no more washing of the carbon was conducted. A comment to the results presented in table 10 should here be made that Sample No 12 was completely grey, looking not so much as activated carbon, more like coal.
Table 40: Results from yield calculation
Sample No Yield [%]
1 8 2 6 3 6 4 8 5 6 6 3 7 21 8 21 9 20 10 17 11 17 12 15 13 14 14 12 15 7 16 14 17 13 18 10 19 12 20 11 21 19
29
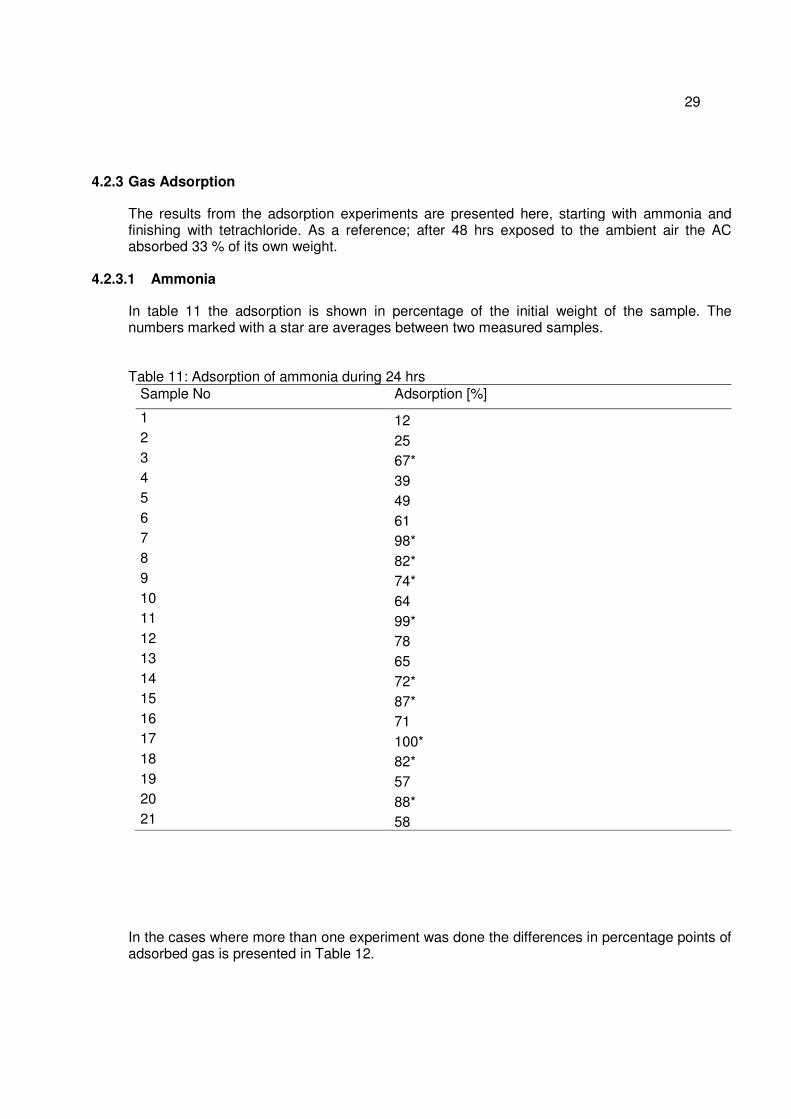
4.2.3 Gas Adsorption
The results from the adsorption experiments are presented here, starting with ammonia and finishing with tetrachloride. As a reference; after 48 hrs exposed to the ambient air the AC absorbed 33 % of its own weight.
4.2.3.1 Ammonia
In table 11 the adsorption is shown in percentage of the initial weight of the sample. The numbers marked with a star are averages between two measured samples.
Table 11: Adsorption of ammonia during 24 hrs
Sample No Adsorption [%]
1 12 2 25 3 67* 4 39 5 49 6 61 7 98* 8 82* 9 74* 10 64 11 99* 12 78 13 65 14 72* 15 87* 16 71 17 100* 18 82* 19 57 20 88* 21 58
In the cases where more than one experiment was done the differences in percentage points of adsorbed gas is presented in Table 12.
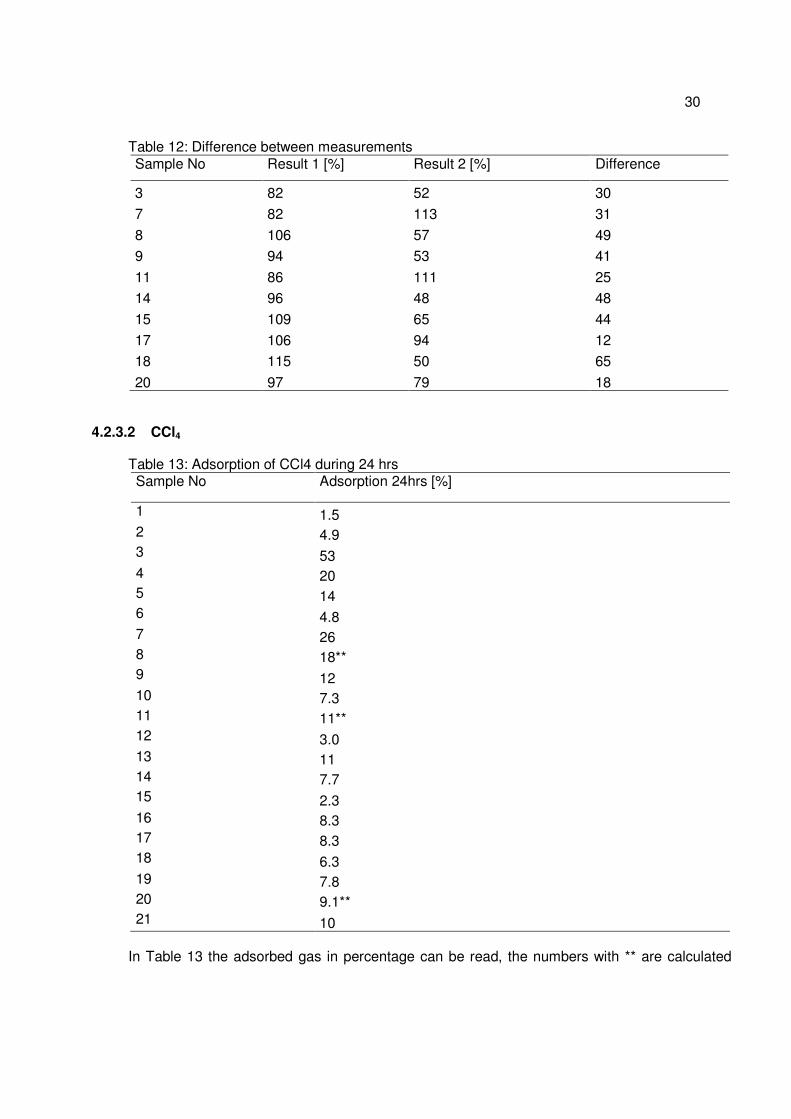
30
Table 12: Difference between measurements Sample No Result 1 [%] Result 2 [%] Difference
3 82 52 30
7 82 113 31
8 106 57 49 9 94 53 41
11 86 111 25 14 96 48 48
15 109 65 44
17 106 94 12 18 115 50 65
20 97 79 18
4.2.3.2 CCl4
Table 13: Adsorption of CCl4 during 24 hrs Sample No Adsorption 24hrs [%]
1 1.5 2 4.9 3 53 4 20 5 14 6 4.8 7 26 8 18** 9 12 10 7.3 11 11** 12 3.0 13 11 14 7.7 15 2.3 16 8.3 17 8.3 18 6.3 19 7.8 20 9.1** 21 10
In Table 13 the adsorbed gas in percentage can be read, the numbers with ** are calculated
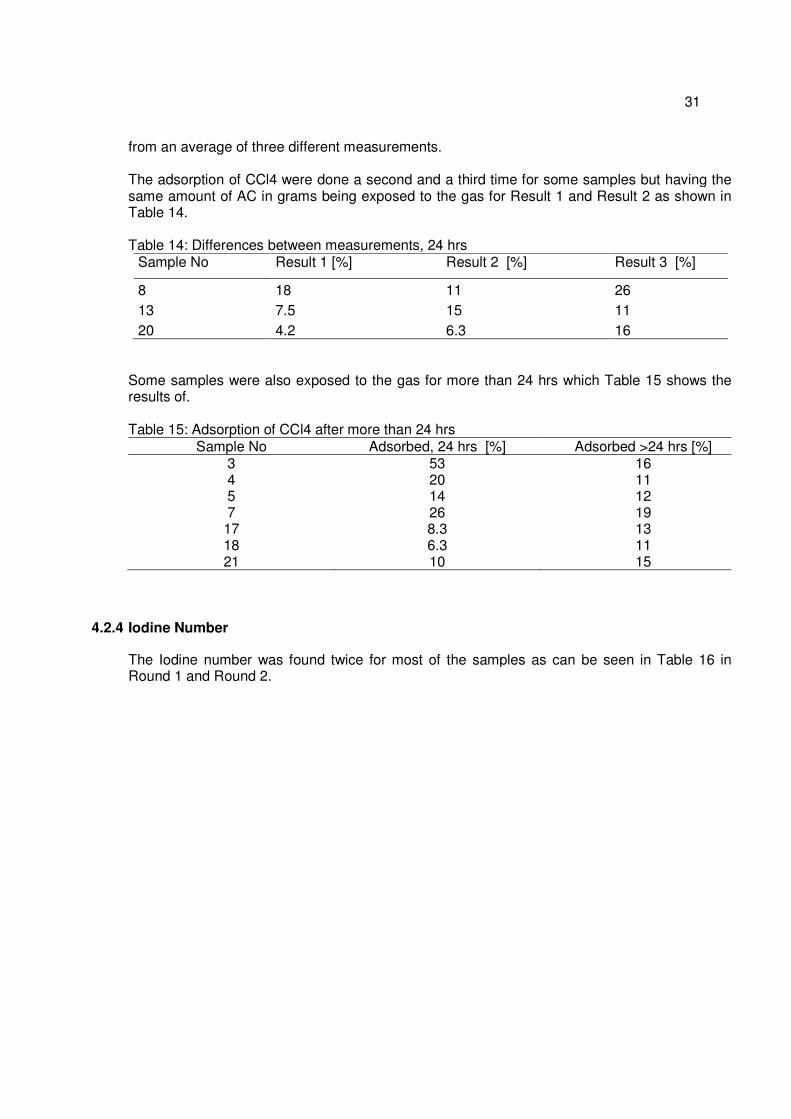
31
from an average of three different measurements. The adsorption of CCl4 were done a second and a third time for some samples but having the same amount of AC in grams being exposed to the gas for Result 1 and Result 2 as shown in Table 14. Table 14: Differences between measurements, 24 hrs
Sample No Result 1 [%] Result 2 [%] Result 3 [%]
8 18 11 26 13 7.5 15 11 20 4.2 6.3 16
Some samples were also exposed to the gas for more than 24 hrs which Table 15 shows the results of. Table 15: Adsorption of CCl4 after more than 24 hrs
Sample No Adsorbed, 24 hrs [%] Adsorbed >24 hrs [%] 3 53 16 4 20 11 5 14 12 7 26 19 17 8.3 13 18 6.3 11 21 10 15
4.2.4 Iodine Number
The Iodine number was found twice for most of the samples as can be seen in Table 16 in Round 1 and Round 2.
32
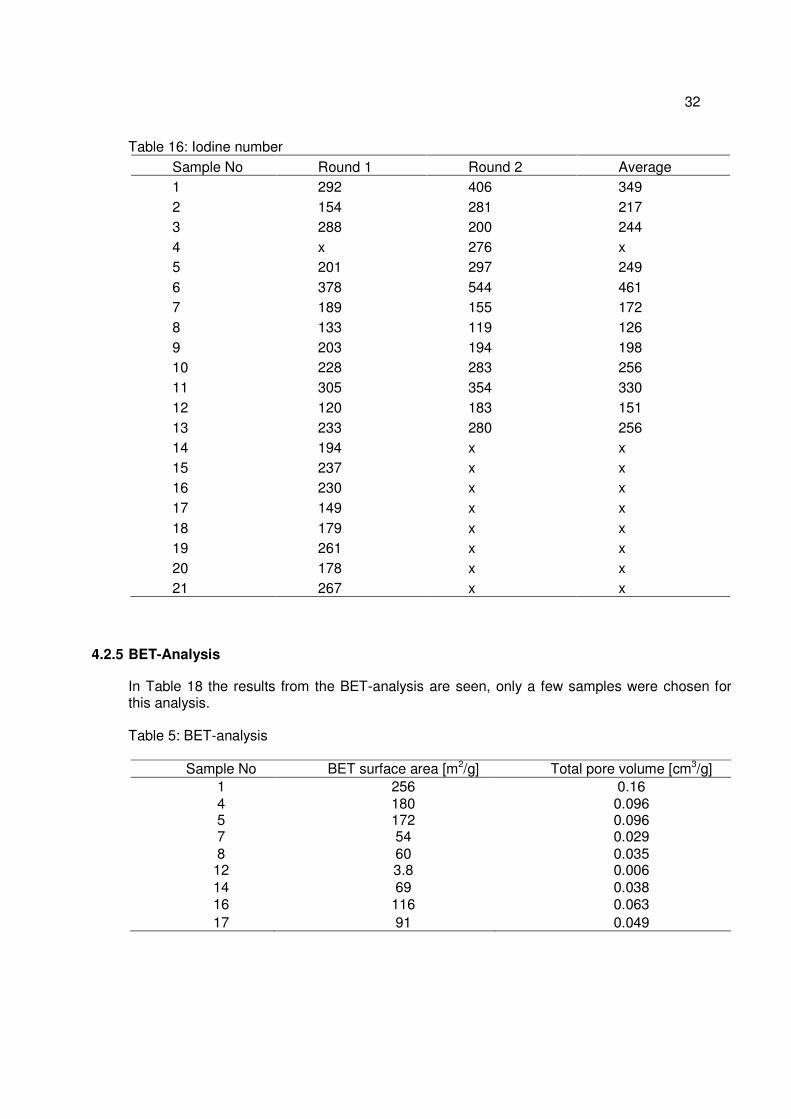
Table 16: Iodine number Sample No Round 1 Round 2 Average 1 292 406 349 2 154 281 217 3 288 200 244 4 x 276 x 5 201 297 249 6 378 544 461 7 189 155 172 8 133 119 126 9 203 194 198 10 228 283 256 11 305 354 330 12 120 183 151 13 233 280 256 14 194 x x 15 237 x x 16 230 x x 17 149 x x 18 179 x x 19 261 x x 20 178 x x 21 267 x x
4.2.5 BET-Analysis
In Table 18 the results from the BET-analysis are seen, only a few samples were chosen for this analysis. Table 5: BET-analysis
Sample No BET surface area [m2/g] Total pore volume [cm3/g] 1 256 0.16 4 180 0.096 5 172 0.096 7 54 0.029 8 60 0.035
12 3.8 0.006 14 69 0.038 16 116 0.063 17 91 0.049
33
4.2.6 Discussion .
4.2.6.1 Sawdust Composition (Proximate analysis)
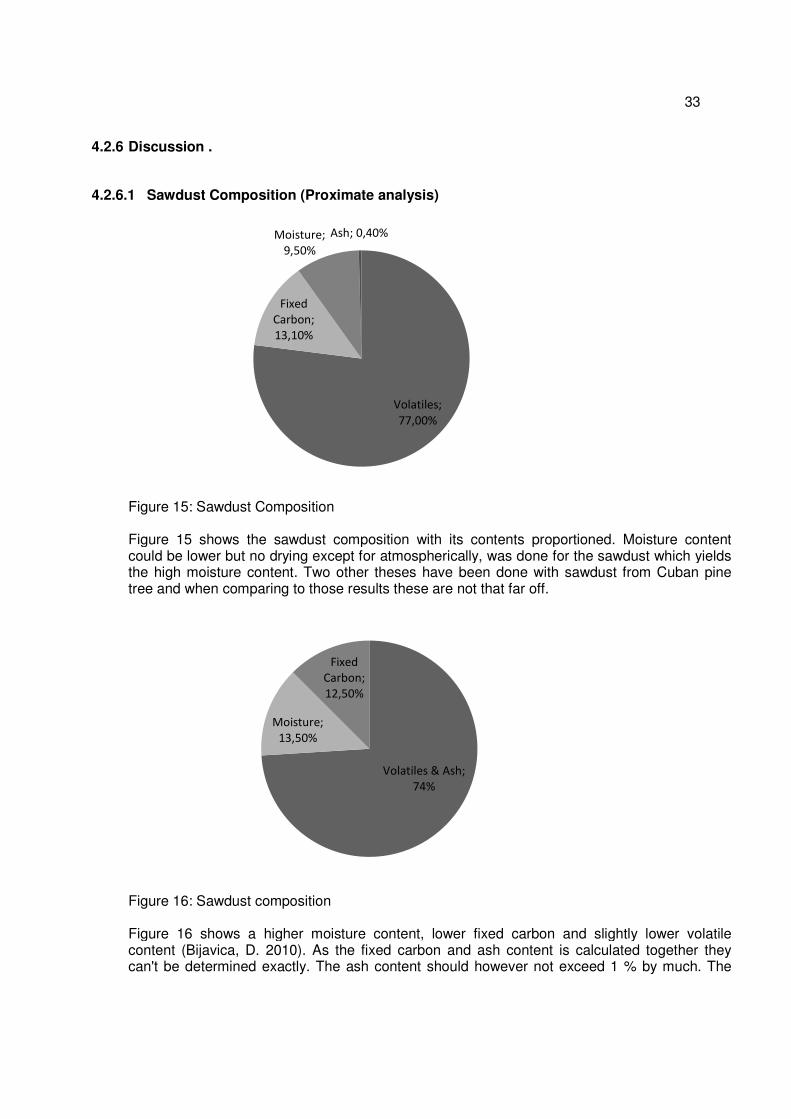
Figure 15: Sawdust Composition Figure 15 shows the sawdust composition with its contents proportioned. Moisture content could be lower but no drying except for atmospherically, was done for the sawdust which yields the high moisture content. Two other theses have been done with sawdust from Cuban pine tree and when comparing to those results these are not that far off.
Figure 16: Sawdust composition Figure 16 shows a higher moisture content, lower fixed carbon and slightly lower volatile content (Bijavica, D. 2010). As the fixed carbon and ash content is calculated together they can't be determined exactly. The ash content should however not exceed 1 % by much. The
Volatiles;
77,00%
Fixed
Carbon;
13,10%
Moisture;
9,50%
Ash; 0,40%
Volatiles & Ash;
74%
Moisture;
13,50%
Fixed
Carbon;
12,50%
atmospheric humidity varies a lot with the time of the year at Cuba, and as the analysis was done at Cuba with varying ambient humidity this plays a big role when determining the properties of the sawdust.
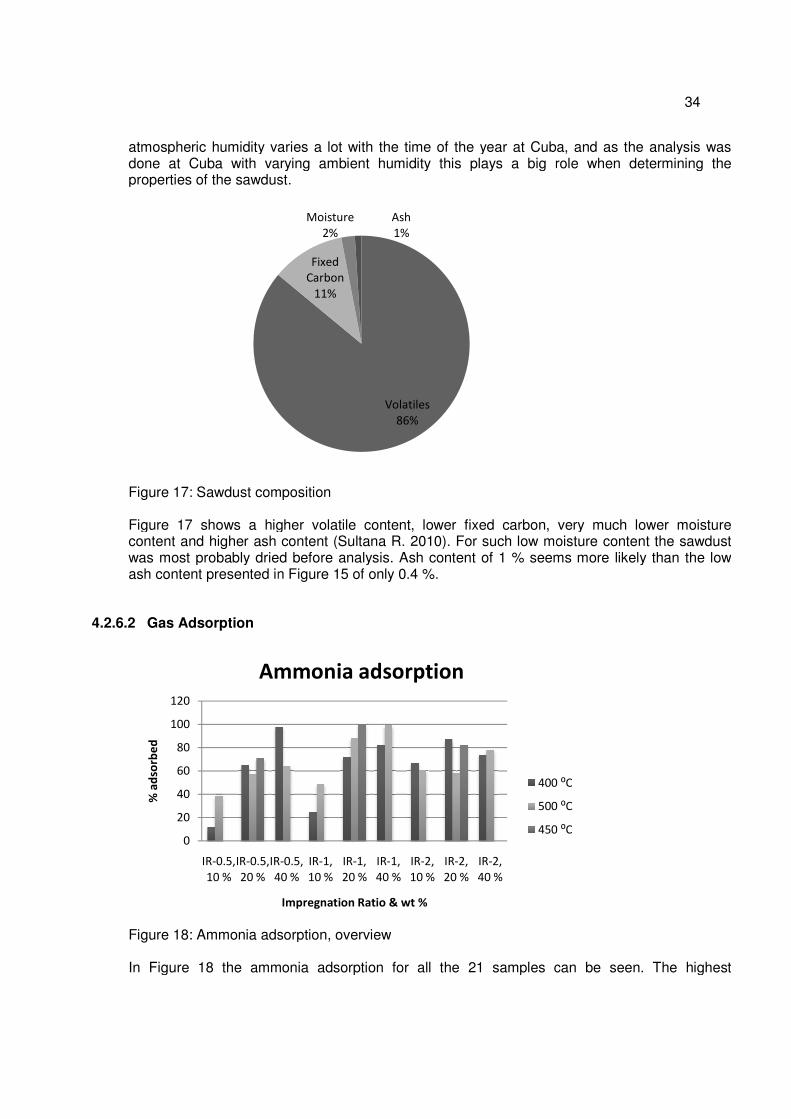
Figure 17: Sawdust composition Figure 17 shows a higher volatile content, lower fixed carbon, very much lower moisture content and higher ash content (Sultana R. 2010). For such low moisture content the sawdust was most probably dried beforeash content presented in Figure 15 of only 0.4 %.
4.2.6.2 Gas Adsorption
Figure 18: Ammonia adsorption, overview In Figure 18 the ammonia adsorption for all the 21 samples
0
20
40
60
80
100
120
IR-0.5,
10 %
IR-0.5,
20 %
IR
40 %
% a
dso
rbe
d
Ammonia adsorption
atmospheric humidity varies a lot with the time of the year at Cuba, and as the analysis was done at Cuba with varying ambient humidity this plays a big role when determining the properties of the sawdust.
: Sawdust composition
Figure 17 shows a higher volatile content, lower fixed carbon, very much lower moisture content and higher ash content (Sultana R. 2010). For such low moisture content the sawdust was most probably dried before analysis. Ash content of 1 % seems more likely than the low ash content presented in Figure 15 of only 0.4 %.
: Ammonia adsorption, overview
In Figure 18 the ammonia adsorption for all the 21 samples can be seen. The highest
Volatiles
86%
Fixed
Carbon
11%
Moisture
2%
Ash
1%
IR-0.5,
40 %
IR-1,
10 %
IR-1,
20 %
IR-1,
40 %
IR-2,
10 %
IR-2,
20 %
IR-2,
40 %
Impregnation Ratio & wt %
Ammonia adsorption
400 ⁰C
500 ⁰C
450 ⁰C
34
atmospheric humidity varies a lot with the time of the year at Cuba, and as the analysis was done at Cuba with varying ambient humidity this plays a big role when determining the
Figure 17 shows a higher volatile content, lower fixed carbon, very much lower moisture content and higher ash content (Sultana R. 2010). For such low moisture content the sawdust
analysis. Ash content of 1 % seems more likely than the low
can be seen. The highest
400 ⁰C
500 ⁰C
450 ⁰C
35
adsorption performance was retrieved with the impregnation ratio 1, 20 wt % and 450 ⁰C as carbonization temperature. Slightly less than that, are both at a concentration of 40 wt % one with impregnation ratio of 0.5 and 400 ⁰C, and the other with an impregnation ratio of 1 and 500 ⁰C carbonization temperature. The absolute lowest ammonia adsorption performance was achieved by the sample with 10 wt %, impregnation ratio of 0.5 and 400 ⁰C as carbonization temperature. Slightly more than that is still 400 ⁰C and 10 wt % but with the impregnation ratio increased to 2. The overall high adsorption of ammonia shows that probably not only physical adsorption is present but also chemical. This might have something to do with that the samples weren't washed. Only the first two samples were washed, IR-0.5, 10 wt %, 400 ⁰C and IR-1, 10 wt %, 400 ⁰C, which both have a significantly lower ammonia adsorption than the other samples. This could be a result from not being enough dried after the washing, having water in the pores prevents the samples from adsorbing.
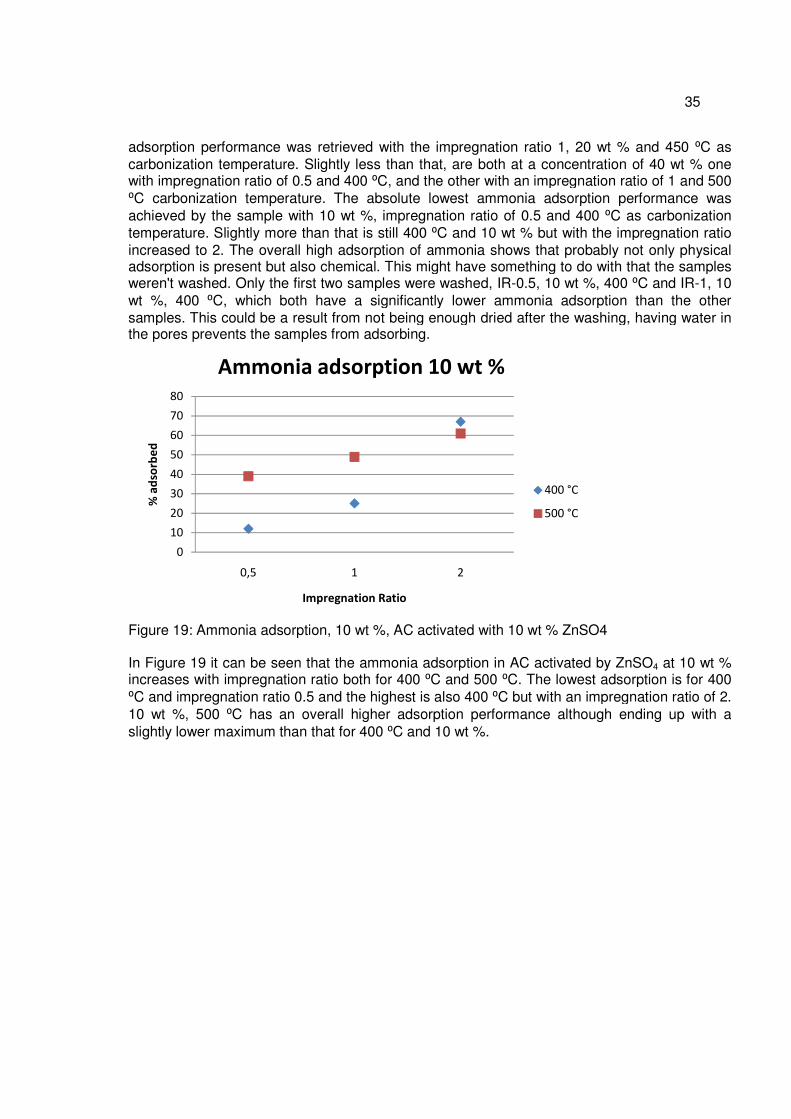
Figure 19: Ammonia adsorption, 10 wt %, AC activated with 10 wt % ZnSO4 In Figure 19 it can be seen that the ammonia adsorption in AC activated by ZnSO4 at 10 wt % increases with impregnation ratio both for 400 ⁰C and 500 ⁰C. The lowest adsorption is for 400 ⁰C and impregnation ratio 0.5 and the highest is also 400 ⁰C but with an impregnation ratio of 2. 10 wt %, 500 ⁰C has an overall higher adsorption performance although ending up with a slightly lower maximum than that for 400 ⁰C and 10 wt %.
0
10
20
30
40
50
60
70
80
0,5 1 2
% a
dso
rbe
d
Impregnation Ratio
Ammonia adsorption 10 wt %
400 °C
500 °C
36
Figure 20: Ammonia adsorption, 20 wt %, AC activated with 20 wt % ZnSO4 In difference to Figure 19, Figure 20 has a peak at impregnation ratio 1, instead of a linear increasing adsorption performance with impregnation ratio. Only 20 wt %, 400 ⁰C doesn't peak at IR-1. This is probably due to that a combined high impregnation ratio (IR-2), concentration (20 wt %) and a high activation temperature (450 ⁰C and 500 ⁰C) results in a too large pore volume and therefore in a lesser performance.
Figure 21: Ammonia adsorption, 40 wt %, AC activated with 40 wt % ZnSO4 When it comes to 40 wt %, 400 ⁰C the highest ammonia adsorption is obtained at the lowest impregnation ratio, and the lowest adsorption at the highest impregnation ratio. 40 wt %, 500 ⁰C is peaking the adsorption performance at IR-1. The high concentration, high temperature and high impregnation ratio makes the pore volume larger and as can be seen in both Figure 20 and 21, the highest IR gives lesser adsorption performance when raising the concentration and/or the activation temperature. In Figure 19, 10 wt %, the opposite it shown; as the IR increases so does the adsorption performance, which is the pattern for a low concentration and
0
20
40
60
80
100
120
0,5 1 2
% a
dso
rbe
d
Impregnation ratio
Ammonia adsorption 20 wt %
400 ⁰C
450 ⁰C
500 ⁰C
0
20
40
60
80
100
120
0,5 1 2
% a
dso
rbe
d
Impregnation ratio
Ammonia adsorption 40 wt %
400 ⁰C
500 ⁰C

supports previous statements.
Figure 22: CCl4 adsorption, overview
In Figure 22 the overall CClthe adsorption of ammonia. The highest value half of the highest adsorption capacity shown for ammonia. It is also significantly higher than all the other results. The lowest adsorption capacity is retrieved by IRWhen a sample was left in the atmosphere for 24 hours it adsorbed 33 % from the ambient air, probably moisture. All samples but one adsorbed less than 33 % CCl
Figure 23: CCl4 adsorption, 10 wt %, In Figure 23 the CCl4 adsorption for 500 increases, on the contrary, for 400 IR-2 which is also the highest adsorption value for the whole CCl
0
10
20
30
40
50
60
IR-0.5,
10 %
IR-0.5,
20 %
IR-
40 %
% a
dso
rbe
d
Impregnation Ratio & wt %
0
10
20
30
40
50
60
0,5
% a
dso
rbe
d
CCl4
supports previous statements.
: CCl4 adsorption, overview
In Figure 22 the overall CCl4 adsorption is shown which can clearly be seen is a lot less than the adsorption of ammonia. The highest value here, which is for IR-2, 10 wt %, 400 half of the highest adsorption capacity shown for ammonia. It is also significantly higher than all the other results. The lowest adsorption capacity is retrieved by IR
le was left in the atmosphere for 24 hours it adsorbed 33 % from the ambient air, probably moisture. All samples but one adsorbed less than 33 % CCl
: CCl4 adsorption, 10 wt %, AC activated with 10 wt % ZnSO
adsorption for 500 ⁰C shows a decreasing trend as the impregnation ratio increases, on the contrary, for 400 ⁰C it shows an increasing trend with an extreme increase at
2 which is also the highest adsorption value for the whole CCl4 experiment.
-0.5,
40 %
IR-1,
10 %
IR-1,
20 %
IR-1,
40 %
IR-2,
10 %
IR-2,
20 %
IR-2,
40 %
Impregnation Ratio & wt %
CCl4 adsorption
400 ⁰C
500 ⁰C
450 ⁰C
1 2
Impregnation Ratio
4 adsorption 10 wt %
400
500
37
adsorption is shown which can clearly be seen is a lot less than 2, 10 wt %, 400 ⁰C, is about
half of the highest adsorption capacity shown for ammonia. It is also significantly higher than all the other results. The lowest adsorption capacity is retrieved by IR-0.5, 10 wt % and 400 ⁰C.
le was left in the atmosphere for 24 hours it adsorbed 33 % from the ambient air, probably moisture. All samples but one adsorbed less than 33 % CCl4.
AC activated with 10 wt % ZnSO4
C shows a decreasing trend as the impregnation ratio C it shows an increasing trend with an extreme increase at
experiment.
400 ⁰C
500 ⁰C
450 ⁰C
400 °C
500 °C
38
Figure 24: CCl4 adsorption, AC activated with 20 wt % ZnSO4 At 20 wt % three different trends is retrieved as can be seen in Figure 24. The samples carbonized at 400 ⁰C shows a decreasing trend with higher impregnation ratio, 500 ⁰C increasing and 450 ⁰C has a peak at IR-1 with the lowest adsorption capacity shown at IR-2.
Figure 25: CCl4 adsorption, AC activated with 40 wt % ZnSO4 Carbonization temperature 400 ⁰C has a decreasing trend, as can be seen in Figure 25 and 500 ⁰C is peaking at IR-1. The lowest adsorption capacity is here shown by 500 ⁰C, IR-2 and the highest by 400 ⁰C, IR-0.5.
0
2
4
6
8
10
12
0,5 1 2
% a
dso
rbe
d
Impregnation Ratio
CCl4 adsorption 20 wt %
400 °C
500 °C
450 ⁰C
0
5
10
15
20
25
30
0,5 1 2
% a
dso
rbe
d
Impregnation Ratio
CCl4 adsorption 40 wt %
400 °C
500 °C
4.2.6.3 Iodine Number
Figure 26: Iodine number, overview In Figure 26, the outcome of the iodine number calculatiothe highest number is obtained with 500 concentration. The lowest iodine number is retrieved with 400
Figure 27: Iodine number at carbonization temperature 400 For the samples carbonized at 400 impregnation ratios which can be seen in Figure 27. The lower the concentration, the higher the iodine number at 400 ⁰C, and for the lowest impregnation ratio; IR
050
100150200250300350400450500
IR-0.5,
10 %
IR-0.5,
20 %
IR
40 %
Iod
ine
nu
mb
er
0
50
100
150
200
250
300
350
400
0,5
Iod
ine
Nu
mb
er
Iodine number, 400
: Iodine number, overview
In Figure 26, the outcome of the iodine number calculations can be seen. The figure shows that the highest number is obtained with 500 ⁰C, an impregnation ratio of 2 and a 10 wt % concentration. The lowest iodine number is retrieved with 400 ⁰C, IR
er at carbonization temperature 400 °C
For the samples carbonized at 400 ⁰C the 10 wt % has the highest iodine number for all impregnation ratios which can be seen in Figure 27. The lower the concentration, the higher the
C, and for 10 and 20 wt % the highest iodine number at achieved with the lowest impregnation ratio; IR-0.5.
IR-0.5,
40 %
IR-1,
10 %
IR-1,
20 %
IR-1,
40 %
IR-2,
10 %
IR-2,
20 %
IR-2,
40 %
Impregnation Ratio & wt %
Iodine number
400 ⁰C
500 ⁰C
450 ⁰C
1 2
Impregnation Ratio
Iodine number, 400 °C
10%
40%
20%
39
ns can be seen. The figure shows that C, an impregnation ratio of 2 and a 10 wt %
C, IR-1 and 40 wt %.
C the 10 wt % has the highest iodine number for all impregnation ratios which can be seen in Figure 27. The lower the concentration, the higher the
10 and 20 wt % the highest iodine number at achieved with
400 ⁰C
500 ⁰C
450 ⁰C

40
Figure 28: Iodine number at carbonization temperature 500 °C All three concentrations behave differently when increasing the impregnation ratio at the carbonization temperature 500 ⁰C, as is seen in Figure 28. Although they start out with almost the same iodine number at IR-0.4, 20 and 10 wt % makes a dip at IR-1 and increases and gives its highest value at IR-2, 40 wt % has its highest iodine number at IR-1 and decreases to its lowest at IR-2. The absolute highest at 500 ⁰C is the iodine number for 10 wt %, IR-2 and the lowest is IR-2, 40 wt %.
Figure 29: Iodine number, AC activated with 10 wt % ZnSO4 Both the samples carbonized at 400 and 500 ⁰C have its lowest iodine number at the impregnation ratio 1, which is seen in Figure 29. Although for 500 ⁰C the highest iodine number is retrieved at IR-2 while the highest for 400 ⁰C is retrieved at IR-0.5.
0
50
100
150
200
250
300
350
400
450
500
0,5 1 2
Iod
ine
Nu
mb
er
Impregnation Ratio
Iodine number, 500 °C
10%
40%
20%
0
50
100
150
200
250
300
350
400
450
500
0,5 1 2
Iod
ine
Nu
mb
er
Impregnation Ratio
Iodine number, 10%
400 °C
500 °C
41
Figure 30: Iodine number, AC activated with 20 wt % ZnSO4 In Figure 30 it can be seen that carbons activated at 500 ⁰C, with 20 wt % ZnSO4 have a dip at IR-1 and an increase to its highest iodine number as the impregnation ratio increases to 2. Carbons activated at 450 and 400 ⁰C with 20 wt % ZnSO4 show a higher iodine number that carbon activated at 400 ⁰C.
Figure 31: Iodine number, 40 wt % When looking at samples prepared with a 40 wt % concentration it can be seen in Figure 31 that the highest iodine number obtained is with 500 ⁰C carbonization temperature and IR-1, but, at 400 ⁰C and the same IR also the lowest iodine number was obtained.
0
50
100
150
200
250
300
0,5 1 2
Iod
ine
Nu
mb
er
Impregnation Ratio
Iodine number, 20%
450 °C
400 °C
500 °C
0
50
100
150
200
250
300
350
0,5 1 2
Iod
ine
Nu
mb
er
Impregnation Ratio
Iodine number, 40%
400 °C
500 °C
42
4.2.6.4 BET Surface Area
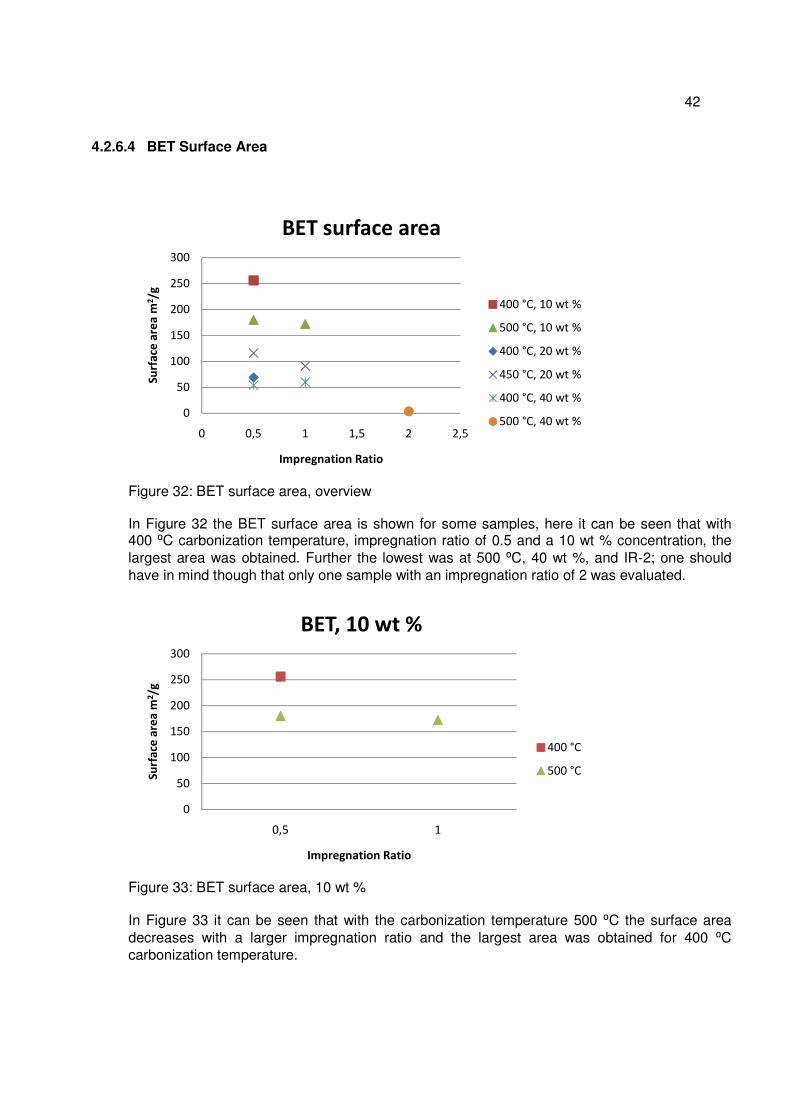
Figure 32: BET surface area, overview In Figure 32 the BET surface area is shown for some samples, here it can be seen that with 400 ⁰C carbonization temperature, impregnation ratio of 0.5 and a 10 wt % concentration, the largest area was obtained. Further the lowest was at 500 ⁰C, 40 wt %, and IR-2; one should have in mind though that only one sample with an impregnation ratio of 2 was evaluated.
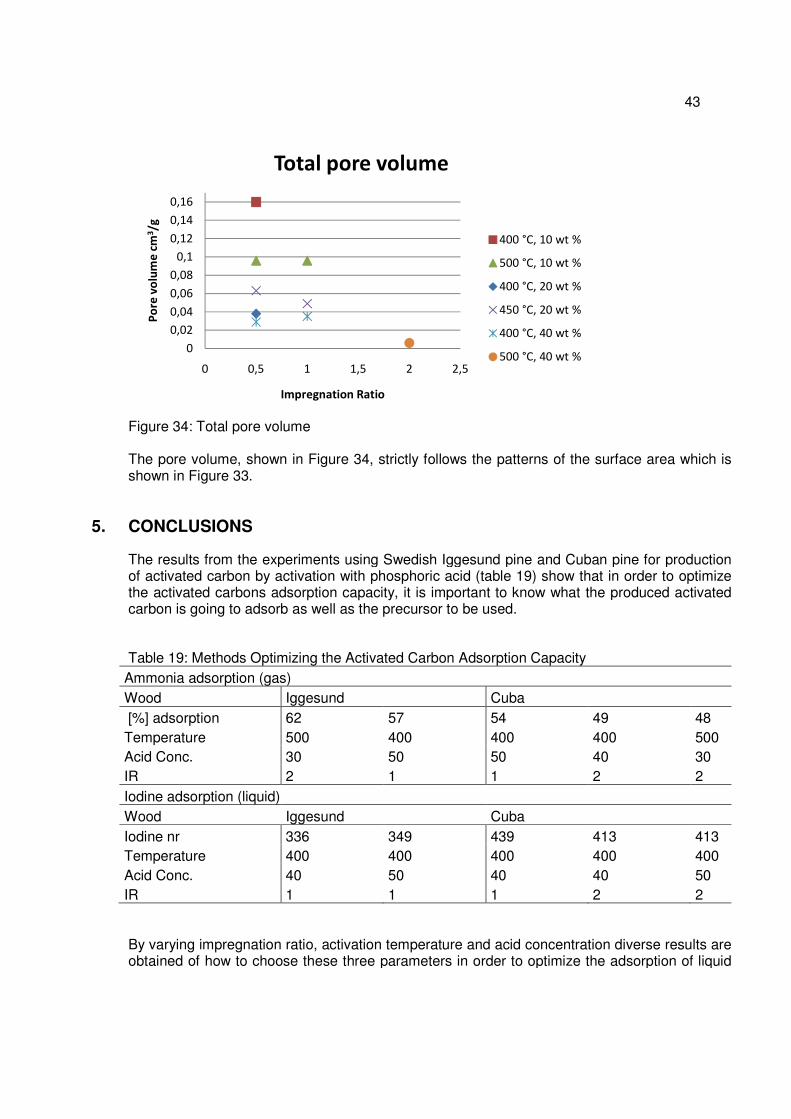
Figure 33: BET surface area, 10 wt % In Figure 33 it can be seen that with the carbonization temperature 500 ⁰C the surface area decreases with a larger impregnation ratio and the largest area was obtained for 400 ⁰C carbonization temperature.
0
50
100
150
200
250
300
0 0,5 1 1,5 2 2,5
Su
rfa
ce a
rea
m2/g
Impregnation Ratio
BET surface area
400 °C, 10 wt %
500 °C, 10 wt %
400 °C, 20 wt %
450 °C, 20 wt %
400 °C, 40 wt %
500 °C, 40 wt %
0
50
100
150
200
250
300
0,5 1
Su
rfa
ce a
rea
m2/g
Impregnation Ratio
BET, 10 wt %
400 °C
500 °C
43
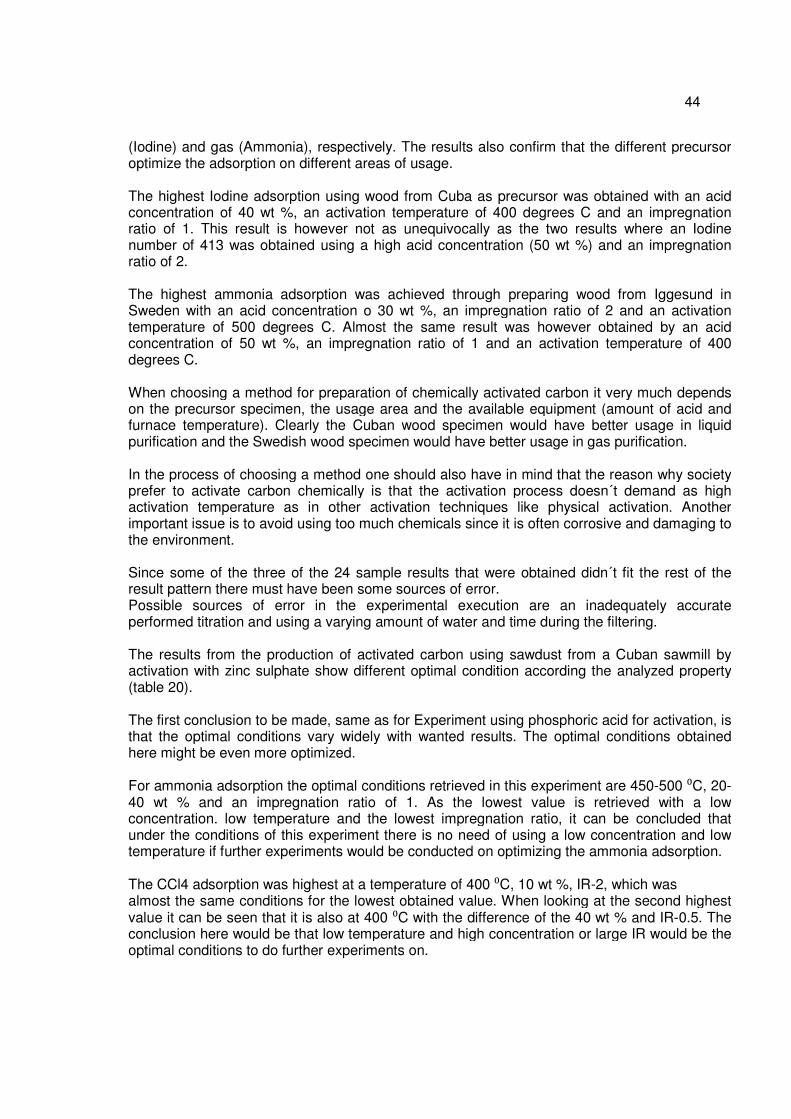
Figure 34: Total pore volume The pore volume, shown in Figure 34, strictly follows the patterns of the surface area which is shown in Figure 33.
5. CONCLUSIONS
The results from the experiments using Swedish Iggesund pine and Cuban pine for production of activated carbon by activation with phosphoric acid (table 19) show that in order to optimize the activated carbons adsorption capacity, it is important to know what the produced activated carbon is going to adsorb as well as the precursor to be used. Table 19: Methods Optimizing the Activated Carbon Adsorption Capacity
Ammonia adsorption (gas) Wood Iggesund Cuba [%] adsorption 62 57 54 49 48 Temperature 500 400 400 400 500 Acid Conc. 30 50 50 40 30 IR 2 1 1 2 2 Iodine adsorption (liquid) Wood Iggesund Cuba Iodine nr 336 349 439 413 413 Temperature 400 400 400 400 400 Acid Conc. 40 50 40 40 50 IR 1 1 1 2 2 By varying impregnation ratio, activation temperature and acid concentration diverse results are obtained of how to choose these three parameters in order to optimize the adsorption of liquid
0
0,02
0,04
0,06
0,08
0,1
0,12
0,14
0,16
0 0,5 1 1,5 2 2,5
Po
re v
olu
me
cm
3/g
Impregnation Ratio
Total pore volume
400 °C, 10 wt %
500 °C, 10 wt %
400 °C, 20 wt %
450 °C, 20 wt %
400 °C, 40 wt %
500 °C, 40 wt %
44
(Iodine) and gas (Ammonia), respectively. The results also confirm that the different precursor optimize the adsorption on different areas of usage. The highest Iodine adsorption using wood from Cuba as precursor was obtained with an acid concentration of 40 wt %, an activation temperature of 400 degrees C and an impregnation ratio of 1. This result is however not as unequivocally as the two results where an Iodine number of 413 was obtained using a high acid concentration (50 wt %) and an impregnation ratio of 2. The highest ammonia adsorption was achieved through preparing wood from Iggesund in Sweden with an acid concentration o 30 wt %, an impregnation ratio of 2 and an activation temperature of 500 degrees C. Almost the same result was however obtained by an acid concentration of 50 wt %, an impregnation ratio of 1 and an activation temperature of 400 degrees C. When choosing a method for preparation of chemically activated carbon it very much depends on the precursor specimen, the usage area and the available equipment (amount of acid and furnace temperature). Clearly the Cuban wood specimen would have better usage in liquid purification and the Swedish wood specimen would have better usage in gas purification. In the process of choosing a method one should also have in mind that the reason why society prefer to activate carbon chemically is that the activation process doesn´t demand as high activation temperature as in other activation techniques like physical activation. Another important issue is to avoid using too much chemicals since it is often corrosive and damaging to the environment. Since some of the three of the 24 sample results that were obtained didn´t fit the rest of the result pattern there must have been some sources of error. Possible sources of error in the experimental execution are an inadequately accurate performed titration and using a varying amount of water and time during the filtering. The results from the production of activated carbon using sawdust from a Cuban sawmill by activation with zinc sulphate show different optimal condition according the analyzed property (table 20). The first conclusion to be made, same as for Experiment using phosphoric acid for activation, is that the optimal conditions vary widely with wanted results. The optimal conditions obtained here might be even more optimized. For ammonia adsorption the optimal conditions retrieved in this experiment are 450-500 ⁰C, 20-40 wt % and an impregnation ratio of 1. As the lowest value is retrieved with a low concentration. low temperature and the lowest impregnation ratio, it can be concluded that under the conditions of this experiment there is no need of using a low concentration and low temperature if further experiments would be conducted on optimizing the ammonia adsorption. The CCl4 adsorption was highest at a temperature of 400 ⁰C, 10 wt %, IR-2, which was almost the same conditions for the lowest obtained value. When looking at the second highest value it can be seen that it is also at 400 ⁰C with the difference of the 40 wt % and IR-0.5. The conclusion here would be that low temperature and high concentration or large IR would be the optimal conditions to do further experiments on.
45
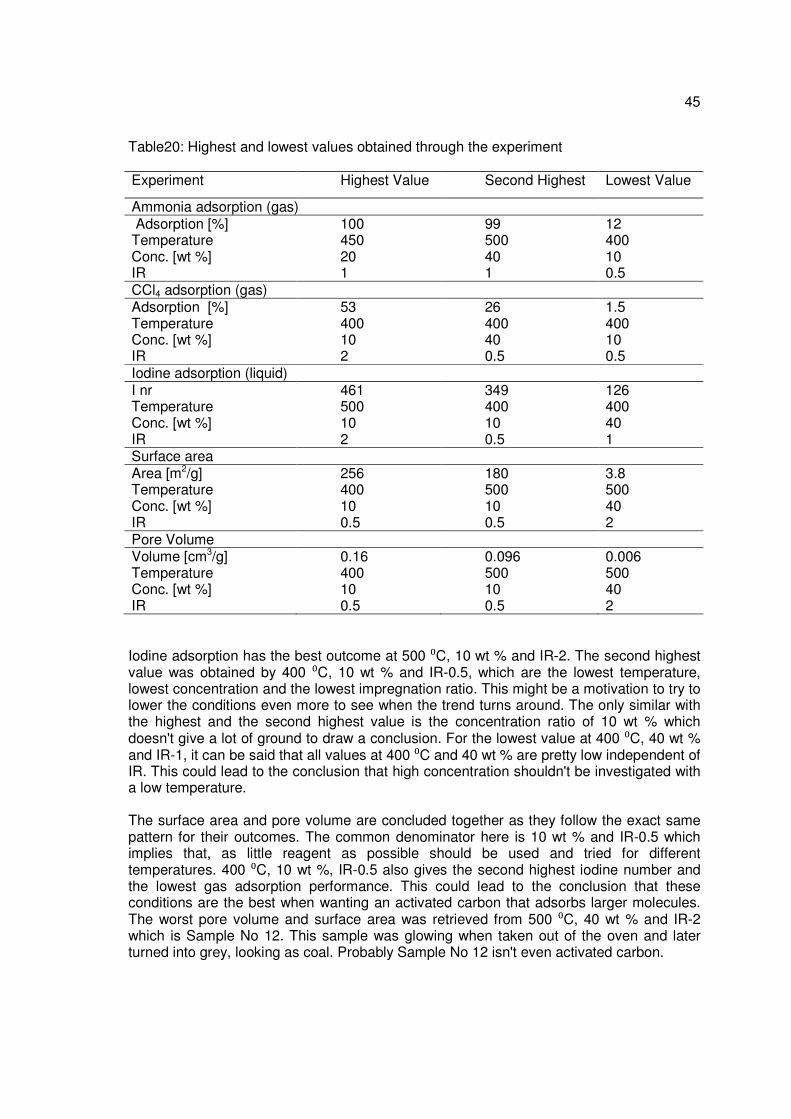
Table20: Highest and lowest values obtained through the experiment
Experiment Highest Value Second Highest Lowest Value
Ammonia adsorption (gas) Adsorption [%] 100 99 12 Temperature 450 500 400 Conc. [wt %] 20 40 10 IR 1 1 0.5 CCl4 adsorption (gas) Adsorption [%] 53 26 1.5 Temperature 400 400 400 Conc. [wt %] 10 40 10 IR 2 0.5 0.5 Iodine adsorption (liquid) I nr 461 349 126 Temperature 500 400 400 Conc. [wt %] 10 10 40 IR 2 0.5 1 Surface area Area [m2/g] 256 180 3.8 Temperature 400 500 500 Conc. [wt %] 10 10 40 IR 0.5 0.5 2 Pore Volume Volume [cm3/g] 0.16 0.096 0.006 Temperature 400 500 500 Conc. [wt %] 10 10 40 IR 0.5 0.5 2
Iodine adsorption has the best outcome at 500 ⁰C, 10 wt % and IR-2. The second highest value was obtained by 400 ⁰C, 10 wt % and IR-0.5, which are the lowest temperature, lowest concentration and the lowest impregnation ratio. This might be a motivation to try to lower the conditions even more to see when the trend turns around. The only similar with the highest and the second highest value is the concentration ratio of 10 wt % which doesn't give a lot of ground to draw a conclusion. For the lowest value at 400 ⁰C, 40 wt % and IR-1, it can be said that all values at 400 ⁰C and 40 wt % are pretty low independent of IR. This could lead to the conclusion that high concentration shouldn't be investigated with a low temperature. The surface area and pore volume are concluded together as they follow the exact same pattern for their outcomes. The common denominator here is 10 wt % and IR-0.5 which implies that, as little reagent as possible should be used and tried for different temperatures. 400 ⁰C, 10 wt %, IR-0.5 also gives the second highest iodine number and the lowest gas adsorption performance. This could lead to the conclusion that these conditions are the best when wanting an activated carbon that adsorbs larger molecules. The worst pore volume and surface area was retrieved from 500 ⁰C, 40 wt % and IR-2 which is Sample No 12. This sample was glowing when taken out of the oven and later turned into grey, looking as coal. Probably Sample No 12 isn't even activated carbon.
46
6. CONTINUED WORK
As an improvement of this thesis and other thesis's done on the subject it would give more consistent and accurate results to concentrate on either gas or liquid adsorption performance and trying to optimize towards this goal as the experiments are being done. This would mean that for every sample of carbon being prepared an analysis should be done and the conditions for the next round set by the results of the analysis. Also more samples with the same variables should be done to increase the reliability of the results. Further, the experimental procedure of preparing active carbon could be better synchronized between The University of Pinar del Rio and KTH. The precursor used, sawdust from a pine tree in the region of Pinar del Rio, could be more specific, as in actually going to collect residuals from a nearby saw mill instead of making sawdust from a piece of wood. To note the quality of the sawdust depending on time of year would be useful if a cost analysis for drying the sawdust needs to be done in the future. As there were no access to nitrogen for the production of the AC in Pinar del Rio the same samples should produced at KTH to compare the quality of the AC done in an inert environment. There have been many projects on AC within the same cooperation as this project, the results of these projects should be summarized into a larger conclusion for a better future research on the subject. A pre study of the possibility for Cuba to actually start a production of chemically activated AC should be investigated. Very interesting would also be to see the production of AC in a modern factory and identify possible improvements, economical and in terms of energy efficiency.
47
7. REFERENCES
Ambrosio U, D. (2011): Cuban pine forests, World Wildlife Fund © 2001. Available at www.nationalgeographic.com, reviewed by Rosemarie Gnam, last revised: not found American Society for Testing and Materials, ASTM (2010a). D2866 – 94 ”Standard Test Methods for Moisture in Activated Carbon1” UNICAMP. Available at www.astm.org, last revised [2010-06-17] American Society for Testing and Materials, ASTM (2010b). D2867 – 09 ” Standard Test Method for Total Ash Content of Activated Carbon1” UNICAMP. Available at www.astm.org, last revised [2010-06-17] American Society for Testing and Materials, ASTM (2010c). D5832 – 98” Standard Test Method for Volatile Matter Content of Activated Carbon Samples1” UNICAMP. Available at www.astm.org, last revised [2010-06-18] Bansal R.C., Donnet J-B, Stoeckli F. (1988): Active Carbon, Marcel Dekker, Inc. in New York, United States of America Barrett & Golf (1962): Pinus Caribaea, Published in: Caribbean Forester 23(2): 65. 1962. Available at www.conabio.gob.mx Beckman Coulter (2010): BET Surface Area & Pore Size Distribution Analysis, 2010 Beckman Coulter, Inc. Available at www.beckmancoulter.com, last revised: not found Bijavica, D. (2010): Preparation of activated carbon from agricultural and forest residues by chemical activation MSc. thesis. Department of Chemical Engineering and Technology Royal Institute of Technology, Stockholm Conifer Specialist Group (1998): Pinus caribaea var. caribaea, Published in: IUCN 2010, IUCN Red List of Threatened Species, Version 2010.4. Available at www.iucnredlist.org Desotec Activated Carbon (2011): Chemical structure of activated carbon, 2006 - 2011 DESOTEC N.V. - S.A. Available at www.desotec.com, last revised: not found
Encyclopedia Britannica (2011a): phosphoric acid, Encyclopædia Britannica Academic Edition. Available at www.britannica.com, last revised: [2007-04-12]
Encyclopedia Britannica (2011b): Zinc (Zn), Encyclopædia Britannica Academic Edition. Available at www.britannica.com, last revised: [2009-04-17]
Kan-Carbon Private Limited (2011): Activated Carbon, Kan-Carbon Private Limited, India. Available at www.activatedcarbonindia.com , last revised: not found SkogsSverige (2011): Tall, (Pinus Sylvestris), SkogsSverige. Available at www.skogssverige.se, last revised: not found Sultana R. (2010): Preparation of Activated Carbon by chemical activation with phosphoric acid using different precursors from Cuba, MSc. Thesis. Department of Chemical Engineering and Technology Royal Institute of Technology, Stockholm