Embed Size (px)
Citation preview

Preparation and characterization of polycaprolactone microspheres by electrospraying
Feng-Lei Zhou 1,2,*, Penny L. Hubbard Cristinacce 3, Stephen J. Eichhorn 4 and Geoff J. M. Parker 1,5*
1Centre for Imaging Sciences, The University of Manchester, Manchester M13 9PT, United
Kingdom, 2The School of Materials, The University of Manchester, Manchester M13 9PL, United
Kingdom, 3School of Psychological Sciences, The University of Manchester, Manchester M13 9PT,
United Kingdom, 4College of Engineering, Mathematics and Physical Sciences, North Park Road,
University of Exeter, Exeter EX4 4QF, United Kingdom, 5Bioxydyn Limited, Rutherford House,
Manchester Science Park, Pencroft Way, Manchester M15 6SZ, United Kingdom.
*Corresponding authors
Tel: +44 (0)161 275 5731; Fax: +44 (0)161 275 5145; Emails: [email protected] and
Running title: Electrospraying of 3D polycaprolactone microspheres
Keywords: Electrospraying, polycaprolactone, microspheres, 3D microstructure
Abstract
The ability to reproducibly produce and effectively collect electrosprayed polymeric microspheres
with controlled morphology and size in bulk form is challenging. In this study, microparticles were
produced by electrospraying polycaprolactone (PCL) of various molecular weights and solution
concentrations in chloroform, and by collecting materials on different substrates. The resultant PCL
microparticles were characterized by optical and electron microscopy to investigate the effect of
molecular weight, solution concentration, applied voltage, working distance and flow rate on their
morphology and size. The work demonstrates the key role of a moderate molecular weight and/or
solution concentration in the formation of spherical PCL particles via an electrospraying process.
Increasing the applied voltage was found to produce smaller and more uniform PCL microparticles.
There was a relatively low increase in the particle average size with an increase in the working distance
and flow rate. Four types of substrates were adopted to collect electrosprayed PCL particles: a glass
slide, aluminium foil, liquid bath and copper wire. Unlike 2D bulk structures collected on the other
substrates, a 3D tubular structure of microspheres was formed on the copper wire and could find
application in the construction of 3D tumour mimics.
1. Introduction
Electrospraying and its variant, electrospinning, are two techniques capable of fabricating nano- or
micro-sized droplets/fibres from polymer solutions by means of electric forces (Li and Xia 2004;
Jaworek 2007). Electrospraying/electrospinning can be used to engineer micro- or nanometer
architectures such as particles, fibres, prints/fabrics or encapsulated particles with controllable
nanostructure. Electrospraying/electrospinning parameters (applied voltage, flow rate, working
distance, etc.), solution properties (solution viscosity, solution conductivity, surface tension, molecular
weight of the polymer, etc.), and environmental conditions (temperature, humidity, etc.) are the main
factors that influence the electrospraying/electrospinning process. By changing these factors,
polymeric particles/fibres with various morphologies and sizes can be tuned for a specific polymer
solution. Compared with the wide range of applications for electrospun fibres (Burger et al. 2006),
electrosprayed polymeric particles within the micro- to nano-meter range find applications mainly in
drug delivery (Bock et al. 2012) .
Polycaprolactone (PCL) is suitable for long-term controlled drug delivery due to its high permeability
to excipients, excellent biocompatibility, its ability to be fully excreted from the body and its slow
degradation (more than one year) (Woodruff and Hutmacher 2010). There have been significant recent
studies on the electrospinning of PCL because of the advantages of using this material for tissue
scaffolds (Cipitria et al. 2011; Van der Schueren et al 2011). Compared with poly(lactic-co-glycolic
acid) (PLGA), which is the most commonly used polymer in electrospraying (Bock et al. 2012) , there
have been a relatively limited number of studies on the electrospraying of PCL (Wu and Clark 2007;
Enayati et al. 2010, Bock et al. 2011; Guarino et al. 2012). In addition, although the effect of collecting
substrates on the physical properties of electrospun nanofibres has been undertaken (Teo and
Ramakrishna 2006), no previous reports on the effect of collecting substrates on electrosprayed
particle assemblies has been identified. Such information is important for the production of PCL
microparticle assemblies with controlled morphology and size. This paper focuses on the
electrospraying of PCL microparticles onto various collecting substrates. A systematic investigation
on the effect of processing parameters, including polymer molecular weight, solution concentration,
applied voltage, working distance and flow rate on the size of PCL particles produced was carried out.
A number of different substrates were employed to collect PCL microparticles in order to produce
various types of assemblies.
2. Experimental Section
2.1. Materials
Polycaprolactone in three formulations (PCL, number-average molecular weights Mn =
70,00090,000 (PCL-1), 45,000 (PCL-2) and 10,000 (PCL-3) g mol-1) was obtained from Sigma
Aldrich (Dorset, UK) and used as received. Chloroform solvent was also purchased from Sigma
Aldrich (Dorset, UK).
2.2. Preparation of PCL microparticles
PCL solutions were prepared by dissolving PCL in chloroform and stirring overnight at room
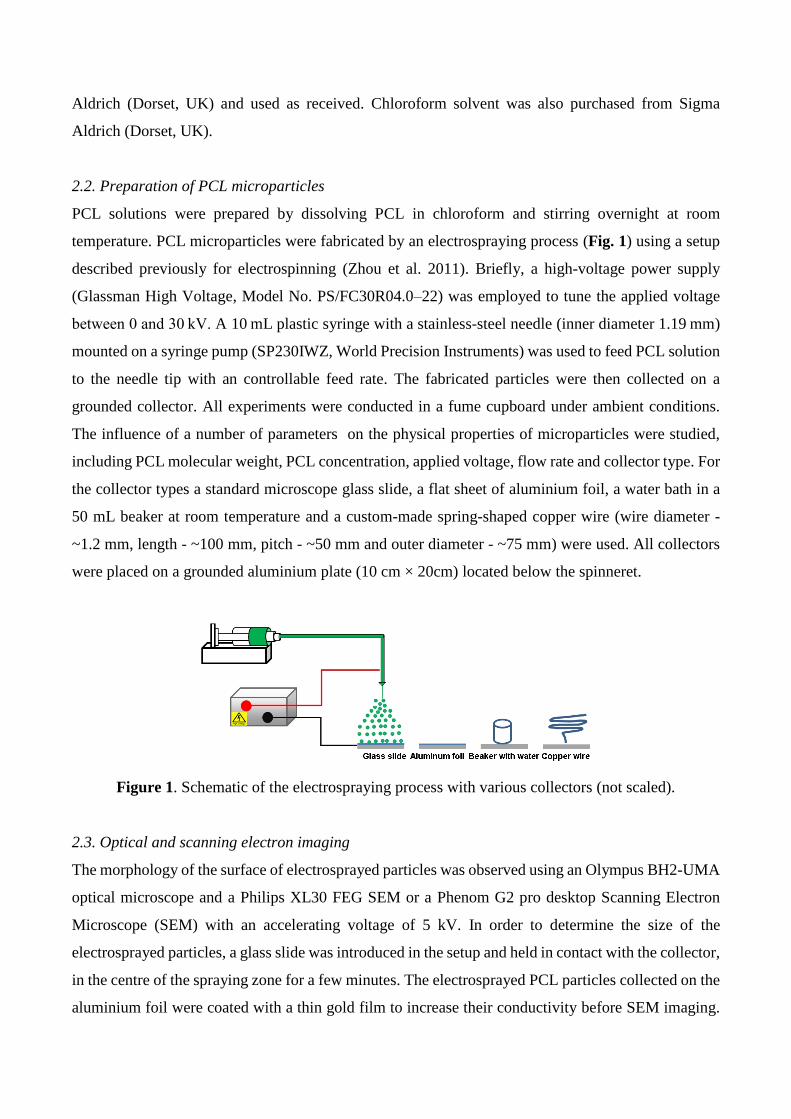
temperature. PCL microparticles were fabricated by an electrospraying process (Fig. 1) using a setup
described previously for electrospinning (Zhou et al. 2011). Briefly, a high-voltage power supply
(Glassman High Voltage, Model No. PS/FC30R04.0–22) was employed to tune the applied voltage
between 0 and 30 kV. A 10 mL plastic syringe with a stainless-steel needle (inner diameter 1.19 mm)
mounted on a syringe pump (SP230IWZ, World Precision Instruments) was used to feed PCL solution
to the needle tip with an controllable feed rate. The fabricated particles were then collected on a
grounded collector. All experiments were conducted in a fume cupboard under ambient conditions.
The influence of a number of parameters on the physical properties of microparticles were studied,
including PCL molecular weight, PCL concentration, applied voltage, flow rate and collector type. For
the collector types a standard microscope glass slide, a flat sheet of aluminium foil, a water bath in a
50 mL beaker at room temperature and a custom-made spring-shaped copper wire (wire diameter -
~1.2 mm, length - ~100 mm, pitch - ~50 mm and outer diameter - ~75 mm) were used. All collectors
were placed on a grounded aluminium plate (10 cm × 20cm) located below the spinneret.
Figure 1. Schematic of the electrospraying process with various collectors (not scaled).
2.3. Optical and scanning electron imaging
The morphology of the surface of electrosprayed particles was observed using an Olympus BH2-UMA
optical microscope and a Philips XL30 FEG SEM or a Phenom G2 pro desktop Scanning Electron
Microscope (SEM) with an accelerating voltage of 5 kV. In order to determine the size of the
electrosprayed particles, a glass slide was introduced in the setup and held in contact with the collector,
in the centre of the spraying zone for a few minutes. The electrosprayed PCL particles collected on the
aluminium foil were coated with a thin gold film to increase their conductivity before SEM imaging.
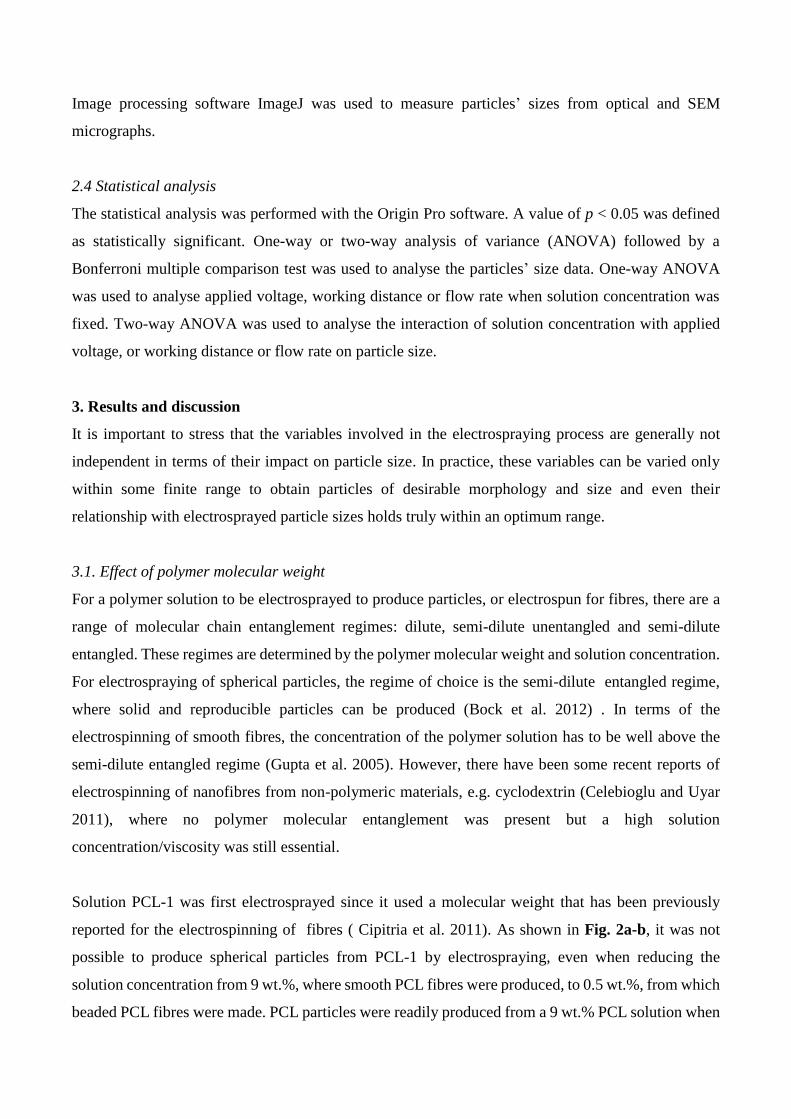
Image processing software ImageJ was used to measure particles’ sizes from optical and SEM
micrographs.
2.4 Statistical analysis
The statistical analysis was performed with the Origin Pro software. A value of p < 0.05 was defined
as statistically significant. One-way or two-way analysis of variance (ANOVA) followed by a
Bonferroni multiple comparison test was used to analyse the particles’ size data. One-way ANOVA
was used to analyse applied voltage, working distance or flow rate when solution concentration was
fixed. Two-way ANOVA was used to analyse the interaction of solution concentration with applied
voltage, or working distance or flow rate on particle size.
3. Results and discussion
It is important to stress that the variables involved in the electrospraying process are generally not
independent in terms of their impact on particle size. In practice, these variables can be varied only
within some finite range to obtain particles of desirable morphology and size and even their
relationship with electrosprayed particle sizes holds truly within an optimum range.
3.1. Effect of polymer molecular weight
For a polymer solution to be electrosprayed to produce particles, or electrospun for fibres, there are a
range of molecular chain entanglement regimes: dilute, semi-dilute unentangled and semi-dilute
entangled. These regimes are determined by the polymer molecular weight and solution concentration.
For electrospraying of spherical particles, the regime of choice is the semi-dilute entangled regime,
where solid and reproducible particles can be produced (Bock et al. 2012) . In terms of the
electrospinning of smooth fibres, the concentration of the polymer solution has to be well above the
semi-dilute entangled regime (Gupta et al. 2005). However, there have been some recent reports of
electrospinning of nanofibres from non-polymeric materials, e.g. cyclodextrin (Celebioglu and Uyar
2011), where no polymer molecular entanglement was present but a high solution
concentration/viscosity was still essential.
Solution PCL-1 was first electrosprayed since it used a molecular weight that has been previously
reported for the electrospinning of fibres ( Cipitria et al. 2011). As shown in Fig. 2a-b, it was not
possible to produce spherical particles from PCL-1 by electrospraying, even when reducing the
solution concentration from 9 wt.%, where smooth PCL fibres were produced, to 0.5 wt.%, from which
beaded PCL fibres were made. PCL particles were readily produced from a 9 wt.% PCL solution when
the molecular weight was decreased to 45k (PCL-2) and 10k (PCL-3); particles were produced with
average diameters of 36.2 ± 2.8 μm and 47.2 ± 15.7 μm, respectively (Fig. 2c-d). When the
concentration of PCL-2 was slightly increased from 9 wt.% to 11 wt.%, a number of very fine PCL
fibres were produced, along with microparticles (see Fig. 2e). However, for PCL-3, particles with an
average diameter of 50.3 ± 5.1 μm were produced, even from a 30 wt.% solution (Fig. 2f), indicating
a low molecular weight of PCL could produce spherical particles from a wider range of solution
concentrations. The effect of PCL molecular weight and solution concentration on the formation of
particles is in agreement with similar findings for the electrospraying of PLGA (Meng et al. 2009).
SEM imaging (inset in Fig. 2c) further revealed that the electrosprayed PCL particles from PCL-2 had
spherical shape and smooth surface. For PCL-3, the particles appeared to collapse when the PCL
concentration was 9 wt.% (inset in Fig. 2d). A hole with an average size of approximately 8.4 ± 2.3
μm was however formed on each particle surface when the PCL concentration was increased to 30
wt.% (inset in Fig. 2f). It has been previously reported that the surface morphology of PCL particles
changes from a smooth surface to a rough corrugated surface when the solution concentration is
reduced and that a lower molecular weight leads to the formation of particles with a hole in the surface
(Xie et al. 2006). A solvent evaporation-induced phase separation was proposed to explain the
formation of holes in electrosprayed PCL particles (Wu and Clark 2007).
Figure 2. Optical micrographs showing the effects of polymer molecular weight and solution
concentration on electrosprayed fibres and particles: (a) smooth fibres from PCL-1, 10 wt.%; (b)
beaded fibres from PCL-1, 0.5 wt.%; (c) particles from PCL-2, 9 wt.% (average diameter ± standard
deviation: 36.2 ± 2.8 μm, inset: SEM micrograph); (d) particles from PCL-3, 9 wt.% (47.2 ± 15.7 μm,
c
d e f
a b
inset: SEM micrograph); (e) particles with fibrils from PCL-2, 11 wt. %; (f) particles from PCL-2, 30
wt.% (50.3 ± 5.1 μm, inset: SEM micrograph).
3.2. Effect of applied voltage
A sufficient applied voltage is required to overcome the surface tension of the droplet at the needle tip
and thus controls the morphology and size of electrosprayed particles. It is generally accepted that an
increase in the applied voltage can lead to a decrease in the size of microparticles. However, very high
voltages cannot be used because of the onset of an unstable jet. There is usually a lower and upper
voltage limit, which allows a stable jet in electrospraying, resulting in monodispersed particles and
better repeatability and reproducibility.
For PCL-2 with 1 wt.% and 5 wt.% concentrations, an increase in applied voltage tended to produce
more uniform and smaller PCL particles (Fig. 3a-c). For example, in the case of 1 wt.% PCL-2 solution,
the average diameter of the particles significantly increased (one-way ANOVA, p < 0.05) from 16.9 ±
5.9 μm at 6.5 kV to 18.6 ± 7.6 μm at 7.5 kV, and then dramatically decreased to 10.0 ± 1.6 μm at 8.5
kV (Table 1). There were also significant changes in particle diameters for a 5 wt.% PCL solution ;
from 27.6 ± 11.4 μm through 23.8 ± 6.8 μm, to 21.9 ± 5.6 μm (Fig. 3d-f) with increasing applied
voltage. These dramatic reductions in diameter are likely to be because the stronger electric field at
the higher voltage forces the conical meniscus at the needle tip to deform and to break into smaller
droplets. As shown in Fig. 3g-i, for a 7 wt.% PCL solution, the change in PCL particle sizes became
much less noticeable than those from 1 wt.% and 5 wt.% solutions. Bonferroni-corrected post-hoc tests
further pointed towards no significant difference (p > 0.05) in the mean sizes of particles produced
from a 7 wt.% PCL-2 solution when the applied voltage was changed from 9 kV to 10 kV, although
there was a significant change from 8 kV to 9 kV. This indicated that the effect of the applied voltage
could become weak with a relatively high concentration of the solution. It should be noted that too a
high voltage resulted in an unstable spray (data not shown). Two-way ANOVA tests further revealed
that the solution concentration and applied voltage had a significant interaction (p < 0.05). As shown
by the histograms in Table 1, PCL particles produced using 1 wt.% and 5 wt.% solutions had wider
size distributions than those generated from 7 wt.% solution; for all three PCL solutions, a higher
applied voltage could benefit the formation of uniform spherical particles.

Figure 3. Effect of applied voltage on the morphology and size of PCL particles electrosprayed from
PCL-2, Mw = 45k. (a) 1 wt.%-6.5 kV; (b) 1 wt.%-7.5 kV; (c) 1 wt.%-8.5 kV; (d) 5 wt.%-6.5 kV; (e) 5
wt.%-7.5 kV; (f) 5 wt.%-8.5 kV; (g) 7 wt.%-8 kV; (h) 7 wt.%-9 kV; (i) 7 wt.%-10 kV.
a b c
d e f
g h i
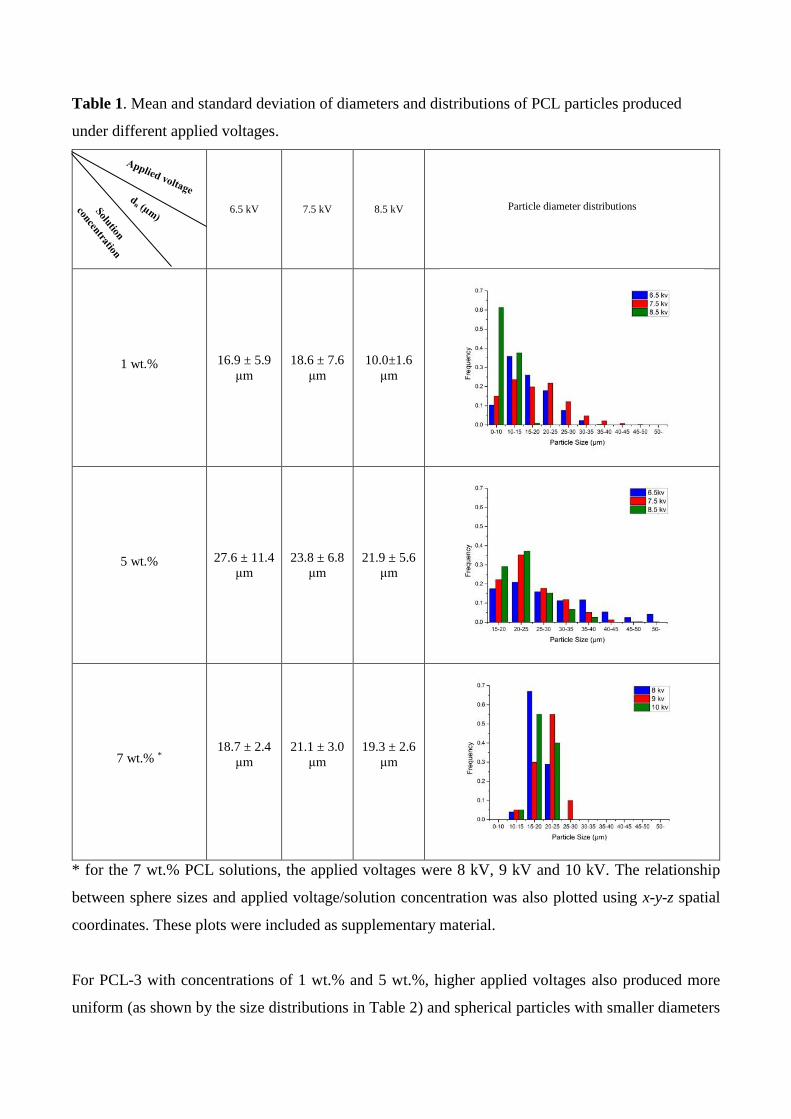
Table 1. Mean and standard deviation of diameters and distributions of PCL particles produced
under different applied voltages.
6.5 kV 7.5 kV 8.5 kV Particle diameter distributions
1 wt.% 16.9 ± 5.9
μm
18.6 ± 7.6
μm
10.0±1.6
μm
5 wt.% 27.6 ± 11.4
μm
23.8 ± 6.8
μm
21.9 ± 5.6
μm
7 wt.% * 18.7 ± 2.4
μm
21.1 ± 3.0
μm
19.3 ± 2.6
μm
* for the 7 wt.% PCL solutions, the applied voltages were 8 kV, 9 kV and 10 kV. The relationship
between sphere sizes and applied voltage/solution concentration was also plotted using x-y-z spatial
coordinates. These plots were included as supplementary material.
For PCL-3 with concentrations of 1 wt.% and 5 wt.%, higher applied voltages also produced more
uniform (as shown by the size distributions in Table 2) and spherical particles with smaller diameters
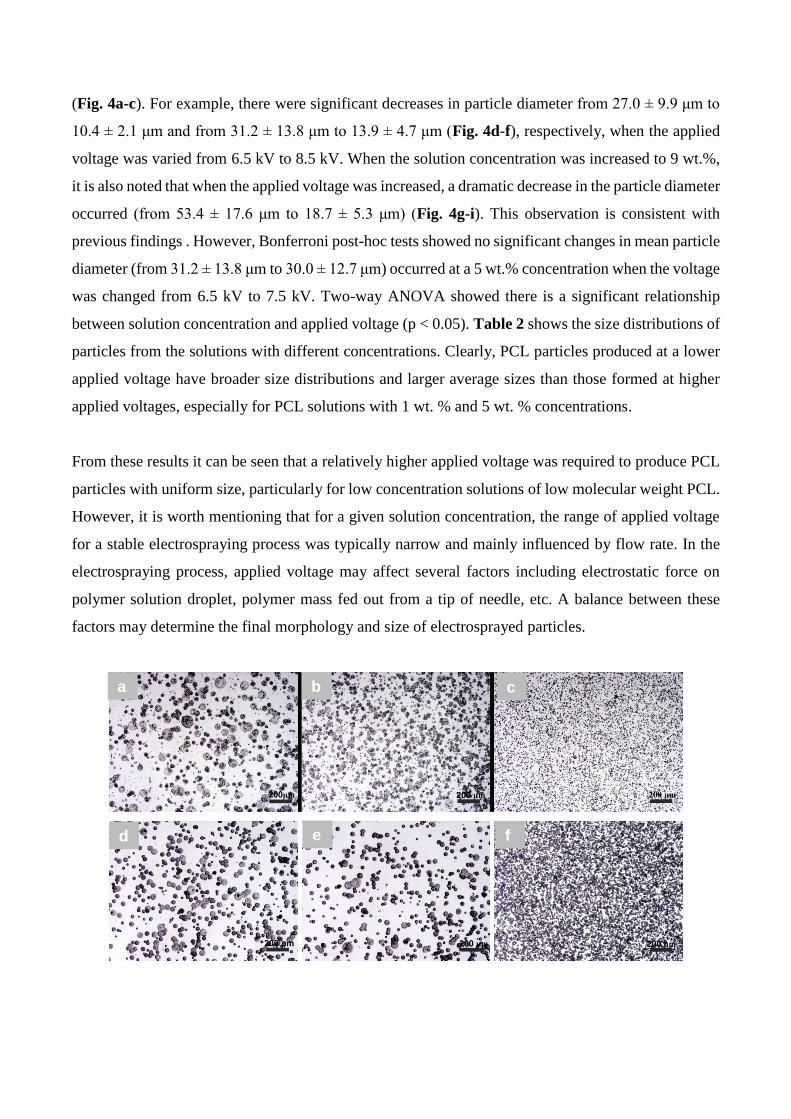
(Fig. 4a-c). For example, there were significant decreases in particle diameter from 27.0 ± 9.9 μm to
10.4 ± 2.1 μm and from 31.2 ± 13.8 μm to 13.9 ± 4.7 μm (Fig. 4d-f), respectively, when the applied
voltage was varied from 6.5 kV to 8.5 kV. When the solution concentration was increased to 9 wt.%,
it is also noted that when the applied voltage was increased, a dramatic decrease in the particle diameter
occurred (from 53.4 ± 17.6 μm to 18.7 ± 5.3 μm) (Fig. 4g-i). This observation is consistent with
previous findings . However, Bonferroni post-hoc tests showed no significant changes in mean particle
diameter (from 31.2 ± 13.8 μm to 30.0 ± 12.7 μm) occurred at a 5 wt.% concentration when the voltage
was changed from 6.5 kV to 7.5 kV. Two-way ANOVA showed there is a significant relationship
between solution concentration and applied voltage (p < 0.05). Table 2 shows the size distributions of
particles from the solutions with different concentrations. Clearly, PCL particles produced at a lower
applied voltage have broader size distributions and larger average sizes than those formed at higher
applied voltages, especially for PCL solutions with 1 wt. % and 5 wt. % concentrations.
From these results it can be seen that a relatively higher applied voltage was required to produce PCL
particles with uniform size, particularly for low concentration solutions of low molecular weight PCL.
However, it is worth mentioning that for a given solution concentration, the range of applied voltage
for a stable electrospraying process was typically narrow and mainly influenced by flow rate. In the
electrospraying process, applied voltage may affect several factors including electrostatic force on
polymer solution droplet, polymer mass fed out from a tip of needle, etc. A balance between these
factors may determine the final morphology and size of electrosprayed particles.
a b c
d e f
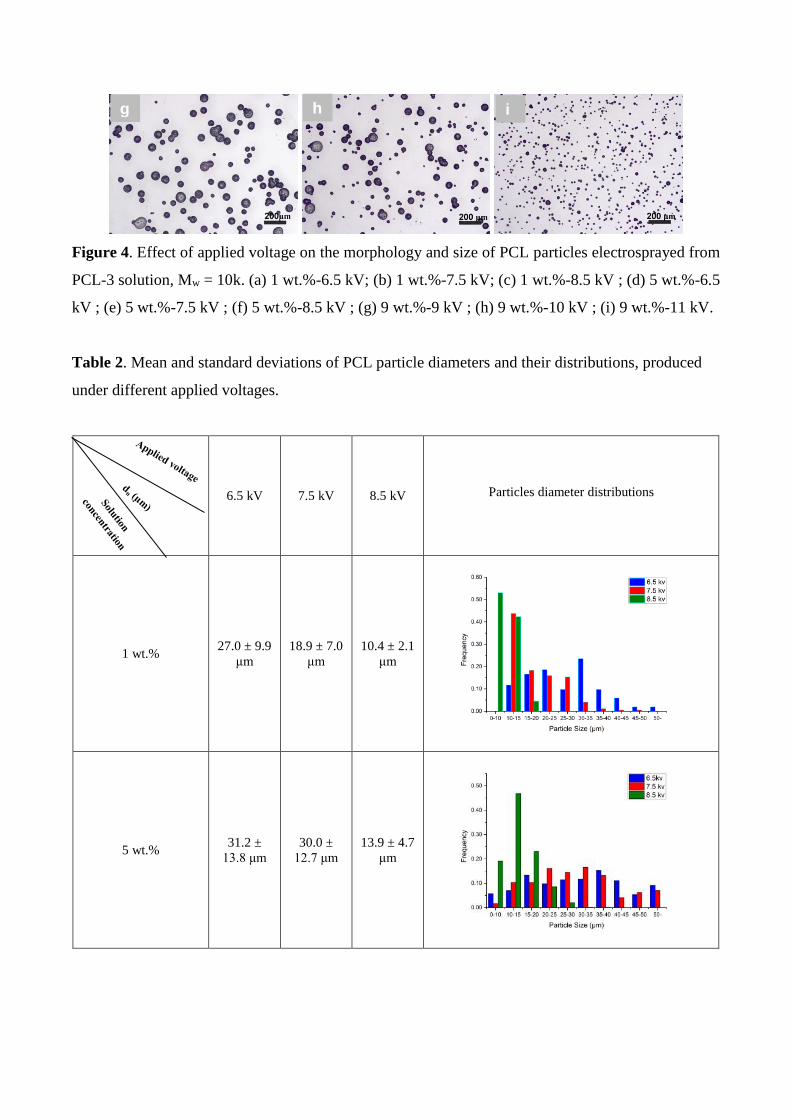
Figure 4. Effect of applied voltage on the morphology and size of PCL particles electrosprayed from
PCL-3 solution, Mw = 10k. (a) 1 wt.%-6.5 kV; (b) 1 wt.%-7.5 kV; (c) 1 wt.%-8.5 kV ; (d) 5 wt.%-6.5
kV ; (e) 5 wt.%-7.5 kV ; (f) 5 wt.%-8.5 kV ; (g) 9 wt.%-9 kV ; (h) 9 wt.%-10 kV ; (i) 9 wt.%-11 kV.
Table 2. Mean and standard deviations of PCL particle diameters and their distributions, produced
under different applied voltages.
6.5 kV 7.5 kV 8.5 kV Particles diameter distributions
1 wt.% 27.0 ± 9.9
μm
18.9 ± 7.0
μm
10.4 ± 2.1
μm
5 wt.% 31.2 ±
13.8 μm
30.0 ±
12.7 μm
13.9 ± 4.7
μm
h g i
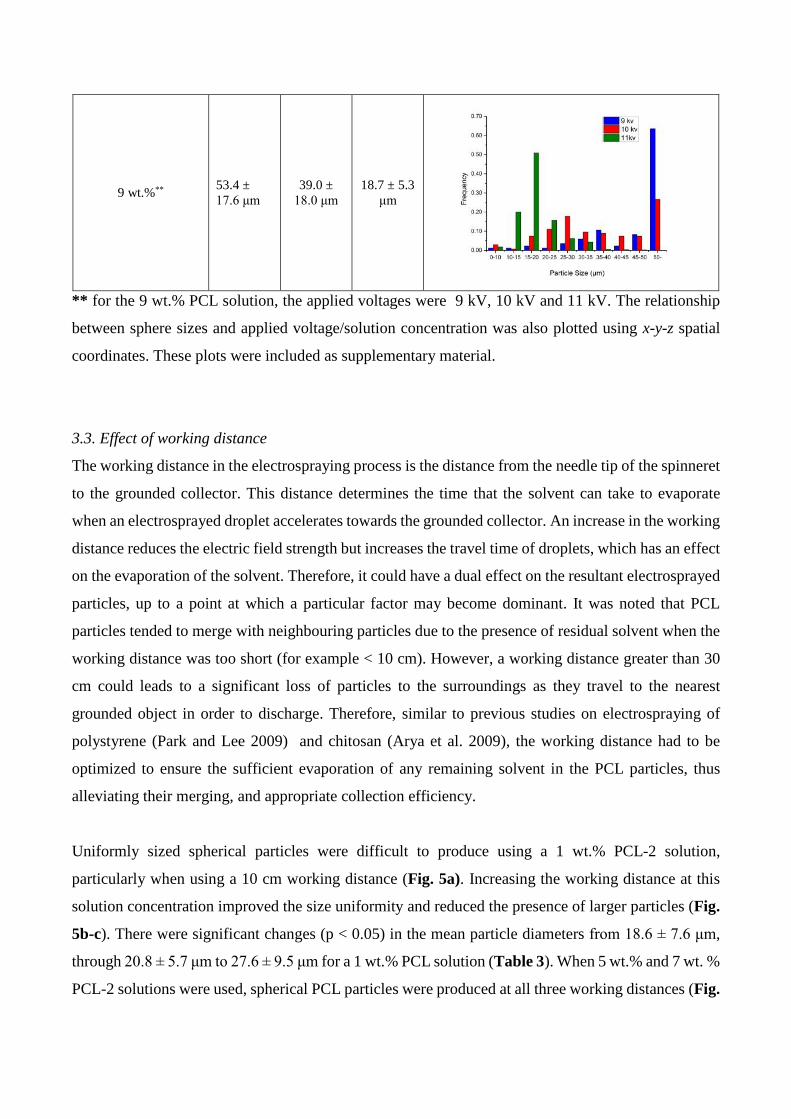
9 wt.%** 53.4 ±
17.6 μm
39.0 ±
18.0 μm
18.7 ± 5.3
μm
** for the 9 wt.% PCL solution, the applied voltages were 9 kV, 10 kV and 11 kV. The relationship
between sphere sizes and applied voltage/solution concentration was also plotted using x-y-z spatial
coordinates. These plots were included as supplementary material.
3.3. Effect of working distance
The working distance in the electrospraying process is the distance from the needle tip of the spinneret
to the grounded collector. This distance determines the time that the solvent can take to evaporate
when an electrosprayed droplet accelerates towards the grounded collector. An increase in the working
distance reduces the electric field strength but increases the travel time of droplets, which has an effect
on the evaporation of the solvent. Therefore, it could have a dual effect on the resultant electrosprayed
particles, up to a point at which a particular factor may become dominant. It was noted that PCL
particles tended to merge with neighbouring particles due to the presence of residual solvent when the
working distance was too short (for example < 10 cm). However, a working distance greater than 30
cm could leads to a significant loss of particles to the surroundings as they travel to the nearest
grounded object in order to discharge. Therefore, similar to previous studies on electrospraying of
polystyrene (Park and Lee 2009) and chitosan (Arya et al. 2009), the working distance had to be
optimized to ensure the sufficient evaporation of any remaining solvent in the PCL particles, thus
alleviating their merging, and appropriate collection efficiency.
Uniformly sized spherical particles were difficult to produce using a 1 wt.% PCL-2 solution,
particularly when using a 10 cm working distance (Fig. 5a). Increasing the working distance at this
solution concentration improved the size uniformity and reduced the presence of larger particles (Fig.
5b-c). There were significant changes (p < 0.05) in the mean particle diameters from 18.6 ± 7.6 μm,
through 20.8 ± 5.7 μm to 27.6 ± 9.5 μm for a 1 wt.% PCL solution (Table 3). When 5 wt.% and 7 wt. %
PCL-2 solutions were used, spherical PCL particles were produced at all three working distances (Fig.
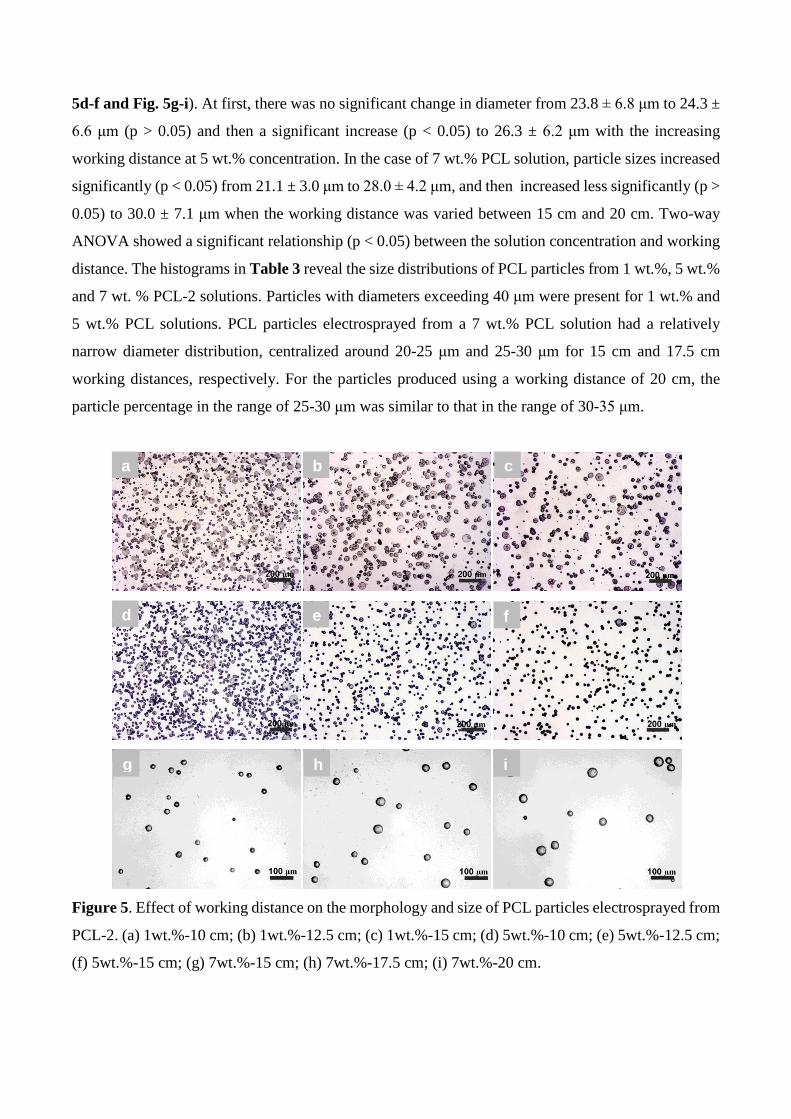
5d-f and Fig. 5g-i). At first, there was no significant change in diameter from 23.8 ± 6.8 μm to 24.3 ±
6.6 μm (p > 0.05) and then a significant increase (p < 0.05) to 26.3 ± 6.2 μm with the increasing
working distance at 5 wt.% concentration. In the case of 7 wt.% PCL solution, particle sizes increased
significantly (p < 0.05) from 21.1 ± 3.0 μm to 28.0 ± 4.2 μm, and then increased less significantly (p >
0.05) to 30.0 ± 7.1 μm when the working distance was varied between 15 cm and 20 cm. Two-way
ANOVA showed a significant relationship (p < 0.05) between the solution concentration and working
distance. The histograms in Table 3 reveal the size distributions of PCL particles from 1 wt.%, 5 wt.%
and 7 wt. % PCL-2 solutions. Particles with diameters exceeding 40 μm were present for 1 wt.% and
5 wt.% PCL solutions. PCL particles electrosprayed from a 7 wt.% PCL solution had a relatively
narrow diameter distribution, centralized around 20-25 μm and 25-30 μm for 15 cm and 17.5 cm
working distances, respectively. For the particles produced using a working distance of 20 cm, the
particle percentage in the range of 25-30 μm was similar to that in the range of 30-35 μm.
Figure 5. Effect of working distance on the morphology and size of PCL particles electrosprayed from
PCL-2. (a) 1wt.%-10 cm; (b) 1wt.%-12.5 cm; (c) 1wt.%-15 cm; (d) 5wt.%-10 cm; (e) 5wt.%-12.5 cm;
(f) 5wt.%-15 cm; (g) 7wt.%-15 cm; (h) 7wt.%-17.5 cm; (i) 7wt.%-20 cm.
a b c
d e f
g h i
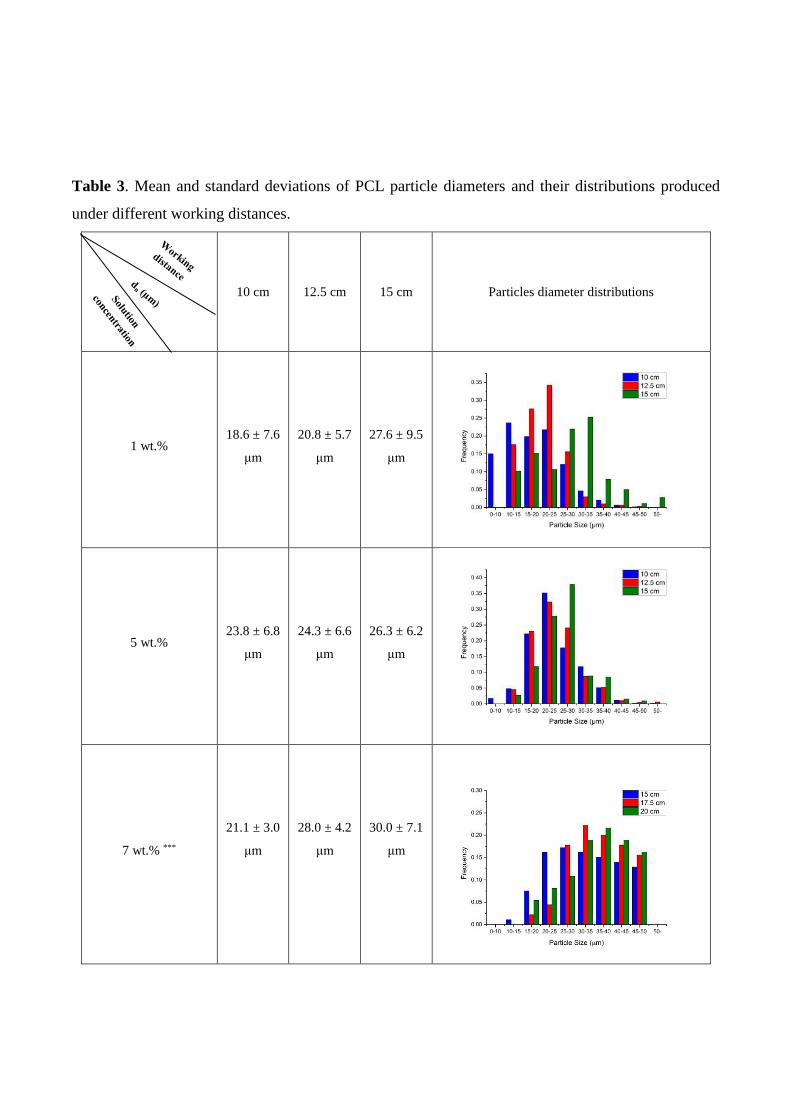
Table 3. Mean and standard deviations of PCL particle diameters and their distributions produced
under different working distances.
10 cm 12.5 cm 15 cm Particles diameter distributions
1 wt.% 18.6 ± 7.6
μm
20.8 ± 5.7
μm
27.6 ± 9.5
μm
5 wt.% 23.8 ± 6.8
μm
24.3 ± 6.6
μm
26.3 ± 6.2
μm
7 wt.% ***
21.1 ± 3.0
μm
28.0 ± 4.2
μm
30.0 ± 7.1
μm
*** for the 7 wt.% PCL solution, the working distance was 15 cm, 17.5 cm and 20 cm. The relationship
between sphere sizes and working distance/solution concentration was also plotted using x-y-z spatial
coordinates. These plots were included as supplementary material.
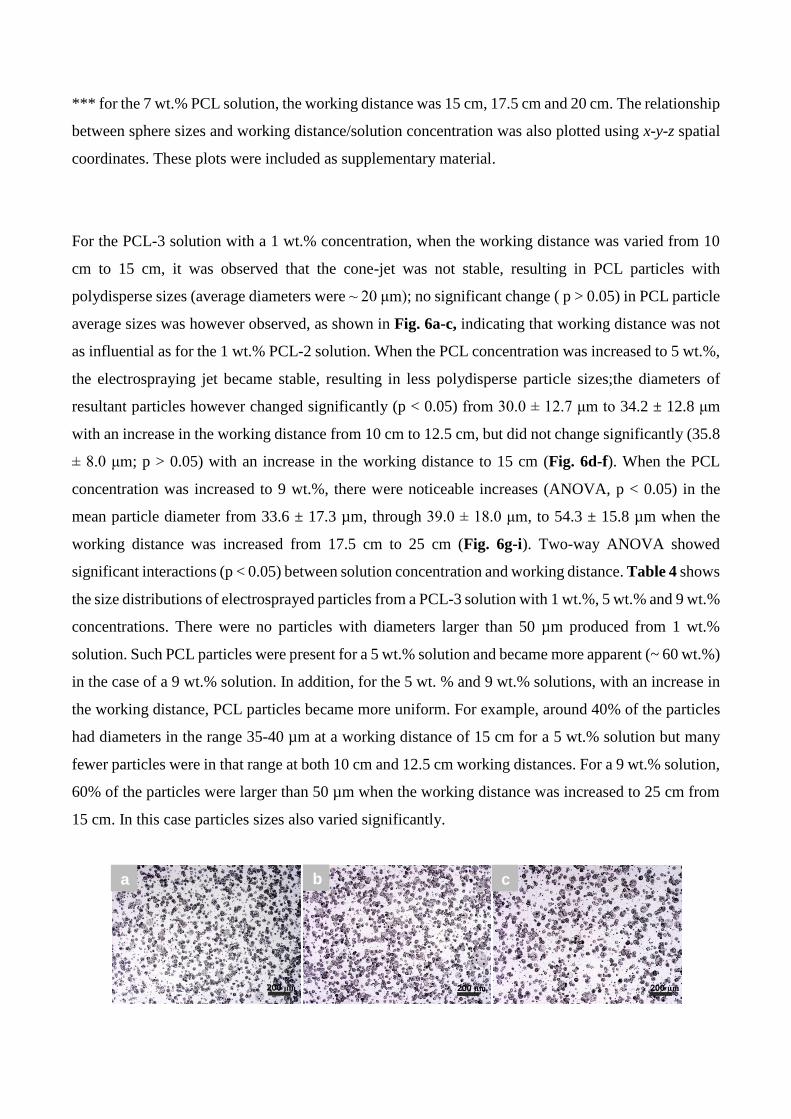
For the PCL-3 solution with a 1 wt.% concentration, when the working distance was varied from 10
cm to 15 cm, it was observed that the cone-jet was not stable, resulting in PCL particles with
polydisperse sizes (average diameters were ~ 20 μm); no significant change ( p > 0.05) in PCL particle
average sizes was however observed, as shown in Fig. 6a-c, indicating that working distance was not
as influential as for the 1 wt.% PCL-2 solution. When the PCL concentration was increased to 5 wt.%,
the electrospraying jet became stable, resulting in less polydisperse particle sizes;the diameters of
resultant particles however changed significantly (p < 0.05) from 30.0 ± 12.7 μm to 34.2 ± 12.8 μm
with an increase in the working distance from 10 cm to 12.5 cm, but did not change significantly (35.8
± 8.0 μm; p > 0.05) with an increase in the working distance to 15 cm (Fig. 6d-f). When the PCL
concentration was increased to 9 wt.%, there were noticeable increases (ANOVA, p < 0.05) in the
mean particle diameter from 33.6 ± 17.3 µm, through 39.0 ± 18.0 μm, to 54.3 ± 15.8 µm when the
working distance was increased from 17.5 cm to 25 cm (Fig. 6g-i). Two-way ANOVA showed
significant interactions (p < 0.05) between solution concentration and working distance. Table 4 shows
the size distributions of electrosprayed particles from a PCL-3 solution with 1 wt.%, 5 wt.% and 9 wt.%
concentrations. There were no particles with diameters larger than 50 µm produced from 1 wt.%
solution. Such PCL particles were present for a 5 wt.% solution and became more apparent (~ 60 wt.%)
in the case of a 9 wt.% solution. In addition, for the 5 wt. % and 9 wt.% solutions, with an increase in
the working distance, PCL particles became more uniform. For example, around 40% of the particles
had diameters in the range 35-40 µm at a working distance of 15 cm for a 5 wt.% solution but many
fewer particles were in that range at both 10 cm and 12.5 cm working distances. For a 9 wt.% solution,
60% of the particles were larger than 50 µm when the working distance was increased to 25 cm from
15 cm. In this case particles sizes also varied significantly.
a b c
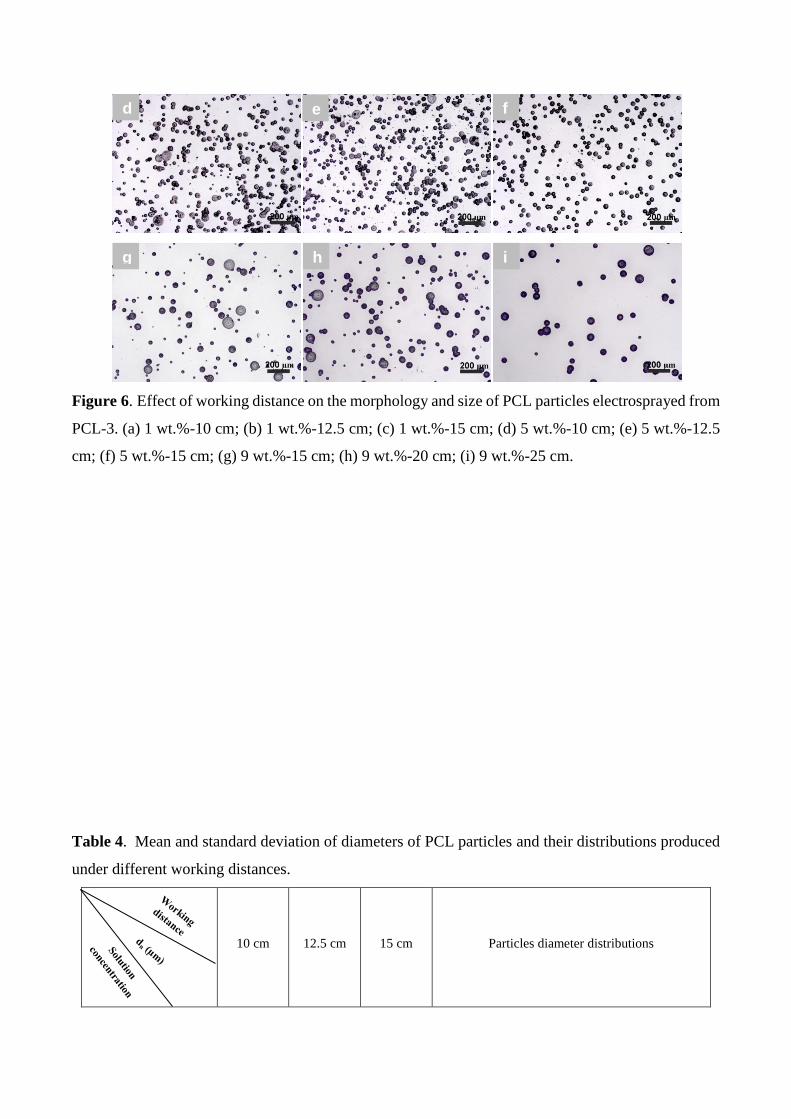
Figure 6. Effect of working distance on the morphology and size of PCL particles electrosprayed from
PCL-3. (a) 1 wt.%-10 cm; (b) 1 wt.%-12.5 cm; (c) 1 wt.%-15 cm; (d) 5 wt.%-10 cm; (e) 5 wt.%-12.5
cm; (f) 5 wt.%-15 cm; (g) 9 wt.%-15 cm; (h) 9 wt.%-20 cm; (i) 9 wt.%-25 cm.
Table 4. Mean and standard deviation of diameters of PCL particles and their distributions produced
under different working distances.
10 cm 12.5 cm 15 cm Particles diameter distributions
d e f
g h i
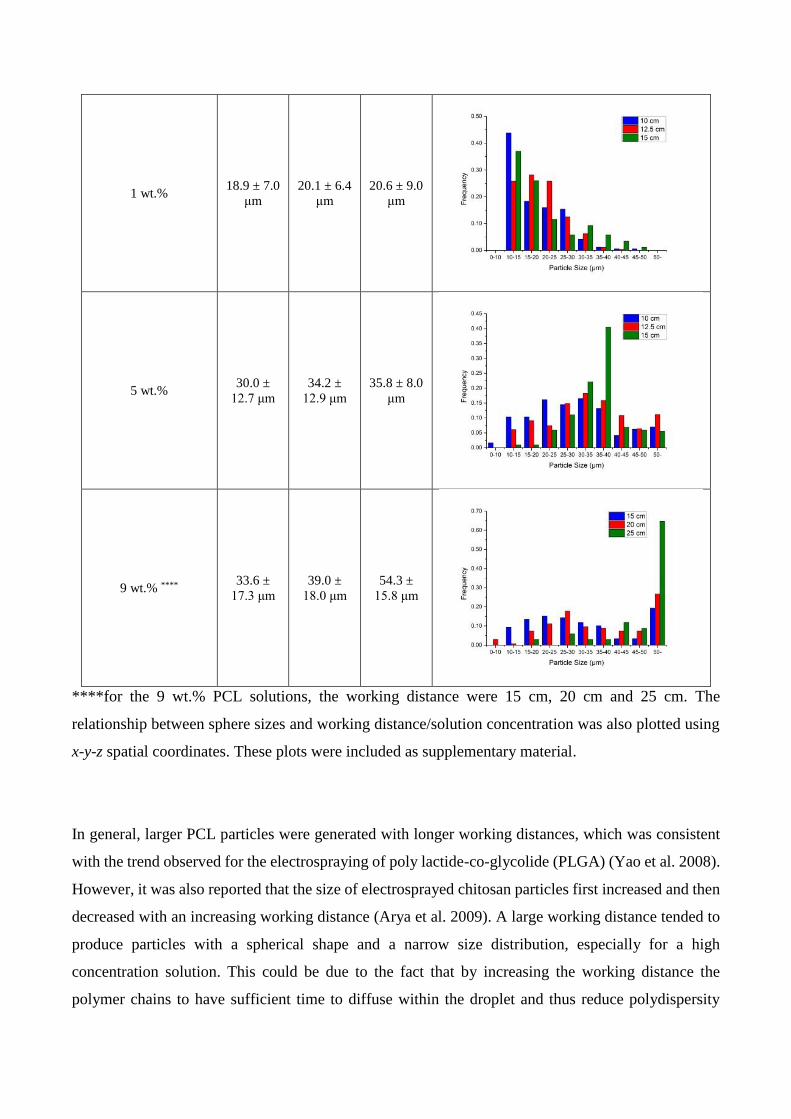
1 wt.% 18.9 ± 7.0
μm
20.1 ± 6.4
μm
20.6 ± 9.0
μm
5 wt.% 30.0 ±
12.7 μm
34.2 ±
12.9 μm
35.8 ± 8.0
μm
9 wt.% **** 33.6 ±
17.3 μm
39.0 ±
18.0 μm
54.3 ±
15.8 μm
****for the 9 wt.% PCL solutions, the working distance were 15 cm, 20 cm and 25 cm. The
relationship between sphere sizes and working distance/solution concentration was also plotted using
x-y-z spatial coordinates. These plots were included as supplementary material.
In general, larger PCL particles were generated with longer working distances, which was consistent
with the trend observed for the electrospraying of poly lactide-co-glycolide (PLGA) (Yao et al. 2008).
However, it was also reported that the size of electrosprayed chitosan particles first increased and then
decreased with an increasing working distance (Arya et al. 2009). A large working distance tended to
produce particles with a spherical shape and a narrow size distribution, especially for a high
concentration solution. This could be due to the fact that by increasing the working distance the
polymer chains to have sufficient time to diffuse within the droplet and thus reduce polydispersity
(Bock et al. 2012). It was also found that the effect of working distance on particle sizes became less
significant for PCL-2 solutions but more significant for PCL-3 solutions with increasing concentration.
This could be caused by the higher level molecular entanglement in PCL-2 than PCL-1, which restricts
polymer chain diffusion.
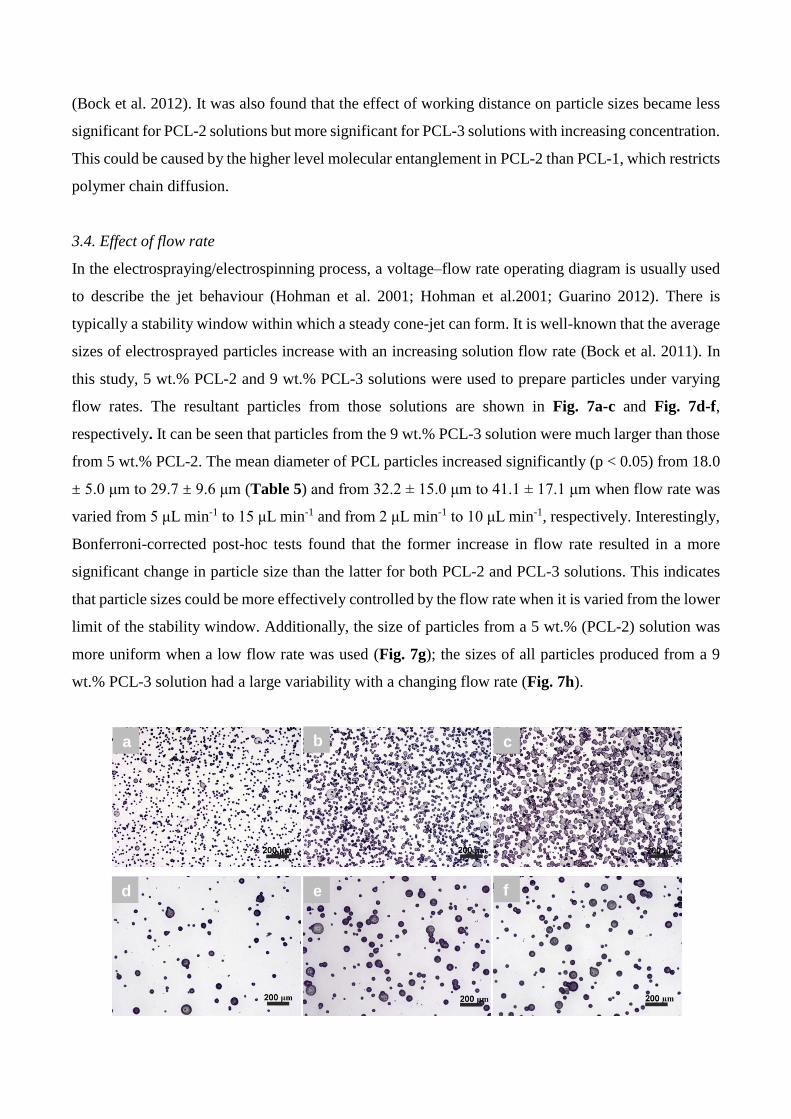
3.4. Effect of flow rate
In the electrospraying/electrospinning process, a voltage–flow rate operating diagram is usually used
to describe the jet behaviour (Hohman et al. 2001; Hohman et al.2001; Guarino 2012). There is
typically a stability window within which a steady cone-jet can form. It is well-known that the average
sizes of electrosprayed particles increase with an increasing solution flow rate (Bock et al. 2011). In
this study, 5 wt.% PCL-2 and 9 wt.% PCL-3 solutions were used to prepare particles under varying
flow rates. The resultant particles from those solutions are shown in Fig. 7a-c and Fig. 7d-f,
respectively. It can be seen that particles from the 9 wt.% PCL-3 solution were much larger than those
from 5 wt.% PCL-2. The mean diameter of PCL particles increased significantly (p < 0.05) from 18.0
± 5.0 μm to 29.7 ± 9.6 μm (Table 5) and from 32.2 ± 15.0 μm to 41.1 ± 17.1 μm when flow rate was
varied from 5 μL min-1 to 15 μL min-1 and from 2 μL min-1 to 10 μL min-1, respectively. Interestingly,
Bonferroni-corrected post-hoc tests found that the former increase in flow rate resulted in a more
significant change in particle size than the latter for both PCL-2 and PCL-3 solutions. This indicates
that particle sizes could be more effectively controlled by the flow rate when it is varied from the lower
limit of the stability window. Additionally, the size of particles from a 5 wt.% (PCL-2) solution was
more uniform when a low flow rate was used (Fig. 7g); the sizes of all particles produced from a 9
wt.% PCL-3 solution had a large variability with a changing flow rate (Fig. 7h).
a b c
d e f
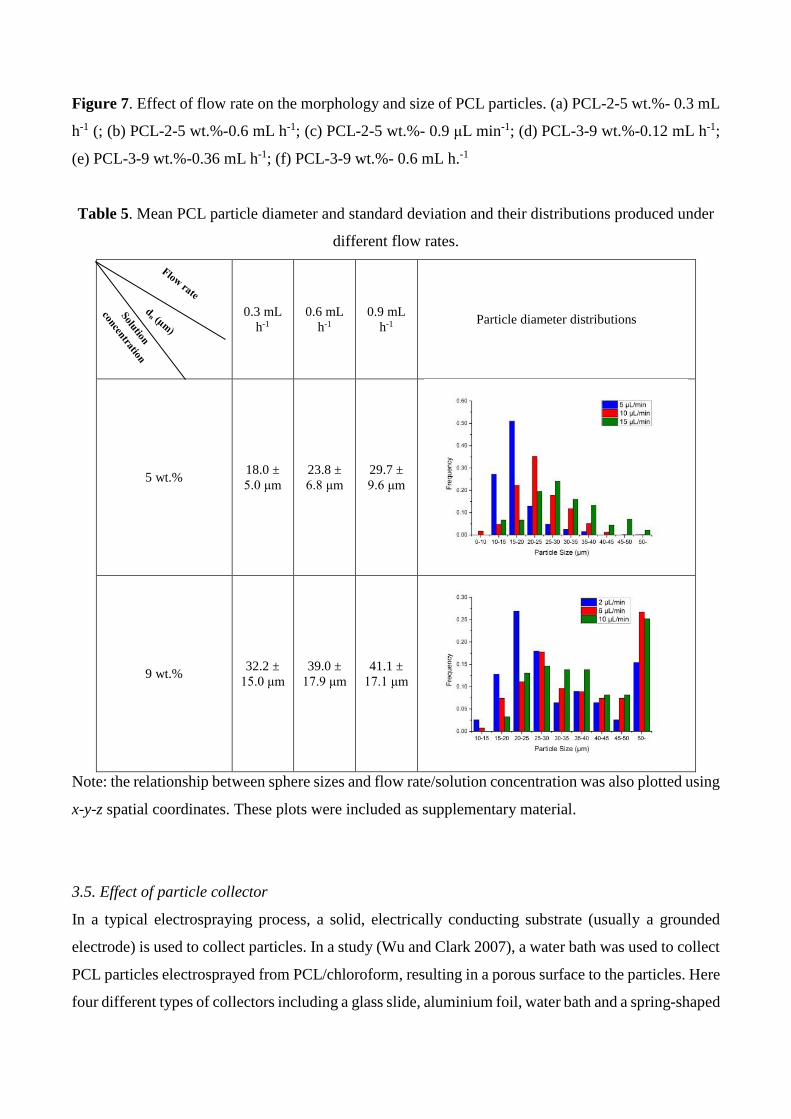
Figure 7. Effect of flow rate on the morphology and size of PCL particles. (a) PCL-2-5 wt.%- 0.3 mL
h-1 (; (b) PCL-2-5 wt.%-0.6 mL h-1; (c) PCL-2-5 wt.%- 0.9 μL min-1; (d) PCL-3-9 wt.%-0.12 mL h-1;
(e) PCL-3-9 wt.%-0.36 mL h-1; (f) PCL-3-9 wt.%- 0.6 mL h.-1
Table 5. Mean PCL particle diameter and standard deviation and their distributions produced under
different flow rates.
0.3 mL
h-1
0.6 mL
h-1
0.9 mL
h-1 Particle diameter distributions
5 wt.% 18.0 ±
5.0 μm
23.8 ±
6.8 μm
29.7 ±
9.6 μm
9 wt.% 32.2 ±
15.0 μm
39.0 ±
17.9 μm
41.1 ±
17.1 μm
Note: the relationship between sphere sizes and flow rate/solution concentration was also plotted using
x-y-z spatial coordinates. These plots were included as supplementary material.
3.5. Effect of particle collector
In a typical electrospraying process, a solid, electrically conducting substrate (usually a grounded
electrode) is used to collect particles. In a study (Wu and Clark 2007), a water bath was used to collect
PCL particles electrosprayed from PCL/chloroform, resulting in a porous surface to the particles. Here
four different types of collectors including a glass slide, aluminium foil, water bath and a spring-shaped
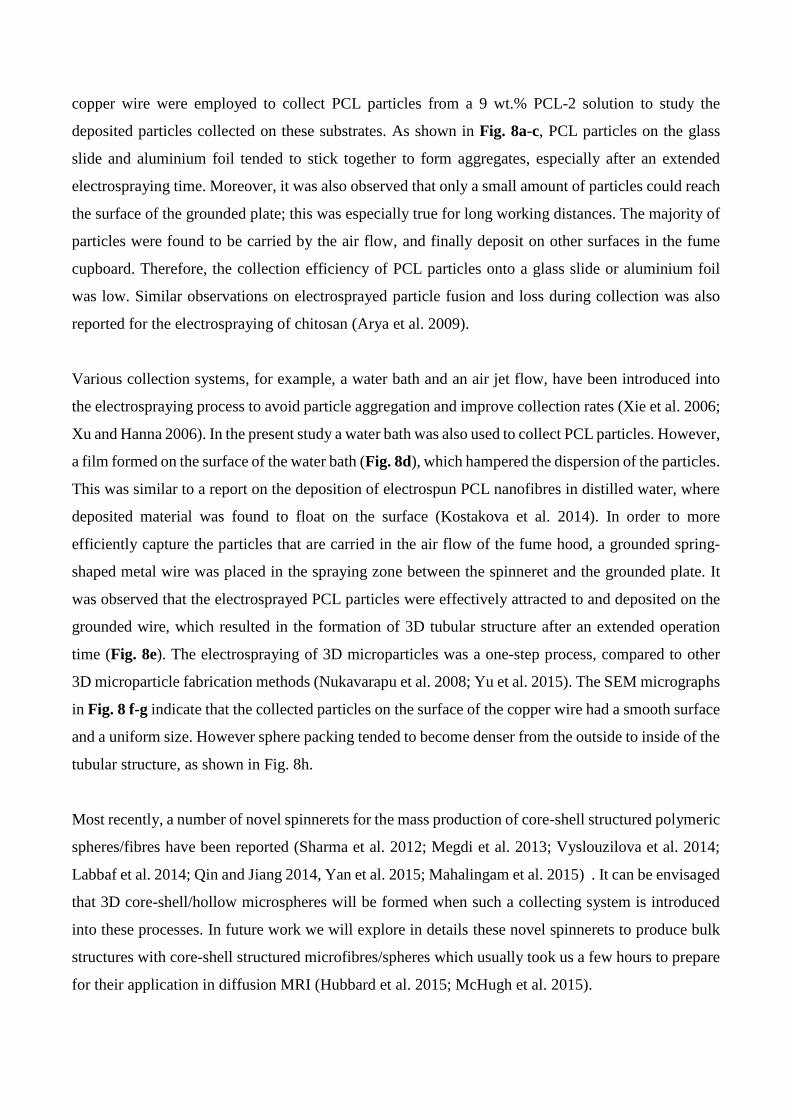
copper wire were employed to collect PCL particles from a 9 wt.% PCL-2 solution to study the
deposited particles collected on these substrates. As shown in Fig. 8a-c, PCL particles on the glass
slide and aluminium foil tended to stick together to form aggregates, especially after an extended
electrospraying time. Moreover, it was also observed that only a small amount of particles could reach
the surface of the grounded plate; this was especially true for long working distances. The majority of
particles were found to be carried by the air flow, and finally deposit on other surfaces in the fume
cupboard. Therefore, the collection efficiency of PCL particles onto a glass slide or aluminium foil
was low. Similar observations on electrosprayed particle fusion and loss during collection was also
reported for the electrospraying of chitosan (Arya et al. 2009).
Various collection systems, for example, a water bath and an air jet flow, have been introduced into
the electrospraying process to avoid particle aggregation and improve collection rates (Xie et al. 2006;
Xu and Hanna 2006). In the present study a water bath was also used to collect PCL particles. However,
a film formed on the surface of the water bath (Fig. 8d), which hampered the dispersion of the particles.
This was similar to a report on the deposition of electrospun PCL nanofibres in distilled water, where
deposited material was found to float on the surface (Kostakova et al. 2014). In order to more
efficiently capture the particles that are carried in the air flow of the fume hood, a grounded spring-
shaped metal wire was placed in the spraying zone between the spinneret and the grounded plate. It
was observed that the electrosprayed PCL particles were effectively attracted to and deposited on the
grounded wire, which resulted in the formation of 3D tubular structure after an extended operation
time (Fig. 8e). The electrospraying of 3D microparticles was a one-step process, compared to other
3D microparticle fabrication methods (Nukavarapu et al. 2008; Yu et al. 2015). The SEM micrographs
in Fig. 8 f-g indicate that the collected particles on the surface of the copper wire had a smooth surface
and a uniform size. However sphere packing tended to become denser from the outside to inside of the
tubular structure, as shown in Fig. 8h.
Most recently, a number of novel spinnerets for the mass production of core-shell structured polymeric
spheres/fibres have been reported (Sharma et al. 2012; Megdi et al. 2013; Vyslouzilova et al. 2014;
Labbaf et al. 2014; Qin and Jiang 2014, Yan et al. 2015; Mahalingam et al. 2015) . It can be envisaged
that 3D core-shell/hollow microspheres will be formed when such a collecting system is introduced
into these processes. In future work we will explore in details these novel spinnerets to produce bulk
structures with core-shell structured microfibres/spheres which usually took us a few hours to prepare
for their application in diffusion MRI (Hubbard et al. 2015; McHugh et al. 2015).
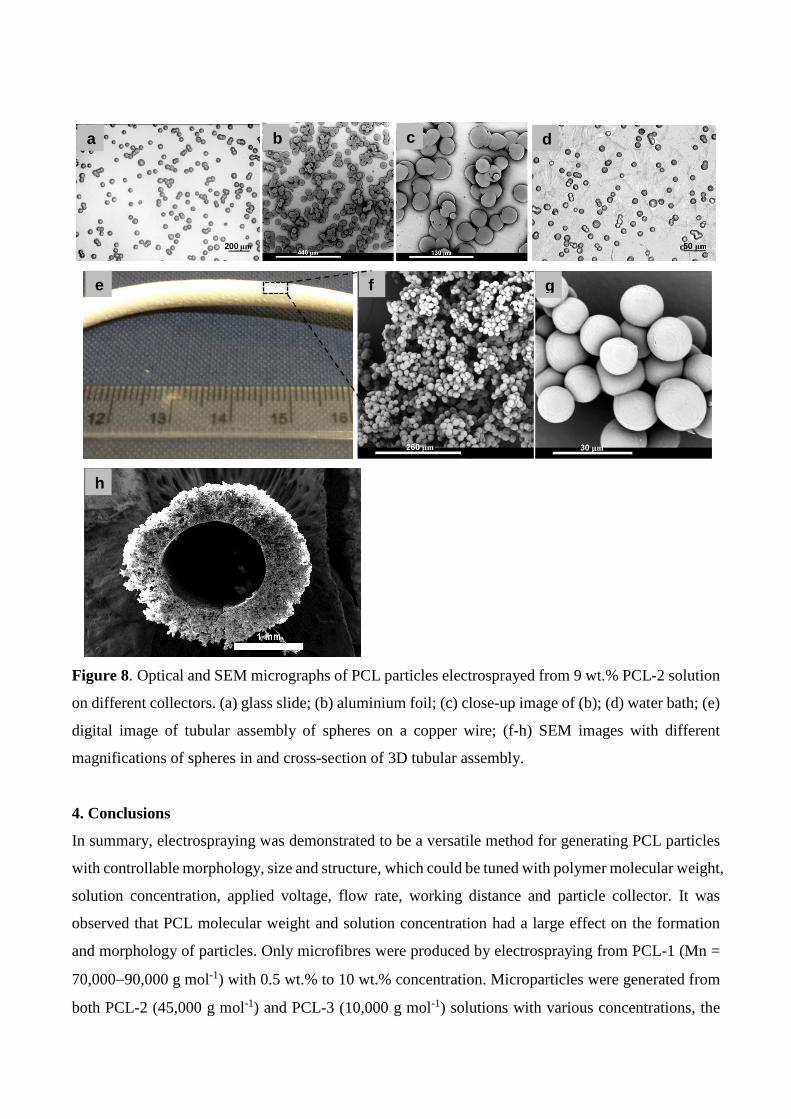
Figure 8. Optical and SEM micrographs of PCL particles electrosprayed from 9 wt.% PCL-2 solution
on different collectors. (a) glass slide; (b) aluminium foil; (c) close-up image of (b); (d) water bath; (e)
digital image of tubular assembly of spheres on a copper wire; (f-h) SEM images with different
magnifications of spheres in and cross-section of 3D tubular assembly.
4. Conclusions
In summary, electrospraying was demonstrated to be a versatile method for generating PCL particles
with controllable morphology, size and structure, which could be tuned with polymer molecular weight,
solution concentration, applied voltage, flow rate, working distance and particle collector. It was
observed that PCL molecular weight and solution concentration had a large effect on the formation
and morphology of particles. Only microfibres were produced by electrospraying from PCL-1 (Mn =
70,00090,000 g mol-1) with 0.5 wt.% to 10 wt.% concentration. Microparticles were generated from
both PCL-2 (45,000 g mol-1) and PCL-3 (10,000 g mol-1) solutions with various concentrations, the
a b c d
e f g
h
latter having a wider range of possible concentrations. In order to avoid fiber formation, an increased
polymer concentration must be coupled with a decreased molecular weight, ensuring electrospraying
occur in the semidilute entangled regime, which leads to the formation of spherical and homogeneous
particles. The morphology and size of the resultant particles were influenced to different extents by
the applied voltage, working distance and flow rate, among of which the effect of applied voltage was
most significant. There was however a narrow range of applied voltage allowing a more stable
electrospraying process. PCL particles couldn’t be collected in a water bath as efficiently as a grounded
copper wire collecting substrate due to the particle aggregation on water surface. Furthermore, a 3D
tubular assembly of smooth and spherical PCL microparticles could be formed on the copper wire and
be used as a tumour cell mimic.
Acknowledgement
The financial support received from the Cancer Research UK (CRUK) and Engineering and Physical
Sciences Research Council (ESPRC) Cancer Imaging Centre in Cambridge and Manchester
(C8742/A18097) is acknowledged.
References
1. Arya, N., Chakraborty S., Dube, N., and Katti, D.S. (2009). Electrospraying: A facile technique for synthesis of
chitosan-based micro/nanospheres for drug delivery applications. J. Biomed. Mater. Res-B, 88B(1): 17-31.
2. Bock, N., Dargaville, T. R., and Woodruff, M. A. (2012). Electrospraying of polymers with therapeutic
molecules: State of the art. Prog. Polym. Sci., 37: 1510-1551.
3. Bock, N., Woodruff, M. A., Hutmacher, D. W., and Dargaville, T. R. (2011). Electrospraying, a Reproducible
Method for Production of Polymeric Microspheres for Biomedical Applications. Polymers, 3: 131-149.
4. Burger, C., Hsiao, B. S., and Chu B. (2006). Nanofibrous mateirals and their applications. Annu. Rev. Mater.
Sci., 36: 36(1): 333-368.
5. Celebioglu, A., and Uyar, T. (2011). Electrospinning of Polymer-free Nanofibers from Cyclodextrin Inclusion
Complexes. Langmuir, 27: 6218-6226.
6. Cipitria, A., Skelton, A., Dargaville, T. R., and Hutmacher, D. W. (2011). Design, fabrication and
characterization of PCL electrospun scaffolds-a review. J. Mater. Chem., 21: 9419-9453.
7. Kostakova,E., Seps, M., Pokorny, P., and Lukas, D. (2014). Study of polycaprolactone wet electrospinning
process. Express Polym. Lett., 8: 554-564.
8. Enayati, M., Ahmad, Z., Stride, E., and Edirisinghe, M. (2010). Size mapping of electric field-assisted
production of polycaprolactone particles. J. R. Soc. Interface,7: S393-S402.
9. Gupta, P., Elkins, C., Long, T. E., and Wilkes, G. L. (2005). Electrospinning of linear homopolymers of
poly(methyl methacrylate): exploring relationships between fiber formation, viscosity, molecular weight and
concentration in a good solvent. Polymer, 46: 4799-4810.
10. Hohman, M. M., Shin, M., Rutledge, G., and Brenner, M. P. (2001). Electrospinning and electrically forced jets.
I. Stability theory. Phys. Fluids, 13: 2201-2220.
11. Hohman, M. M., Shin M., Rutledge, G., and Brenner, M. P. (2001). Electrospinning and electrically forced jets.
II. Applications. Phys. Fluids, 13: 2221-2236.
12. Hubbard, P. L., Zhou, F.-L., Eichhorn, S. J., and Parker, G. J. M. (2015). Biomimetic phantom for the validation
of diffusion magnetic resonance imaging. Magn. Reson. Med., 73: 299-305.
13. Jaworek, A. (2007). Micro- and nanoparticle production by electrospraying. Powder. Technol., 176: 18-35.
14. Vysloužilová, L., Valtera, J., Pejchar, K., Beran, J., and Lukas, D. (2014). Design of Coaxial Needleless
Electrospinning Electrode with Respect to the Distribution of Electric Field. Appl. Mech. Mater., 693: 394-399.
15. Labbaf, S., Ghanbar, H., Stride, E., and Edrisinghe, M. (2014). Preparation of Multilayered Polymeric
Structures Using a Novel Four-Needle Coaxial Electrohydrodynamic Device. Macromol. Rapid Comm., 35:
618-623.
16. Li, D., and Xia, Y. (2004). Electrospinning of Nanofibers: Reinventing the Wheel? Adv. Mater., 16: 1151-1170.
17. Mahalingam, S., Raimi-Abraham, B. T., Craig, D. Q. M., and Edirisinghe, M. (2015). Formation of Protein and
Protein–Gold Nanoparticle Stabilized Microbubbles by Pressurized Gyration. Langmuir, 31: 659-666.
18. McHugh, D. J., Zhou, F.-L., Hubbard Cristinance, P. L., Naish, J. H., and Parker, G. J. M. (2015). Ground
Truth for Diffusion MRI in Cancer: A Model-Based Investigation of a Novel Tissue-Mimetic Material. in IPMI
2015 UK Proceedings. S. Ourselin, C. D. Alexander, C.-F. Westin and J. M. Cardoso. Springer International
Publishing, 179-190.
19. Megdi, E., Eleanor, S., and Edirisinghe, M. (2013). Electrosprayed core–shell polymer–lipid nanoparticles for
active component delivery. Nanotechnology, 24: 465604.
20. Meng, F.Z., Jiang, Y., Sun, Z. H., Yin, Y. Z., and Li, Y. Y. (2009). Electrohydrodynamic liquid atomization of
biodegradable polymer microparticles: Effect of electrohydrodynamic liquid atomization variables on
microparticles. J. Appl. Polym. Sci., 113: 526-534.
21. Nukavarapu, S. P., Kumbar, S. G., Brown, J. L., Krogman, N. R.,Weikel, A. L., Hindenlang, M. D. Nair, L. S.,
Allcock, H. R., and Laurencin, C. T. (2008). Polyphosphazene/Nano-Hydroxyapatite Composite Microsphere
Scaffolds for Bone Tissue Engineering. Biomacromolecules, 9: 1818-1825.
22. Park, C. H. and Lee, J. (2009). Electrosprayed polymer particles: Effect of the solvent properties. J. Appl.
Polym. Sci.,114: 430-437.
23. Teo, W. E. and Ramakrishna, S. (2006). A review on electrospinning design and nanofibre assemblies.
Nanotechnology, 17: R89.
24. Sharma, U., Pham, Q., Marini, J., Yan, X., and Core, L. (2012). Electrospinning Process for Manufacture of
Multi-Layered Structures. US patent, Application number US 13/362,467.
25. Van der Schueren, L., De Schoenmaker, B. Kalaoglu, O. I., and De Clerck, K. (2011). An alternative solvent
system for the steady state electrospinning of polycaprolactone. Euro. Polym. J., 47: 1256-1263.
26. Guarino, V., Khodir, W. K., and Ambrosio, L. (2012). Biodegradable microparticles and nanoparticles by
electrospraying techniques. J. Appl. Biomater. Funct. Mater., 10: 191-196.
27. Woodruff, M. A. and Hutmacher, D. W. (2010). The return of a forgotten polymer - Polycaprolactone in the
21st century. Prog. Polym. Sci., 35: 1217-1256.
28. Wu, Y. and Clark, R. L. (2007). Controllable porous polymer particles generated by electrospraying. J. Colloid
Interf. Sci., 310: 529-535.
29. Qin, X. H. and Jiang, G. J. (2014). High-efficiency needleless coaxial electrostatic spinning device and method.
Chinese patent, application number CN 201310586614.
30. Xie, J., Marijnissen J. C. M., and Wang, C.-H. (2006). Microparticles developed by electrohydrodynamic
atomization for the local delivery of anticancer drug to treat C6 glioma in vitro. Biomaterials, 27: 3321-3332.
31. Xu, Y. and Hanna, M. A. (2006). Electrospray encapsulation of water-soluble protein with polylactide: Effects
of formulations on morphology, encapsulation efficiency and release profile of particles. Int. J. Pharm., 320: 30-
36.
32. Yan, X., Marini, J., Mulligan, R., Deleault, A., Sharma, U., Brenner, M. P., Rutledge, G. C., Freyman, T., and
Pham. Q. P. (2015). Slit-Surface Electrospinning: A Novel Process Developed for High-Throughput Fabrication
of Core-Sheath Fibers. PLoS ONE 10: e0125407.
33. Yao, J., Kuang Lim, K., Xie, J. W., Hua, J., and Wang, C.-H. (2008). Characterization of electrospraying
process for polymeric particle fabrication. J. Aerosol. Sci., 39: 987-1002.
34. Yu, L., Ni, C., Grist S., Bayly, C., and Cheung, K. (2015). Alginate core-shell beads for simplified three-
dimensional tumor spheroid culture and drug screening. Biomed. Microdevices, 17: 1-9.
35. Zhou, F.-L., Hubbard, P. L., Eichhorn, S. J., and Parker, G. J. M. (2011). Jet deposition in near-field
electrospinning of patterned polycaprolactone and sugar-polycaprolactone core–shell fibres. Polymer, 52: 3603-
3610.