Embed Size (px)
Citation preview
Arnold Schwarzenegger Governor
PRELIMINARY GEOLOGIC ASSESSMENT
OF THE CARBON SEQUESTRATION POTENTIALOF THE UPPER CRETACEOUS
MOKELUMNE RIVER, STARKEY, AND WINTERS FORMATIONS – SOUTHERN
SACRAMENTO BASIN, CALIFORNIA
PIER
CO
LLA
BO
RA
TIVE
REP
OR
T
Prepared For: California Energy Commission Public Interest Energy Research Program and the U.S. Department of Energy National Energy Technology Laboratory
Prepared By: California Geological Survey
February 2010
CEC-500-2009-068 CGS Special Report 204

Prepared By: California Geological Survey Cameron Downey (PG #5981) and John Clinkenbeard (PG #4731) 801 K Street, MS 08-38 Sacramento, California 95814 Commission Contract No. 500-05-028
Prepared For:Public Interest Energy Research (PIER) California Energy Commission
Larry Myer Contract Manager Linda Spiegel Program Area Lead Energy-Related Environmental Research
Mike Gravely Office Manager Energy Systems Research
Thom Kelly, Ph.D. Deputy Director ENERGY RESEARCH & DEVELOPMENT DIVISION
Melissa Jones Executive Director
DISCLAIMER
This report was prepared as the result of work sponsored by the California Energy Commission. It does not necessarily represent the views of the Energy Commission, its employees or the State of California. The Energy Commission, the State of California, its employees, contractors and subcontractors make no warrant, express or implied, and assume no le gal liability for the information in this report; nor does an y part y represent that t he uses of this information will not infringe upon privately owned rights. This report has not been approved or disapproved b y the California Energy Commission nor has the California Energy Commission passed upon the accuracy or adequacy of the information in this report.

i
Acknowledgements The authors and the Public Interest Energy Research Program would like to thank the following individuals for their invaluable help in preparing this document: For review of the Report content and editorial assistance: Mary Jane Coombs – UC Office of the President, California Institute for Energy and Environment Ron Churchill – California Geological Survey Mike Stettner – California Division of Oil, Gas, and Geothermal Resources William Short – California Geological Survey For GIS support and cartographic design: Milton Fonseca – California Geological Survey This work was conducted under DOE Contract No. DE‐FC26‐05NT42593. United States Government Disclaimer: This report was prepared as an account of work sponsored by an agency of the United States Government. Neither the United States Government nor any agency thereof, nor any of their employees, makes any warranty, express or implied, or assumes any legal liability or responsibility for the accuracy, completeness, or usefulness of any information, apparatus, product, or process disclosed, or represents that its use would not infringe privately owned rights. Reference herein to any specific commercial product, process, or service by trade name, trademark, manufacturer, or otherwise does not necessarily constitute or imply its endorsement, recommendation, or favoring by the United States Government or any agency thereof. The views and opinions of authors expressed herein do not necessarily state or reflect those of the United States Government or any agency thereof. California Department of Conservation Disclaimer: This report was prepared by the California Department of Conservation, California Geological Survey. The Department of Conservation makes no warranties as to the suitability of this product for any particular purpose. Please cite this report as follows: Downey, Cameron, and John Clinkenbeard. 2008. Preliminary Geologic Assessment of the Carbon Sequestration Potential of the Upper Cretaceous Mokelumne River, Starkey, and Winters Formations – Southern Sacramento Basin, California. California Energy Commission, PIER Energy‐Related Environmental Research. CEC‐500‐2009‐068.

ii
iii
Preface
The California Energy Commission’s Public Interest Energy Research (PIER) Program supports public interest energy research and development that will help improve the quality of life in California by bringing environmentally safe, affordable, and reliable energy services and products to the marketplace.
The PIER Program conducts public interest research, development, and demonstration (RD&D) projects to benefit California.
The PIER Program strives to conduct the most promising public interest energy research by partnering with RD&D entities, including individuals, businesses, utilities, and public or private research institutions.
PIER funding efforts are focused on the following RD&D program areas:
• Buildings End‐Use Energy Efficiency
• Energy Innovations Small Grants
• Energy‐Related Environmental Research
• Energy Systems Integration
• Environmentally Preferred Advanced Generation
• Industrial/Agricultural/Water End‐Use Energy Efficiency
• Renewable Energy Technologies
• Transportation
Preliminary Geologic Assessment of the Carbon Sequestration Potential of the Upper Cretaceous Mokelumne River, Starkey, and Winters Formations – Southern Sacramento Basin, California. California Energy Commission, PIER Energy‐Related Environmental Research is the final report for the Preliminary Geologic Assessment of the Carbon Sequestration Potential of the Upper Cretaceous Mokelumne River, Starkey, and Winters Formations – Southern Sacramento Basin, California project, Contract Number 500‐05‐028, conducted by California Geological Survey. The information from this project contributes to PIER’s Energy‐Related Environmental Research and Development program area.
For more information about the PIER Program, please visit the Energy Commission’s website at www.energy.ca.gov/research/ or contact the Energy Commission at 916‐654‐4878.

iv
v
Table of Contents
Preface. ........................................................................................................................................................iii Table of Contents ....................................................................................................................................... v Abstract ...................................................................................................................................................... ix Executive Summary ................................................................................................................................... 1 1.0 Introduction .................................................................................................................................... 5 1.1 Background ................................................................................................................................. 5 1.2 Overview ..................................................................................................................................... 7
2.0 Experimental ................................................................................................................................... 9 2.1 Scope of Investigation and Project Constraints .................................................................... 9 2.2 Project Approach and Work Methods ................................................................................. 13 2.2.1 Gross Sandstone Isopach Maps .................................................................................... 19 2.2.2 Depth‐to‐Sandstone Maps ............................................................................................ 20 2.2.3 Shale Isopach Maps........................................................................................................ 20 2.2.4 Map Analysis .................................................................................................................. 21
3.0 Results and Discussion ................................................................................................................ 24 3.1 Mokelumne River Formation ................................................................................................ 24 3.1.1 Distribution of Mokelumne River Formation Sandstone ......................................... 24 3.1.2 Depth to Mokelumne River Formation Sandstone .................................................... 27 3.1.3 Mokelumne River Formation Seals .............................................................................. 31
3.2 Starkey Formation ................................................................................................................... 33 3.2.1 Distribution of Starkey Formation Sandstone ............................................................ 33 3.2.2 Depth to Starkey Formation Sandstone ...................................................................... 33 3.2.3 Starkey Formation Seals ................................................................................................. 37
3.3 Winters Formation .................................................................................................................. 37 3.3.1 Distribution of Winters Formation Sandstone ........................................................... 37 3.3.2 Depth to Winters Formation Sandstone ..................................................................... 40 3.3.3 Winters Formation Seals ............................................................................................... 40
3.4 CO2 Storage Resource Estimates ............................................................................................ 43 4.0 Conclusions ................................................................................................................................... 46 5.0 References ..................................................................................................................................... 48 6.0 Glossary ......................................................................................................................................... 50 Appendix ................................................................................................................................................... 52
vi
List of Figures
Figure 1: Location map of southern Sacramento Basin, California ................................................... 10 Figure 2: Stratigraphic Section – Sacramento Basin ............................................................................ 11 Figure 3: Oil and gas fields of the southern Sacramento Basin ......................................................... 12 Figure 4: East‐west cross section ‐ Rio Vista Gas Field (after Pepper & Johnson, 1992) ................ 14 Figure 5: Cross sections Index (Plates 1‐3)............................................................................................ 15 Figure 5: Plate 1…………………………………………………………………………….…..14 Figure 5: Plate 2…………………………………………………………………………….…..15 Figure 5: Plate 3…………………………………………………………………………….…..16 Figure 6: Gross sandstone isopach map of the Mokelumne River Formation ................................ 26 Figure 7: Gross sandstone map of Mokelumne River Formation (net of Paleogene canyons) ..... 29 Figure 8: Depth to Mokelumne River Formation sandstone ............................................................. 30 Figure 9: Overlying seal isopach map ‐ Mokelumne River Formation ............................................ 32 Figure 10: Gross sandstone isopach map of the Starkey Formation (net of Paleogene canyons) . 35 Figure 11: Depth to Starkey Formation sandstone .............................................................................. 36 Figure 12: Overlying seal isopach map ‐ Starkey Formation ............................................................. 38 Figure 13: Gross sandstone map of Winters Formation ..................................................................... 39 Figure 14: Depth to Winters Formation sandstone ............................................................................. 41 Figure 15: Overlying seal isopach map ‐ Winters Formation ............................................................ 42 Figure 16: Total sandstone deeper than 1,000 meters and overlain by more than 100 feet of shale .................................................................................................................................................................... 47

vii
List of Tables Table 1: Distribution of Mokelumne River Formation Sandstone .................................................... 31 Table 2: Distribution of Starkey Formation Sandstone ...................................................................... 37 Table 3: Distribution of Winters Sandstone ......................................................................................... 43 Table 4: CO2 Storage Resource Estimates*............................................................................................ 44

viii
ix
Abstract As part of the West Coast Regional Carbon Sequestration Partnership (WESTCARB) Phase II program, the California Department of Conservation, California Geological Survey (CGS), conducted a preliminary regional geologic assessment of the carbon sequestration potential of the Upper Cretaceous Mokelumne River, Starkey, and Winters formations in the southern Sacramento Basin. Determining the potential for storing captured carbon dioxide (CO2) in geologic formations will benefit California by expanding its portfolio of sequestration options to help meet greenhouse gas emission reduction targets. Using gas well logs, a series of three maps for each formation were prepared: gross sandstone thickness maps define the regional extent and thickness of porous and permeable sandstone available within each formation; depth‐to‐sandstone maps identify areas of shallow sandstone that might not be suitable for CO2 injection at required pressures and temperatures; thickness maps of overlying shale units identify areas of thin seals that may be unsuitable for CO2 containment. Areas where sandstone has been eroded by younger Paleocene submarine canyons, areas of shallow sandstone, and areas exhibiting a thin overlying seal were eliminated to arrive at an estimate for each formation meeting minimum depth and seal parameters. The maps reveal that approximately 1,045 square miles underlain by Mokelumne River sandstones, 920 square miles by Starkey Formation sandstones, and 1,454 square miles by Winters sandstones meet minimum depth and seal thickness requirements. Vertically stacked, these formations underlie about 2,019 net surface square miles providing the potential for much thicker total sandstone sequences for CO2 storage. The estimated storage resource for the portions of the three formations meeting depth and seal criteria is 3.5 to 14.1 gigatons of CO2. The 1,500 feet thick Winters Formation sandstones appear to offer the best potential for carbon sequestration due to its depth (approximately 95 percent is below minimum depth criteria), overlying stratigraphy, and structures. Keywords: WESTCARB, West Coast Regional Carbon Sequestration Partnership, U.S. Department of Energy (DOE) Regional Carbon Sequestration Partnerships, carbon dioxide, CO2, carbon sequestration, geologic sequestration, geologic storage

x
1
Executive Summary Introduction
The West Coast Regional Carbon Sequestration Partnership (WESTCARB) is exploring opportunities in seven western states and one Canadian province for removing carbon dioxide (CO2) from the atmosphere by enhancing natural processes and by capturing it at industrial facilities before it is emitted and storing it securely underground. Such measures will help slow the atmospheric buildup of this greenhouse gas (GHG) and its associated climatic effects.
Purpose
The Phase II study evaluates the regional geology of the Mokelumne River, Starkey, and Winters formations in the southern Sacramento Basin to better define those areas with carbon sequestration potential. Previous Phase I studies identified these formations as potential sequestration targets. These formations contain the most aerially extensive sandstone units within the Sacramento Basin that meet minimum depth requirements for CO2 injection at required temperature and pressures. Sandstones within these formations also account for a large part of the natural gas production in the southern Sacramento Basin and comprise the bulk of the saline aquifers within this part of the basin.
Project Objectives
The Phase II study evaluated available geologic information for the Mokelumne River, Starkey, and Winters formations in the southern Sacramento Basin to address four main issues related to their carbon sequestration potential. These main issues are: sandstone distribution and thickness, depth to the objective sandstones, the presence or absence of suitable overlying shale seals, and petrophysical considerations (porosity, permeability, and so forth). Project Outcomes
Phase II reviewed and correlated approximately 6,200 gas well logs in the region. Researchers prepared cross sections to establish regional correlations and a series of three maps were prepared for each formation. First, gross sandstone thickness maps were prepared to define the maximum regional extent and to illustrate the thickness of porous and permeable sandstone available within each respective formation. Depth‐to‐sandstone maps were then generated and used to identify areas of shallow sandstone that might not be suitable for CO2 injection. Finally, thickness maps of overlying shale units were prepared for each formation. The overlying shales are the potential barriers to vertical migration of CO2, and comparison of the sandstone thickness map and the shale isopach map aids in identifying areas with both the necessary reservoir capacity and seals for carbon sequestration. Information was compiled in digital geographic information system and other digital formats to ease access and use by other partnership participants.
2
The relationships between the thickness and depth maps for each formation were analyzed to better identify those areas with carbon sequestration potential. Geographic information system map overlays were used to facilitate analysis which consisted of a simple process of elimination. Gross sandstone maps were evaluated to determine the maximum areal extent (square miles) of sandstone within each formation. The total area for each formation was then reduced by areas, if any, where sandstone has been eroded by younger Paleocene submarine canyons. The resulting maps were then overlain by their respective depth‐to‐sandstone maps, allowing the removal of areas of shallow sandstone. A depth of 1,000 meters (3,280 feet) was selected as a minimum depth for CO2 injection. Finally, the overlying shale thickness maps were overlain to identify and remove areas with thin seals, and arrive at an estimate for each formation meeting all three parameters. For this investigation, a minimum seal thickness of 100 feet was used.
Conclusion
The Mokelumne River, Starkey, and Winters formations all contain significant thicknesses of porous and permeable sandstone that may be suitable for carbon sequestration. Large areas meeting minimum depth requirements of 1,000 meters (3,280 feet) and seal thickness of more than 100 feet exist for each formation. Approximately 1,045 square miles are underlain by Mokelumne River sandstone, 920 square miles by Starkey Formation sandstone, and 1,454 square miles by Winters sandstone. Since the formations are vertically stacked, 2,019 net surface square miles meet depth and seal criteria. Stacking provides the potential for much thicker total sandstone sequences than individual formations. The estimated storage resource for the portions of the three formations meeting depth and seal criteria is 3.5 to 14.1 gigatons of CO2.
The Winters Formation sandstones appear to offer the best potential for carbon sequestration. While gross sandstone achieves considerably greater thicknesses in the Mokelumne River Formation, Winters Formation sandstones can exceed 1,500 in thickness. Additionally, about 95 percent of the Winters sandstones are below 1,000 meters (3,280 feet). Depth provides additional benefits including a greater number of overlying shale units increasing the likelihood of containment. Winters sandstones are also appealing from a stratigraphic standpoint. Unlike the Mokelumne River and Starkey formations which are overlain up slope to the east by porous sandstone, Winters sandstone thins out up slope within a thick section of marine shale along most of its eastern margin. This configuration creates the potential for large‐scale containment.
Recommendations
Many geologic formations within California’s marine basins are potential candidates for sequestration in existing or abandoned oil and gas fields and saline aquifers. Regional geologic evaluations of the sequestration potential of these formations including sandstone and seal thickness mapping and depth mapping will be needed to better characterize the sequestration potential of these other geologic units. This will assist in the further more detailed evaluations that will be necessary to conduct geologic sequestration in California.
3
Benefits to California
Under Assembly Bill 32 (Nuñez, Chapter 488, Statutes of 2006) and Executive Order S‐3‐05, California has established aggressive GHG emissions goals. By 2010, California must reduce its GHG emission to 2000 levels; and by 2020, to 1990 levels. As part of this effort, WESTCARB in partnership with DOE is exploring opportunities for removing CO2 from the atmosphere by enhancing natural processes and by capturing it at industrial facilities before it is emitted and storing it securely underground. Determining the potential for long‐term underground storage of CO2 through identification and quantification of resources will help California reduce the carbon intensity of its economy and reduce changes in the climate associated with atmospheric buildup of this GHG.

4
5
1.0 Introduction As part of the West Coast Regional Carbon Sequestration Partnership (WESTCARB) Phase II effort, the California Department of Conservation, California Geological Survey (CGS) conducted a preliminary geologic assessment of the carbon sequestration potential of three upper Cretaceous, sandstone‐rich formations in the southern Sacramento Basin. From youngest to oldest these include the Mokelumne River, Starkey, and Winters formations. These formations contain the most extensive sandstone units within the Sacramento Basin meeting minimum depth requirements for supercritical‐state carbon dioxide (CO2) injection. These formations also account for a large part of the natural gas production in the southern Sacramento Basin, and contain most of the saline aquifers within this part of the basin. The Phase II assessment involved review of the well logs of approximately 6,200 gas wells in the region. Three maps were prepared for each geologic formation; a gross sandstone isopach (thickness) map, a depth‐to‐sandstone map, and an overlying shale seal isopach map. This study provides more detailed information on three geologic formations that could be future sequestration targets in California’s southern Sacramento Basin. This information will be used by other members of WESTCARB in evaluating potential sequestration options for the region. A glossary of acronyms used in the report can be found in Section 6 at the end of the report. 1.1. Background Over the last several decades, concern has been raised over the potential impacts of anthropogenic greenhouse gasses on global climate (Hansen, 2004). Greenhouse gases (GHGs), such as CO2, trap infrared radiation that would otherwise escape into space and reflect it back to the Earth’s surface in a manner similar to how a greenhouse traps infrared radiation that would otherwise be lost to the surrounding environment. This process is believed to result in global warming. One source of carbon dioxide is the combustion of fossil fuels such as coal, oil, and natural gas. Its concentration in the atmosphere has been increasing since the Industrial Revolution. The increase in the concentration of CO2 in the atmosphere is projected to continue as the world’s population increases and more countries become industrialized. The United States currently produces about 85% of its commercial energy with fossil fuels (Herzog and Golomb, 2004). Slowing or reducing anthropogenic CO2 emissions to the atmosphere will be difficult, and it is likely that multiple tactics will be needed to achieve this goal. Possible tactics for slowing or reducing CO2 emissions include:
• Increasing the efficiency of power generation.
• Using less carbon‐rich fuels such as natural gas in place of oil or coal.
6
• Using alternative energy sources such as solar, wind, or nuclear energy.
• Carbon sequestration.
Carbon sequestration is the process of collecting CO2 emissions and isolating them from the atmosphere to prevent buildup of this greenhouse gas and its associated climatic effects. This emerging technology may play an important role in slowing anthropogenic CO2 emissions to the atmosphere in the near future. There are two broad categories of sequestration: terrestrial and geologic. Terrestrial sequestration is achieved when plants absorb CO2 from the atmosphere during photosynthesis and incorporate the carbon into their structure or transfer it to the soil. One way of reducing atmospheric CO2 is to change the way that forests, rangeland, agricultural lands, and wetlands are managed, to either increase the amount of CO2 removed from the atmosphere and stored as biomass or to decrease the CO2 emissions from these areas. Terrestrial sequestration can isolate CO2 from the atmosphere for decades. Geologic sequestration involves capturing CO2 from point sources such as power plants and industrial facilities and storing it in geologic formations. This can be achieved in several ways including injection into depleted or abandoned oil or gas reservoirs or deep saline formations (underground strata of porous rocks filled with saltwater); injection into deep, unmineable coal beds; or conversion to carbonate minerals by reaction with mafic or ultramafic rocks. Geologic sequestration has the potential to isolate CO2 from the atmosphere over very long timeframes ranging from hundreds to thousands of years or longer. WESTCARB is one of seven partnerships that were established by the U.S. Department of Energy (DOE) to evaluate carbon capture and sequestration (CCS) technologies best suited for different regions of the country. The West Coast Region includes the states of Alaska, Arizona, California, Nevada, Oregon, Washington, and the Canadian province British Columbia. Led by the California Energy Commission (CEC), WESTCARB is a consortium of more than 80 organizations, including state natural resource and environmental protection agencies; national laboratories and universities; private companies working on CO2 capture, transportation, and storage technologies; utilities; oil and gas companies; nonprofit organizations; and policy/governance coordinating organizations (Myer and Birkenshaw, 2005). The primary goal of WESTCARB’s Phase II (2005‐2009) effort is to validate the feasibility, safety, and efficacy of carbon sequestration techniques through small‐scale field tests. The geologic formations identified for testing are deep saline formations and depleted natural gas reservoirs. Terrestrial sequestration projects will examine reforestation of marginal grazing lands that were once forested, removal of forest brush that could potentially fuel severe wildfires, and forest conservation management to increase tree size. A secondary goal of WESTCARB Phase II and Phase III (planned for 2008‐2017) is to expand and refine the geologic and terrestrial characterization studies conducted in the first phase (2003‐2005) of the WESTCARB project. Field project results will help scientists and policymakers better understand the role that carbon
7
sequestration strategies could play in mitigating adverse climate changes (WESTCARB, 2008). Additional information on WESTCARB can be found at www.westcarb.org. During Phase I of WESTCARB, the CGS developed preliminary baseline information concerning geologic options for carbon dioxide (CO2) sequestration in California. This involved identifying and characterizing porous and permeable rock formations in the numerous sedimentary basins of California and defining areas within these basins that may be geologically suitable for sequestering CO2. Screening and follow‐up geologic reviews resulted in the identification of as many as 27 sedimentary basins having varying degrees of sequestration potential. The basins ranged from small non‐marine basins for which there is little, if any, information, to larger Cenozoic marine basins with abundant subsurface data in the form of geophysical well logs, cores, and other information related to energy industry operations. The marine basins are characterized by several favorable attributes including 1) thick sedimentary fill with multiple porous and permeable sandstone aquifers and hydrocarbon reservoirs; 2) marine shale seals; 3) abundant geological, petrophysical, and fluid data from oil and gas operations; and 4) numerous depleted or mature oil and gas fields, which might be reactivated or benefit from CO2 enhanced recovery operations. 1.2. Overview During the initial scoping stages of Phase II, the Sacramento basin was selected from among the marine basins for further formation‐level evaluation. The Upper Cretaceous Mokelumne River, Starkey, and Winters formations within the basin were selected as potential objectives for further characterization based on their high sand‐shale ratios, plentiful well control, and the presence of numerous producing and abandoned gas fields. An overview of the regional geology of the Mokelumne River, Starkey and Winters formations of the southern Sacramento Basin is included as Appendix A. The Sacramento Basin measures approximately 240 miles long and averages about 50 miles wide. It is bounded on the north by the Klamath Mountains, on the east by the Sierra Nevada and Cascade Range, and to the west by the Coast Ranges and Coast Range Thrust. It is separated from the genetically related San Joaquin Basin to the south by the Stockton Arch and Stockton Arch Fault zone. It is a prolific natural gas producing basin in which 144 active or abandoned natural gas fields and one abandoned oil field have cumulatively produced 9.1 TCF (trillion cubic feet) of natural gas and 14.5 MMBO (million barrels oil) (DOGGR, 2007). The basin also includes California’s largest unassociated natural gas field, the Rio Vista Field, which has produced more than 3.6 TCF of natural gas. Throughout most of the northern half of the Sacramento Basin, sandstones are generally shallow (<1,000 m), or highly lenticular, discontinuous, and erratic, greatly diminishing their potential for large‐scale CO2 sequestration. Further, the thick sections of Cretaceous sandstone,
8
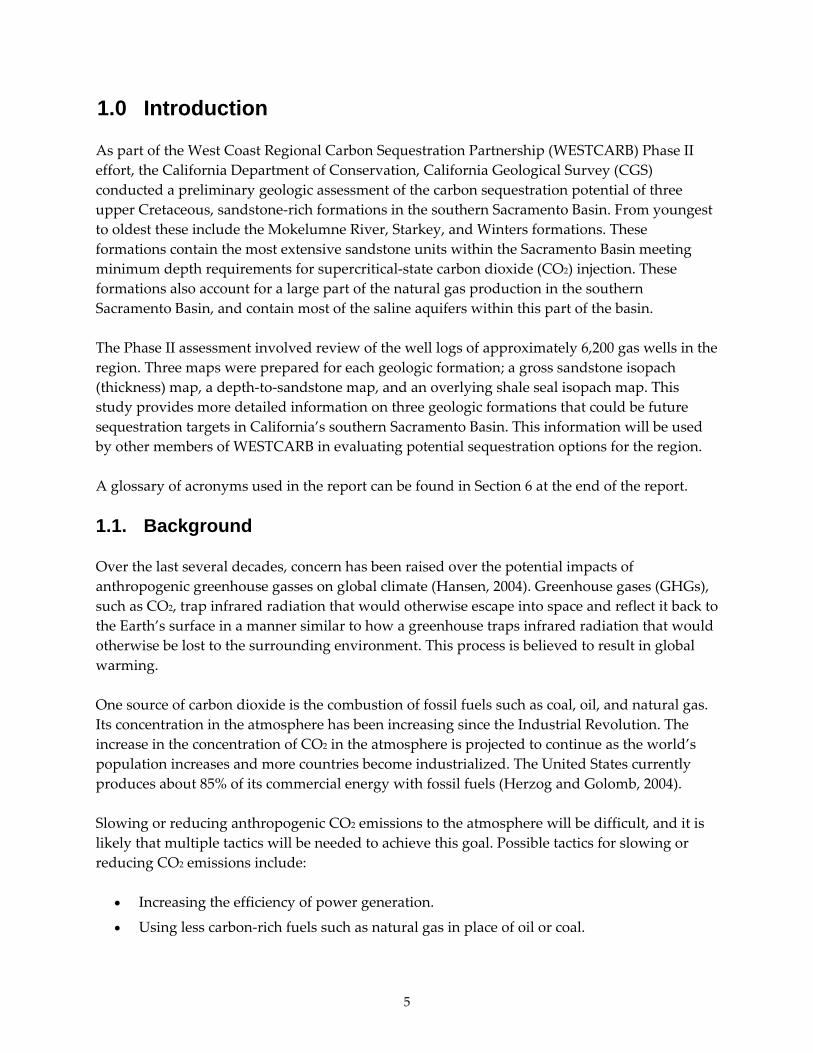
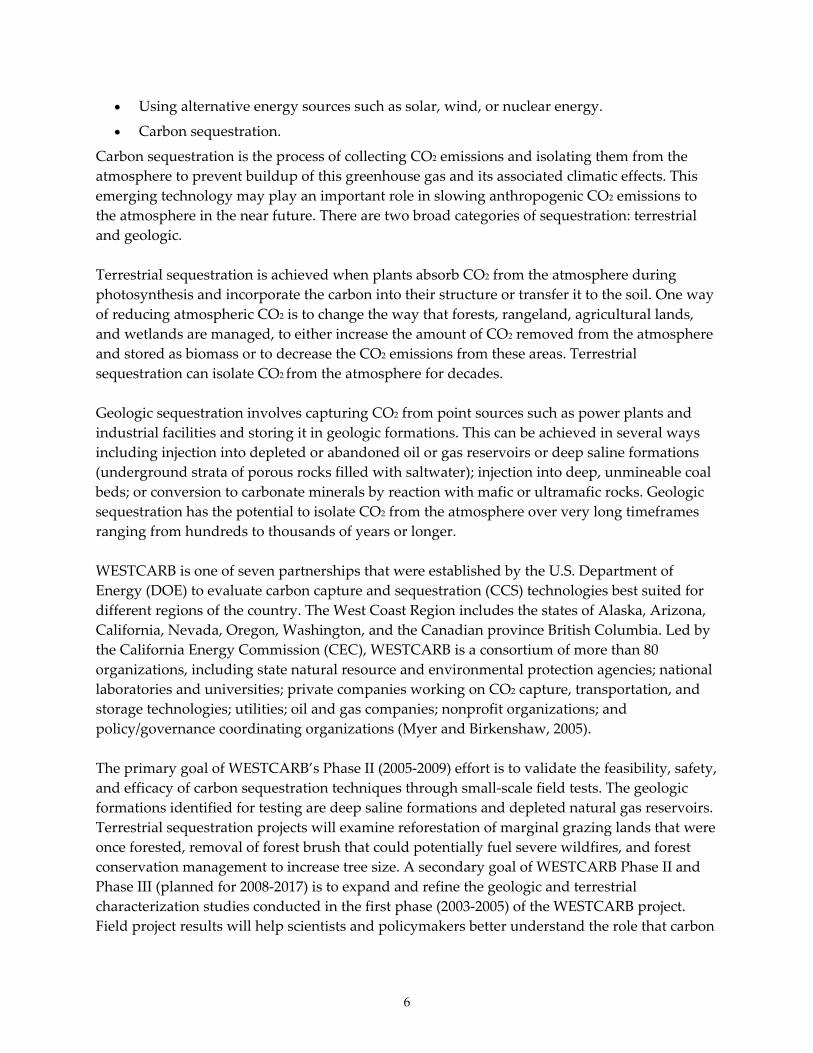
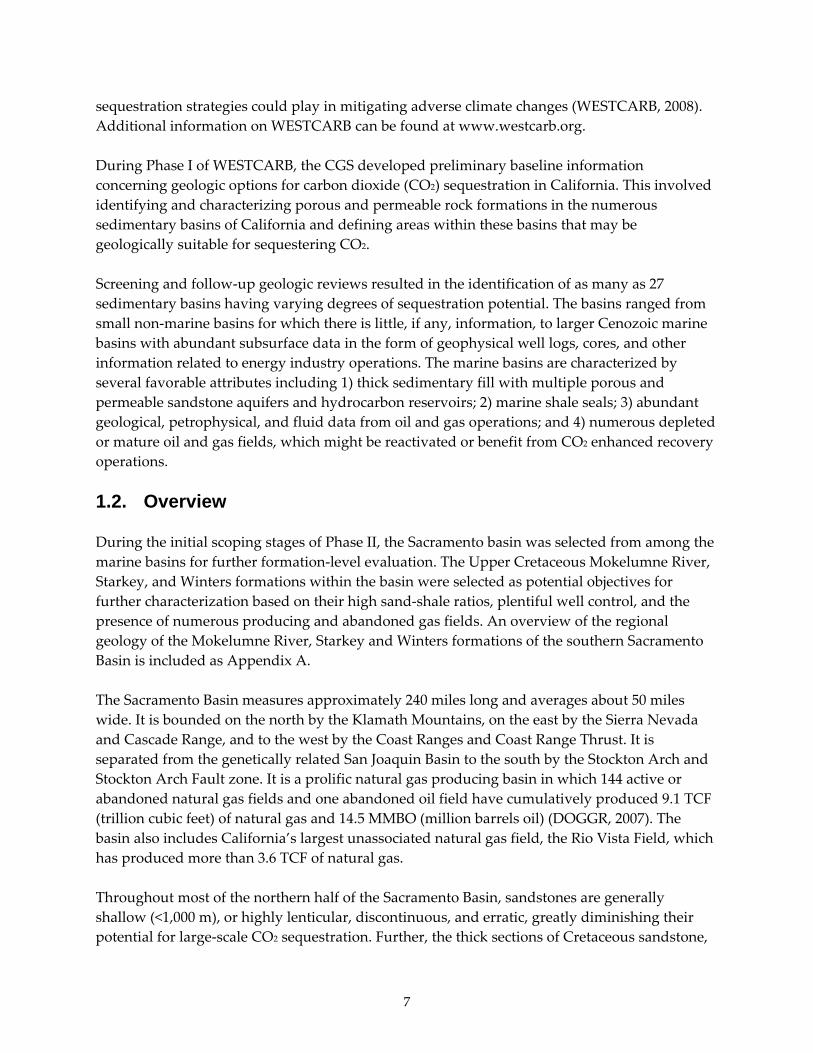
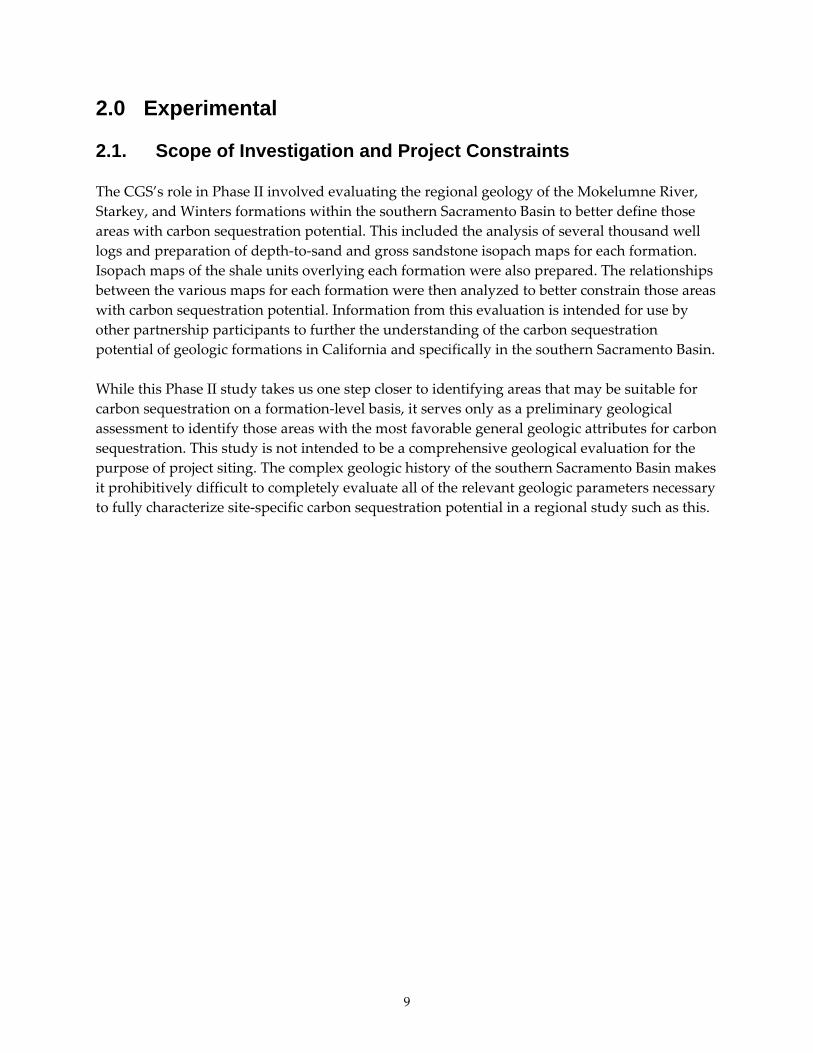
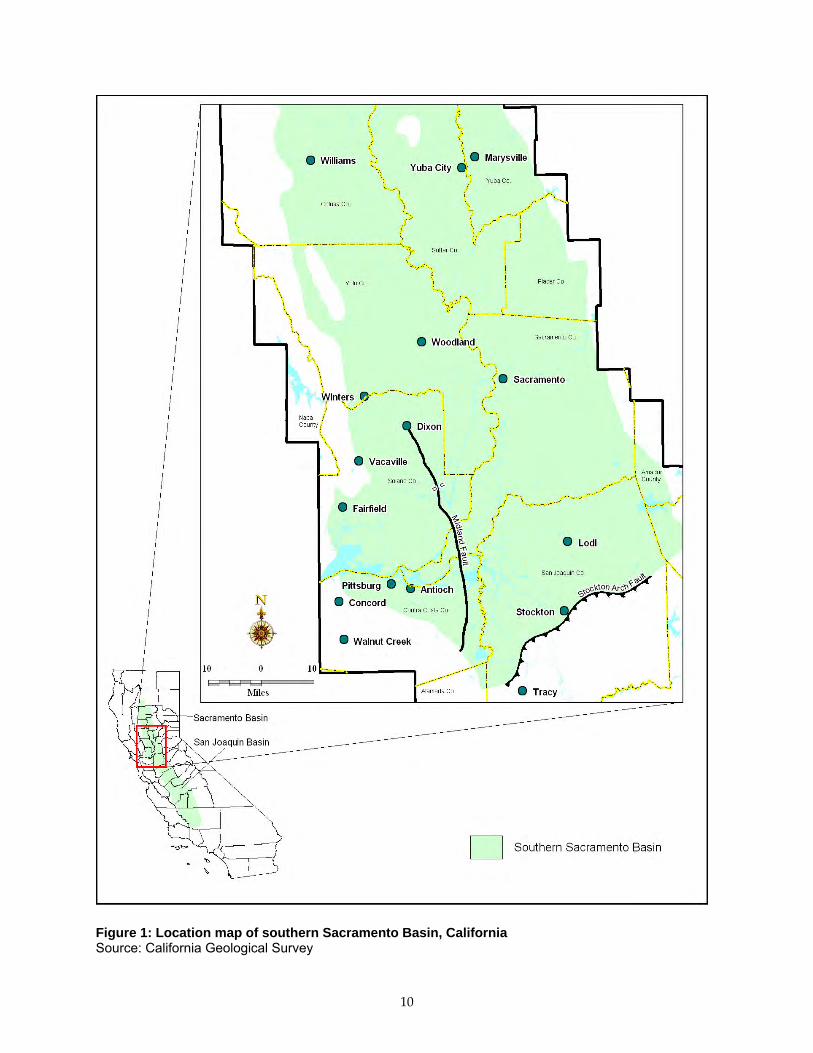
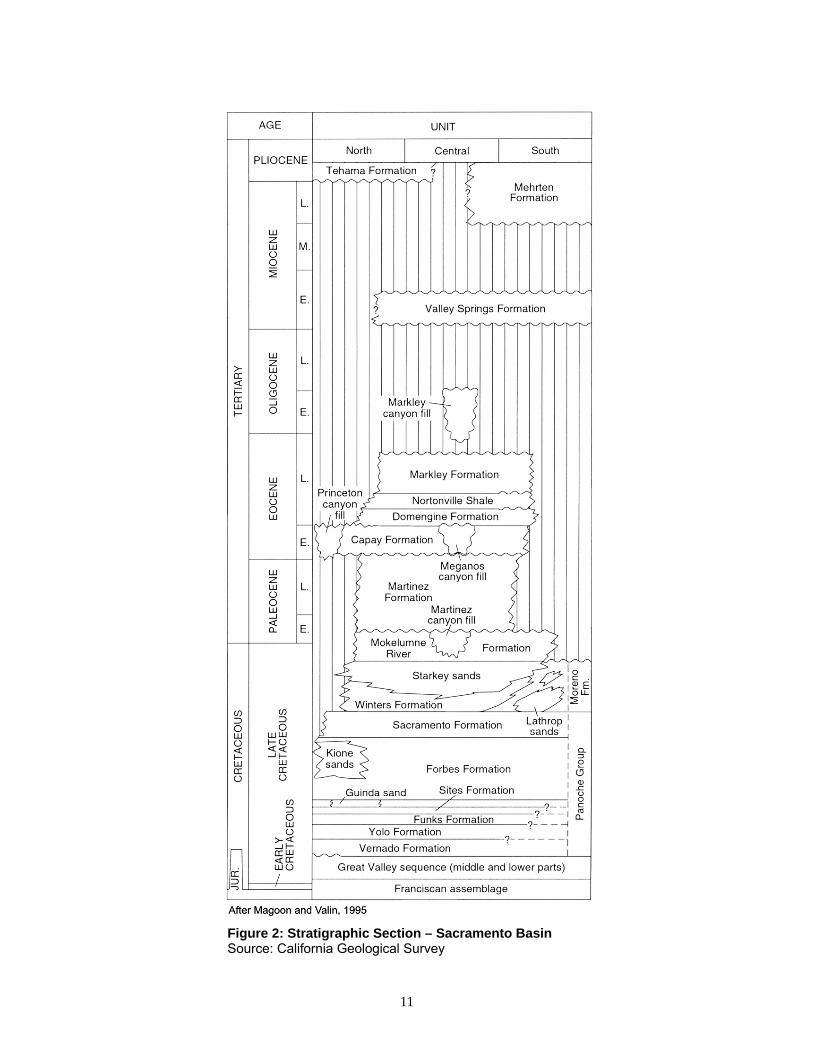
including those of the Mokelumne River, Starkey, and Winters formations, have been stripped from the northern half of the basin by regional uplift and erosion. Accordingly, the Phase II efforts focused on the southern part of the basin where thick sequences of Mokelumne River, Starkey, and Winters sandstones occur. For the purposes of this assessment, the southern Sacramento basin is defined as the area extending about 100 miles from the vicinity of Yuba City in Sutter County southward to the Stockton Arch Fault just south of the city of Stockton (Figure 1). From west to east, sandstones within these formations extend a maximum distance of 50 miles from the city of Pittsburg in Contra Costa County almost to the San Joaquin County – Amador County line. Cumulatively, approximately 3,000 square miles of the southern Sacramento Basin are underlain by sandstones within the Mokelumne River, Starkey, and Winters formations. Figure 2 is a generalized stratigraphic section of the Sacramento Basin which illustrates the lateral and vertical relationships of these formations to adjacent rock units. Mokelumne River, Starkey, and Winters sandstones account for a large part of the natural gas production, and comprise the bulk of saline aquifers in the southern Sacramento Basin. They may offer opportunities for storage in depleted gas or oil fields, possible enhanced gas recovery (EGR) operations, and sequestration within adjacent down‐dip brine saturated portions of these sandstones. Gas accumulations can occur in up‐dip stratigraphic traps, unconformity traps, fault traps, and combinations of these. The distribution producing oil and gas fields in the southern Sacramento Basin is shown in Figure 3.
9
2.0 Experimental 2.1. Scope of Investigation and Project Constraints The CGS’s role in Phase II involved evaluating the regional geology of the Mokelumne River, Starkey, and Winters formations within the southern Sacramento Basin to better define those areas with carbon sequestration potential. This included the analysis of several thousand well logs and preparation of depth‐to‐sand and gross sandstone isopach maps for each formation. Isopach maps of the shale units overlying each formation were also prepared. The relationships between the various maps for each formation were then analyzed to better constrain those areas with carbon sequestration potential. Information from this evaluation is intended for use by other partnership participants to further the understanding of the carbon sequestration potential of geologic formations in California and specifically in the southern Sacramento Basin. While this Phase II study takes us one step closer to identifying areas that may be suitable for carbon sequestration on a formation‐level basis, it serves only as a preliminary geological assessment to identify those areas with the most favorable general geologic attributes for carbon sequestration. This study is not intended to be a comprehensive geological evaluation for the purpose of project siting. The complex geologic history of the southern Sacramento Basin makes it prohibitively difficult to completely evaluate all of the relevant geologic parameters necessary to fully characterize site‐specific carbon sequestration potential in a regional study such as this.
10
Figure 1: Location map of southern Sacramento Basin, California Source: California Geological Survey
11
Figure 2: Stratigraphic Section – Sacramento Basin Source: California Geological Survey
12
Figure 3: Oil and gas fields of the southern Sacramento Basin Source: California Geological Survey
13
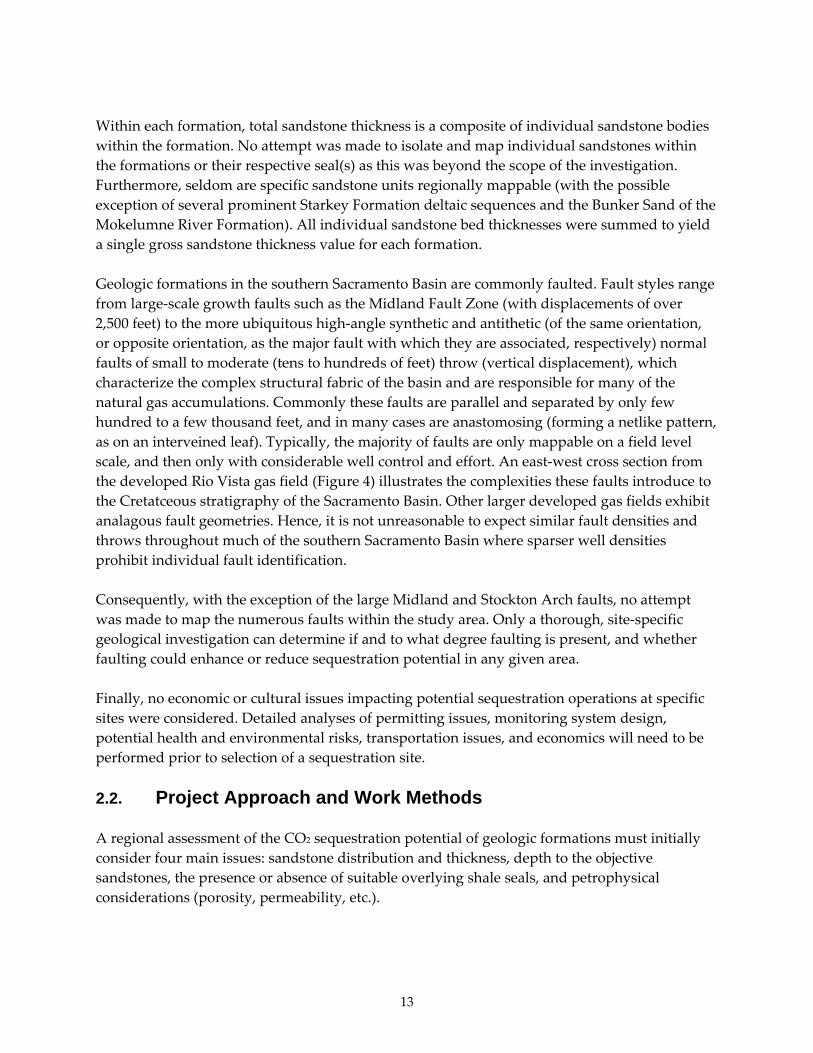
Within each formation, total sandstone thickness is a composite of individual sandstone bodies within the formation. No attempt was made to isolate and map individual sandstones within the formations or their respective seal(s) as this was beyond the scope of the investigation. Furthermore, seldom are specific sandstone units regionally mappable (with the possible exception of several prominent Starkey Formation deltaic sequences and the Bunker Sand of the Mokelumne River Formation). All individual sandstone bed thicknesses were summed to yield a single gross sandstone thickness value for each formation. Geologic formations in the southern Sacramento Basin are commonly faulted. Fault styles range from large‐scale growth faults such as the Midland Fault Zone (with displacements of over 2,500 feet) to the more ubiquitous high‐angle synthetic and antithetic (of the same orientation, or opposite orientation, as the major fault with which they are associated, respectively) normal faults of small to moderate (tens to hundreds of feet) throw (vertical displacement), which characterize the complex structural fabric of the basin and are responsible for many of the natural gas accumulations. Commonly these faults are parallel and separated by only few hundred to a few thousand feet, and in many cases are anastomosing (forming a netlike pattern, as on an interveined leaf). Typically, the majority of faults are only mappable on a field level scale, and then only with considerable well control and effort. An east‐west cross section from the developed Rio Vista gas field (Figure 4) illustrates the complexities these faults introduce to the Cretatceous stratigraphy of the Sacramento Basin. Other larger developed gas fields exhibit analagous fault geometries. Hence, it is not unreasonable to expect similar fault densities and throws throughout much of the southern Sacramento Basin where sparser well densities prohibit individual fault identification. Consequently, with the exception of the large Midland and Stockton Arch faults, no attempt was made to map the numerous faults within the study area. Only a thorough, site‐specific geological investigation can determine if and to what degree faulting is present, and whether faulting could enhance or reduce sequestration potential in any given area. Finally, no economic or cultural issues impacting potential sequestration operations at specific sites were considered. Detailed analyses of permitting issues, monitoring system design, potential health and environmental risks, transportation issues, and economics will need to be performed prior to selection of a sequestration site. 2.2. Project Approach and Work Methods A regional assessment of the CO2 sequestration potential of geologic formations must initially consider four main issues: sandstone distribution and thickness, depth to the objective sandstones, the presence or absence of suitable overlying shale seals, and petrophysical considerations (porosity, permeability, etc.).
14
Figure 4: East-west cross section - Rio Vista Gas Field (after Pepper & Johnson, 1992) Source: California Geological Survey
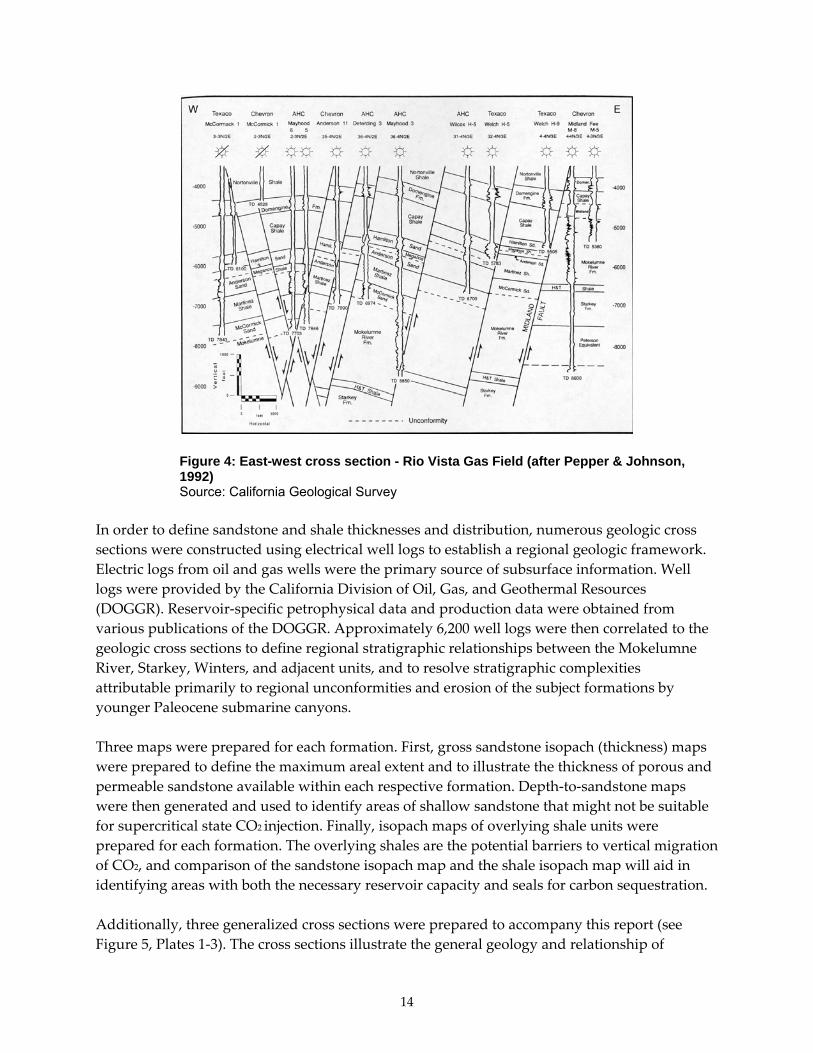
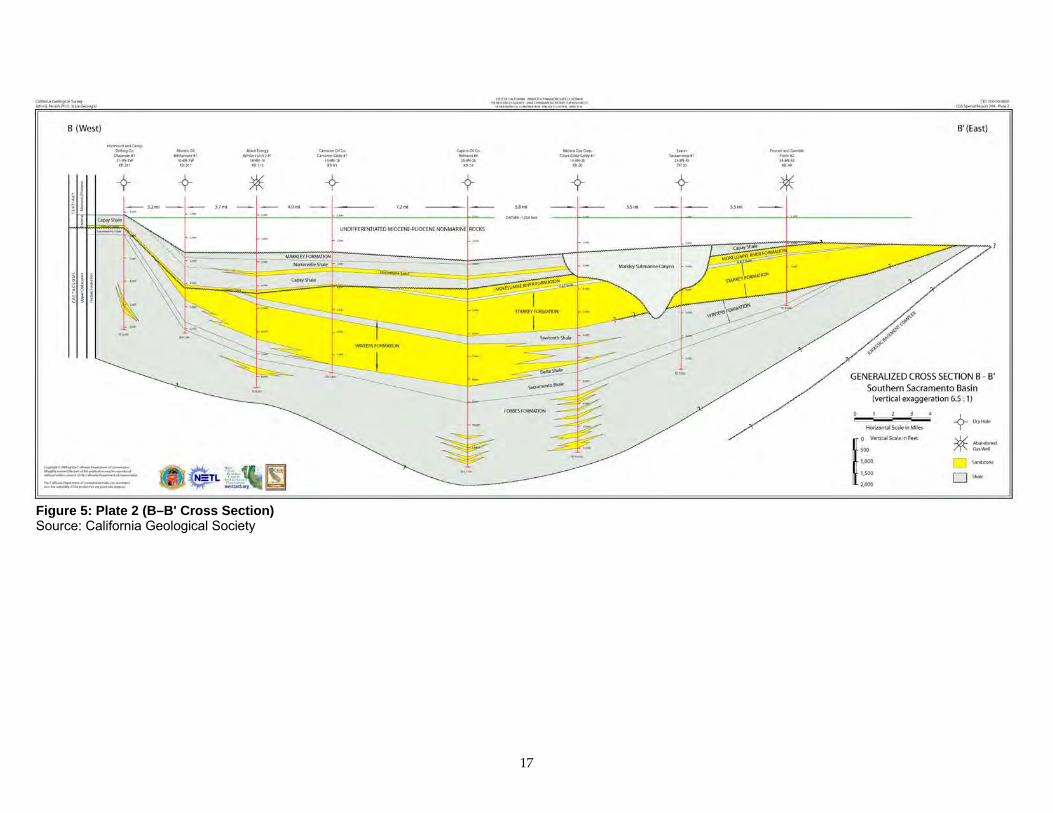
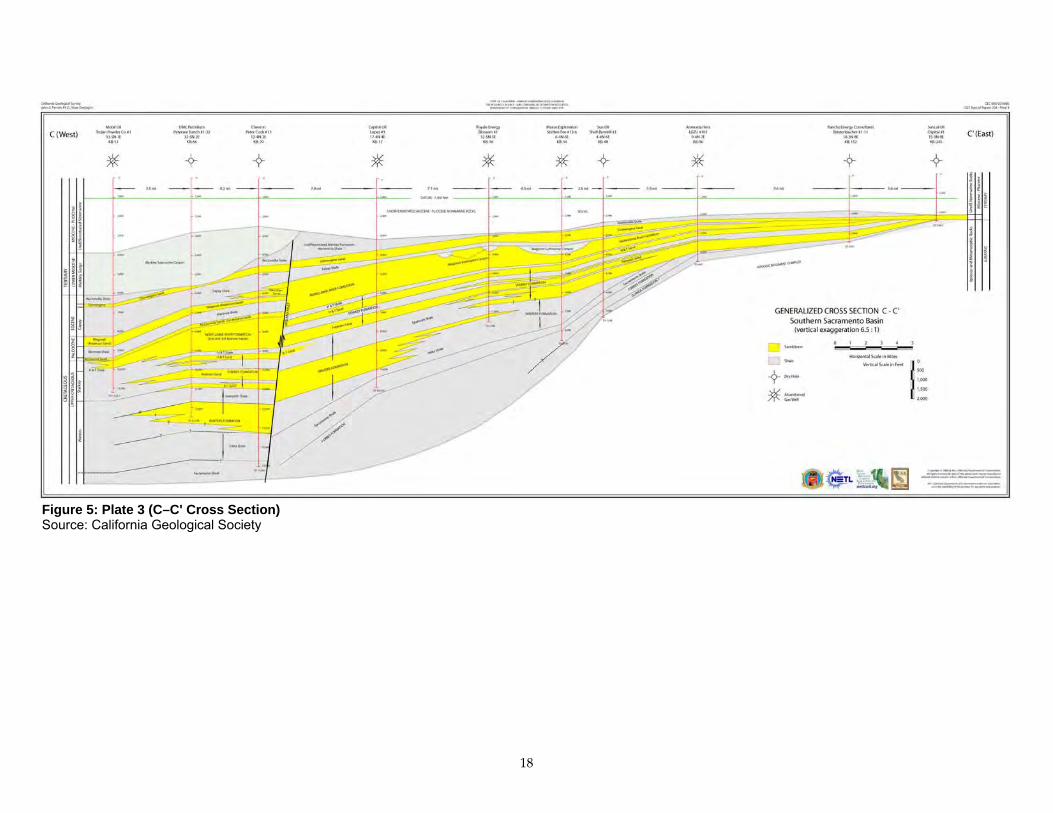
In order to define sandstone and shale thicknesses and distribution, numerous geologic cross sections were constructed using electrical well logs to establish a regional geologic framework. Electric logs from oil and gas wells were the primary source of subsurface information. Well logs were provided by the California Division of Oil, Gas, and Geothermal Resources (DOGGR). Reservoir‐specific petrophysical data and production data were obtained from various publications of the DOGGR. Approximately 6,200 well logs were then correlated to the geologic cross sections to define regional stratigraphic relationships between the Mokelumne River, Starkey, Winters, and adjacent units, and to resolve stratigraphic complexities attributable primarily to regional unconformities and erosion of the subject formations by younger Paleocene submarine canyons. Three maps were prepared for each formation. First, gross sandstone isopach (thickness) maps were prepared to define the maximum areal extent and to illustrate the thickness of porous and permeable sandstone available within each respective formation. Depth‐to‐sandstone maps were then generated and used to identify areas of shallow sandstone that might not be suitable for supercritical state CO2 injection. Finally, isopach maps of overlying shale units were prepared for each formation. The overlying shales are the potential barriers to vertical migration of CO2, and comparison of the sandstone isopach map and the shale isopach map will aid in identifying areas with both the necessary reservoir capacity and seals for carbon sequestration. Additionally, three generalized cross sections were prepared to accompany this report (see Figure 5, Plates 1‐3). The cross sections illustrate the general geology and relationship of
15
Figure 5: Cross sections Index (Plates 1-3) Source: California Geological Survey
16
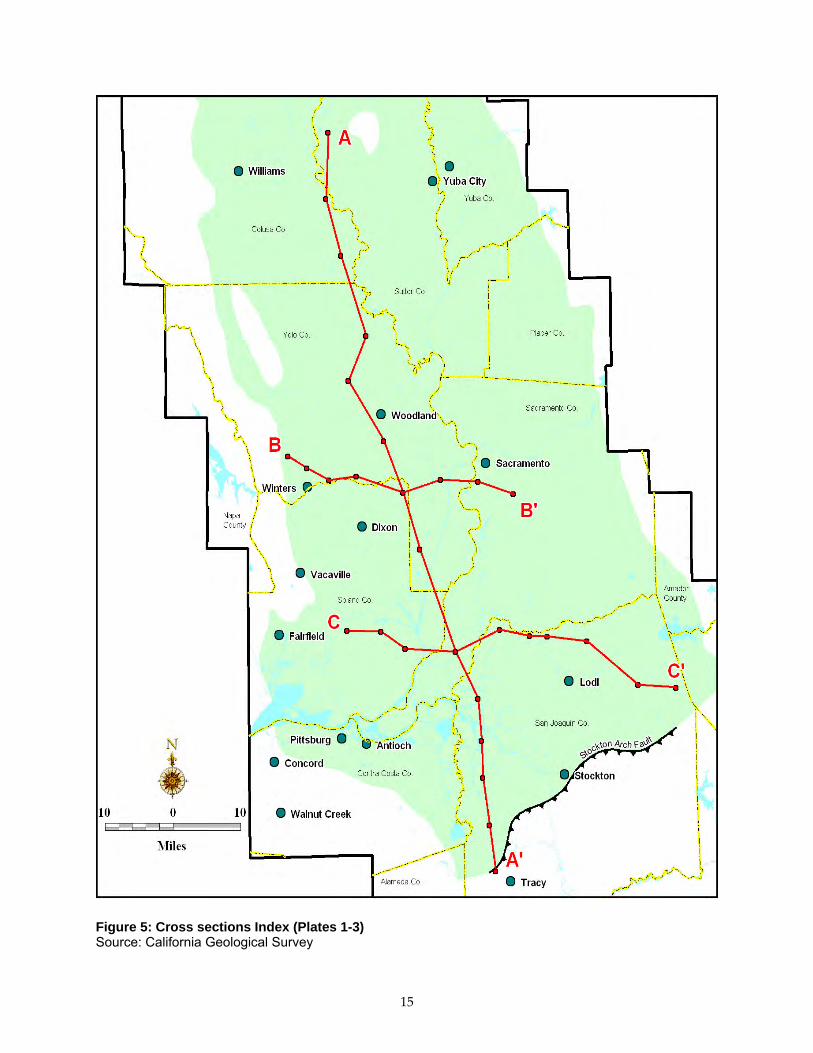
Figure 5: Plate 1 (A–A' Cross Section) Source: California Geological Survey
17
Figure 5: Plate 2 (B–B' Cross Section) Source: California Geological Society
18
Figure 5: Plate 3 (C–C' Cross Section) Source: California Geological Society
19
sandstone packages to shales. Intervals designated as sandstone on the cross sections reflect the entire section from the top of the uppermost to the bottom of the lowermost sand within each formation. Interbedded shales are not shown. Hence, the illustrated sandstone thicknesses on the cross sections may exceed actual sandstone thickness as reflected on the accompanying maps. All maps were digitized and geographic information system (GIS) layers were provided to the Utah Automated Geographic Reference Center to provide access by other WESTCARB participants via the WESTCARB Interactive Map (http://atlas.utah.gov/co2wc/) and data download (http://atlas.utah.gov/WESTCARB‐GIS‐data/) sites. 2.2.1. Gross Sandstone Isopach Maps Sandstone was identified using the spontaneous potential (SP) curves from oil and gas well electrical logs. Sandstone was defined as a negative millivolt deflection on the SP curve relative to a baseline SP response in the enclosing shales. Due to the varying vintage and quality of the well logs, the regional nature of the mapping, and the influences of bed thickness, clay content, mud filtrate and formation water resistivity, and other variables on SP response, no quantitative SP response cut‐off was used. While this approach introduces some degree of subjectivity into the selection of gross sand, it does not materially impact the regional sandstone maps. Within each formation, sandstone occurs as multiple sand bodies interbedded with shales. Sand bodies range from thin stringers to massive sandstones many hundreds of feet thick. All sand bodies were summed to provide a single value for each formation. Within the Mokelumne River and Starkey formations, sandstone distribution has been adversely affected by down cutting of Paleocene age submarine canyons. These canyons incised into the underlying Cretaceous sediments resulting in erosion and removal of increasingly larger areas of sandstone in progressively younger beds. While the general limits and axes of these submarine canyons are fairly well known, the extent of down cutting can be highly variable within the canyons over short distances. Consequently, no effort was made to map sandstone within the limits of the submarine canyons, and no sandstone within the canyons was included in the initial determination of total sandstone distribution for each respective formation. No minimum sandstone thickness was considered inadequate for geologic sequestration. While thicker sandstones are intuitively more attractive, imposing a minimum sandstone thickness would eliminate up‐dip sandstone pinch‐outs, primarily along the east and west flanks of the basin.
20
2.2.2. Depth-to-Sandstone Maps Depth‐to‐sandstone maps were prepared to delineate areas underlain by sandstone of sufficient depth to allow supercritical‐state injection. Depths were determined for the top of the uppermost sandstone occurrence in each formation, regardless of its stratigraphic position within the formation. Depth‐to‐sandstone maps, while similar, are not to be confused with more conventional structural contour maps. While structural contour maps illustrate the relative elevations of a correlative surface (formation top, etc), the depth maps simply record the physical depth of the uppermost porous sandstone in each formation. Since the purpose of these maps is to define areas worthy of more detailed geologic evaluation, no attempt was made to map the many normal faults that characterize the southern Sacramento Basin. Within this portion of the basin, only the large Midland Fault Zone (represented by the Midland Fault) was mapped due to its large displacement and significant impacts on sedimentation and erosion across the fault plane. 2.2.3. Shale Isopach Maps Isopach maps of the overlying shale seal(s) were generated to identify areas with sufficient seal thickness. Thickness values were calculated for the first continuous shale unit immediately overlying the uppermost sandstone in each formation. In many cases, these shales are recognized stratigraphic units such as the Capay, H&T, and Sawtooth shales, which respectively form the seals overlying Mokelumne River, Starkey and Winters sandstones throughout much of the area. However, the Sacramento Basin’s tectonic history of multiple periods of uplift and subsidence, as well as stratigraphic pinch‐outs of sandstones, in many cases, makes regional mapping of sealing units difficult. Sandstone pinch‐outs can result from erosional angular unconformities or normal depositional processes such as facies changes from deltaic sandstones to marine shales. Where pinch‐outs occur, separate contours were drawn covering the areas involved. This is most evident in the shale units overlying the Winters sandstones, where the southwesterly facies change from Starkey sandstone to shale results in a marked increase in shale thickness, and on the west side of the basin where the pinch‐out of Domengine sandstone juxtaposes the Nortonville and Capay shales. Conversely, the occurrence of sandstones within a sealing shale unit can result in an abrupt thinning of a sealing unit. This occurs, for instance, in the southern part of the basin where Tracy Formation sandstones occur within the Sawtooth Shale. Similarly, the pinch‐out of a shale seal can produce an abrupt thickening in overlying shale as one unit thins to zero and is replaced by a much thicker shale unit. This occurs, for example, where the H&T Shale is truncated to the west, resulting in the thicker Capay Shale resting unconformably on Starkey sandstone.
21
Fault displacement can also greatly impact seal thickness locally and regionally. When individual wells exhibited anomalously thin seals relative to neighboring wells, these aberrations were ignored and attributed to localized faulting of limited throw. Large‐scale faulting can result in major regional thickness changes as is the case with shales overlying the Mokelumne River Formation on opposing sides of the Midland Fault. Down‐to‐the‐west displacement along the Midland Fault zone preserved the overlying Martinez Shale, whereas east of the fault zone, the Martinez Shale was stripped by erosion, and the Mokelumne River sandstones are unconformably overlain by the Capay Shale. 2.2.4. Map Analysis The digital layers for the various maps (gross sandstone isopach, depth‐to‐sandstone, and shale isopach) for each formation will allow other WESTCARB partners to perform their own analyses of the sequestration potential of these formations based on their own minimum depth and seal thickness parameters. For the purposes of this study, CGS has made the following assumptions in the analysis that follows. In regards to sandstone distribution, only those areas of sandstone undisturbed by erosion by the younger submarine canyons were considered. While the general limits of these canyons are fairly well known, the depth of erosion within the canyons can be extremely variable, making mapping difficult, if not impossible, given the available subsurface control. Accordingly, areas of eroded sandstone within the canyons were subtracted from the total gross sandstone areas. Areas of shallow sandstone were eliminated. The actual depth for supercritical state CO2 injection may vary somewhat with local conditions. There is some variability in the literature regarding appropriate minimum depths for supercritical state CO2 injection, but values between 800 meters (2,625 feet) and 1,000 meters (3,280 feet) are common. For this assessment, a minimum depth of 1,000 meters (3,280 feet) was used and areas shallower than this were eliminated. In evaluating seal thickness, a minimum thickness of 100 feet was used. In a regional study such as this it is not possible to determine an optimal minimum thickness of shale necessary to restrict vertical migration of injected CO2. This would best determined through a comprehensive site specific geological evaluation of a potential sequestration site. In the region under study, the abundance of small fault displacements in the tens of feet suggests that a minimum seal thickness of 100 feet may be a reasonable starting point for a regional assessment. Procedurally, all maps were digitized and GIS overlays were used to facilitate analysis which consisted of a simple process of elimination. The gross sandstone maps were evaluated to determine the maximum areal extent (square miles) of sandstone within each formation. The total area for each formation was then reduced by areas, if any, where sandstone has been eroded within the submarine canyons. The resulting maps were then overlain by their respective depth‐to‐sandstone maps, allowing the removal of areas of shallow sandstone.

22
Finally, the overlying shale isopach maps were overlain to further reduce the area, and arrive at an estimate for each formation meeting all three parameters.

23
24
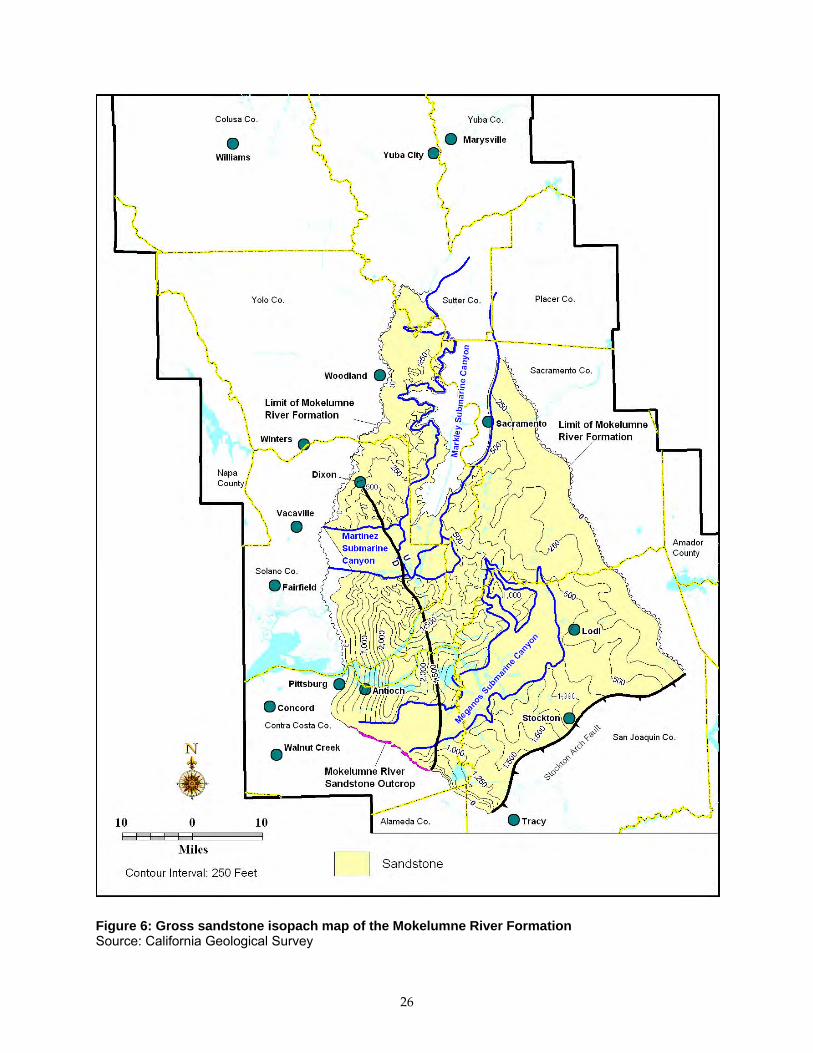
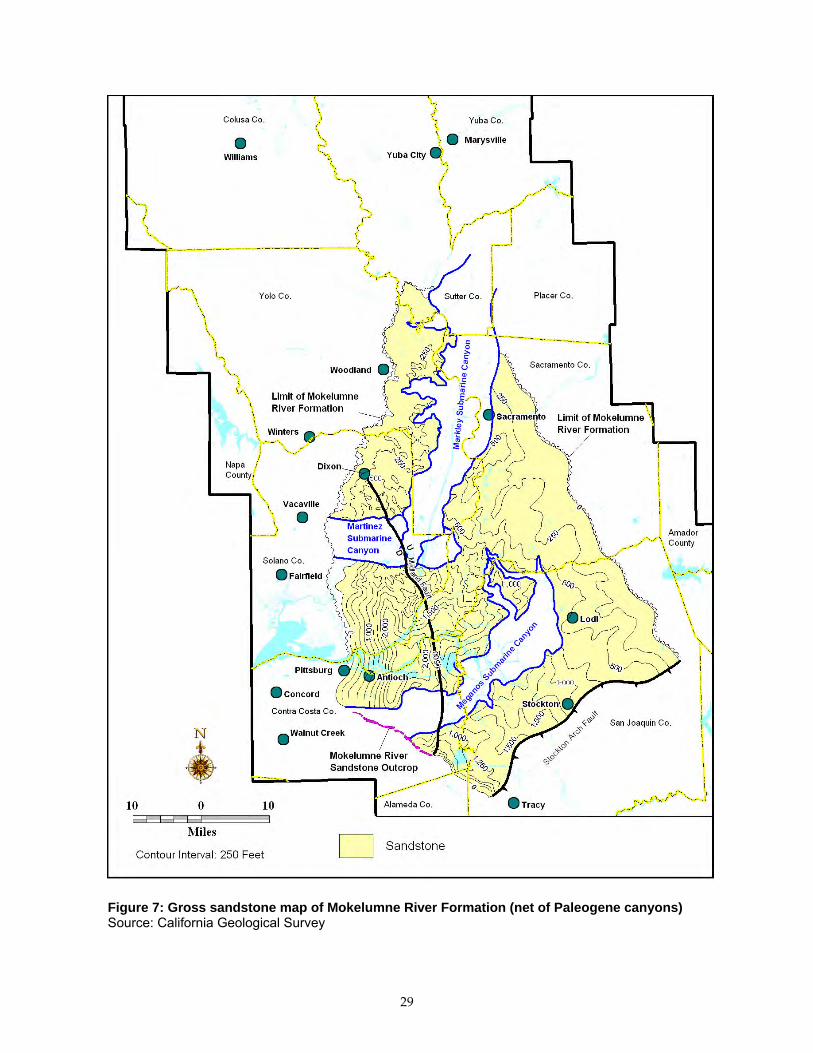
3.0 Results and Discussion All three formations display areas of significant sandstone development that meet the aforementioned criteria. As would be expected, the adverse impacts of Paleocene erosion, depth, and seal thickness, on total sandstone distribution generally decrease with depth. The Winters Formation displays both the greatest areal extent and a larger percentage of its total distribution meet the criteria than the shallower formations. 3.1. Mokelumne River Formation 3.1.1. Distribution of Mokelumne River Formation Sandstone The Mokelumne River Formation is limited to the southern third of the Sacramento Basin where approximately 1,908 square miles are underlain by Mokelumne River Formation sandstone (Figure 6). The formation is unconformably truncated to the north, pinching out in southern Yolo and Sutter counties (Plate 1). The lower contact is unconformable in the north and grades into a conformable contact with the underlying H&T Shale to the south (Johnson, 1990). Angular unconformities also truncate the formation to the east and west, separating it from younger overlying Tertiary rocks. To the west, it pinches out along a south‐southwesterly trend extending from Sutter County through central Solano County southward into northeastern Contra Costa County where Mokelumne River formation beds crop out on the northeast flank of Mount Diablo. To the east, it is truncated along a trend extending southeastward through central Sacramento County and northeastern San Joaquin County (Plates 2 and 3). Throughout much of the southern Sacramento Basin, the Mokelumne River Formation is unconformably overlain by a thin section of Paleocene transgressive sandstone. West of the Midland Fault these sandstones are known as the McCormick or First Massive sands. Contemporaneous deposits on the east side of the fault are locally known as the Midland or Capital sands. Due to difficulty in identifying the contact between the Mokelumne River and Paleocene sandstones on electric logs, these sands have been combined with Mokelumne River Formation sandstone for the purpose of this assessment. Sandstone thickens progressively southward along a trend about 75 miles long from southern Sutter County, across the Stockton Arch Fault, and into the northern San Joaquin Basin. From Sutter County southward, the width of the trend diverges from less than 5 miles to a maximum of about 50 miles between its southwestern and easternmost subcrops in northern Contra Costa and eastern San Joaquin counties, respectively. Total sandstone thickens rapidly, reaching a maximum observed thickness of over 2,480 feet near the southwestern tip of Sacramento County. Erosion by the Paleocene Markley, Martinez, and Meganos submarine canyons has partially to entirely removed Mokelumne River Formation sandstone from much of its original distribution.

25
This is most extreme along the axis of the Markley canyon where the entire Mokelumne River Formation has been removed along a north – south trend extending about 30 miles from
26
Figure 6: Gross sandstone isopach map of the Mokelumne River Formation Source: California Geological Survey
27
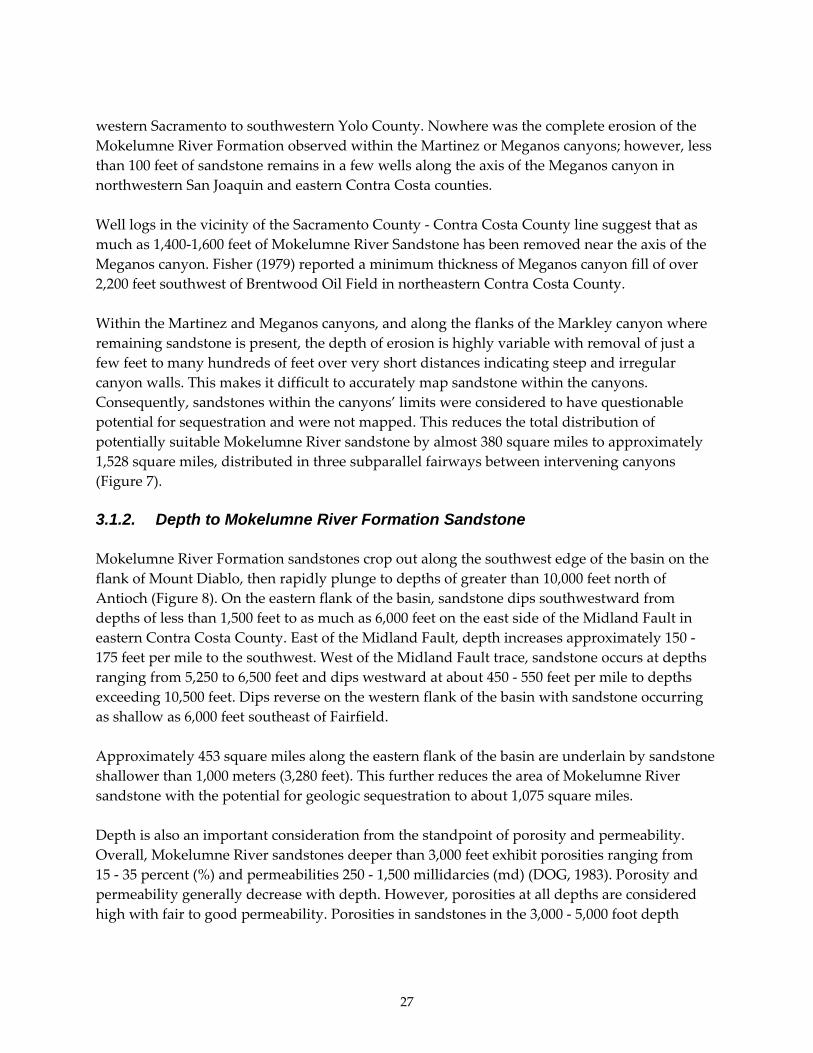
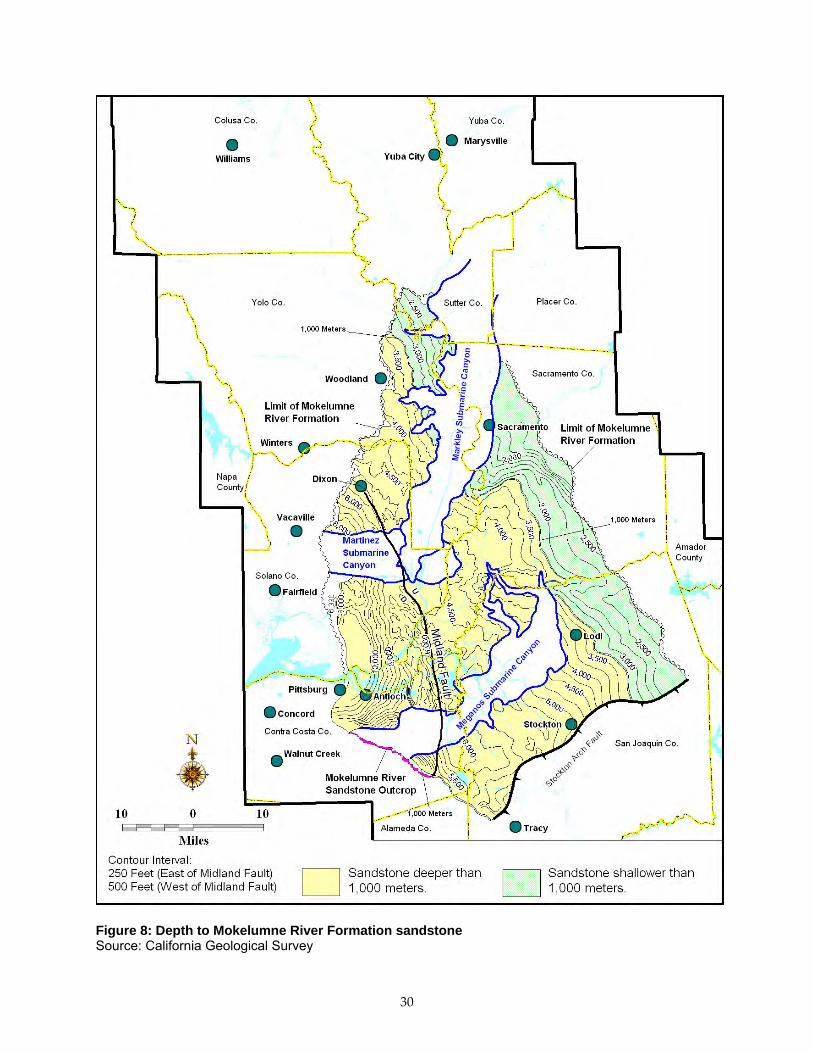
western Sacramento to southwestern Yolo County. Nowhere was the complete erosion of the Mokelumne River Formation observed within the Martinez or Meganos canyons; however, less than 100 feet of sandstone remains in a few wells along the axis of the Meganos canyon in northwestern San Joaquin and eastern Contra Costa counties. Well logs in the vicinity of the Sacramento County ‐ Contra Costa County line suggest that as much as 1,400‐1,600 feet of Mokelumne River Sandstone has been removed near the axis of the Meganos canyon. Fisher (1979) reported a minimum thickness of Meganos canyon fill of over 2,200 feet southwest of Brentwood Oil Field in northeastern Contra Costa County. Within the Martinez and Meganos canyons, and along the flanks of the Markley canyon where remaining sandstone is present, the depth of erosion is highly variable with removal of just a few feet to many hundreds of feet over very short distances indicating steep and irregular canyon walls. This makes it difficult to accurately map sandstone within the canyons. Consequently, sandstones within the canyons’ limits were considered to have questionable potential for sequestration and were not mapped. This reduces the total distribution of potentially suitable Mokelumne River sandstone by almost 380 square miles to approximately 1,528 square miles, distributed in three subparallel fairways between intervening canyons (Figure 7). 3.1.2. Depth to Mokelumne River Formation Sandstone Mokelumne River Formation sandstones crop out along the southwest edge of the basin on the flank of Mount Diablo, then rapidly plunge to depths of greater than 10,000 feet north of Antioch (Figure 8). On the eastern flank of the basin, sandstone dips southwestward from depths of less than 1,500 feet to as much as 6,000 feet on the east side of the Midland Fault in eastern Contra Costa County. East of the Midland Fault, depth increases approximately 150 ‐ 175 feet per mile to the southwest. West of the Midland Fault trace, sandstone occurs at depths ranging from 5,250 to 6,500 feet and dips westward at about 450 ‐ 550 feet per mile to depths exceeding 10,500 feet. Dips reverse on the western flank of the basin with sandstone occurring as shallow as 6,000 feet southeast of Fairfield. Approximately 453 square miles along the eastern flank of the basin are underlain by sandstone shallower than 1,000 meters (3,280 feet). This further reduces the area of Mokelumne River sandstone with the potential for geologic sequestration to about 1,075 square miles. Depth is also an important consideration from the standpoint of porosity and permeability. Overall, Mokelumne River sandstones deeper than 3,000 feet exhibit porosities ranging from 15 ‐ 35 percent (%) and permeabilities 250 ‐ 1,500 millidarcies (md) (DOG, 1983). Porosity and permeability generally decrease with depth. However, porosities at all depths are considered high with fair to good permeability. Porosities in sandstones in the 3,000 ‐ 5,000 foot depth

28
range from 22 ‐ 35%. Limited data suggests permeabilities in the 3 ‐ 242 md range (DOG, 1983). Porosities in the 5,000‐7,000 foot range from 23 ‐ 34%. A single permeability value of 250 md is
29
Figure 7: Gross sandstone map of Mokelumne River Formation (net of Paleogene canyons) Source: California Geological Survey
30
Figure 8: Depth to Mokelumne River Formation sandstone Source: California Geological Survey
31
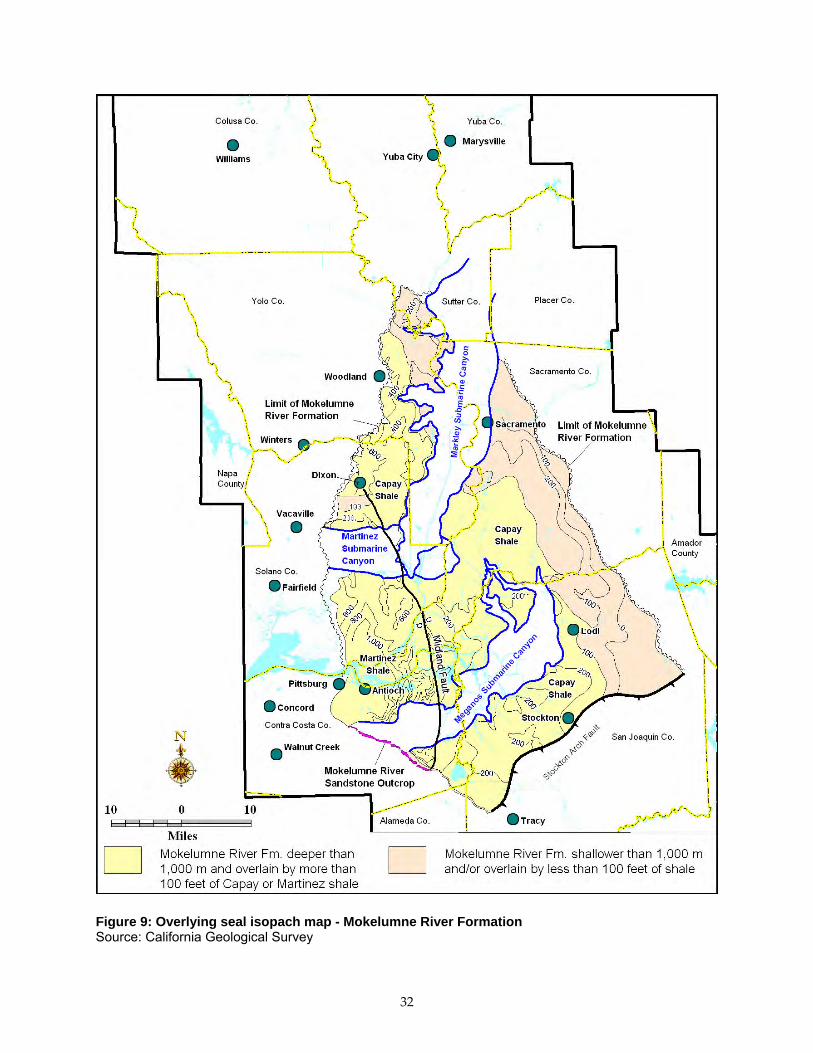
reported for rocks in this depth range. Between depths of 7,000 ‐ 9,000 feet, reported porosities range from 20‐28% with no available permeability data. No permeability data are available for the relative few sandstones penetrated below 9,000 feet. However, log porosities in sandstones between 9,500 and 10,300 feet in central Solano County indicate typical porosities of 18 ‐ 22%. 3.1.3. Mokelumne River Formation Seals Sealing units overlying the Mokelumne River Formation sandstones consist of the Eocene Capay Shale (east of the Midland Fault) and the Martinez Shale (west of the Midland Fault) (Figure 9). The Capay Formation thins, then pinches out to the east, after which Mokelumne River sandstone is unconformably overlain by the Domengine Sandstone (Plate 3) or undifferentiated nonmarine rocks (Plate 2). East of the Midland Fault, Capay shale thickens basinward to over 800 feet in the vicinity of Dixon in Solano County. However, throughout most of this area it ranges between 200 and 400 feet thick. West of the Midland Fault, downward westward displacement along the Midland Fault zone allowed the preservation of the overlying Martinez Shale. To the east of the Midland Fault, the Martinez Shale has been stripped away by erosion. The Martinez Shale thickens westward from between 300 ‐ 600 feet along most of the west side of Midland Fault to over 1,000 feet north of Antioch, then thins northward and ultimately pinches out just east of Vacaville in northern Solano County. Throughout most of the area in which the Mokelumne River sandstones are deeper than 1,000 meters (3,280 feet), they are overlain by shale thicker than 100 feet. Only two small areas comprising about 30 square miles are overlain by shale thinner than 100 feet. The first of these (about 20 square miles) occurs just southeast of Lodi in San Joaquin County. On the west side of the basin an additional 10 square miles east of Vacaville is underlain by Martinez Shale thinner than 100 feet. This reduces the area of potentially suitable Mokelumne River sandstone to about 1,045 square miles (Figure 9). Table 1 summarizes the extent to which the depth and seal criteria impact total sandstone area.
Table 1: Distribution of Mokelumne River Formation Sandstone
MOKELUMNE RIVER FORMATION
Total Net Area
Percentage of Total Area
Gross Sandstone Distribution 1,908 sq. mi. 100% Less Submarine Canyons 1,528 sq. mi. 80% Deeper than 1,000 Meters 1,075 sq. mi. 56% With 100+ Feet of Seal 1,045 sq. mi. 55%
32
Figure 9: Overlying seal isopach map - Mokelumne River Formation Source: California Geological Survey
33
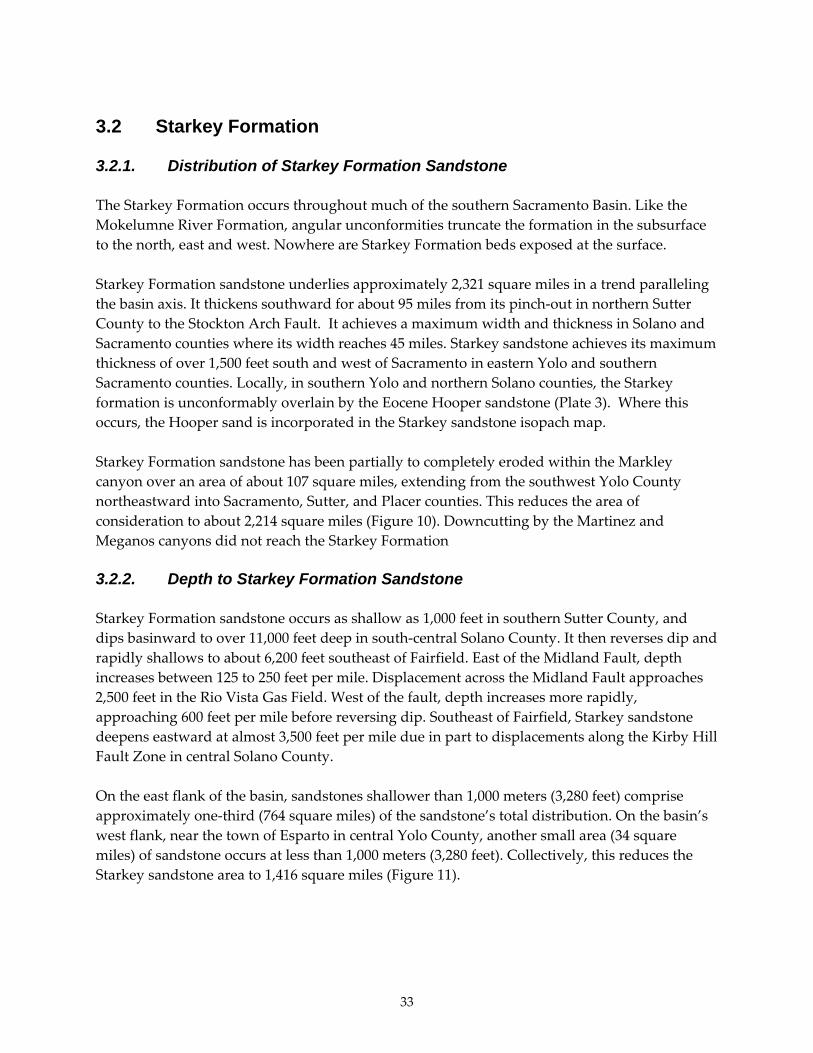
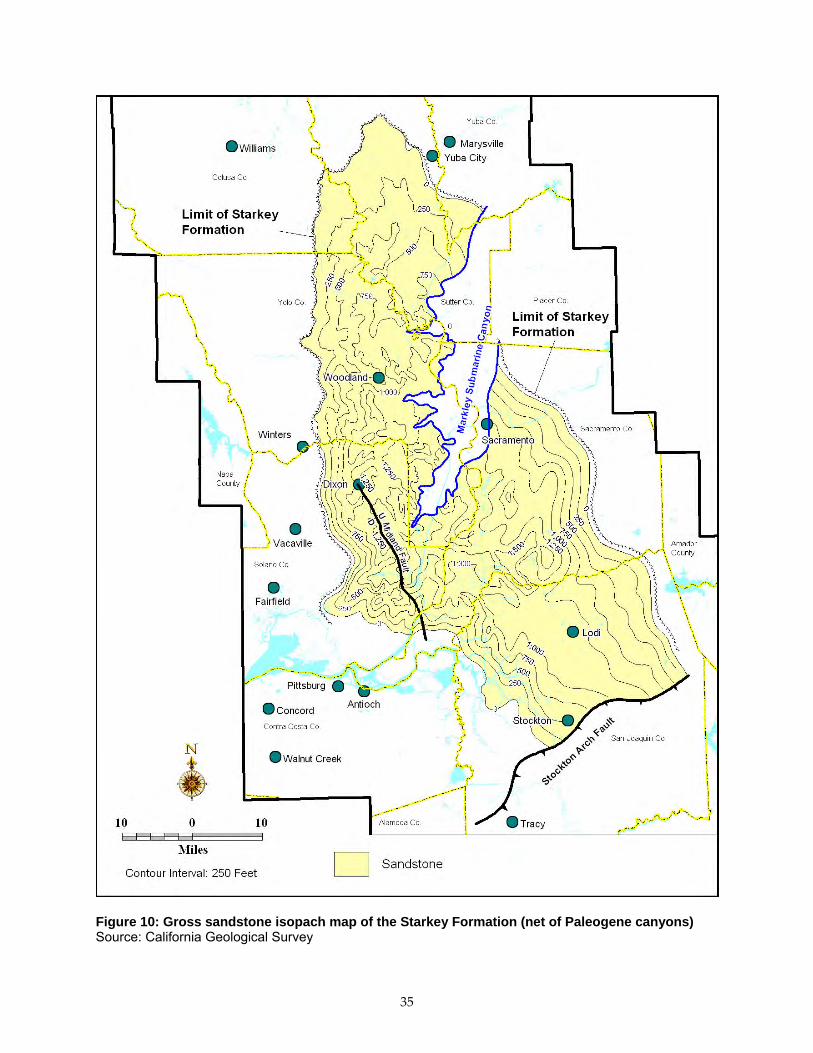
3.2 Starkey Formation 3.2.1. Distribution of Starkey Formation Sandstone The Starkey Formation occurs throughout much of the southern Sacramento Basin. Like the Mokelumne River Formation, angular unconformities truncate the formation in the subsurface to the north, east and west. Nowhere are Starkey Formation beds exposed at the surface. Starkey Formation sandstone underlies approximately 2,321 square miles in a trend paralleling the basin axis. It thickens southward for about 95 miles from its pinch‐out in northern Sutter County to the Stockton Arch Fault. It achieves a maximum width and thickness in Solano and Sacramento counties where its width reaches 45 miles. Starkey sandstone achieves its maximum thickness of over 1,500 feet south and west of Sacramento in eastern Yolo and southern Sacramento counties. Locally, in southern Yolo and northern Solano counties, the Starkey formation is unconformably overlain by the Eocene Hooper sandstone (Plate 3). Where this occurs, the Hooper sand is incorporated in the Starkey sandstone isopach map. Starkey Formation sandstone has been partially to completely eroded within the Markley canyon over an area of about 107 square miles, extending from the southwest Yolo County northeastward into Sacramento, Sutter, and Placer counties. This reduces the area of consideration to about 2,214 square miles (Figure 10). Downcutting by the Martinez and Meganos canyons did not reach the Starkey Formation 3.2.2. Depth to Starkey Formation Sandstone Starkey Formation sandstone occurs as shallow as 1,000 feet in southern Sutter County, and dips basinward to over 11,000 feet deep in south‐central Solano County. It then reverses dip and rapidly shallows to about 6,200 feet southeast of Fairfield. East of the Midland Fault, depth increases between 125 to 250 feet per mile. Displacement across the Midland Fault approaches 2,500 feet in the Rio Vista Gas Field. West of the fault, depth increases more rapidly, approaching 600 feet per mile before reversing dip. Southeast of Fairfield, Starkey sandstone deepens eastward at almost 3,500 feet per mile due in part to displacements along the Kirby Hill Fault Zone in central Solano County. On the east flank of the basin, sandstones shallower than 1,000 meters (3,280 feet) comprise approximately one‐third (764 square miles) of the sandstone’s total distribution. On the basin’s west flank, near the town of Esparto in central Yolo County, another small area (34 square miles) of sandstone occurs at less than 1,000 meters (3,280 feet). Collectively, this reduces the Starkey sandstone area to 1,416 square miles (Figure 11).

34
Porosities of 25 – 35% are typical in Starkey sandstones sandstones shallower than 9,000 feet. Sandstones deeper than 9,000 feet exhibit porosities of 14 – 22% (DOG, 1983). Permeability data are scarce, the only recorded values ranging from 50 ‐ 100 md (DOG, 1983).
35
Figure 10: Gross sandstone isopach map of the Starkey Formation (net of Paleogene canyons) Source: California Geological Survey
36
Figure 11: Depth to Starkey Formation sandstone Source: California Geological Survey
37
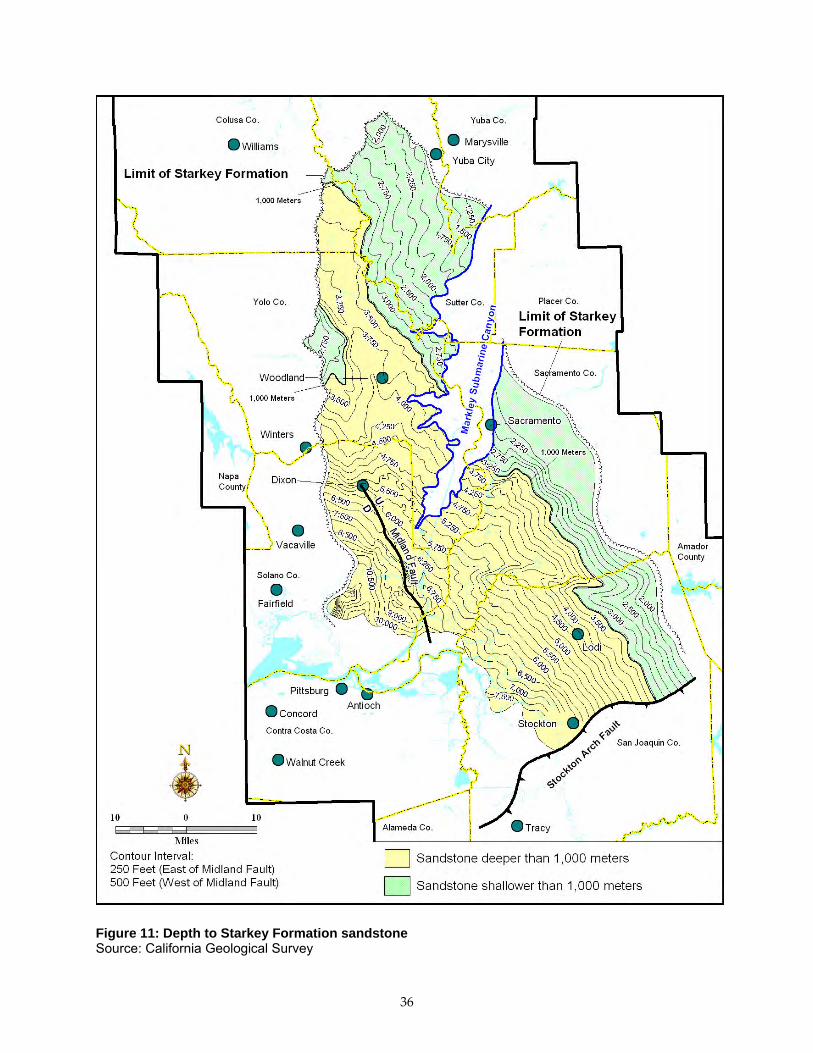
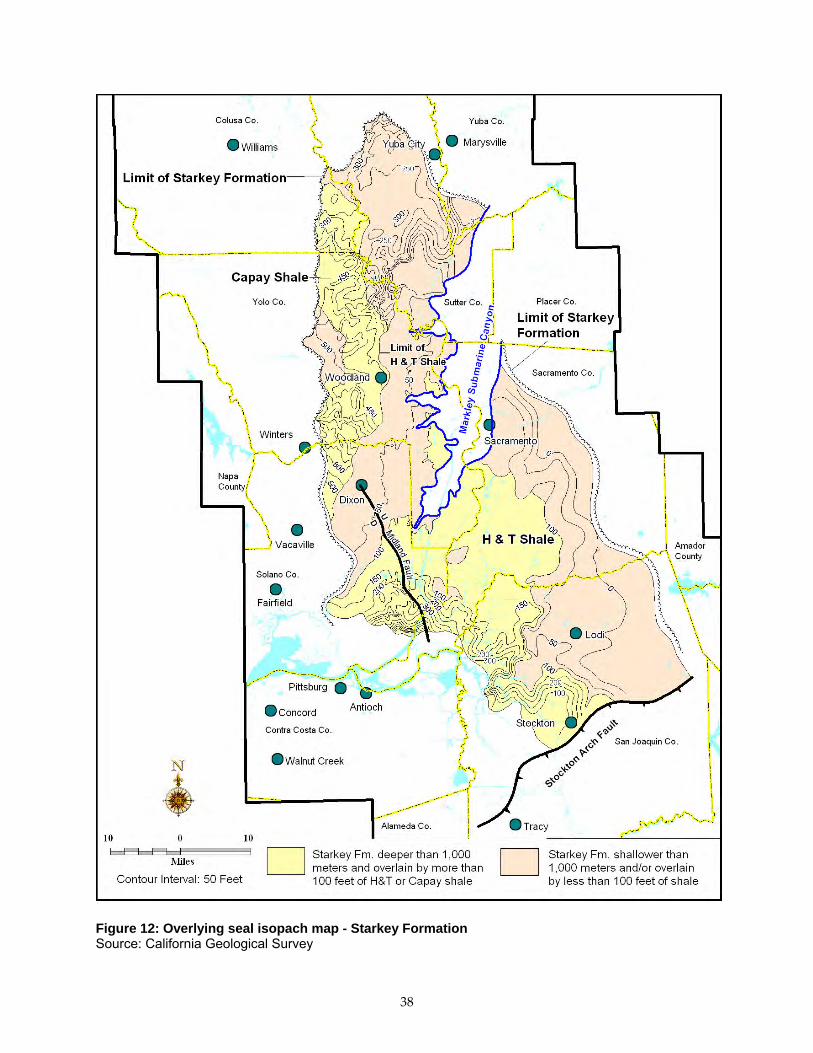
3.2.3. Starkey Formation Seals Throughout most of its range, Starkey sandstone is conformably overlain by the H&T Shale, which pinches out to the east and to the west. East of the pinch‐out, Starkey sandstone is overlain by Mokelumne River sandstone or, where Mokelumne River beds are absent, by the Domengine Sandstone or Capay Shale. To the west, the H&T Shale has been truncated by a regional unconformity. West of this pinch‐out, Starkey Formation sandstones are unconformably overlain by the Capay Shale. To the southwest, the H&T Shale thickens moderately; however, facies changes within the upper Starkey section from sandstone to marine shale progressively adds to the cumulative thickness of overlying shale. This is most evident near the southwestern limit of Starkey sandstone in southeastern Solano County, where more than 1,000 feet of shale overlies thin lower Starkey sandstones. Collectively, areas where Starkey sandstones are overlain by shale less than 100 feet thick comprise 496 square miles (Figure 12). This is primarily due to the eastward and westward thinning of the H&T Shale. Consequently, only 920 square miles (40%) of the original sandstone area meets the depth and seal constraints (Table 2).
Table 2: Distribution of Starkey Formation Sandstone
STARKEY FORMATION
Total Net Area
Percentage of Total Area
Gross Sandstone Distribution 2,321 sq. mi. 100% Less Submarine Canyons 2,214 sq. mi. 95% Deeper than 1,000 Meters 1,416 sq. mi. 61% With 100+ Feet of Seal 920 sq. mi. 40%
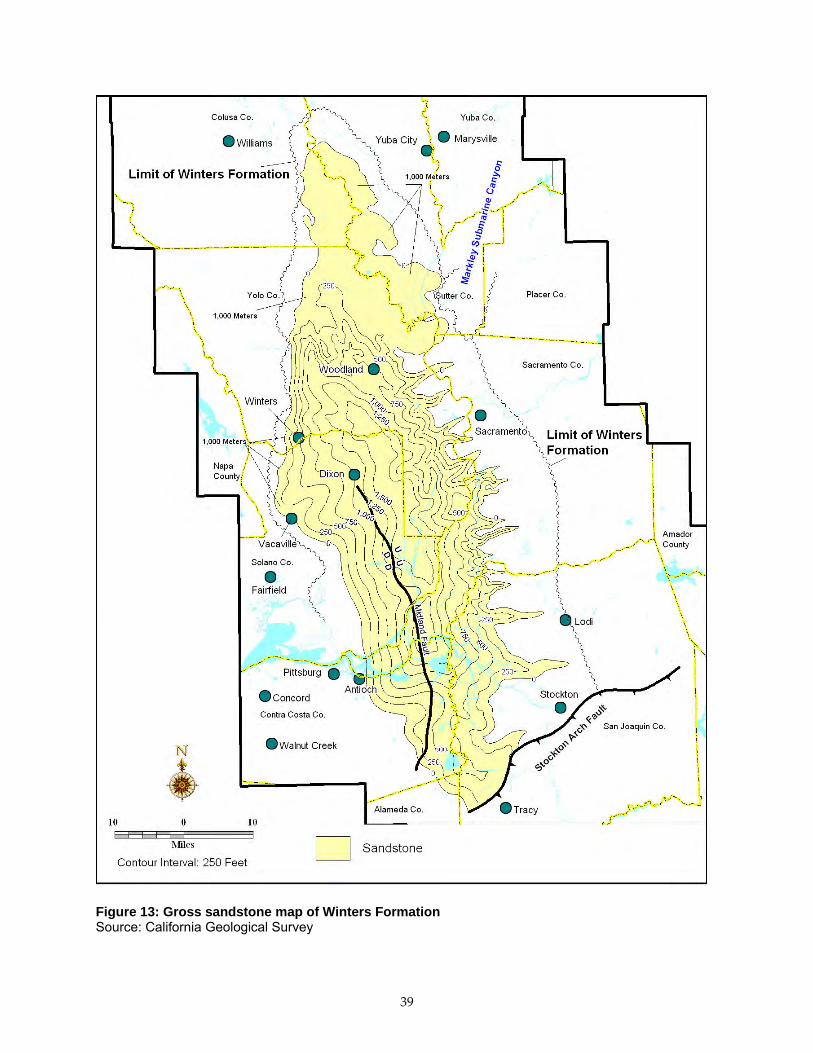
3.3. Winters Formation 3.3.1. Distribution of Winters Formation Sandstone Winters Formation sandstone underlies about 1,771 square miles within the southern Sacramento Basin along a trend extending 100 miles from southern Colusa and Sutter counties southward to the Stockton Arch Fault after which it passes into the northern San Joaquin Basin (Figure 13). At its maximum, the trend approaches a width of 35 miles in northern Solano County and western Sacramento County. Angular unconformities truncate the Winters Formation to the north and west. West of the Starkey Formation subcrop, the Hooper Sand
38
Figure 12: Overlying seal isopach map - Starkey Formation Source: California Geological Survey
39
Figure 13: Gross sandstone map of Winters Formation Source: California Geological Survey
40
unconformably overlies Winters sandstone and is incorporated in the sandstone isopach map (Plate 2). To the south and southwest, sandstone grades into marine shale. Along its eastern margin, Winters sandstone thins and pinches out up‐dip in a series of narrow fingers representing deposition within the marine slope feeder channels. The Winters Formation does not crop out anywhere in the basin. Winters Formation sandstone achieves a maximum thickness of over 1,500 feet in southern Yolo and eastern Solano counties. Gross sandstone exceeding 1,000 feet in thickness extends along a trend 50 miles long and approaching 15 miles wide. Unlike the shallower Mokelumne River and Starkey sandstones, the Winters sandstones are not impacted by the younger Paleocene submarine canyons. Only the Markley canyon incised deeply enough to reach the Winters Formation in southeastern Sutter and northwestern Sacramento counties, where only upper Winters Sawtooth shale and fine‐ grained slope deposits were eroded. 3.3.2. Depth to Winters Formation Sandstone Only 90 square miles are underlain by sandstone shallower than 1,000 meters (3,280 feet), reducing the area to 1,681 square miles. Shallow sandstone occurs at several locales along the uplifted northern and western limits of the formation (Figure 14). Throughout almost the entire southern two‐thirds of its distribution, sandstone occurs deeper than 6,000 feet. Only in its northern reaches and northwest flank do sandstones occur at depths shallower than 5,000 feet. West of the Midland Fault, Winters sandstone achieves a maximum depth of over 14,000 feet in southern Solano and Sacramento counties. Along the eastern side of the trend, depths generally increase at rates of between 150 ‐ 250 feet per mile. However, rates of over 300 feet per mile occur along some of the more steeply dipping sands within the feeder channels. West of the Midland Fault, sands deepen westward at roughly 500 ‐ 650 feet per mile before reversing dip along the faulted and uplifted western basin margin where sands can deepen at rates up to 750 feet per mile. Displacement along the Midland Fault can reach approximately 2,500 feet. Porosities range from a low of 18% in deep sands below 9,500 feet to a range of 25 – 38% in shallower zones. Permeabilities range from 10 ‐ 1,700 md (DOG, 1983). 3.3.3. Winters Formation Seals Of the three formations evaluated in this investigation, variability in seal thickness is greatest for the Winters Formation sandstones. This is due largely to the affects of regional unconformities and facies changes in overlying shales or sandstones. Sealing shale units range in thickness from less than 100 feet to the north to over 2,500 feet in localized areas to the south and west. Only 157 square miles of Winters sandstone deeper than 1,000 meters (3,280 feet) are
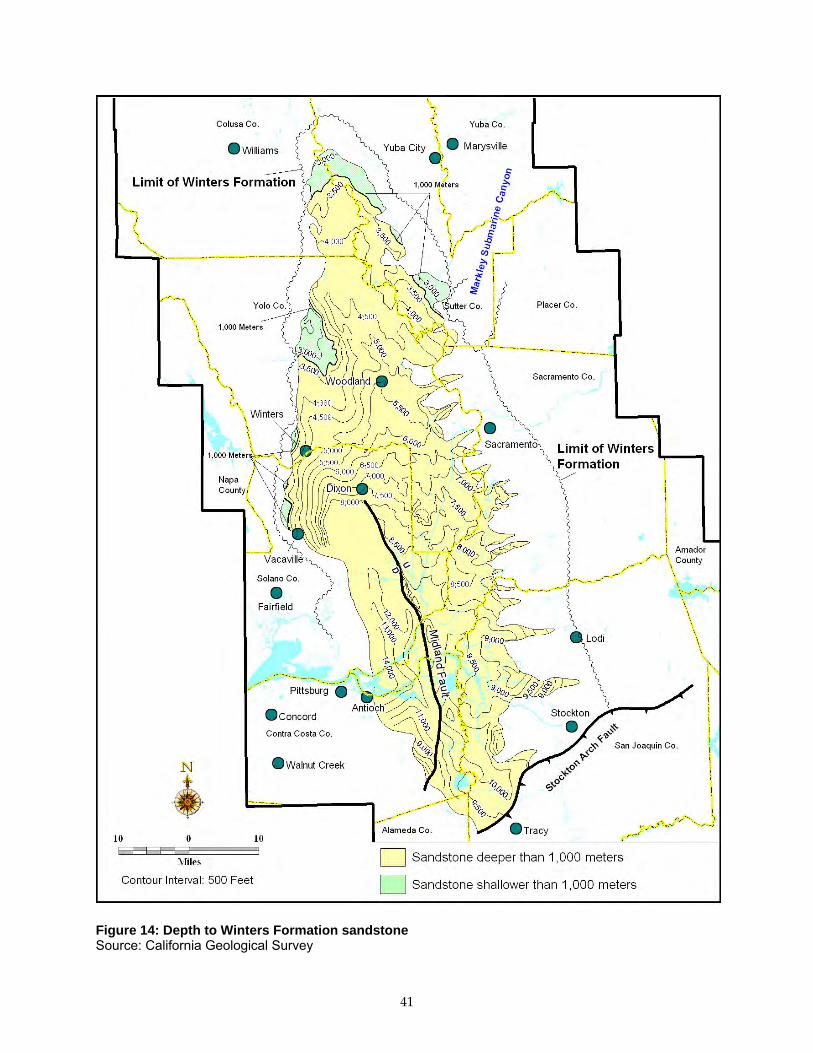
41
Figure 14: Depth to Winters Formation sandstone Source: California Geological Survey
42
Figure 15: Overlying seal isopach map - Winters Formation Source: California Geological Survey
43
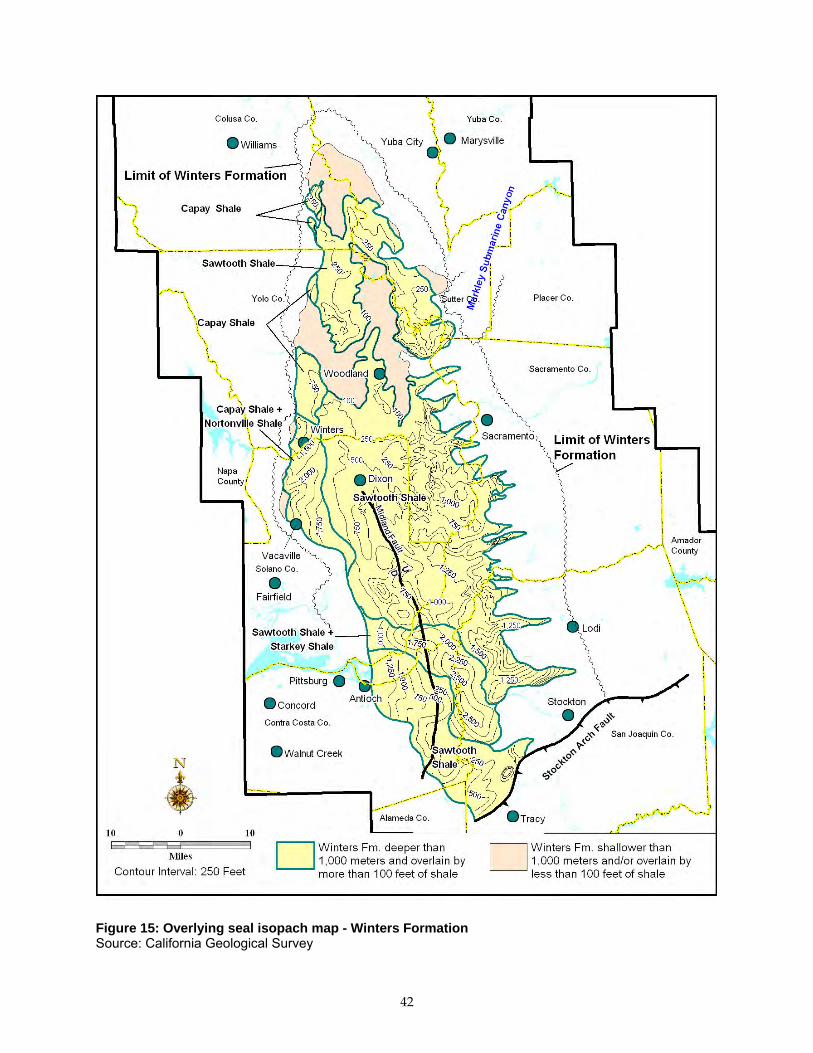
overlain by less than 100 feet of shale (Figure 15). This results in 1,524 remaining square miles (86%) meeting the minimum depth and seal parameters. Throughout most of its distribution, Winters sandstone is overlain by the Sawtooth Shale member of the Winters Formation. The Sawtooth Shale pinches out to the west along a regional unconformity. West of this pinch‐out, Winters sandstone is unconformably overlain by the Capay Shale resulting in a rapid thickening of overlying shale from 250 to over 750 feet in southwestern Yolo County. In the same vicinity, the Domengine Sandstone, which separates the Capay Shale from the overlying Nortonville Shale, pinches‐out to the south causing these two shale units to attain a combined thickness of over 2,500 feet along the western edge of the Winters sandstones. Similarly, in the southern part of the basin, overlying shale thickens from 500 ‐ 1,500 feet to as much as 2,500 feet in the northeast Contra Costa and western San Joaquin counties. This is largely due to the marineward gradation of sandstone to shale in the Starkey Formation. Further south, overlying shale again thins with the introduction of the Tracy Formation sandstones, which thicken southward into the San Joaquin Basin (Plate 1).
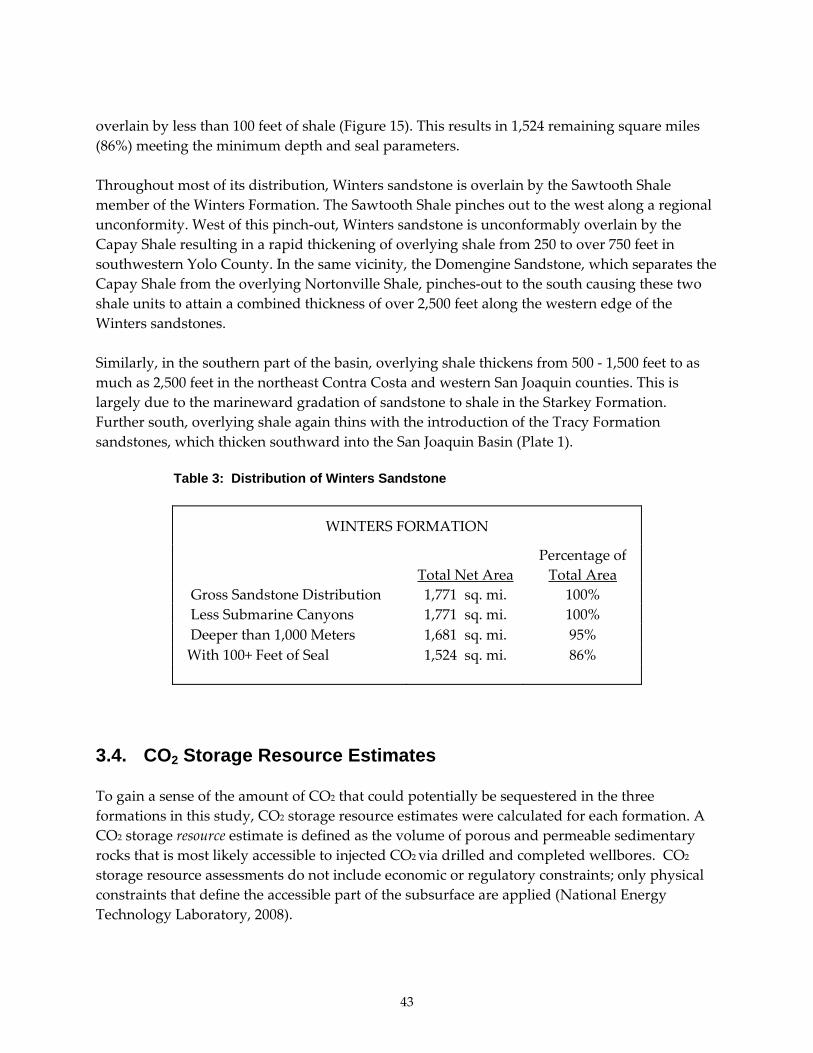
Table 3: Distribution of Winters Sandstone
WINTERS FORMATION
Total Net Area
Percentage of Total Area
Gross Sandstone Distribution 1,771 sq. mi. 100% Less Submarine Canyons 1,771 sq. mi. 100% Deeper than 1,000 Meters 1,681 sq. mi. 95% With 100+ Feet of Seal 1,524 sq. mi. 86%
3.4. CO2 Storage Resource Estimates To gain a sense of the amount of CO2 that could potentially be sequestered in the three formations in this study, CO2 storage resource estimates were calculated for each formation. A CO2 storage resource estimate is defined as the volume of porous and permeable sedimentary rocks that is most likely accessible to injected CO2 via drilled and completed wellbores. CO2 storage resource assessments do not include economic or regulatory constraints; only physical constraints that define the accessible part of the subsurface are applied (National Energy Technology Laboratory, 2008).
44
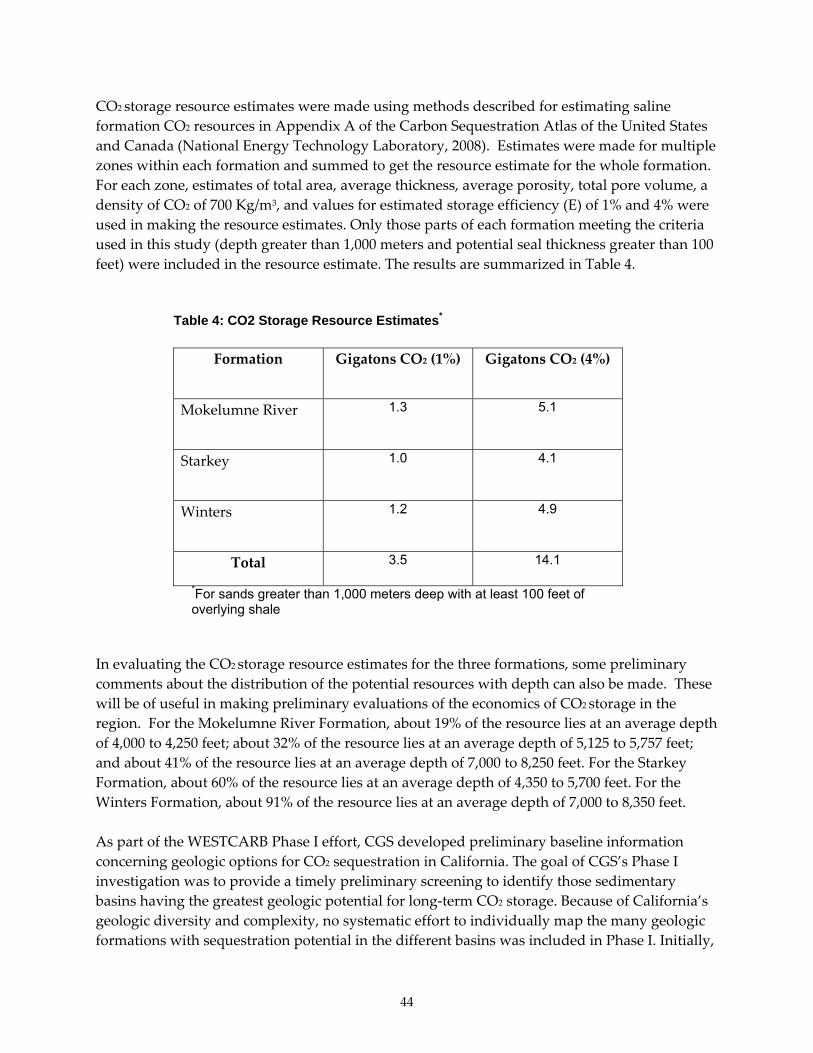
CO2 storage resource estimates were made using methods described for estimating saline formation CO2 resources in Appendix A of the Carbon Sequestration Atlas of the United States and Canada (National Energy Technology Laboratory, 2008). Estimates were made for multiple zones within each formation and summed to get the resource estimate for the whole formation. For each zone, estimates of total area, average thickness, average porosity, total pore volume, a density of CO2 of 700 Kg/m3, and values for estimated storage efficiency (E) of 1% and 4% were used in making the resource estimates. Only those parts of each formation meeting the criteria used in this study (depth greater than 1,000 meters and potential seal thickness greater than 100 feet) were included in the resource estimate. The results are summarized in Table 4.
Table 4: CO2 Storage Resource Estimates*
Formation Gigatons CO2 (1%) Gigatons CO2 (4%)
Mokelumne River 1.3 5.1
Starkey 1.0 4.1
Winters 1.2 4.9
Total 3.5 14.1
*For sands greater than 1,000 meters deep with at least 100 feet of overlying shale
In evaluating the CO2 storage resource estimates for the three formations, some preliminary comments about the distribution of the potential resources with depth can also be made. These will be of useful in making preliminary evaluations of the economics of CO2 storage in the region. For the Mokelumne River Formation, about 19% of the resource lies at an average depth of 4,000 to 4,250 feet; about 32% of the resource lies at an average depth of 5,125 to 5,757 feet; and about 41% of the resource lies at an average depth of 7,000 to 8,250 feet. For the Starkey Formation, about 60% of the resource lies at an average depth of 4,350 to 5,700 feet. For the Winters Formation, about 91% of the resource lies at an average depth of 7,000 to 8,350 feet. As part of the WESTCARB Phase I effort, CGS developed preliminary baseline information concerning geologic options for CO2 sequestration in California. The goal of CGS’s Phase I investigation was to provide a timely preliminary screening to identify those sedimentary basins having the greatest geologic potential for long‐term CO2 storage. Because of California’s geologic diversity and complexity, no systematic effort to individually map the many geologic formations with sequestration potential in the different basins was included in Phase I. Initially,
45
104 sedimentary basins around the State were screened for the presence of significant porous and permeable strata, seals, and sediment thickness sufficient for critical state carbon dioxide injection. Of the 104 basins, 27 were identified as having some geologic sequestration potential. The remaining 77 basins failed to meet at least one of the screening criteria. Using preliminary information from the WESTCARB Phase I study, initial resource estimates for saline formations in California’s 10 most promising basins were 75–300 Gigatons of CO2 (National Energy Technology Laboratory, 2007). These estimates were based on basin areas (>800 m deep), estimated average sand (isopach) thickness for the depth window 800 m to 3,050 m, estimated average porosity, total estimated pore volume, density of CO2 in the basins = 700 kg/m3, and an estimated storage efficiency (E) of 1% and 4%. Of this estimate, California’s Central Valley (Sacramento and San Joaquin basins) accounted for approximately 68% of the total, or about 51 to 205 Gigatons CO2. The southern Sacramento Basin is within the Central Valley area identified in Phase I and represents about 22.4% of the Central Valley area. Based on this percentage, the Phase I estimates would predict that the southern Sacramento Basin area would contain about 11.5 to 46 Gigatons of CO2 storage resources. In this study, the range for the total of the three formations is 3.5 to 14.1 Gigatons of CO2 storage resources. This represents a reduction of almost 70% from the Phase I estimate. While this comparison is not rigorous, it points out the benefit of using more detailed regional studies over large scale screening studies in estimating potential sequestration resources in geologically complex settings such as those in California. In this study approximately 6,200 well logs were used to map the three formations of interest in the southern Sacramento Basin, in Phase I approximately 200 well logs were used to evaluate gross sandstone thickness the same area. Although it is not possible to accurately estimate the amount by which the reserve estimates of other areas of the Central Valley, or other California basins, will change as more detailed analyses are performed, it is likely that the overall resource estimates will decrease. As stated at the beginning of this section, this is a CO2 storage resource assessment, and does not include any evaluation of economic or regulatory constraints. Future evaluation of economic or regulatory constraints may further reduce the amount of CO2 storage resource available.
46
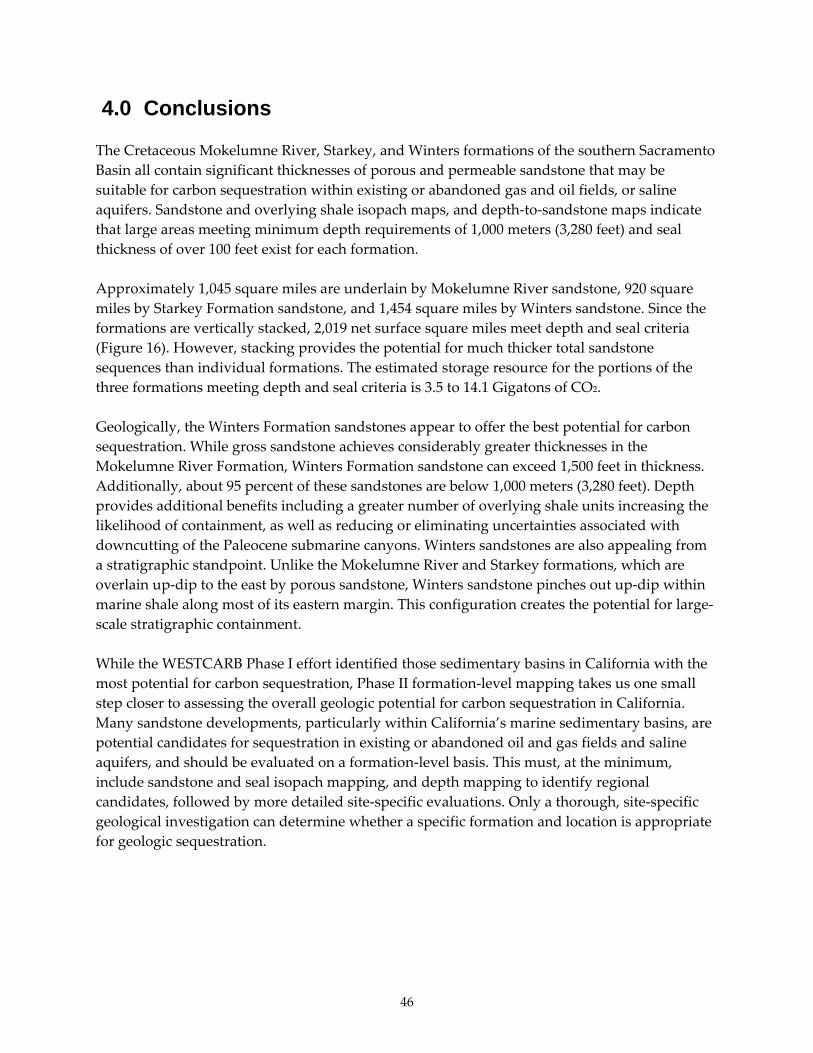
4.0 Conclusions The Cretaceous Mokelumne River, Starkey, and Winters formations of the southern Sacramento Basin all contain significant thicknesses of porous and permeable sandstone that may be suitable for carbon sequestration within existing or abandoned gas and oil fields, or saline aquifers. Sandstone and overlying shale isopach maps, and depth‐to‐sandstone maps indicate that large areas meeting minimum depth requirements of 1,000 meters (3,280 feet) and seal thickness of over 100 feet exist for each formation. Approximately 1,045 square miles are underlain by Mokelumne River sandstone, 920 square miles by Starkey Formation sandstone, and 1,454 square miles by Winters sandstone. Since the formations are vertically stacked, 2,019 net surface square miles meet depth and seal criteria (Figure 16). However, stacking provides the potential for much thicker total sandstone sequences than individual formations. The estimated storage resource for the portions of the three formations meeting depth and seal criteria is 3.5 to 14.1 Gigatons of CO2. Geologically, the Winters Formation sandstones appear to offer the best potential for carbon sequestration. While gross sandstone achieves considerably greater thicknesses in the Mokelumne River Formation, Winters Formation sandstone can exceed 1,500 feet in thickness. Additionally, about 95 percent of these sandstones are below 1,000 meters (3,280 feet). Depth provides additional benefits including a greater number of overlying shale units increasing the likelihood of containment, as well as reducing or eliminating uncertainties associated with downcutting of the Paleocene submarine canyons. Winters sandstones are also appealing from a stratigraphic standpoint. Unlike the Mokelumne River and Starkey formations, which are overlain up‐dip to the east by porous sandstone, Winters sandstone pinches out up‐dip within marine shale along most of its eastern margin. This configuration creates the potential for large‐scale stratigraphic containment. While the WESTCARB Phase I effort identified those sedimentary basins in California with the most potential for carbon sequestration, Phase II formation‐level mapping takes us one small step closer to assessing the overall geologic potential for carbon sequestration in California. Many sandstone developments, particularly within California’s marine sedimentary basins, are potential candidates for sequestration in existing or abandoned oil and gas fields and saline aquifers, and should be evaluated on a formation‐level basis. This must, at the minimum, include sandstone and seal isopach mapping, and depth mapping to identify regional candidates, followed by more detailed site‐specific evaluations. Only a thorough, site‐specific geological investigation can determine whether a specific formation and location is appropriate for geologic sequestration.
47
Figure 16: Total sandstone deeper than 1,000 meters and overlain by more than 100 feet of shale Source: California Geological Survey
48
5.0 References Brab, E.E., H.S. Sonneman, and J.R. Switzer, Jr. 1971. “Preliminary Geologic Map of the Mount
Diablo‐Byron Area, Contra Costa, Alameda, and San Joaquin Counties, California.” U.S. Geological Survey Basic Data Contribution 28 1971: 2 pl.
California Department of Conservation, Division of Oil and Gas (DOG). California Oil & Gas
Fields, Volume 3, Northern California. California Dept. of Conservation, Division of Oil and Gas, TR10, 1983.
California Department of Conservation, Division of Oil, Gas, and Geothermal Resources
(DOGGR). Annual Report of the State Oil & Gas Supervisor, California. California Dept. of Conservation, Division of Oil, Gas, and Geothermal Resources, publication PR06., 1983: 267 p.
Callaway, D.C. “Distribution of Uppermost Cretaceous Sands in the Sacramento‐Northern San
Joaquin Basins of California.” Selected Papers, San Joaquin Geological Society v. 2 1964: 4‐18. Clark, B.B., and A.O. Woodford. “The Geology and Paleontology of the Type Section of the
Meganos Formation of California.” California Univ. Pubs. Geol. Sci. v. 17, no. 3 1927. Hansen, J. Defusing the Global Warming Time Bomb. Scientific American 297: 5579 2004: 69‐77. Herzog, H. J., and D. Golomb. “Carbon Capture and Storage From Fossil Fuel Use.” Encyclopedia
of Energy. Ed. C. J. Cleveland. New York: Elsevier Science Inc, 2004: 277–287. Johnson, D.S. “Depositional environment of the Upper Cretaceous Mokelumne River
Formation, Sacramento Basin.” California. American Assoc. of Petroleum Geologists Bulletin 74: 5 1990: 686 p.
Magoon, L.B., and Z.C. Valin. “Sacramento Basin Province (009).” National assessment of United
States oil and gas resources ‐ results, methodology, and supporting data. Ed. D. L. Gautier, G.L. Dolton, K.I. Takahashi, and K.L.Varnes. U.S. Geological Survey Digital Data Series. CD‐ROM. 1995. DDS‐30, Release 2 .
Myer, L., and K. Birkinshaw. West Coast Regional Carbon Sequestration Partnership – Quarterly
Report. DOE contract no. DE‐FC26‐032NT41984. 2005: 32 p. National Energy Technology Laboratory. Carbon Sequestration Atlas of the United States and
Canada; Appendix A – Methodology for Development of Carbon Sequestration Capacity Estimates. 2008: 36p.
49
National Energy Technology Laboratory. Carbon Sequestration Atlas of the United States and Canada. 2007: 86p.
Pepper, M.W., and D.S. Johnson. “The Midland Fault System, Southern Sacramento Basin, California.” Structural Geology of the Sacramento Basin, American Association of Petroleum
Geologists, Pacific Section. Ed. V.B. Cherven, and W.F. Edmondson. 1992: 27‐40.
50
6.0 Glossary BCFG Billion cubic feet of gas CCS Carbon capture and Sequestration CGS California Geological Survey DOE U.S. Department of Energy DOG California Division of Oil and Gas DOGGR California Division of Oil, Gas, and Geothermal Resources GIS Geographic Information Systems Gm3 Giga (Billion) cubic meters Gt Gigaton (One Billion Metric Tons) md Millidarcies MMBO Million barrels of oil TCF Trillion cubic feet of gas WESTCARB West Coast Regional Carbon Sequestration Partnership

51
52
Appendix Regional Geology of the Mokelumne River, Starkey, and Winters Formations of the Southern Sacramento Basin Overview Like the neighboring San Joaquin Basin, the Sacramento Basin formed as part of a Cretaceous ‐ Paleogene forearc basin between the Sierra magmatic arc to the east and the Franciscan subduction complex to the west. The basin has received sediments almost continuously since the Late Jurassic. It contains, by some estimates, as much as 12,195 m (40,000 feet) of sedimentary rocks, collectively called the Great Valley Sequence (Magoon and Valin, 1995). These rocks consist of a thick sequence of marine slope and submarine fan facies and fringing prograding shelf, deltaic, and nonmarine deposits derived from the Sierra Nevada arc. On the eastern side of the basin the rocks are largely shallow marine and deltaic deposits whereas farther basinward, sediments are dominated by deep marine shale and basin plain turbidite deposits. Sands are mostly deltaic, including channel and point bar sands, stream mouth bars, delta front sands, shelf, slope, and deep marine turbidite deposits. Structure The Sacramento Basin comprises a northwest trending asymmetric structural trough with a westerly dipping basement surface ranging from surface exposures in the Sierra foothills to depths estimated to be greater than 40,000 feet (Magoon and Valen, 1995). The western flank is structurally complex; its dominant features being the westerly dipping Coast Range Thrust Fault, numerous associated faults, and steeply dipping beds. The structural history of the Sacramento Basin has had a dramatic impact on the structure and current distribution of Cretaceous sands in the Sacramento Valley. Three periods of large‐scale regional deformation are recognized (Callaway, 1964). Post‐Cretaceous/Pre‐Paleocene deformation involved uplift of the entire west side of the basin and the subsequent erosion and truncation of the Upper Cretaceous section. This is most evident in the pronounced angular unconformity that truncates the Mokelumne River, Starkey, and Winters formations on the west side of the basin. Renewed subsidence of the basin resulted in the deposition of overlying Paleocene sediments. At the end of the Paleocene, a second period of deformation occurred, during which the entire basin was uplifted to the north and northwest, resulting in the erosion and removal of most Paleocene and large amounts of Cretaceous sediments from the entire northern third of the Basin. This resulted in the angular conformity that defines the current northern limits of the Mokelumne River, Starkey, and Winters formations. Once again, renewed subsidence and transgression resulted in the deposition of the Eocene Capay Shale over progressively older Cretaceous rocks to the north.
53
Post‐Eocene/Pre‐Miocene uplift of the Stockton Arch resulted in the development of the Stockton Arch Fault zone, which includes a series of high‐angle reverse faults including the Stockton, French Camp, and Vernalis faults (Callaway, 1964). Extensive basin‐wide faulting occurred prior to deposition of the late Eocene to Oligocene with younger Miocene‐Pliocene nonmarine rocks truncating these faults (Magoon and Valin, 1995). The most prominent fault is the Midland Fault, the largest of numerous growth faults comprising the Midland Fault system, a complex of growth faults and normal faults which comprise the most prominent structural feature in the southern Sacramento Basin. The Midland Fault is a north‐northwest trending, steeply west‐dipping fault, extending approximately 55 miles from the flank of Mount Diablo in eastern Contra Costa County northward to its termination in the vicinity of the town of Dixon (Pepper and Johnson, 1992). Movement on the Midland Fault System occurred in three phases: 1) Late Cretaceous, 2) middle Paleocene, and (3) late Paleocene through Eocene. Syndepositional movement along the fault is demonstrated by abrupt basinward stratigraphic thickening, a rollover of beds into the faults, and a counter‐regional thickening of strata on the downthrown side of the faults. Average vertical throw of Cretaceous and Paleogene strata increases with depth. Movement along the faults ceased during the Oligocene, as the faults do not appear to offset Oligocene sediments within Markley submarine canyon, or younger sediments (Pepper and Johnson, 1992). Vertical separation of Cretaceous beds can exceed 2,500 feet near the town of Rio Vista. Submarine Canyons Erosion by several Paleogene (Paleocene, Eocene, and Oligocene) submarine canyons also played a large part in the current distribution and continuity of Upper Cretaceous and early Tertiary formations in the Sacramento Basin. The Markley, Martinez, and Meganos submarine canyons formed in response to the interplay of falling sea levels and tectonics (Fisher and Cherven, 1988). Erosion formed large submarine canyons that cut deeply into the marine floor sediments, including those of the Mokelumne River, Starkey, and Winters Formations. The resulting erosional troughs were subsequently filled with fine‐grained submarine fan deposits and transgressive deepwater shale in response to renewed rising sea levels. In terms of their impact on the distribution of Mokelumne River, Starkey, and Winters formations sandstones, the oldest Martinez submarine canyon (Late Paleocene) is the smallest and eroded only beds of the Mokelumne River Formation. It is best developed in an east ‐ west trend extending about 20 miles from Vacaville in Solano County to southern Sacramento County. Its width varies from about five to eight miles wide. The transgressive late Paleocene McCormick Sandstone was deposited on top of the Martinez submarine canyon fill and adjacent Mokelumne River formation allowing a depth‐to‐sand map to be prepared, but no sandstone isopach map was prepared within the submarine canyon limit.
54
The Late Paleocene/Early Eocene Meganos submarine canyon occurs in a northeast‐southwest arcuate trend and eroded beds of the Mokelumne River Formation for about 25 ‐ 30 miles from southern Sacramento County through northwestern San Joaquin County, then westward into Contra Costa County, where Meganos submarine canyon fill forms the primary trapping mechanism for the 9.3 MMBO Brentwood Oil Field before ultimately outcropping on the flanks of Mount Diablo (Clark and Woodford, 1927; Brab, et al, 1971). Along its trend the Meganos submarine canyon has, in places, removed nearly the entire Mokelumne River Formation. As is the case in all submarine canyons the depth of erosion can vary markedly over very short distances. Well logs in the vicinity of the Sacramento‐Contra County line suggest that as much as 1,400 ‐ 1,600 feet of Mokelumne River Sandstone has been removed. Fisher (1979) reported a minimum thickness of Meganos Submarine canyon fill of over 2200 feet southwest of Brentwood Oil Field. Of the three submarine canyons, the Eocene Markley Submarine canyon is the largest and deepest, cutting through the Mokelumne River, Starkey, and Winters formations and into the underlying Forbes Formation in Southern Sutter County and western Placer County. The submarine canyon is funnel shaped and open to the northeast. It trends north‐northeast to south‐ southwest, and cuts progressively older Cretaceous rocks to the northeast. At the Mokelumne River Formation level it extends from at least southeast Sutter and southwest Placer counties for at least 60 miles to just north of the town of Rio Vista where it has removed deposits of the Mokelumne River Formation, McCormick Sandstone, and earlier Martinez submarine canyon fill. Sofonov (1962) mapped a possible outcrop of Markley Submarine canyon fill as far north as T14N, R 5E, east of Marysville. Throughout this course it ranges from about 3 ‐ 9 miles wide. Just west of the Sacramento County ‐ Yolo County line, several prominent subordinate east‐west trending tributary canyons enter the main submarine canyon from the west causing localized east‐west disturbances in Mokelumne River sandstone distribution. Undoubtedly, more of the features exist but have not yet been identified in the subsurface. At the Starkey Formation level, the Markley submarine canyon extends about 50 mile from near the town of Wheatland in Yuba County to Millar Gas Field in eastern Solano County. It ranges in width from less than a mile wide at its southernmost expression to 7 or 8 miles at its widest observed point. Throughout an area of about 165 square miles, the entire Starkey Formation has been removed with the Markley Submarine canyon fill resting on Winters Formation sediments. Within the Winters Formation, down cutting by the Markley Submarine canyon appears to be restricted the upper Sawtooth Shale Member in an area upslope of Winters sand deposition. Hence, the Markley Submarine canyon had little if any affect on Winters Sandstone distribution.

55
Mokelumne River Formation The Mokelumne River Formation represents deposition of a fluvial‐deltaic sequence that was sourced by the proto‐Sierra Nevada terrain to the east, and prograded west‐southwestward into a forearc basin (Johnson, 1990). In its northern reaches, it contains interbedded sands and shales interpreted to be delta plain, distributary channel, natural levee, crevasse splay, and marsh deposits with associated lignites. Subaqueous delta plain deposits include the basal sand unit, locally named the Bunker Sand, which is thought to represent a prodelta distal bar (Johnson, 1990). The interbedded sandstones grade southward into series of thick sands generally designated the as the Second through Fourth Massive Sands that can achieve thicknesses of 1,000 feet. The Mokelumne River Formation is as shallow as 2,000 feet in northwestern Sacramento County and deepens to over 10,500 feet in south‐central Solano County. Sandstones range from thin stringers to sand bodies hundreds of feet thick, typically separated by thin shales, but total sandstone thickness can reach 2,500 feet thick. West of the Midland Fault, the unconformable top of the Cretaceous Mokelumne River sandstones are overlain by a thin section of Paleocene transgressive sandstone known as the McCormick Sand or First Massive Sand. East of the Midland Fault, contemporaneous deposits are locally known as the Midland Sand or Capitol Sand. Generally these sandstones range in thickness from a few feet to over 100 feet. Mokelumne River (and McCormick) sandstones are major gas reservoirs in the Sacramento Basin, having produced over 500 BCFG from 29 fields (Johnson, 1990). Important Mokelumne sandstone accumulations include the McDonald Island (184 BCFG) and East Brentwood (47 BCFG) fields. Mokelumne River sandstone pools in the Bunker and River Island fields have produced 91 BCFG and 42 BCFG, respectively. Trap types include updip fault truncations, stratigraphic traps, and unconformity traps sealed by intervening shales up to 100 feet thick and by overlying Martinez and Meganos submarine canyon fill mudstone. Starkey Formation Starkey Formation sandstones were deposited during slow regressive pulses, and are typically separated by thin transgressive marine shale units. In general individual regressive Starkey sand packages coarsen upward grading from silty sand at the base grading upward to coarser and cleaner sand at the top. The Starkey Formation sandstones originated as a series of aggrading deltaic and slope sand complexes that prograded southward and westward into the basin, overriding the more distal submarine fan complexes of the Winters Formation in the southern Sacramento Basin. Within the basin, the Starkey Formation consists of a sequence of stacked deltaic lobe complexes. The individual lobes often have localized names, with the Petersen Sand being the most extensive.
56
Others are S‐1, S‐2, S‐3, S‐4, S‐5, K‐1, and H&T sands. Sandstones are separated by shales that generally thicken basinward. The undifferentiated Starkey Formation deltaic complexes are more extensive than the marine fans of the Winters Formation. Starkey sandstones occur throughout much of the southern Sacramento Basin extending from southern Colusa and Sutter counties where they are truncated by a post‐Cretaceous angular unconformity, southward into the northern San Joaquin Basin. Sandstones generally thin westward and are locally absent. Depths range from less than 1,500 feet in southernmost Yuba County to more than 10,000 feet in southeastern Solano County. Individual sandstones range from a few feet to several hundred feet thick with aggregate thicknesses of over 1,500 feet. Starkey sandstones are important gas reservoirs in numerous fields with reservoir depths ranging from 2,250 feet in Catlett Field to 10,288 feet in Lindsey Slough Field. Reported gas production is frequently commingled with other reservoirs making production estimates unreliable. Starkey sandstones have produced over 39 BCFG in the Sycamore Slough Field and are responsible for a significant portion of the production in the Lindsey Slough (309 BCFG) and Millar (163 BCFG) fields. Winters Formation Winters sandstones are deep marine turbidite fan deposits. The Winters Formation consists of sand‐rich submarine fan, slope, and basin plain sediments that were delivered to the shelf edge by the prograding Starkey Formation deltaic complexes. Winters sand lobes were deposited at the foot of the slope and fed by slope feeder channels. Lateral migration of the prograding deltas resulted in the differing spatial distribution and stratigraphic position of the submarine fan lobes. Winters sandstones are best developed approximately 20 miles west‐southwest of Sacramento where total sand thickness can exceed 1,500 feet. Thick sandstone extends for about 100 miles, paralleling the basin axis. The Winters Formation and its contained sands thin to the north where it is completely truncated by angular unconformity in southern Sutter and Colusa counties and pinching out to the south in southern San Joaquin County. Laterally, the sandstones pinch out eastward into narrow feeder channel deposits incised into fine‐grained slope sediments, and thicken basinward into well‐developed anatomizing fans. Winters sandstones are overlain by the Sawtooth Shale, which provides a regional seal ranging from a few hundred to over 1,000 feet thick. Winters sandstones are important gas reservoirs in the southern Sacramento Basin. Producing depths range from 2,450 feet in Dunnigan Hills Field to 9,700 feet in Union Island Field, where Winters sandstones have produced 273 BCFG. Other Winters accumulations include the Bunker (92 BCFG), River Island (58 BCFG), Putah Sink (47 BCFG), Winters (41 BCFG), and Saxon (35

57
BCFG) fields. Most significant accumulations involve up‐dip normal fault displacement against impermeable shales.