Embed Size (px)
Citation preview

Preferential trading agreements
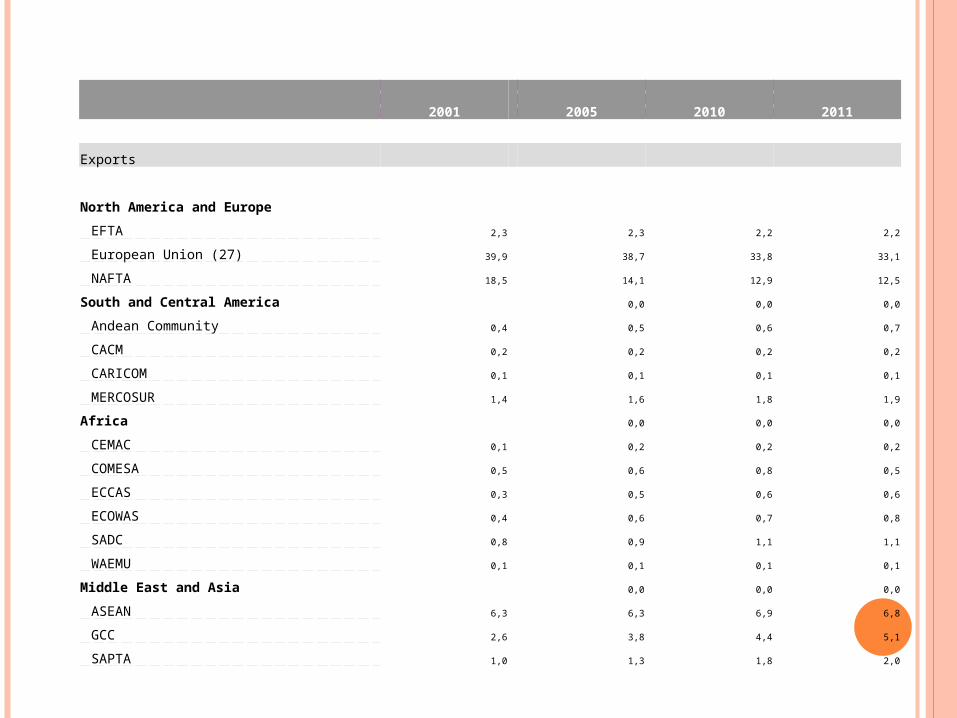
2001 2005 2010 2011
Exports
North America and Europe
EFTA 2,3 2,3 2,2 2,2
European Union (27) 39,9 38,7 33,8 33,1
NAFTA 18,5 14,1 12,9 12,5
South and Central America 0,0 0,0 0,0
Andean Community 0,4 0,5 0,6 0,7
CACM 0,2 0,2 0,2 0,2
CARICOM 0,1 0,1 0,1 0,1
MERCOSUR 1,4 1,6 1,8 1,9
Africa 0,0 0,0 0,0
CEMAC 0,1 0,2 0,2 0,2
COMESA 0,5 0,6 0,8 0,5
ECCAS 0,3 0,5 0,6 0,6
ECOWAS 0,4 0,6 0,7 0,8
SADC 0,8 0,9 1,1 1,1
WAEMU 0,1 0,1 0,1 0,1
Middle East and Asia 0,0 0,0 0,0
ASEAN 6,3 6,3 6,9 6,8
GCC 2,6 3,8 4,4 5,1
SAPTA 1,0 1,3 1,8 2,0
WHY DO COUNTRIES CHOOSE REGIONAL INTEGRATION?
EconomicsIntegration may be expected to generate substantial economic gains for members. Economic analysis looks at the balance of benefits and costs of integration.
Politics & International RelationsIntegration increases the international profile and negotiating power of smaller countries. Integration can also be a strategic form of defence co-operation through mutual dependence.
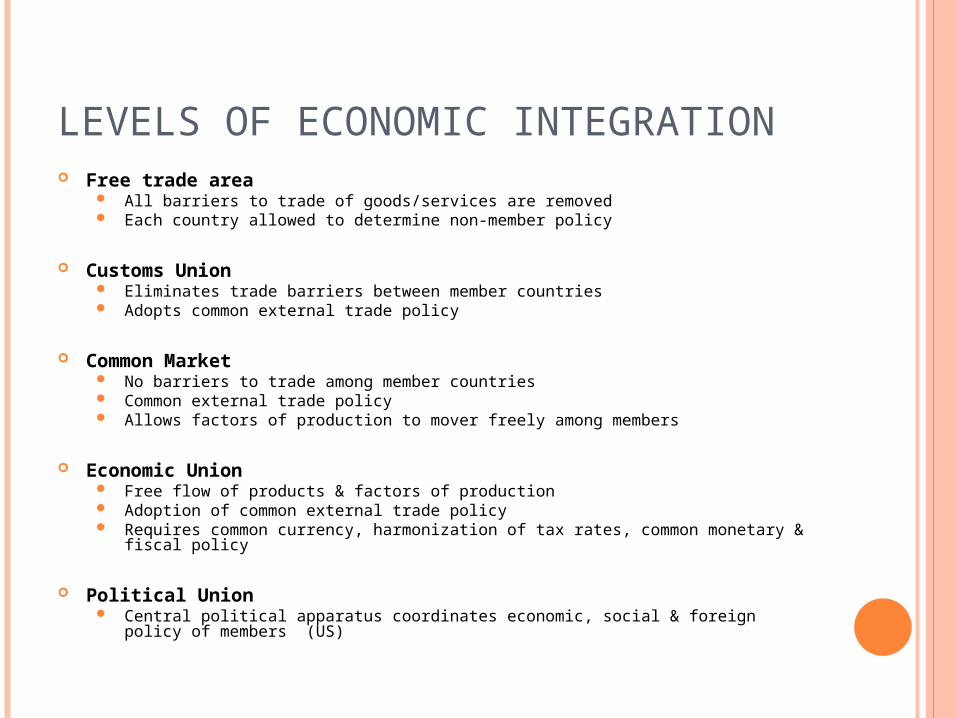
LEVELS OF ECONOMIC INTEGRATION Free trade area
All barriers to trade of goods/services are removed Each country allowed to determine non-member policy
Customs Union Eliminates trade barriers between member countries Adopts common external trade policy
Common Market No barriers to trade among member countries Common external trade policy Allows factors of production to mover freely among members
Economic Union Free flow of products & factors of production Adoption of common external trade policy Requires common currency, harmonization of tax rates, common monetary & fiscal
policy
Political Union Central political apparatus coordinates economic, social & foreign policy of members
(US)
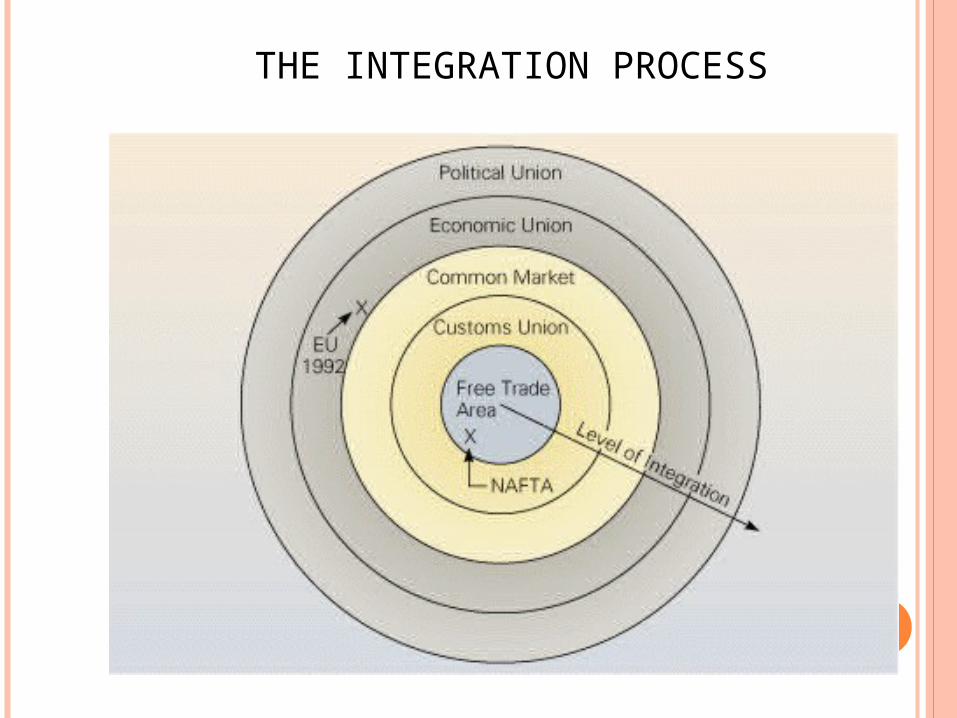
THE INTEGRATION PROCESS
REGIONAL ECONOMIC INTEGRATION: EUROPE
Examples of Integration European Economic Community (EEC) Enlargement of EEC (6 – 9 – 12 – 15 – 25 - 27) Single European Act—1992 European Union – single currency European Free Trade Agreement (EFTA)
REGIONAL ECONOMIC INTEGRATIONAMERICASNAFTA 1989 US & Canada – 1994 & Mexico
Remove tariffs on 99% of goods in 10 years Removal of barriers to cross-border flow of services Protection of intellectual property rights Removal of most restrictions on FDI Application of national environmental standards
(scientific basis) Establishment of 2 commissions
Monitor environmental standards & health/safety, minimum wage or child labor laws
Impose fines & remove trade privileges for violations
REGIONAL ECONOMIC INTEGRATIONAMERICASFor NAFTA
Opportunity to create an enlarged & efficient production base for region
Mexico would benefit from inwards FDI
US & Canada benefit increased Mexican incomes –
importing consumers benefit – lower prices Competitiveness of firms that move
production to Mexico
Against NAFTA
Mass exodus of jobs from US & Canada to Mexico
Mexico’s lower wage & less strict environmental laws
Impact Expose Mexico to more
competitive US & Canadian firms – ST - Economic restructuring & unemployment in Mexico
Trade grew by 109% Increase in productivity growth Increase in political stability in
Mexico

REGIONAL ECONOMIC INTEGRATIONAMERICASAndean Community 1969 & 1997 – Customs Union of Bolivia, Chile,
Ecuador, Colombia, Peru Internal tariff reduction, common external tariff,
transportation policy, common industrial policy Political (radical/socialist) & economic (hyperinflation,
unemployment & debt) problems
MERCOSUR 1988 – Brazil & Argentina; 1990 Paraguay & Uruguay Aim for free trade area then common market 200 million people Critics – trade diversion effects greater than trade
creation – fastest growing sectors most inefficient
REGIONAL ECONOMIC INTEGRATIONAMERICAS
Central American Common Market 1960’s – Costa Rica, El Salvador, Guatemala, Honduras &
Nicaragua Collapse 1969 – war after soccer game
CARICOM 1973 Caribbean Community Failure to meet 3rd deadline 1991
FTAA – Free Trade Area of the Americas Proposed at 1994 Summit of the Americas 2003 – 34 countries sign blueprint agreement Brazil & US disagreements prevent progress

REGIONAL ECONOMIC INTEGRATIONASEAN 1967 – Brunei, Cambodia, Indonesia, Laos, Malaysia, Myanmar,
Phillipines, Singapore, Thailand & Vietnam 500 million people & GDP $740 B Foster freer trade & cooperate in industrial policies
APEC Asia-Pacific Economic Cooperation 1990 -21 Members (US, Japan, China, Australia) > 50% GDP & 41% of world trade Increase multilateral cooperation in light of interdependence of
Pacific nations
Regional Trade Blocs in Africa 9 trade blocs on continent Hard to establish free trade areas because “are less developed &
diversified – need to be protected by tariff barriers from unfair competition”
Potential of EAC (Kenya, Uganda & Tanzania) – no free trade yet
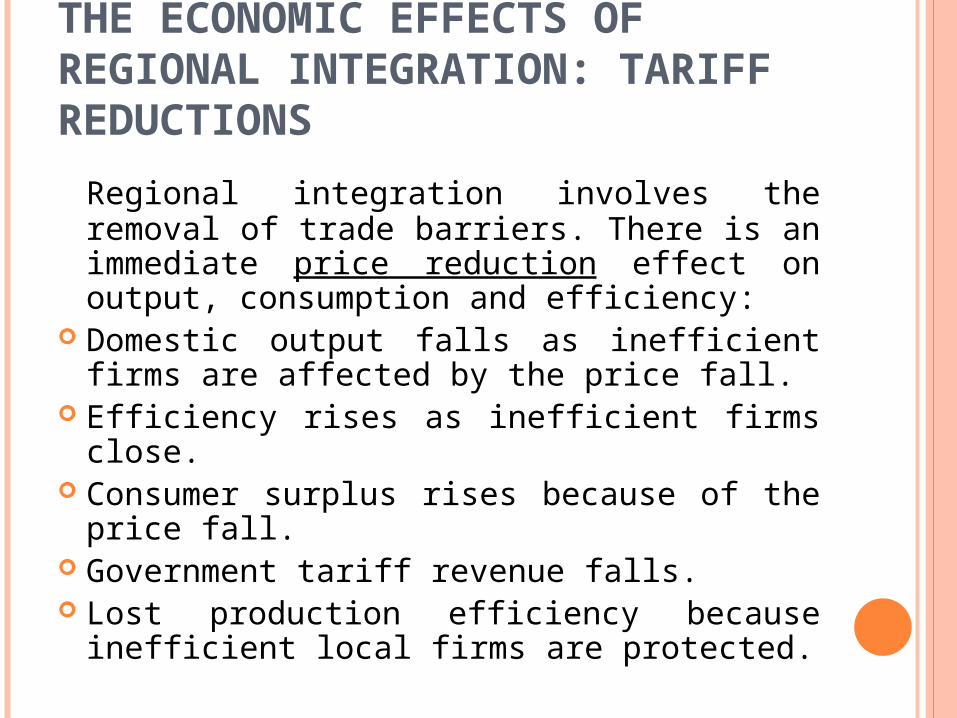
THE ECONOMIC EFFECTS OF REGIONAL INTEGRATION: TARIFF REDUCTIONS
Regional integration involves the removal of trade barriers. There is an immediate price reduction effect on output, consumption and efficiency:
Domestic output falls as inefficient firms are affected by the price fall.
Efficiency rises as inefficient firms close. Consumer surplus rises because of the price
fall. Government tariff revenue falls. Lost production efficiency because inefficient
local firms are protected.
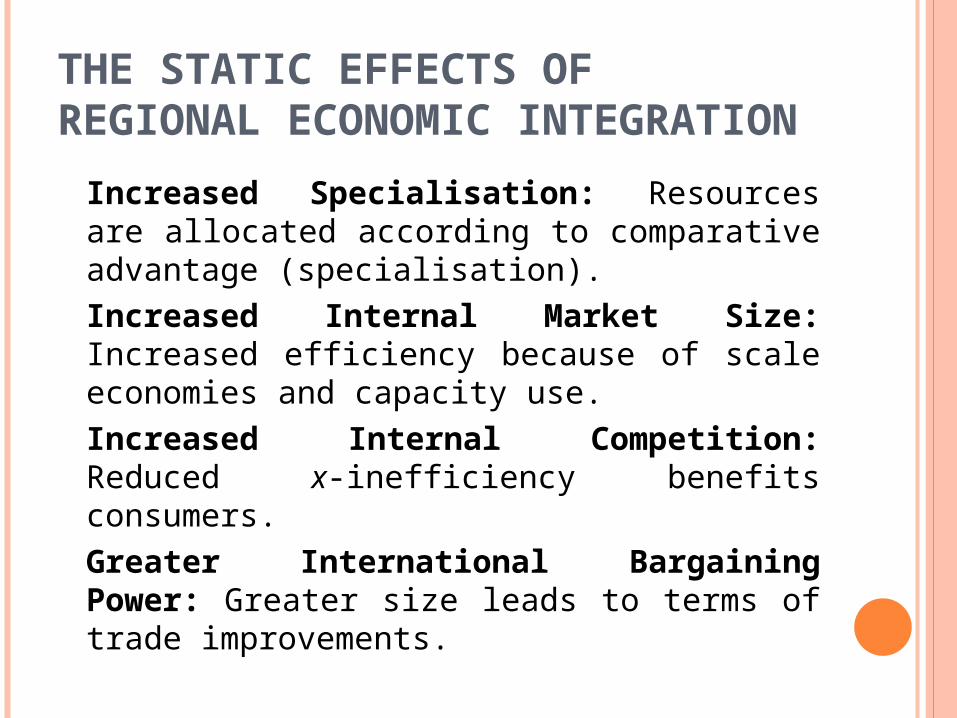
THE STATIC EFFECTS OF REGIONAL ECONOMIC INTEGRATION
Increased Specialisation: Resources are allocated according to comparative advantage (specialisation). Increased Internal Market Size: Increased efficiency because of scale economies and capacity use.Increased Internal Competition: Reduced x-inefficiency benefits consumers.Greater International Bargaining Power: Greater size leads to terms of trade improvements.
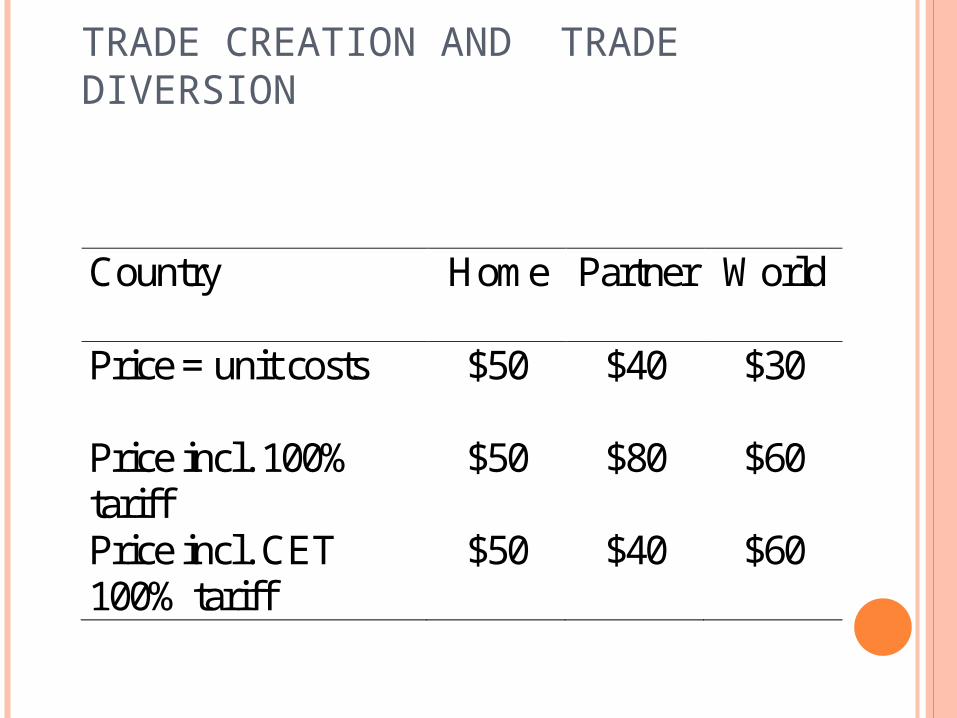
TRADE CREATION AND TRADE DIVERSION
Country Home Partner World
Price = unit costs $50 $40 $30
Price incl. 100% tariff
$50 $80 $60
Price incl. CET 100% tariff
$50 $40 $60
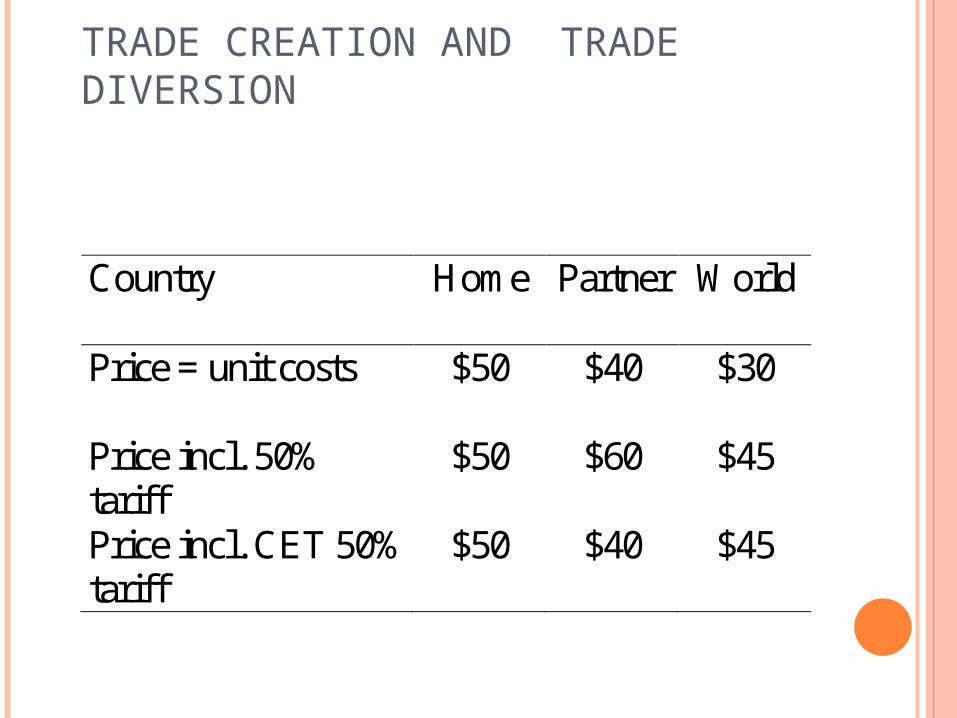
TRADE CREATION AND TRADE DIVERSION
Country Home Partner World
Price = unit costs $50 $40 $30
Price incl. 50% tariff
$50 $60 $45
Price incl. CET 50% tariff
$50 $40 $45

a) la struttura della produzione. Due Paesi possono essere complementari (avere cioè strutture economiche differenti, come nel caso di un Paese industriale e di uno agricolo) o competitivi, se hanno strutture economiche simili. b) la dimensione dell'UD. Più l’UD è ampia, e maggiore il numero di Paesi che la compongono, maggiore sarà la possibilità che gli effetti di creazione superino quelli di diversione, grazie alla più efficiente distribuzione delle specializzazioni inter settoriali.c) il livello delle tariffe. Quanto più alto era il livello delle tariffe prima dell'UD (e quindi quanto più elevate erano le inefficienze-prezzo da proteggere) e quanto più basso é il livello ex post della TEC, tanto minori sono le possibilità di diversione commerciale.
Condizioni che possono influenzare il risultato finale di una analisi di statica comparata
d) i costi di trasporto e di transazione. I costi di trasporto possono avere un effetto di ostacolo al commercio simile a quello delle tariffe: é questa una delle ragioni principali per la quale le UD si formano normalmente fra Paesi geograficamente contigui.
e) la flessibilità. La possibilità di sfruttare i vantaggi collegati alla riallocazione delle produzioni é ovviamente legata alla flessibilità dei mercati del fattori ed alla presenza di "rigidità" nella struttura di produzione.
Condizioni che possono influenzare il risultato finale di una analisi di statica comparata (segue)
STATIC WELFARE EFFECTSOther static effects of economic
integration i. Terms-of-trade effects:
Individually, the members of a customs union may be small relative to world markets
However, together they may become large, i.e. be able to influence their terms of trade
It may be optimal for the customs union to restrict trade with non-members by imposing a CET equal to the optimum tariff
STATIC WELFARE EFFECTS ii. Increased Internal Market Size: Increased efficiency
because of scale economies and capacity use. iii).Increased Internal Competition: Reduced x-
inefficiency benefits consumers. Iv.Pro-competitive effects:
If markets are imperfectly competitive, economic integration leads to a reduction in market power of each firm, leading to a reduction in average mark-ups
V. Product variety effects: If there are economies of scale (e.g. auto production),
economic integration allows consumers to buy different varieties (e.g. Renaults and BMWs)
GROWTH EFFECTS Economic integration may raise the incentives to
innovate, and therefore may improve the economic growth performance of members
Why? Integration leads to: Technological spillovers: regional integration might
promote the volume of spillovers between countries, either as a consequence of increased trade volumes or because of policies designed to encourage scientific interchange
Pro-competitive effect more incentives to innovate
Reduction of duplication in research more efficient allocation of resources in R&D activities
EFFECTS OF REGIONAL INTEGRATION
Foreign Direct Investment (FDI)The aggregate volume of FDI increases because:
Increased FDI by firms in other member states.
Non-member firms invest to take advantage of a larger, richer and more dynamic market.
Non-member firms fear increased protectionism and increase 'tariff jumping' FDI.
REGIONAL INTEGRATION &FDI CREATION The critical issue is the efficiency effects of
the impact of regional economic integration on FDI flows - whether it promotes or replaces trade - FDI ‘Creation’ and FDI ‘Diversion’.
FDI Creation, like Trade Creation, promotes economic efficiency by stimulating increased trade via greater specialisation, factor allocation and the international division of labour. Trade and FDI are complementary.
Applies to internal or external inflows of FDI. Includes initial rationalisation of existing
operations.
REGIONAL INTEGRATION & FDI DIVERSION
FDI Diversion, like Trade Diversion, reduces economic efficiency because FDI is a substitute for trade flows – i.e. ‘tariff-jumping’ FDI.
FDI Diversion relates only to FDI inflows from outside an integration area.
Need for consideration of the counterfactual: some FDI inflows would not occur without actual protection or the fear of protection.