Embed Size (px)
Citation preview

Predictive Models: Current and Future
November 9, 2011
Steve WickstromVice President, Research and [email protected]

2
OptumInsight Predictive Solutions: Overview
• OptumInsight is dedicated to delivering a comprehensive suite of quality predictive modeling tools to meet our customer needs
• Our longitudinal research data warehouse allows us to create a wide range of models• Access to over 50M individuals• Over 15 years of historical data available• Creation of prototypes simulating the customer experience
• Beyond our marketed capabilities we have the ability to create custom models or unique needs

3
Applications of Predictive Models
• Identify persons for inclusion in multi-disease case-management programs
• More effectively target single-disease management programs
• Identify persons who might benefit from educational/ self-care support
• Provide data on which to make financial decisions (e.g. budget allocations; demand forecasts)

4
Desired Properties of a Predictive Model
• Accuracy - maximize predictive accuracy
• Transparency - support users’ ability to validate and explain predictions
• Interoperability - integrate with other clinical and underwriting systems
• Flexibility - offer users options that best meet operational needs
• Industry Acceptance - evidence of its credibility in the marketplace

5
Predictive Model Essentials• Determination of what you want to predict
• Unplanned admits, readmissions, cost . . .•
• The sources of data must be identified• Traditional: Professional, Facility, Medications• Other: Social Care, Mental Health, Consumer, Functional Status . . .
• The quality of the data must be assessed• Completeness: Is all of the data there• Accuracy: Do the codes make sense
• Condition identification methodology• Method of identifying conditions across the ICD-9-CM – simplifying to a
reasonable number of meaningful conditions
• Methodological approach• Approach to building predictors, assessing the outcome and iterating
to an optimal solution

6
OptumInsight Solution Overview
• We have several types of models to meet a wide range of business applications
• Episode Risk Groups• Pharmacy Risk Groups• Rx Dx• Impact Pro• Natural History of Disease

7
OptumInsight Predictive Solutions: ERG
• Based on market leading episode methodology: ETG™
• Ten years: Initial release in 2001• Morbidity based – does not use service utilization in determination of risk• Risk markers are determined by the constellation of
observed ETG’s for each person• Leverages one year of service data
• Substantial improvement to the model in 2008 leveraging the ETG 7.0 risk adjustment methodology

8
OptumInsight Predictive Solutions: ERG
• Flexible models to meet customer data availability• MedRx MedRx, Med MedRx and Med Med
• Has a wide range of models that can meet diverse customer needs:• Prospective (12-0-12)• Retrospective• Actuarial/Underwriting (12-6-12)
• Risk weights are recalibrated every 2-3 years to account for changes in health care utilization and spending patterns

9
OptumInsight Predictive Solutions: PRG
• Based on retail pharmacy claims• Initial release in 2003• Leverages the Symmetry DCC pharmacy classification system• Risk markers are determined by the constellation of observed
DCC’s for each person• Leverages one year of service data
• Can run as a stand-alone or with ETG• Allows customers that promptly acquire pharmacy data “speedy” access to risk
10
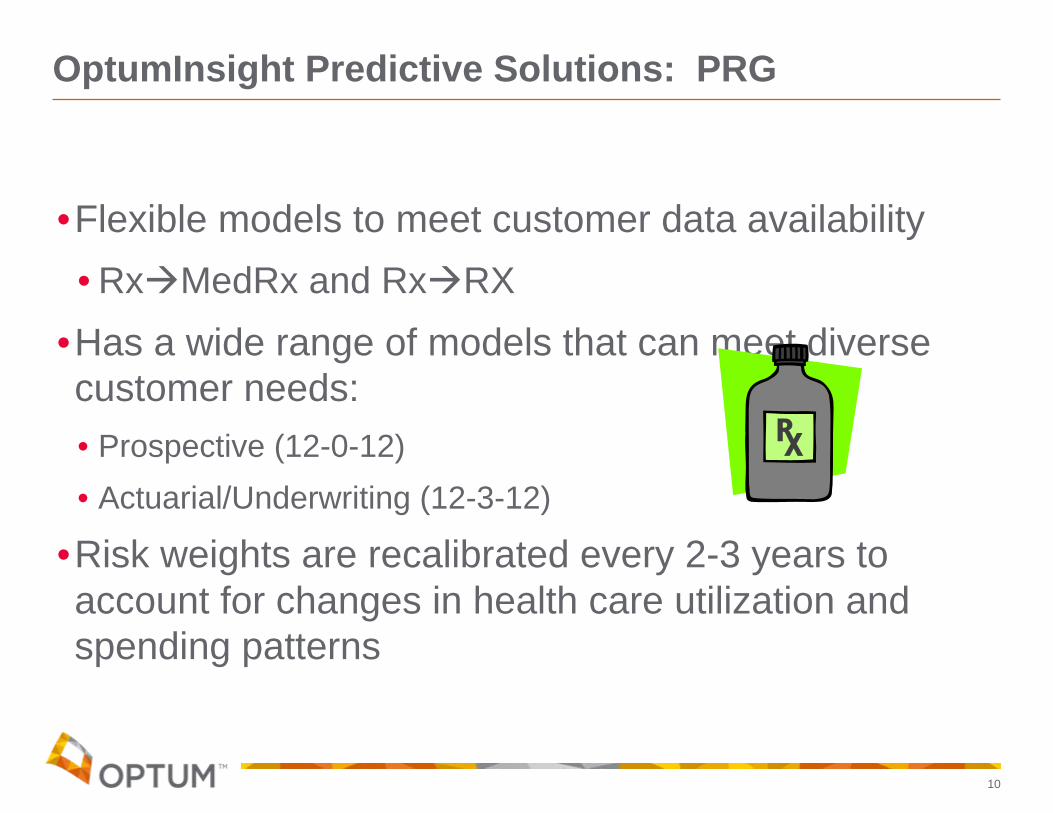
OptumInsight Predictive Solutions: PRG
• Flexible models to meet customer data availability• Rx MedRx and Rx RX
• Has a wide range of models that can meet diverse customer needs:• Prospective (12-0-12)• Actuarial/Underwriting (12-3-12)
• Risk weights are recalibrated every 2-3 years to account for changes in health care utilization and spending patterns

11
Rx Dx
Rx Dx uses prescribed drugs (along with age and gender) to assign the likelihood of an individual having one or more specific medical conditions
Generates probabilities at the individual/condition level
A probability assignment of 0.75 for hypertension suggests a 75% probability of that individual having a diagnosis of hypertension

12
ApproachDeveloped for conditions:
• Where an Rx Dx map could be constructed in a reliable and valid manner
• Where pharmaceutical agents are an important component of the treatment regimen
• With clinical & financial importance to potential users
Guided by empirical evidence and clinical expertise
Informed by the healthcare experience derived from a large population
Leverages Symmetry Drug Hierarchy - DCC

13© Ingenix, Inc. 13
Example: Multiple Sclerosis
Description DCC N MS %Mitoxantrone HCI 16403 249 56%
Interferon beta-1b 34600 1530 95%
Interferon Beta-1a 34601 4108 93%
Glatiramer Acetate 34602 3848 95%
Riluzole 34604 201 3%
Interferon Beta-1a (Rebif) 34605 1993 97%
Natalizumab 34606 133 99%
Hemiacidrin 41303 29 38%
Repository Corticotropin Injection 49601 44 43%

14© Ingenix, Inc. 14
How do you know if the model works?
Think of the model as a screening testDesirable features:
• Sensitivity: The ability of the model to identify most of all of the “cases”
• Positive Predictive Value : The degree to which the model indicates one has the condition, when they actually do have it
• There is a “balance” between Sensitivity and PPV• Negative Predictive Value: Ability for the model to “not identify” negative cases – (NPV)
The “best” models are those that have a large differentiation between presence and absence of a drug

15© Ingenix, Inc. 15
Example: Multiple Sclerosis
Multiple Sclerosis
Drug Y
Drug N
Yes No Total
10,277 (tp) 608 (fp) 10,885
8,421 (fn) 9,980,694 (tn) 9,989,115
Total 18,698 9,981,302 10,000,000
PPV (TP) 94.41% (10,277 / 10,885)
Se 54.96% (10,277 / 18,698)
False+ 608
False- 8,421

16© Ingenix, Inc. 16
Logistic Regression Results: Diabetes Type I
Neither Insulin or Supplies Insulin Only Supplies Only Both Insulin &
supplies
Age 47 47 47 47
Gender F F F F
Insulin No Yes No Yes
Supplies No No Yes Yes
Probability 1.8% 88.7% 64.9% 96.4%

17
Impact Pro Version 6

18
Impact Pro: Summary
• Uses ETG, pharmacy, utilization and laboratory results in assessment of risk of individuals
• Additionally provides a comprehensive clinical view• Mature solution: Initial release in 2001• Generates prospective risk assessment• Integrated into a full service solution:
• Processing Engine• Data Mart• Reporting System

19
Impact Pro: Model Summary
• Flexible models to meet customer data availability• MedRx MedRx, Med MedRx and Med Med
• Has a wide range of models that can meet diverse customer needs:• Care Management (12-0-12)
• Also leverages lab results if available
• Actuarial/Underwriting (12-6-12)• Type of Service• Likelihood of an Inpatient Event• Probability of exceeding cost thresholds

20
Business Applications for Impact Pro
Medical Management • Identify and manage the right patients, at the right time, with the right
intervention• Identify members at greatest risk for future healthcare problems• Understand key clinical drivers of risk – support steerage to appropriate
programs• Identify care opportunities – members with gaps in care, complications
and comorbidities
Underwriting• Set the right premium rate, attract and retain good business, promote
stability and profitability• Historically, underwriters have used experience and other factors
(age/gender, geographic and industry factors) to set healthcare premiums for individuals & groups
• Information on health risk for groups and individuals is used to enhance the underwriting process

21
Impact Pro – Patient-Centered Profile
Medications
Claims Data
Self-Entered
Biometric Data
Mem
ber-reported Data
Lab Data
System-reported D
ata
DataData Patient-centered ProfilePatient-centered Profile
Medical ServicesInpatient StaysMedicationsCare TeamSelf-Reported
Clinical IndicatorsCare OpportunitiesCase Definitions
Risk of future costs Risk of hospitalization
Members

22
Measuring Patient Risk
Four Steps to Prediction:
Demographics
Medical Claims
Rx Claims
Lab Results
Disease Prevalence,
SeverityEpisode and other groupings
to support disease identification and severity
Condition Based Risk
Markers
Grouping conditions into clinically homogeneous base
markers
Service-Based Risk Markers
High Acuity Events
Moderate/ Lower Risk Markers
Rx Markers
Translating Markers to
Predictive Risk
Apply weights measuring contribution of each Marker to Overall Risk
Member Clinical
Risk Profile
Array of markers for each member
Measures of Risk
Combine profile and risk results to complete Member Profile
Patient- centered Risk
Profile
Risk score for each model
Key drivers of risk
1. Inputs
4. Risk
2. Markers
3. Weights

23
Medical and Pharmacy claims
• diagnosis codes (ICD9-CM)• procedure codes (CPT, HCPCS)• pharmacy (NDC codes)
Demographics (age and gender)Clinical data- lab results
A 12-month “experience period” used for predictionSupports a range of input data scenarios
Step 1 – Data Inputs Used for Prediction

24
What is a Risk Marker?
• Characteristic that can be assigned to an individual and used to differentiate risk
• Goal: optimize use of data inputs to create markers that are:–Predictive–Provide clinical insights–“Multi-use” – for different model outcomes–Robust across populations and over time
Step 2 – Markers of Risk

25
How are ETGs used to create markers of risk?
• Identify unique clinical conditions• Identify levels of severity for a condition• Link services to conditions• Provide a context for key events and services
Some markers go beyond ETG contextResult is a clinical risk profile for each individual – the
individual markers that they trigger
Step 2 – Markers of Risk
26
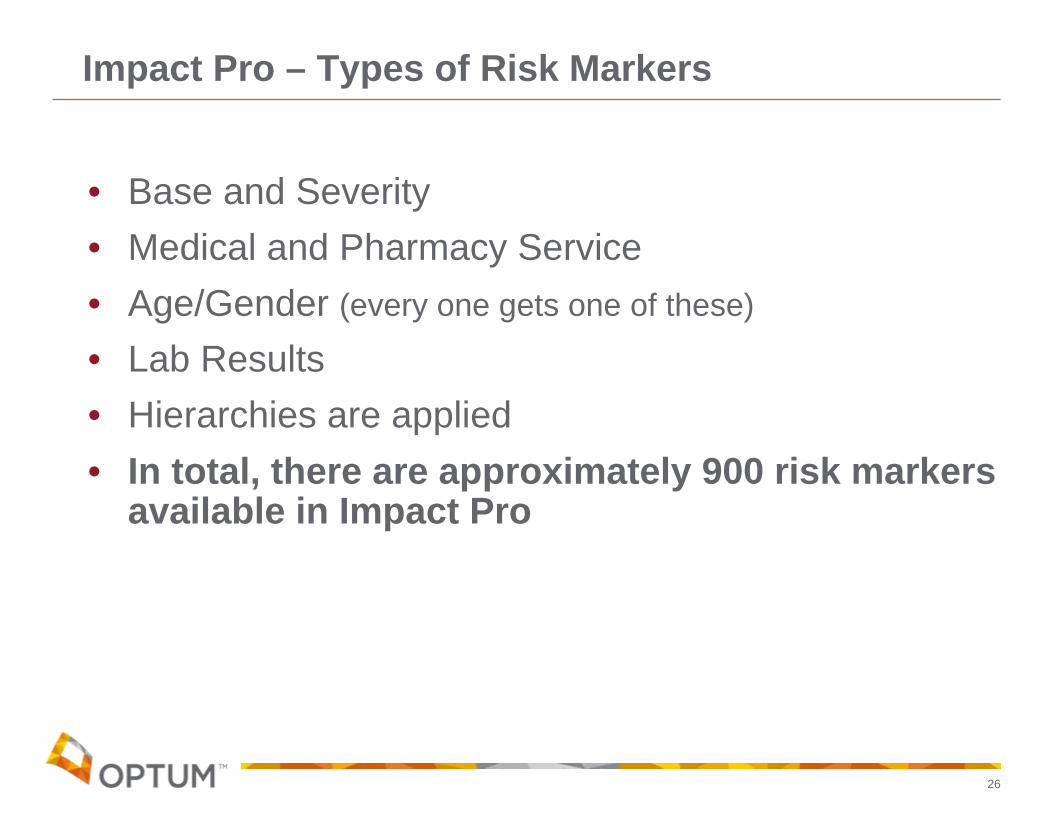
Impact Pro – Types of Risk Markers
• Base and Severity • Medical and Pharmacy Service• Age/Gender (every one gets one of these)
• Lab Results• Hierarchies are applied• In total, there are approximately 900 risk markers
available in Impact Pro

27
Impact Pro – Chronic Marker Families (examples)
All members identified with a condition receive the base marker (linked to episode triggering base)Some members receive added risk based on severity level of episode triggering the base markerSome members receive added risk based on acute and cluster service markers (hierarchical)Examples from Impact Pro – Version 6. CM 12-0-12 Future Risk Costs Model.
Impact Pro Marker Type Diabetes
IschemicHeart
DiseaseHeart
Failure
Asthma and
COPD
Base Marker 0.4538 0.6092 0.8239 0.1736
Added severity I 0.3517 0.1829 0.2214 0.1133
Added severity II 0.7361 0.479 0.3992
High episode clusters, recent 3 months 0.981 0.7711 1.4779 0.8124
High episode clusters, recent 12 months 0.7802 0.519 0.5236 0.7058
Moderate episode clusters, last 4-12 months 0.3443 0.1706 0.2176 0.2702
Emergency room visit, recent 3 months 0.724 0.3934 1.4796 0.1997
Acute care inpatient event, recent 3 months 2.5547 1.0414 3.301 1.5954
Acute care inpatient event, last 4-12 months 1.1661 0.7885 0.6185

28
Impact Pro – Lab Result Markers
• Lab results can be used to supplement claims-based markers of risk
• Types of lab markers• Presence of an extreme lab result, e.g.,
• Alanine aminotransferase, extreme high value, recent• Cancer-125 (tumor marker), high/extreme value, recent
• Trend in lab results, e.g.,• C-reactive protein, significant increase in result• Albumin, significant decrease in result

29
• “Risk Weights” – measure a marker’s incremental contribution to risk
• Estimated from large population (about 14M for V6)
• Statistical approach depends on model• Each marker has its own weight for each of the
models supported by Impact Pro
• Model outcome being predicted, data inputs and timing impact weight assigned to a marker
Step 3 – Translating Markers to Risk Measures

30
Step 4 – Predicting Risk
Member Markers of Risk Relative Risk Score
Predicted Annual Cost
Base Diabetes 0.4538 $ 1,851
Severity Diabetes, Added Severity II 0.7361 $ 3,003
Service Inpatient stay, diabetes within recent 3 months 2.5547 $ 10,423
Base Heart Failure 0.8239 $ 3,362
Severity Heart Failure, Added Severity I 0.2214 $ 903
Service High HF episode clusters, recent 3 months 1.4779 $ 6,030
Demographic Male, 55 – 64 0.6666 $ 2,720
6.9344 $28,292
Example from Impact Pro – Version 6. CM 12-012 Future Risk Costs Model.

31
Patient-centered profile – Clinical Profile
Each member’s Clinical Profile is based upon the latest evidence-based medicine and rules which you can tailor to specific populations
Demographics
Medical Claims
Rx Claims
Lab Results
Symmetry EBM Connect ®
Disease Prevalence Co-morbidities, Complications
ComplianceAssessment
Care Opportunity Assessment
Disease Prevalence, Co-Morbidities
Complication Utilization
Grouping of inputs to support disease identification (40+ Condition)
Analysis of compliance with Evidence Based and nationally recognized treatment guidelines
(e.g. NCQA, AQHC, NQF)
Identify departures from consensus-based clinical practice guidelines
Identify in detail clinical conditions, complications, co-morbidities, services, and significant utilization events
Patient-centered Clinical Profile

32
Predictive Modeling – Case ExampleDifferentiating Between Members
Patient A. Male, 52, Diabetic
Type 2 Diabetic, non-insulin dependent
Most recent HbA1c is 8.9; taken 2 months ago
Hospitalization 6 months ago for AMI
Multiple outpatient visits over last 12 months
Prior year’s cost $21,700
Patient B. Male, 60, Diabetic
Type 2 Diabetic, non-insulin dependent
Most recent HbA1c is 8.2; taken 9 months ago
Multiple outpatient visits over last 12 months
Prior year’s cost $25,400

33
Impact Pro Case Example Looking Deeper
Prior Cost $21,700 $25,400
Predicted Risk (Cost) 9.0 ($34,020) 4.0 ($15,120)
Predicted Risk (Inpatient) 29.2% in next 3 months 6.9% in next 3 months
Disease Prevalence Diabetes Diabetes
Co-morbidity and Complication Markers
Coronary Artery Disease (CAD)Hyperlipidemia (Rx-based) Hypertension
ManagementHospitalization – AMIOver 15 Outpatient Visits (Diabetes and CAD)
Over 15 Outpatient Visits – (Carpal Tunnel Syndrome)
EBM-compliance Not refilling Beta-blockers for CAD No eye exam for DiabetesNo recent HbA1c Test
Care Team Dr. Sugar – Diabetes ManagerNo Cardiac Care Manager
Dr. Pressure – Cardiac CareNo Primary Care Physician
Care AlertsPoor CAD/Diabetes ManagementNot Refilling Beta-blockersNo Cardiac Care Manager
Lack of Eye ExamLack of recent HBa1C TestNo Primary Care Physician
Intervention Program Diabetes, Level 4 (High) Diabetes, Level 2 (Medium)
Patient A Patient B

34
Impact Pro Performance

35
Impact Pro 6.0 – How Do we Compare to V5.0?
Care ManagementMed-Rx $250K
A/U Med-Rx $250K
We have observed a substantial increase in model performance
Impact Pro Performance: R-squared
26.0%22.9%
20.1%17.4%
0%
5%
10%
15%
20%
25%
30%
Version 6 Version 5 Version 6 Version 5

36
Impact Pro 6.0 has improved predictions for high risk patientsPositive Predictive Value (PPV)
Identification of High Risk Individuals
20%25%30%35%40%45%50%55%60%
Top 0.5% Top 1% Top 2% Top 5% Top 20% Top 25%
Risk Cutoff
Perc
ent C
orre
ctly
Iden
tifie
d
Version 6Version 5
Impact Pro 6.0 – How Do we Compare to V5.0?
Impact Pro 6.0 Care Management (12-0-12), Med+Rx Med+Rx, $250K

37
High Risk Individuals: Where did they go?
Another angle – for those we “miss” where do they end up?(Observed Cost Percentile – Selecting Patients in Top 0.5% based on Risk)
Distribution of Top 0.5%
20%30%40%50%60%70%80%90%
100%
Top 0.5% Top 1% Top 2% Top 5% Top 20% Top 25%
Observed Percentile
Perc
enta
ge
Version 6Version 5
Impact Pro 6.0 Care Management (12-0-12), Med+Rx Med+Rx, $250K

38© Ingenix, Inc. 38
Deployment Options
ASP/BPO• Client extracts data• Ingenix cleans and
warehouses data• Ingenix periodically processes
data through Impact Pro• Ingenix delivers data output
and business intelligence application to client (BPO)
• Ingenix hosts data and business intelligence application (ASP)
• Ingenix trains client on methodology, output, and production
Stand-alone Software• Ingenix delivers Impact
Pro processing and reporting application
• Supports industry standard technologies including SQL Server, Oracle, DB2, and Microsoft IIS
• Client extracts data and runs data periodically through Impact Pro
• Ingenix trains client on methodology, output, and production

39
• There is an increasing desire to expand the set of input data for improved predictions• Consumer data
• Income, education, spending patterns . . . • How to use?• Accuracy at the patient level is an issue . . .
• Health Risk Appraisals• Clinical data from the point of care
• Electronic medical record information such as BMI, blood pressure . . .• Integration with administrative data is crucial
• Not to mention compatibility with ICD-10-CM!
Where are we going next?

40
• Current efforts are focused on the collection clinical data
• Issues include standarized coding • Timing of data• Integration of clinical data with administrative data• Developing analytics that can be applied at the point of care
• Benchmarks• Predictive analytics• Quality of care
• Presenting in a way that can be easily interpreted by clinical team members
Where are we going next?

41
Developing CapabilityNatural History of Disease

42
Natural History of Disease: Overview
• Define a disease protocol• Find people who match the protocol• Gather all their medical history• Find control cohorts for each individual• Find their history• Compare clinical and financial attributes between
the two groups in every conceivable way• Do this in a minute or two…• This is being driven by the OptumInsight
Innovation Lab
42

43
“Big Data” Analysis (Today)
Mountains ofClaims Data
Average disk seek time for bigdata in “traditional” databases(1-p0)*t0 + (1-p0-p1)*t1*n ¤ 3
X =
You
Side note…
What would Google’s market capitalization be if its searches returned in days?
43

44
“Big Data” and NHD
• Massively parallel database (Netezza)• Optimized Data Storage structures• User Interface for mix and match attributes
• Medical Codes• Temporal requirements• Member demographics
• SQL based Real Time cohort matching• Signal Visualizations
44

45
Primary population anchor criteria
45
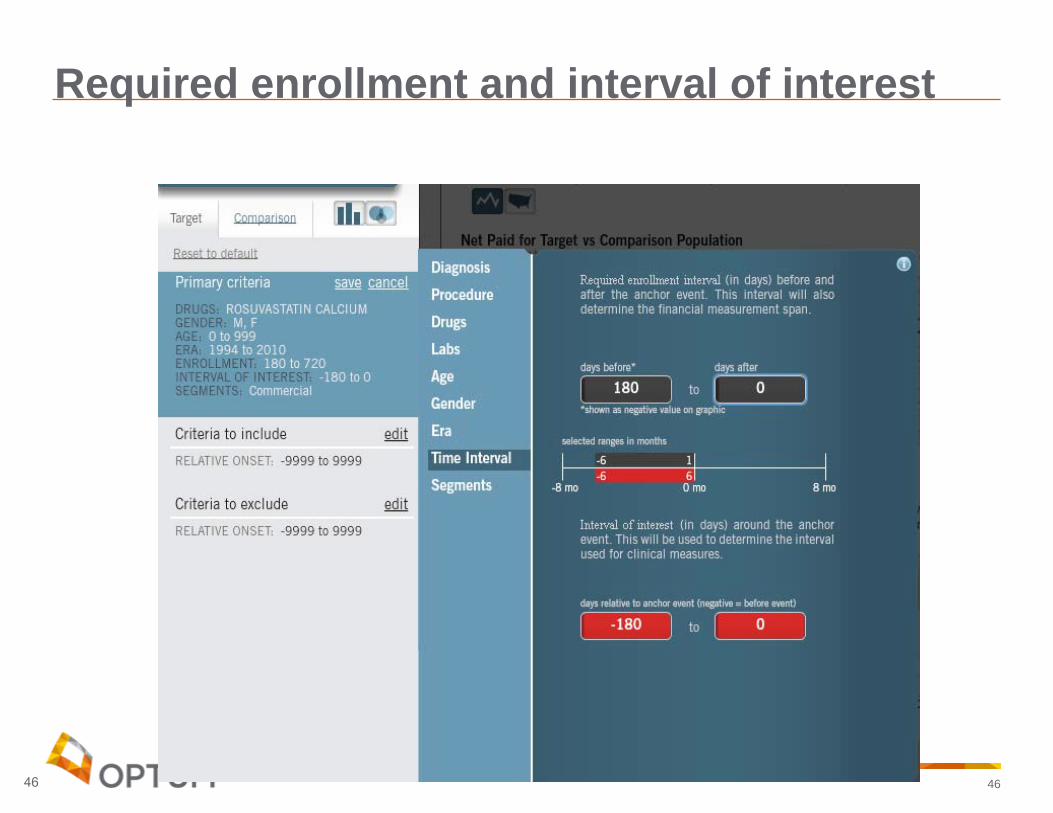
46
Required enrollment and interval of interest
46

47
Comparison requirement/anchor
47

48
Matched sets
48

49
Demographics
49

50
Now what?
• Drug analysis• Disease analysis• Lab analysis• Financial analysis
50

51
Financial comparison
51
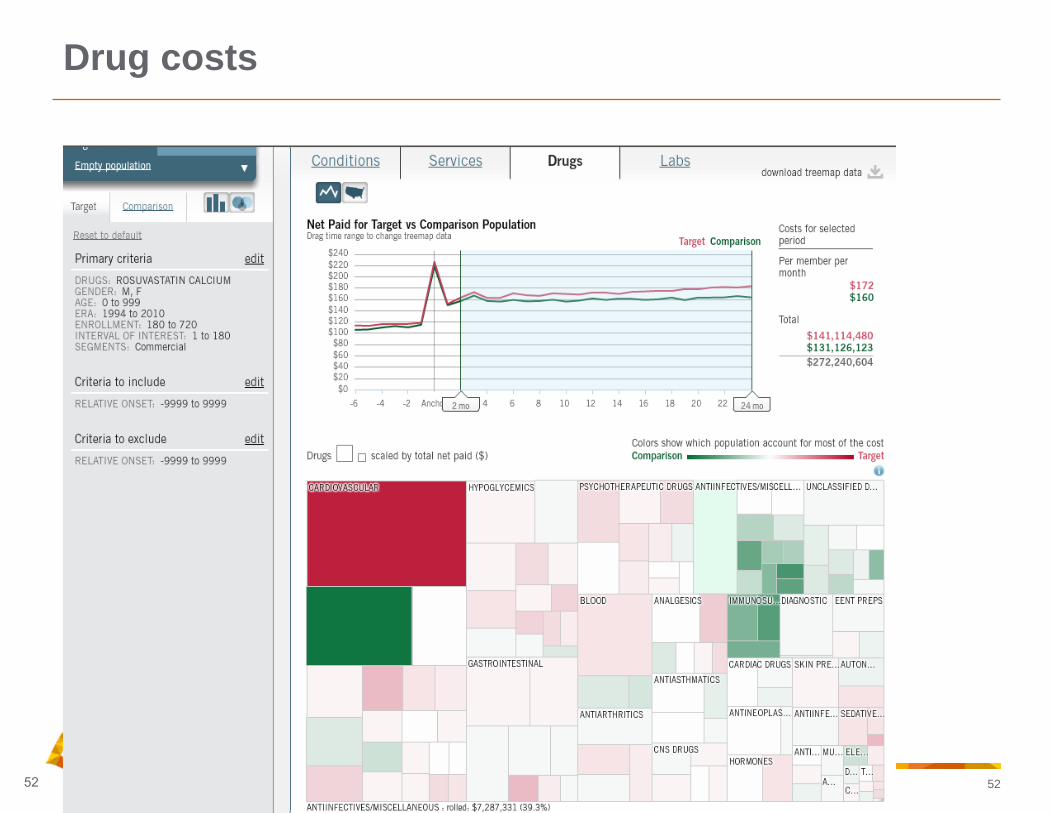
52
Drug costs
52

53
Questions

54
Impact Pro AppendixExample of clinical specificity

55
Value of Models: Impact Pro - Diabetes
Random selection of 2M individuals from our research data warehouse
Identification all individuals with diabetes and asthma/COPD using Impact Pro markers
Computed the prevalence of each markerStratification of risk• Details on the top 10% for diabetes and top 9% for asthma/COPD
Examination of the impact of markers

56
Chronic Condition Example: Diabetes - Markers
Impact Pro – Version 6. Care Management (12-0-12), MedRx MedRx Future Risk Costs Model.
Diabetes Marker Comments Weight
Base marker Diabetes ETG-severity level 1 0.4538
Added severity I Diabetes ETG-severity level 2, 3 0.3517
Added severity II Diabetes ETG-severity level 4 0.7361
High episode clusters, recent 3 months 5+ clusters 0.9810
High episode clusters, last 4-12 months 11+ clusters 0.7802
Moderate episode clusters, last 4-12 months 5-10 clusters 0.3443
Emergency room visit, recent 3 months 0.7240
Acute care inpatient event, recent 3 months 2.5547
Acute care inpatient event, last 4-12 months 1.1661
Diabetes, selected behavioral health agents Must have base marker 0.4689
Diabetes, selected cardiovascular agents Must have base marker 0.2950
Diabetes, diuretics agents Must have base marker 0.7155
Rx only, non-insulin No diabetes base marker 0.4655
Rx only, insulin No diabetes base marker 1.0478

57
Example: Diabetes
Marker Description N PrevAvg. Risk
P_02_01_000 Diabetes 80,487 4.02% 3.221
P_02_01_001 Diabetes, added severity I 13,042 0.65% 4.669
P_02_01_002 Diabetes, added severity II 4,607 0.23% 7.086
P_02_01_000_CLQ4L Diabetes, high episode clusters, recent 3 months 1,797 0.09% 8.078
P_02_01_000_CLSTH Diabetes, high episode clusters, last 4-12 months 1,548 0.08% 8.959
P_02_01_000_CLSTL Diabetes, mod. episode clusters, last 4-12 months 11,832 0.59% 4.731
P_02_01_000_E03 Diabetes, ER visit, recent 3 months 523 0.03% 4.984
P_02_01_000_I03 Diabetes, acute care inpt event, recent 3 months 308 0.02% 11.242
P_02_01_000_I12 Diabetes, acute care inpt event, last 4-12 months 760 0.04% 7.893
P_02_01_DBH_01 Diabetes, selected behavioral health agents 7,596 0.38% 4.157
P_02_01_DCV_01 Diabetes, selected cardiovascular agents 23,724 1.19% 3.476
P_02_01_DDI_01 Diabetes, diuretics agents 99 0.00% 4.916
P_02_13_000 Diabetes, Rx treatment-only, non-insulin 6,634 0.33% 2.185
P_02_14_000 Diabetes, Rx treatment-only, insulin 730 0.04% 3.138

58
Example: Diabetes – Top 10%
Marker Description N Pct-1 Pct-2
P_02_01_000 Diabetes 8,002 100% 9.9%
P_02_01_001 Diabetes, added severity I 4,283 53.5% 32.8%
P_02_01_002 Diabetes, added severity II 2,824 35.3% 61%
P_02_01_000_CLQ4L Diabetes, high episode clusters, recent 3 months 1,797 18.5% 82.4%
P_02_01_000_CLSTH Diabetes, high episode clusters, last 4-12 months 1,548 15.8% 81.6%
P_02_01_000_CLSTL Diabetes, mod. episode clusters, last 4-12 months 4,609 57.6% 39.0%
P_02_01_000_E03 Diabetes, ER visit, recent 3 months 151 1.9% 28.9%
P_02_01_000_I03 Diabetes, acute care Inpt event, recent 3 months 307 3.8% 99.7%
P_02_01_000_I12 Diabetes, acute care Inpt event, last 4-12 months 599 7.5% 78.8%
P_02_01_DBH_01 Diabetes, selected behavioral health agents 1,190 14.9% 15.7%
P_02_01_DCV_01 Diabetes, selected cardiovascular agents 3,071 38.4% 12.9%
P_02_01_DDI_01 Diabetes, diuretics agents 17 0.2% 17.2%
N: Number of individuals in top 10% of diabetics with this markerPct-1: Percent of top 10% of diabetics with this markerPct-2: For marker, the percent triggered in top 10%(e.g. 4,282/13,402 = 32.8%)

59
Value of Models: Summary
Nearly 90% of the individual in the top 10% has severity level I or II markers triggered
Severity level I triggered:• 53.5% of the top 10% had this marker triggered• 32.8% of the individuals with severity I triggered were in the top 10%
Severity level II triggered:• 35.3% of the top 10% had this marker triggered• 61.0% of the individuals with severity I triggered were in the top 10%

60
Value of Models: Summary
82% of the individuals with a high number of diabetes clusters in the last 3 months were in the top 10%
82% of the individuals with a high number of diabetes clusters in the first 9 months were in the top 10%
Nearly all of the individuals with an Inpatient event in the last 3 months were in the top 10%
79% of the individuals with an Inpatient event in the first 9 months were in the top 10%