Embed Size (px)
Citation preview
www.pawcon.com
SURVEY RESULTS:
Predictive Analytics Business Applications
Executive Summary and Analysis
The first annual Predictive Analytics Business Applications survey was open for four weeks beginning early
January, 2009. The survey was promoted via the Predictive Analytics World web site and several blogs on
predictive analytics and business intelligence. It was open to all members of the community, including
vendors, consultants and companies, whether actively employing predictive analytics or not. In total, there
were 94 valid responses to the survey.
The first section below covers companies that do not provide predictive analytics software or services – i.e.,
the current and future users/consumers of the technology – as their responses hold the most insight for the
future of our industry. 47 such corporate, non-profit or government organizations responded to the survey. Of
these, a little over half (51.5%) have never deployed predictive analytics. However, the vast majority - all but
15.2% - have plans to do so within the next five years, with, again, 51.5% planning to do so very soon: in the
next six months. The top three reasons for doing so are to obtain strategic insights (75%), achieve decision
support (57.1%) and enact decision automation (46.4%). 90.1% of respondents who have deployed predictive
analytics attained a positive ROI from their most successful initiative. All in all, the survey results promise
strong growth for the predictive analytics industry.
Predictive analytics vendors and consultants comprised 47 of the survey respondents (coincidentally the same
count). The second section below illuminates what those respondents are focusing on.
Current Users and Future Consumers of Predictive Analytics Technology
Total number of respondents from corporate, non-profit or government: 47

www.pawcon.com
Academic
Consumer Goods
E-commerce
Financial Services and Banking
GovernmentHealthcare
InsuranceManufacturing
Non-Profit
Pharmaceutical
Technology
Telecom
Travel
Other
Industry
North America
Asia
Europe
Rest of the Word
Company Size:
Less than 50 employees 21.3%
www.pawcon.com
50-100 employees 2.1%
100-200 employees 6.4%
200-1,000 employees 10.6%
1,000-5,000 employees 17%
5,000 or greater employees 42.6%
For how long has your organization employed predictive analytics?
Never 51.5%
For less than a year 15.2%
For 1-3 years 21.2%
For 4-6 years 6.1%
For 7 or more years 6.1%
When does your organization plan the next new deployment of predictive analytics, whether or not it will be
your first deployment of predictive analytics?
In the next 6 months 51.5%
In the next 7-12 months 18.2%
In the next 1-2 years 9.1%
In the next 3-5 years 6.1%
No plans to deploy predictive analytics 15.2%
Regarding your existing or planned predictive analytics initiatives, please check off all that apply:
Applied to B-2-B 35.7%
Applied to B-2-C 28.6%
Applied in order to enact decision automation 46.4%
Applied in order to achieve decision support 57.1%
Applied in order to obtain strategic insights 75%
Applied offline, for direct marketing/non-Internet 35.7%
Applied online, for web or email 39.3%
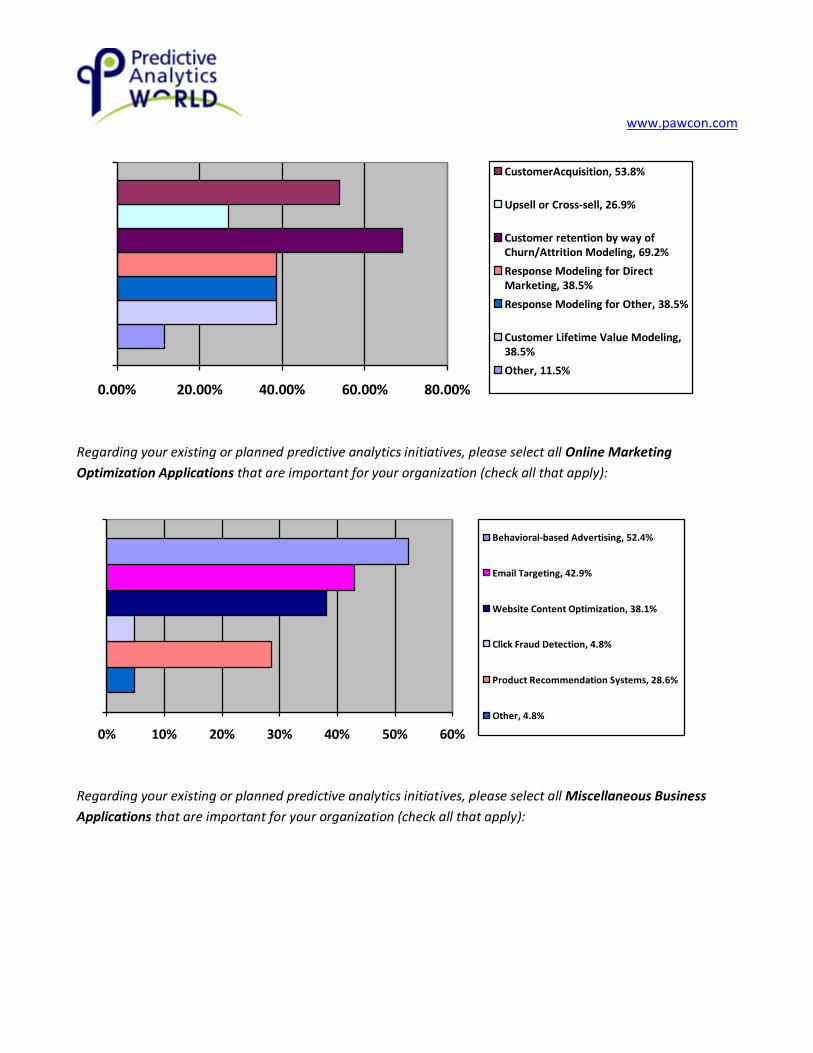
Regarding your existing or planned predictive analytics initiatives, please select all Marketing and CRM (both
offline and online) Applications that are important for your organization (check all that apply):
www.pawcon.com
0.00% 20.00% 40.00% 60.00% 80.00%
CustomerAcquisition, 53.8%
Upsell or Cross-sell, 26.9%
Customer retention by way ofChurn/Attrition Modeling, 69.2%
Response Modeling for DirectMarketing, 38.5%
Response Modeling for Other, 38.5%
Customer Lifetime Value Modeling,38.5%
Other, 11.5%
Regarding your existing or planned predictive analytics initiatives, please select all Online Marketing
Optimization Applications that are important for your organization (check all that apply):
0% 10% 20% 30% 40% 50% 60%
Behavioral-based Advertising, 52.4%
Email Targeting, 42.9%
Website Content Optimization, 38.1%
Click Fraud Detection, 4.8%
Product Recommendation Systems, 28.6%
Other, 4.8%
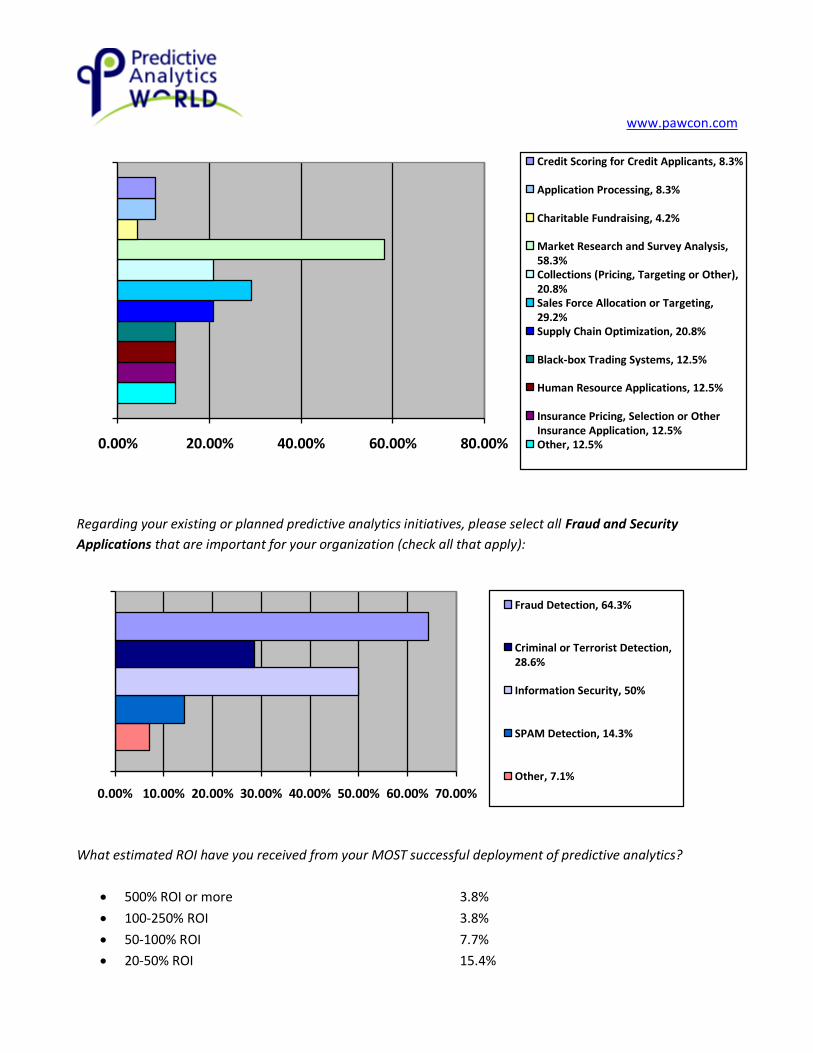
Regarding your existing or planned predictive analytics initiatives, please select all Miscellaneous Business
Applications that are important for your organization (check all that apply):
www.pawcon.com
0.00% 20.00% 40.00% 60.00% 80.00%
Credit Scoring for Credit Applicants, 8.3%
Application Processing, 8.3%
Charitable Fundraising, 4.2%
Market Research and Survey Analysis,58.3%Collections (Pricing, Targeting or Other),20.8%Sales Force Allocation or Targeting,29.2%Supply Chain Optimization, 20.8%
Black-box Trading Systems, 12.5%
Human Resource Applications, 12.5%
Insurance Pricing, Selection or OtherInsurance Application, 12.5%Other, 12.5%
Regarding your existing or planned predictive analytics initiatives, please select all Fraud and Security
Applications that are important for your organization (check all that apply):
0.00% 10.00% 20.00% 30.00% 40.00% 50.00% 60.00% 70.00%
Fraud Detection, 64.3%
Criminal or Terrorist Detection,28.6%
Information Security, 50%
SPAM Detection, 14.3%
Other, 7.1%
What estimated ROI have you received from your MOST successful deployment of predictive analytics?
500% ROI or more 3.8%
100-250% ROI 3.8%
50-100% ROI 7.7%
20-50% ROI 15.4%
www.pawcon.com
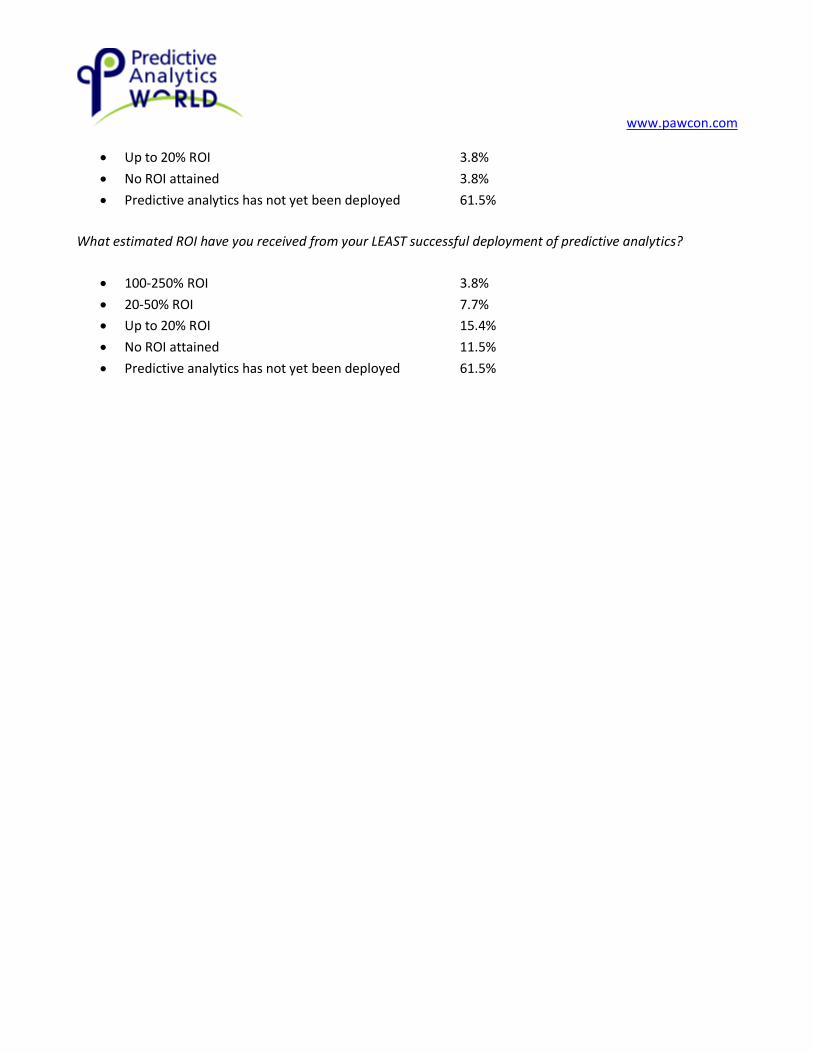
Up to 20% ROI 3.8%
No ROI attained 3.8%
Predictive analytics has not yet been deployed 61.5%
What estimated ROI have you received from your LEAST successful deployment of predictive analytics?
100-250% ROI 3.8%
20-50% ROI 7.7%
Up to 20% ROI 15.4%
No ROI attained 11.5%
Predictive analytics has not yet been deployed 61.5%
www.pawcon.com
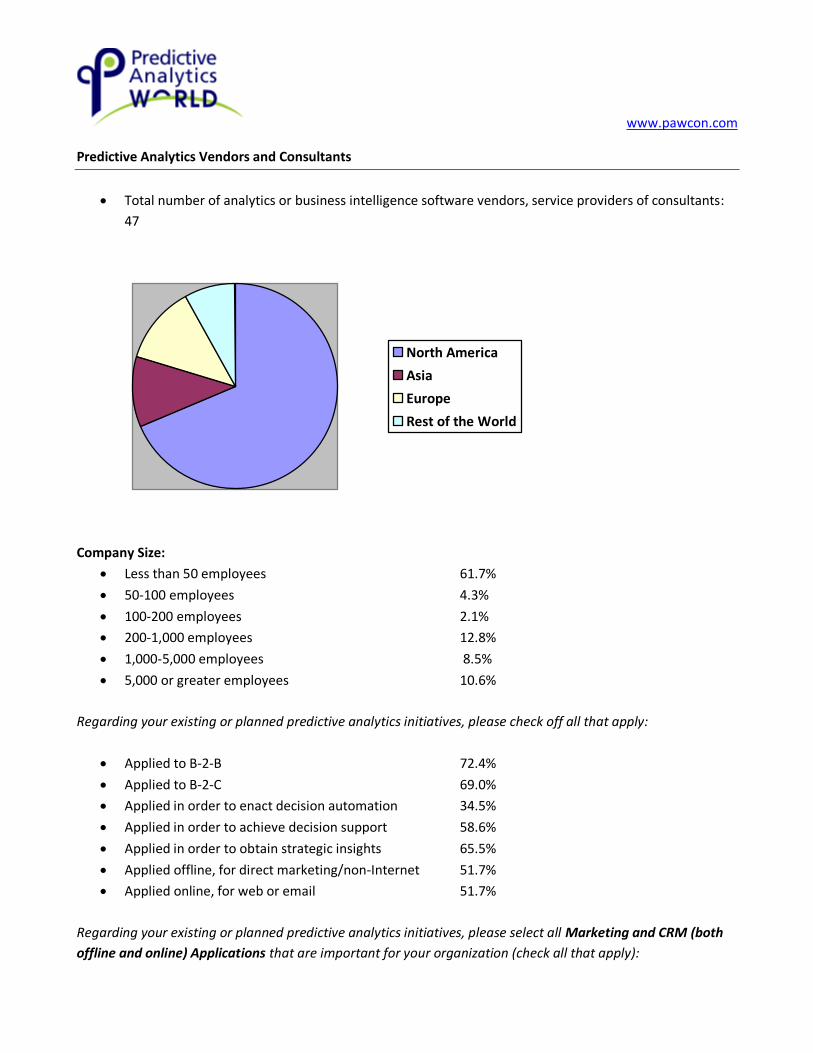
Predictive Analytics Vendors and Consultants
Total number of analytics or business intelligence software vendors, service providers of consultants:
47
North America
Asia
Europe
Rest of the World
Company Size:
Less than 50 employees 61.7%
50-100 employees 4.3%
100-200 employees 2.1%
200-1,000 employees 12.8%
1,000-5,000 employees 8.5%
5,000 or greater employees 10.6%
Regarding your existing or planned predictive analytics initiatives, please check off all that apply:
Applied to B-2-B 72.4%
Applied to B-2-C 69.0%
Applied in order to enact decision automation 34.5%
Applied in order to achieve decision support 58.6%
Applied in order to obtain strategic insights 65.5%
Applied offline, for direct marketing/non-Internet 51.7%
Applied online, for web or email 51.7%
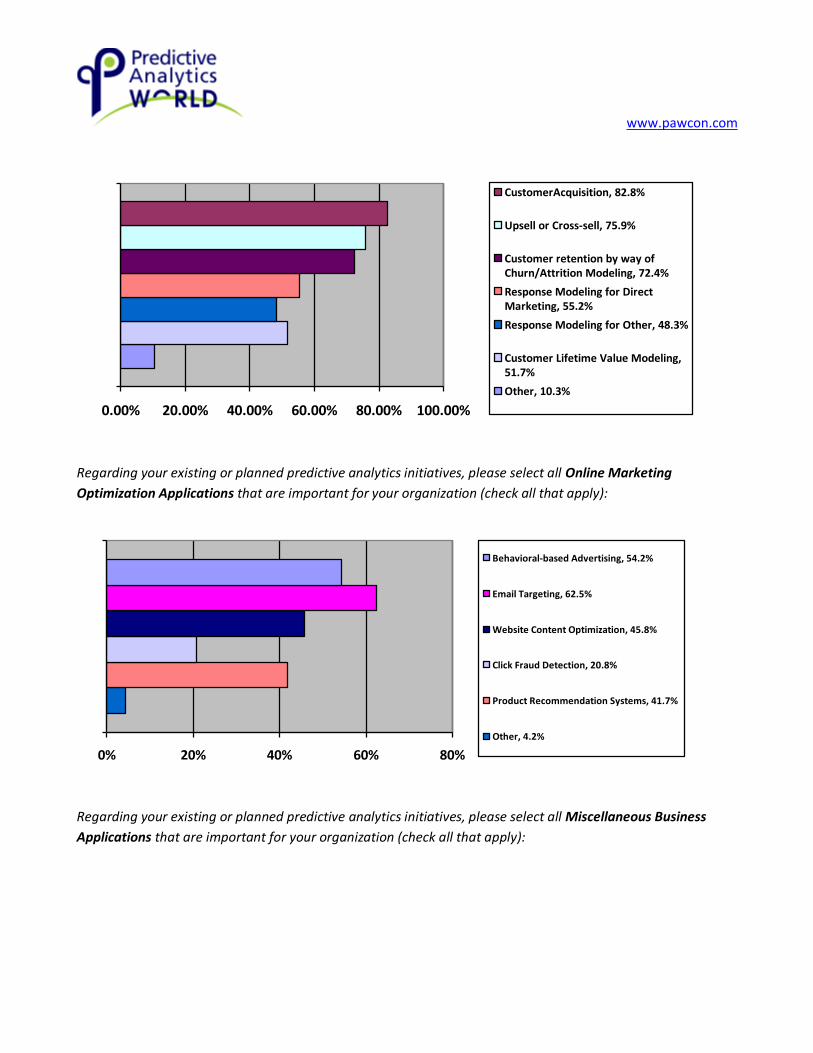
Regarding your existing or planned predictive analytics initiatives, please select all Marketing and CRM (both
offline and online) Applications that are important for your organization (check all that apply):
www.pawcon.com
0.00% 20.00% 40.00% 60.00% 80.00% 100.00%
CustomerAcquisition, 82.8%
Upsell or Cross-sell, 75.9%
Customer retention by way ofChurn/Attrition Modeling, 72.4%
Response Modeling for DirectMarketing, 55.2%
Response Modeling for Other, 48.3%
Customer Lifetime Value Modeling,51.7%
Other, 10.3%
Regarding your existing or planned predictive analytics initiatives, please select all Online Marketing
Optimization Applications that are important for your organization (check all that apply):
0% 20% 40% 60% 80%
Behavioral-based Advertising, 54.2%
Email Targeting, 62.5%
Website Content Optimization, 45.8%
Click Fraud Detection, 20.8%
Product Recommendation Systems, 41.7%
Other, 4.2%
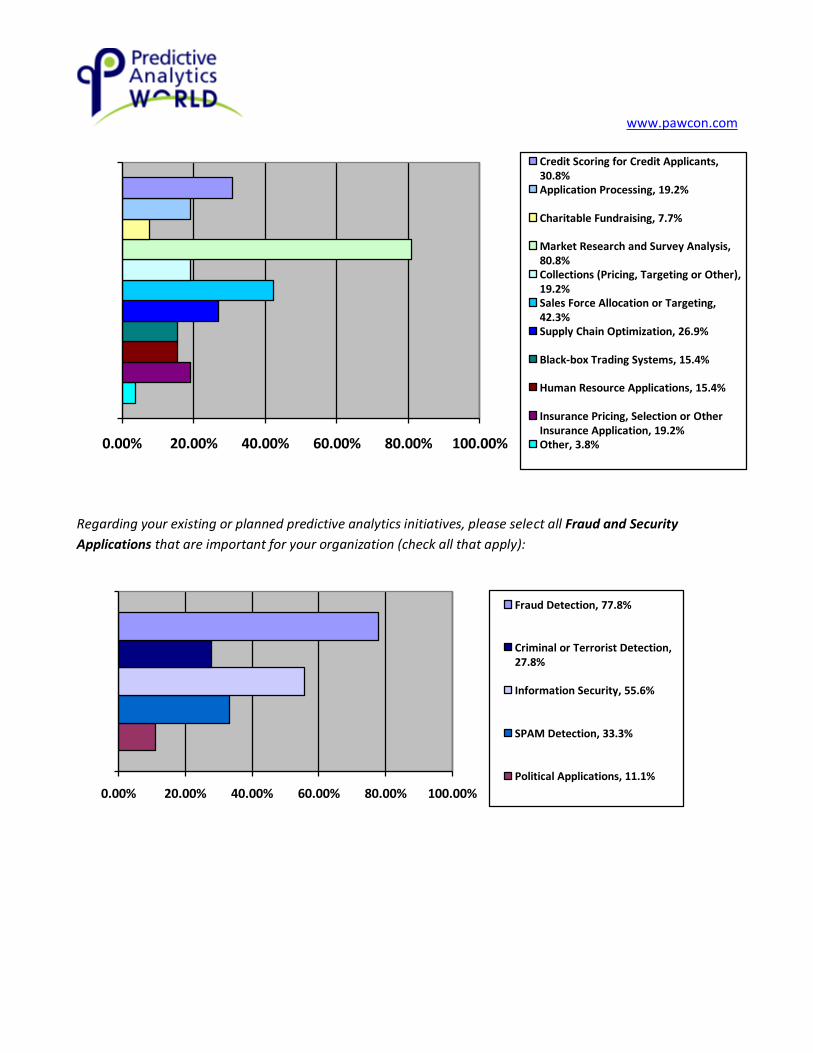
Regarding your existing or planned predictive analytics initiatives, please select all Miscellaneous Business
Applications that are important for your organization (check all that apply):
www.pawcon.com
0.00% 20.00% 40.00% 60.00% 80.00% 100.00%
Credit Scoring for Credit Applicants,30.8%Application Processing, 19.2%
Charitable Fundraising, 7.7%
Market Research and Survey Analysis,80.8%Collections (Pricing, Targeting or Other),19.2%Sales Force Allocation or Targeting,42.3%Supply Chain Optimization, 26.9%
Black-box Trading Systems, 15.4%
Human Resource Applications, 15.4%
Insurance Pricing, Selection or OtherInsurance Application, 19.2%Other, 3.8%
Regarding your existing or planned predictive analytics initiatives, please select all Fraud and Security
Applications that are important for your organization (check all that apply):
0.00% 20.00% 40.00% 60.00% 80.00% 100.00%
Fraud Detection, 77.8%
Criminal or Terrorist Detection,27.8%
Information Security, 55.6%
SPAM Detection, 33.3%
Political Applications, 11.1%