Embed Size (px)
Citation preview
Journal of Ecology
2002
90
, 108–120
© 2002 British Ecological Society
Blackwell Science Ltd
Prediction of species response to atmospheric nitrogen deposition by means of ecological measures and life history traits
MARTIN DIEKMANN and URSULA FALKENGREN-GRERUP*
Department of Ecology and Evolutionary Biology, Bremen University, FB 2, Leobener Str., DE-28359 Bremen, Germany, and
*
Plant Ecology, Ecology Building, Lund University, SE-22362 Lund, Sweden
Summary
1
The main objective of this study was to predict the responses of vascular plant speciesto atmospheric nitrogen deposition and enhanced soil nitrogen levels. The study wascarried out in deciduous forests located in three regions of southern Sweden. The abund-ance of vascular plants, as well as soil pH and nitrogen mineralization rates, were studiedin a total of 661 sample plots.
2
We calculated an ecological measure (
N
dev
value) for all species based on theirobserved vs. expected nitrification ratios at a given soil pH, and compared its accuracyin predicting abundance changes with results using life history traits. Data from long-term field studies and fertilization experiments were used for validation.
3
N
dev
values were positively correlated between neighbouring regions. Values for thesouthernmost region (Skåne) were also positively related to the changes in species fre-quency observed in large-scale flora surveys and permanent plot studies in that area andwith species changes reported from Central Europe. Values from one of two otherregions were also consistent.
N
dev
values from Skåne (but no other region) predictedspecies responses in short-term fertilization experiments.
4
No life history trait was as good a predictor as
N
dev
, although plant height, leaf ana-tomy, leaf nitrogen concentration and phenology showed significant correlations.Attributes related to taxonomy, life form, relative growth rate and habitat type showedno agreement with the changes in species abundance.
5
We predict that species with the following attribute syndrome will increase in abund-ance in response to enhanced nitrogen levels: those favoured by a high soil nitrificationratio relative to other species at a given soil pH, tall stature, hydro- to helomorph anat-omy, high leaf nitrogen concentration and a late phenological development.
Key-words
: anatomy, leaf nitrogen concentration, life history trait, nitrification ratio,nitrogen mineralization, pH, phenology, plant height
Journal of Ecology
(2002)
90
, 108–120
Introduction
Many ecosystems are exposed to extensive humanimpact that causes various kinds of environmentalchange, for example the drainage of wetlands, the abandon-ment of grazing and mowing in formerly managedgrasslands and the deposition of toxic pollutants. Animportant task of ecology is to study the effects of thesechanges on plant and animal life and to predict the
responses of species, especially of those that might beaffected negatively.
Scientists in the industrialized and densely inhabitedcountries of Europe and North America have paidmuch attention to the problems caused by the atmos-pheric deposition of excess nutrients and acidifyingsubstances (e.g. Bobbink
et al
. 1998; Fenn
et al
. 1998).In Sweden, where the well-being of forests is of funda-mental importance for society, the effects of nitrogeninput on the health and productivity of forests (Binkley& Högberg 1997) and on the plant species richness offorest ecosystems (Falkengren-Grerup 1995; Kellner &Redbo-Torstensson 1995) are of particular concern.Repeated analyses have been performed using data
Correspondence: Martin Diekmann, Department of Ecologyand Evolutionary Biology, Bremen University, FB 2, LeobenerStr., DE-28359 Bremen, Germany (tel. + 49 4212183670;fax + 49 4212187052; e-mail [email protected]).
JEC_639.fm Page 108 Monday, January 28, 2002 6:12 PM
109
Species response to atmospheric nitrogen
© 2002 British Ecological Society,
Journal of Ecology
,
90
, 108–120
from permanent or semi-permanent plots (Falkengren-Grerup 1995; Liu & Bråkenhielm 1996), or large-scalefloristic surveys (Tyler & Olsson 1997), and regionalcomparisons undertaken between polluted and lesspolluted areas (Rosén
et al
. 1992; Bråkenhielm & Liu 1995;Falkengren-Grerup
et al
. 1998; Diekmann
et al
. 1999).Fertilization experiments have also been conducted
mainly in coniferous forests (Kellner & Mårshagen1991; Hallbäcken & Zhang 1998; Nordin
et al
. 1998;van Dobben
et al
. 1999), but more rarely in deciduousforests (Falkengren-Grerup 1993). Such Swedish studiesand colleagues from Central Europe revealed largelyconsistent positive responses to nitrogen enrichmentfor a number of species (
Epilobium angustifolium
,
Rubusidaeus
) and negative ones for others (Ericaceae, lichens).We aim to predict the responses of forest vascular
plants to enhanced nitrogen levels. Our first approachis based on the assumption that the species’ responsesto nitrogen deposition and soil mineralization of nitro-gen are correlated with various life history traits, suchas life form, anatomy/morphology, physiology andphenology. Recently, there has been a growing interestin classifying species into (functional) groups sharingcertain biological attributes, particularly those affectingresponses to disturbance (e.g. Lavorel
et al
. 1997, 1999).The second approach uses soil chemistry in associ-
ation with the functional nitrogen index for species(FNIS) proposed by Diekmann & Falkengren-Grerup(1998). The simultaneous deposition of acidifying sub-stances and nitrogen affects both the pH and nitrogencontent of the soil, and we assume that these two vari-ables are positively correlated. Plant responses willdepend on N availability, but the correlation betweenmineralization (usually the net potential mineraliza-tion) and pH is not clear. Both positive (Kriebitzsch1978) and negative correlations (Falkengren-Grerup
et al
. 1998), or no distinct relationship at all (Curtin
et al
. 1998), have been reported and may partly depend
on the pH-range studied. Falkengren-Grerup
et al
.(1998), for instance, showed that a positive relationshipbetween pH and mineralization in soils with pH(KCl) < 4.0 became negative when soils with increas-ingly higher pH were included. More general patternsare found for the nitrification and ammonificationrates, which increase and decrease, respectively, withincreasing pH (e.g. Falkengren-Grerup
et al
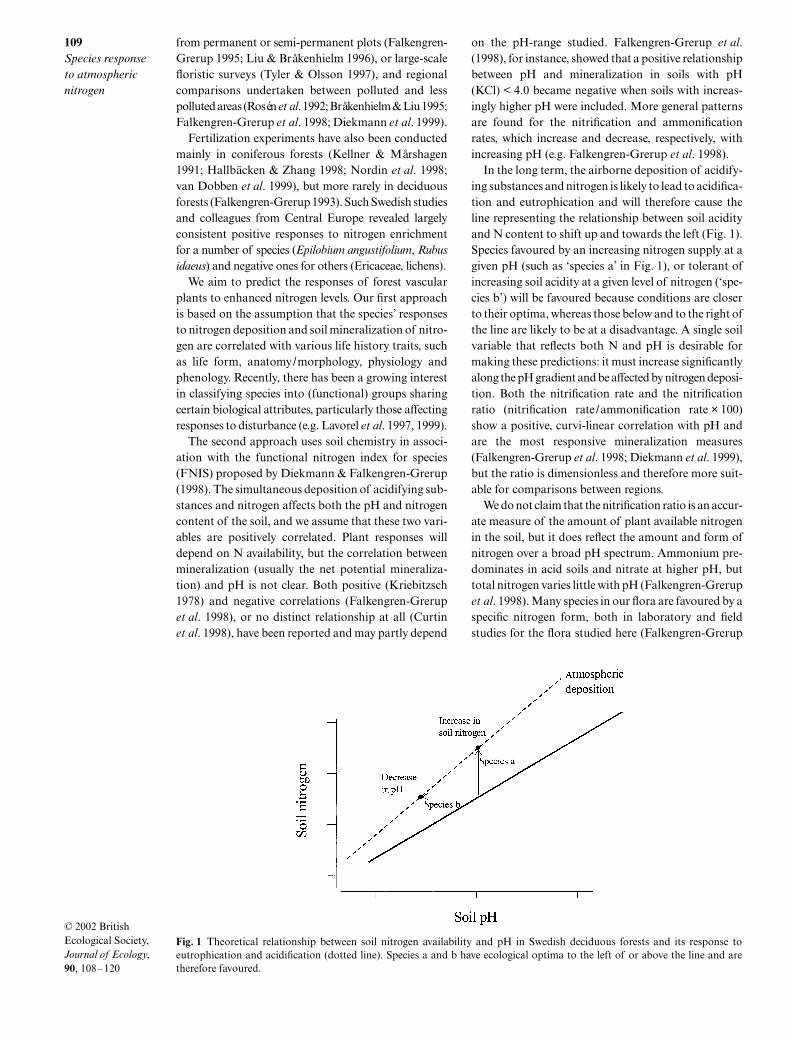
. 1998).In the long term, the airborne deposition of acidify-
ing substances and nitrogen is likely to lead to acidifica-tion and eutrophication and will therefore cause theline representing the relationship between soil acidityand N content to shift up and towards the left (Fig. 1).Species favoured by an increasing nitrogen supply at agiven pH (such as ‘species a’ in Fig. 1), or tolerant ofincreasing soil acidity at a given level of nitrogen (‘spe-cies b’) will be favoured because conditions are closerto their optima, whereas those below and to the right ofthe line are likely to be at a disadvantage. A single soilvariable that reflects both N and pH is desirable formaking these predictions: it must increase significantlyalong the pH gradient and be affected by nitrogen deposi-tion. Both the nitrification rate and the nitrificationratio (nitrification rate/ammonification rate
×
100)show a positive, curvi-linear correlation with pH andare the most responsive mineralization measures(Falkengren-Grerup
et al
. 1998; Diekmann
et al
. 1999),but the ratio is dimensionless and therefore more suit-able for comparisons between regions.
We do not claim that the nitrification ratio is an accur-ate measure of the amount of plant available nitrogenin the soil, but it does reflect the amount and form ofnitrogen over a broad pH spectrum. Ammonium pre-dominates in acid soils and nitrate at higher pH, buttotal nitrogen varies little with pH (Falkengren-Grerup
et al
. 1998). Many species in our flora are favoured by aspecific nitrogen form, both in laboratory and fieldstudies for the flora studied here (Falkengren-Grerup
Fig. 1 Theoretical relationship between soil nitrogen availability and pH in Swedish deciduous forests and its response toeutrophication and acidification (dotted line). Species a and b have ecological optima to the left of or above the line and aretherefore favoured.
JEC_639.fm Page 109 Monday, January 28, 2002 6:12 PM
110
M. Diekmann & U. Falkengren-Grerup
© 2002 British Ecological Society,
Journal of Ecology
,
90
, 108–120
1998; Olsson & Falkengren-Grerup 2000). Our FNISindex, describing optimum conditions for speciesabundance in terms of a negative relationship withammonium and a positive one with nitrate (Diekmann& Falkengren-Grerup 1998), is a similar measure to thenitrification ratio.
We aimed to develop a measure that reflects the aver-age soil status with respect to nitrogen and pH at whichindividual species occur, which can then be used to pre-dict the responses of vascular plants to enhanced nitro-gen deposition. Validation of this measure against resultsobtained from monitoring and permanent plot studies,as well as from nitrogen fertilization experiments,would allow its accuracy to be compared with predic-tions using life history traits.
Materials and methods
We studied deciduous forests in three regions of south-ern Sweden south of the
Limes Norrlandicus
:
•
Skåne, the southernmost province in Sweden, withan annual mean temperature of 7–8
°
C and an annualmean precipitation of 550–750 mm.
•
Eastern Småland, a province about 200 km north-east of Skåne, with somewhat lower values for temper-ature (6–7
°
C) and rainfall (500–600 mm).
•
Other parts of south Sweden up to 600 km north-east of Skåne, with data mainly from the provincesÖland, Uppland, Västergötland, Södermanland andGotland. Annual mean temperatures range from 5
°
Cto 7
°
C, the yearly precipitation varies between 450 mmin the south-east and more than 900 mm in the west-ernmost provinces.
The deposition of acidifying substances (especiallysulphate) and nitrogen varies between the study areas,and in general is highest in Skåne, decreasing sharplytowards the north-east. According to model data for20
×
20 km
2
grids from Lagner
et al
. (1996), total Ndeposition averages 17 kg ha
–1
year
–1
in the studiedplots in Skåne, 10 kg ha
–1
year
–1
in Småland and 7–10 kg ha
–1
year
–1
in region 3. There is, however, a con-siderable variation in all regions.
Data from a total of 661 plots of various types ofdeciduous forest were used, comprising 194 sampled inSkåne in 1993 (Brunet
et al
. 1996), 156 in Småland in1993 (Å. Rühling, unpublished vegetation data) and311 in region 3 surveyed in 1987 and between 1989 and1992 (Diekmann 1994). Phytosociologically, all plotscan be assigned to the class Querco-Fagetea, charac-terized by a mixture of tree species, namely
Acer plata-noides
,
Alnus
spp.,
Carpinus betulus
,
Fraxinus excelsior
,
Quercus
spp. (often dominant),
Tilia cordata
and
Ulmus
spp. The most common shrubs encountered were
Corylus avellana
,
Crataegus
spp.,
Juniperus communis
,
Lonicera xylosteum
and
Ribes alpinum
. The field layerusually is fairly species-rich, including a large numberof graminoids and forbs, occasionally also some ferns.
All plots were selected and sampled according to theBraun-Blanquet approach, but details of field methodsnevertheless differed between the regions (plot size,separation of vegetation layers, registration of woodytaxa, vernal species and bryophytes, and cover percent-age scale, see Diekmann 1994; Brunet
et al
. 1996;Diekmann
et al
. 1999). We used cover percentage valuesfor the assessment of species abundance, and as theseare not directly dependent on plot size we assumed thatneither its variation (100–500 m
2
) nor different samplingdates in these stable forests would distort the results.All estimates of species abundance were transformedonto a 1–9 ordinal scale according to van der Maarel(1979). The nomenclature of species follows the newchecklist of Swedish vascular plants by Karlsson (1997).
In the absence of known correlations with responses tonitrogen deposition we chose a range of traits (Table 1)for which data are available. Regenerative traits, such asseed mass, dispersal mode or ability of clonal growth,were assumed not to be relevant here.
Mixed soil samples were collected from all plots in 1993(Skåne and Småland) and 1995 (region 3), by combin-ing five top soil cores (0–5 cm, taken below the litterlayer). In the laboratory, the fresh soil was passedthrough a 6-mm sieve prior to chemical analysis. Fordetermination of pH, 10 g fresh soil (15 g in region 3)were extracted using 50 mL 0.2
KCl, shaken for 2hours and measured, after sedimentation, with an elec-trometric glass electrode. Organic matter content wasanalysed as loss on ignition (LOI) by ashing the sam-ples at 600
°
C in a muffle furnace. Potential net nitro-gen mineralization was determined by incubating thesamples at, on average, 48% of water holding capacity(60% in region 3) at 18
°
C for 15 weeks. After incuba-tion, 10 g of fresh soil were extracted using 50 mL 0.2
KCl, after which the contents of ammonium (minNH
4+
)and nitrate (minNO
3–
) were measured by flow injectionanalysis. The mineralization values were then relatedto LOI and expressed in
µ
g N g
–1
(dry organic matter)day
–1
. For a more detailed description of the methodsused, see Falkengren-Grerup
et al
. (1998).We did not consider the initial amounts of nitrogen,
because earlier studies had shown that they only area small fraction of the values after incubation (cf.Falkengren-Grerup
et al
. 1998). Measurements from afurther 38 localities in south-west Sweden confirmedthat minNO
3–
and minNH
4+
differed only by an averageof 3.6% and 7.8%, respectively, when corrected forinitial N concentrations. For the nitrification ratio(%minNO
3–
) the mean difference was only 0.7%. Nordid we add ammonium or nitrate to the incubated sam-ples, because the needed amounts to simulate realisticdeposition levels would again represent only a tiny
JEC_639.fm Page 110 Monday, January 28, 2002 6:12 PM
111
Species response to atmospheric nitrogen
© 2002 British Ecological Society,
Journal of Ecology
,
90
, 108–120
fraction of the accumulated N. We are aware that laboratory measurements of mineralization do not alwaysreflect the situation in the field, where both climatic andedaphic factors may constrain rates. However, the onlyway to obtain mineralization data for a large number ofsites is to carry out simplified laboratory experiments.
The regional data were kept separate for statistical ana-lysis, as they differed considerably in nitrogen deposi-tion rates, and provided three independent test data sets.
First, we determined the general relation betweensoil percentage minNO
3–
and soil pH. As there was asigmoid relationship between the two variables (cf.Falkengren-Grerup
et al
. 1998) our first attempt was totransform the nitrification ratio using the equation
x
=log
e
(%minNO
3–
/[1 – %minNO
3–
] ). However, neitherthe relation between the log
e
-transformed variable andpH, or any relation using other types of transforma-tion, were well described by simple linear regression.We therefore determined the relationship between thetwo variables by applying the method of running means:pH values were sorted in ascending order and definedas R
1
(lowest value) to R
n
(highest value), with their cor-responding percentage minNO
3–
values denoted N
1
toN
n
. The expected percentage minNO
3–
value (N
expected
)of soils of a given pH (R
z
) was then calculated by:
N
expected
(R
z
) = (N
z
–5
+ N
z
–4
+ N
z
–3
+ N
z
–2
+ N
z
–1
+ N
z
+
N
z
+1
+ N
z
+2
+ N
z
+3
+ N
z
+4
+ N
z
+5
) /11 eqn 1
We then calculated species indices as the weighted aver-ages of the soil nitrification ratios and pH values in allplots where the species were present (cf. Diekmann &Falkengren-Grerup 1998):
N
index/observed
= (
x
1
N
1
+
x
2
N
2
+ ... +
x
n
N
n
)/(
x
1
+
x
2
+ ... +
x
n
) eqn 2
R
index/observed
= (
x
1
R
1
+
x
2
R
2
+ ... +
x
n
R
n
)/(
x
1
+
x
2
+ ... +
x
n
) eqn 3
where
x
1
,
x
2
, ... ,
x
n
are the species’ abundance values inindividual plots. A low N
index/observed
would indicate aspecies that is largely restricted to sites with low nitri-fication ratios.
The general relationship calculated between soil per-centage minNO
3–
and pH was then used to determinethe N
index/expected
for all species based on their R
index/observed
.For example, if the average soil percentage minNO
3–
atpH 5 was 90%, a species with an R
index/observed
= 5 wasassigned a N
index/expected
of 90%. The deviation fromexpectation (
N
dev
) was calculated as
N
dev
= N
index/observed
– N
index/expected
eqn 4
Table 1 Life history traits used in this study
Taxonomic group Five categories: woody species = 1, herbaceous dicotyledons = 2, Poaceae = 3, monocotyledons except Poaceae = 4, Pteridophytes = 5.
Life form Raunkiaer system, based on the position of regenerating buds over the inactive season; here distinguishing six categories: chamaephytes, geophytes, hemicryptophytes, nanophanerophytes, phanerophytes and therophytes. Data source: Oberdorfer (1990)
Plant height Mean height of adult plant; in m. Data source: Rothmaler (1986)
Anatomy For statistical analysis transformed to ordinal values as follows: hydromorph = 1, helomorph = 2, hygromorph = 3, mesomorph = 4, scleromorph = 5, plus intermediate classes. Data source: Lindacher (1995)
Maximum potential relative growth rate, RGRmax
In week–1. Data source: Grime & Hunt (1975)
Current nitrate reductase activity, NRA
In µmol g–1 fresh weight h–1. Data sources: Havill et al. (1974); Lee & Stewart (1978); Kinzel (1982); Gharbi & Hipkin (1984); Gebauer et al. (1988); Högbom & Ohlson (1991)
Nitrogen concentration of the leaves, N-conc
In mg g–1 dry weight. Data sources: Höhne (1962, 1963, 1970, 1978); Janiesch (1973); Dinic & Misic (1975); Höhne et al. (1981); Aronsson (1984); Robinson & Rorison (1985); Gebauer et al. (1988); Falkengren-Grerup (1990)
Phenology The phenological development is described as flowering time (ferns: time of full vegetative development) in the form of ordinal numbers from 1 (flowering in early spring) to 9 (flowering in late summer). For the large majority of species (but not in many vernal geophytes) shoot and leaf development precede flowering; therefore, flowering time largely reflects vegetative development. Data source: Dierschke (1983)
Habitat type Two categories: specialists = species with high shade tolerance usually found in closed forests; generalists = species with lower shade tolerance mainly confined to forest edges and openings. Data source: Oberdorfer (1990)
JEC_639.fm Page 111 Monday, January 28, 2002 6:12 PM
112M. Diekmann & U. Falkengren-Grerup
© 2002 British Ecological Society, Journal of Ecology, 90, 108–120
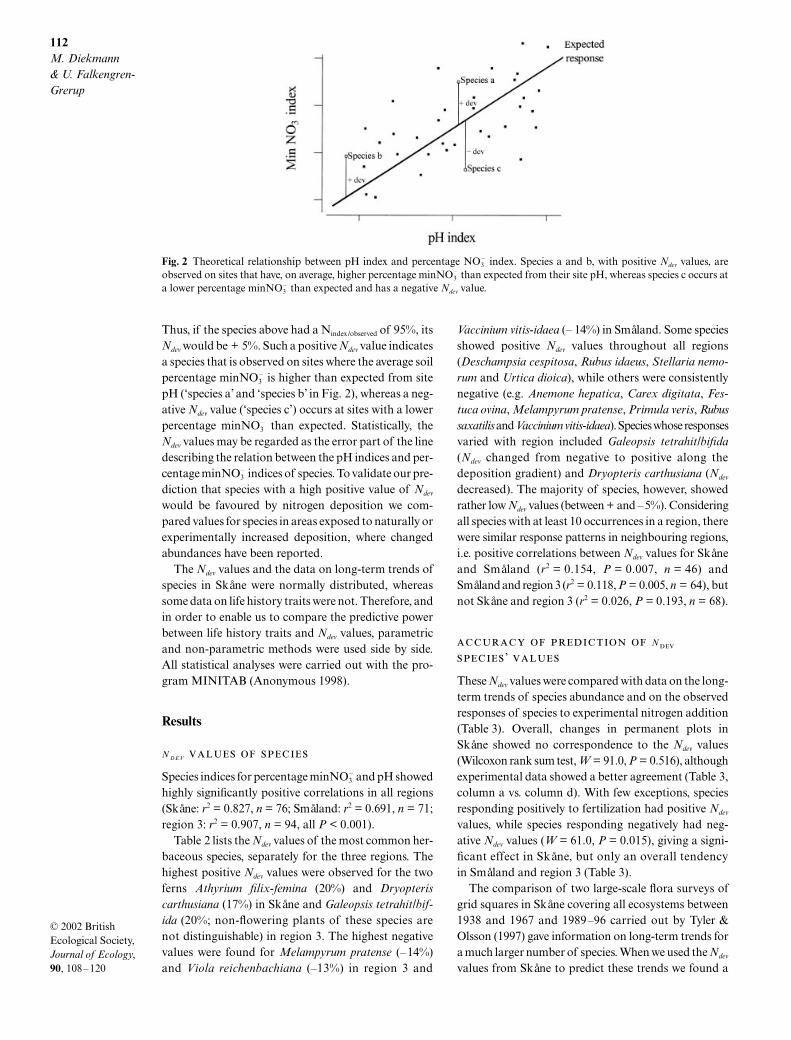
Thus, if the species above had a Nindex/observed of 95%, itsNdev would be + 5%. Such a positive Ndev value indicatesa species that is observed on sites where the average soilpercentage minNO3
– is higher than expected from sitepH (‘species a’ and ‘species b’ in Fig. 2), whereas a neg-ative Ndev value (‘species c’) occurs at sites with a lowerpercentage minNO3
– than expected. Statistically, theNdev values may be regarded as the error part of the linedescribing the relation between the pH indices and per-centage minNO3
– indices of species. To validate our pre-diction that species with a high positive value of Ndev
would be favoured by nitrogen deposition we com-pared values for species in areas exposed to naturally orexperimentally increased deposition, where changedabundances have been reported.
The Ndev values and the data on long-term trends ofspecies in Skåne were normally distributed, whereassome data on life history traits were not. Therefore, andin order to enable us to compare the predictive powerbetween life history traits and Ndev values, parametricand non-parametric methods were used side by side.All statistical analyses were carried out with the pro-gram MINITAB (Anonymous 1998).
Results
N D E V
Species indices for percentage minNO3– and pH showed
highly significantly positive correlations in all regions(Skåne: r2 = 0.827, n = 76; Småland: r2 = 0.691, n = 71;region 3: r2 = 0.907, n = 94, all P < 0.001).
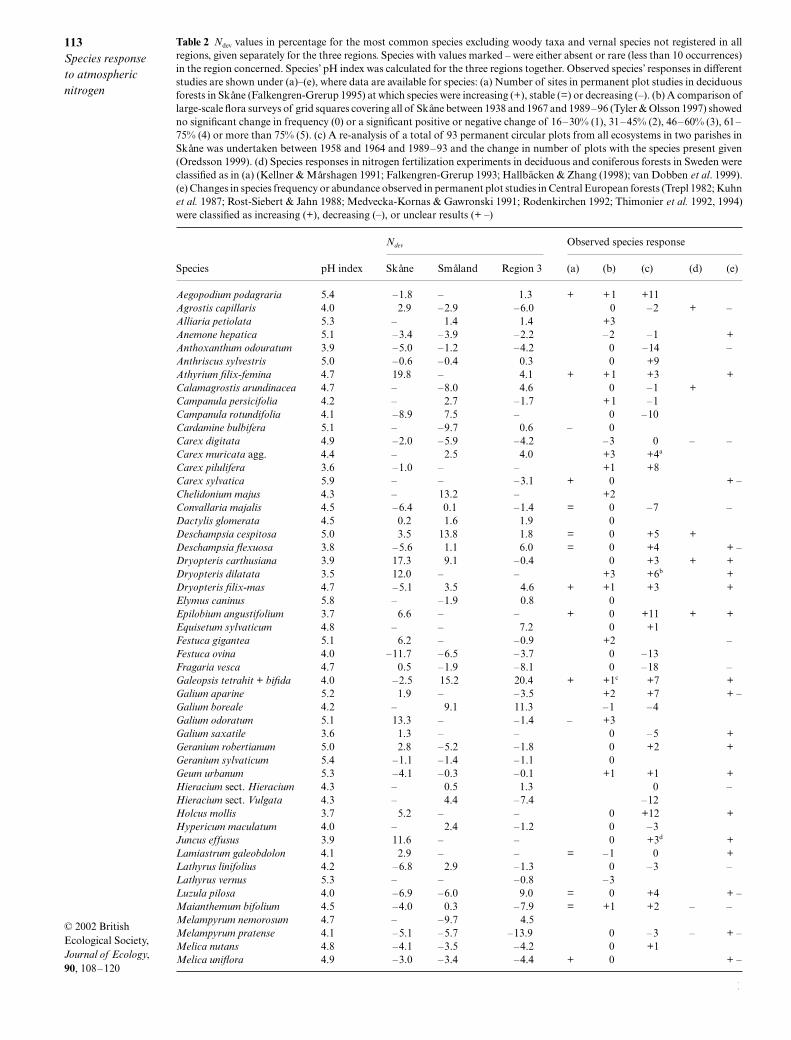
Table 2 lists the Ndev values of the most common her-baceous species, separately for the three regions. Thehighest positive Ndev values were observed for the twoferns Athyrium filix-femina (20%) and Dryopteriscarthusiana (17%) in Skåne and Galeopsis tetrahit/bif-ida (20%; non-flowering plants of these species arenot distinguishable) in region 3. The highest negativevalues were found for Melampyrum pratense (–14%)and Viola reichenbachiana (–13%) in region 3 and
Vaccinium vitis-idaea (– 14%) in Småland. Some speciesshowed positive Ndev values throughout all regions(Deschampsia cespitosa, Rubus idaeus, Stellaria nemo-rum and Urtica dioica), while others were consistentlynegative (e.g. Anemone hepatica, Carex digitata, Fes-tuca ovina, Melampyrum pratense, Primula veris, Rubussaxatilis and Vaccinium vitis-idaea). Species whose responsesvaried with region included Galeopsis tetrahit/bifida(Ndev changed from negative to positive along thedeposition gradient) and Dryopteris carthusiana (Ndev
decreased). The majority of species, however, showedrather low Ndev values (between + and –5%). Consideringall species with at least 10 occurrences in a region, therewere similar response patterns in neighbouring regions,i.e. positive correlations between Ndev values for Skåneand Småland (r2 = 0.154, P = 0.007, n = 46) andSmåland and region 3 (r2 = 0.118, P = 0.005, n = 64), butnot Skåne and region 3 (r2 = 0.026, P = 0.193, n = 68).
N ’
These Ndev values were compared with data on the long-term trends of species abundance and on the observedresponses of species to experimental nitrogen addition(Table 3). Overall, changes in permanent plots inSkåne showed no correspondence to the Ndev values(Wilcoxon rank sum test, W = 91.0, P = 0.516), althoughexperimental data showed a better agreement (Table 3,column a vs. column d). With few exceptions, speciesresponding positively to fertilization had positive Ndev
values, while species responding negatively had neg-ative Ndev values (W = 61.0, P = 0.015), giving a signi-ficant effect in Skåne, but only an overall tendencyin Småland and region 3 (Table 3).
The comparison of two large-scale flora surveys ofgrid squares in Skåne covering all ecosystems between1938 and 1967 and 1989–96 carried out by Tyler &Olsson (1997) gave information on long-term trends fora much larger number of species. When we used the Ndev
values from Skåne to predict these trends we found a
Fig. 2 Theoretical relationship between pH index and percentage NO3– index. Species a and b, with positive Ndev values, are
observed on sites that have, on average, higher percentage minNO3– than expected from their site pH, whereas species c occurs at
a lower percentage minNO3– than expected and has a negative Ndev value.
JEC_639.fm Page 112 Monday, January 28, 2002 6:12 PM
113Species response to atmospheric nitrogen
© 2002 British Ecological Society, Journal of Ecology, 90, 108–120
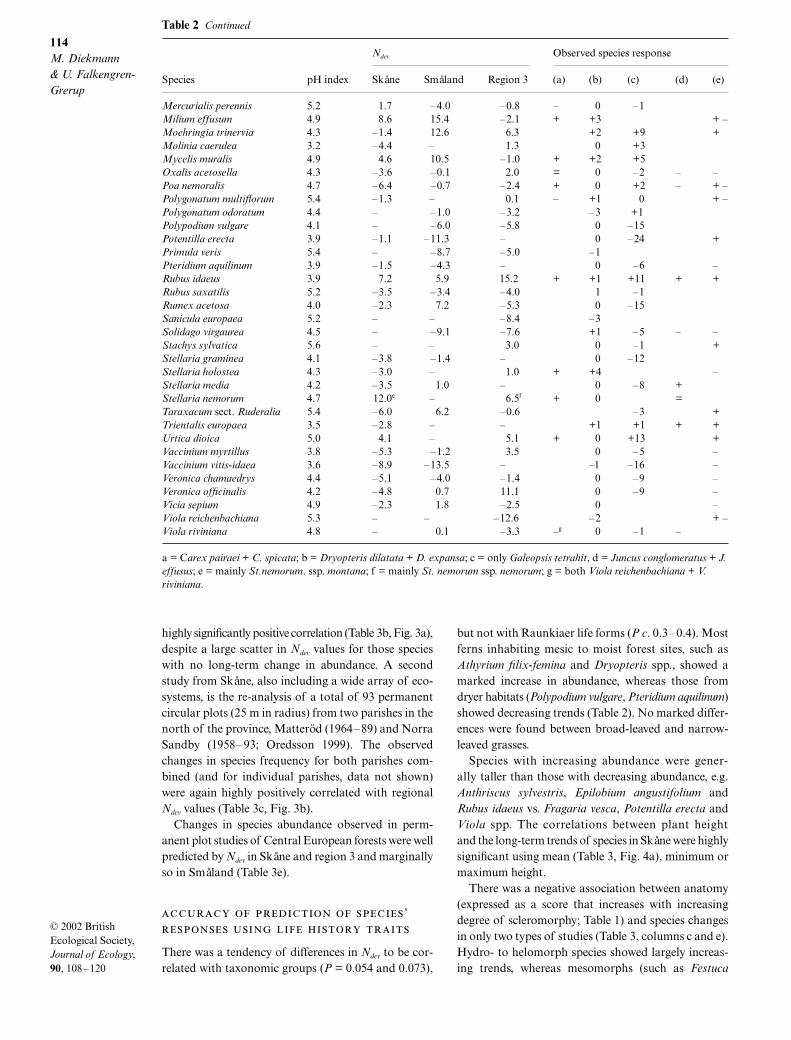
Table 2 Ndev values in percentage for the most common species excluding woody taxa and vernal species not registered in allregions, given separately for the three regions. Species with values marked – were either absent or rare (less than 10 occurrences)in the region concerned. Species’ pH index was calculated for the three regions together. Observed species’ responses in differentstudies are shown under (a)–(e), where data are available for species: (a) Number of sites in permanent plot studies in deciduousforests in Skåne (Falkengren-Grerup 1995) at which species were increasing (+), stable (=) or decreasing (–). (b) A comparison oflarge-scale flora surveys of grid squares covering all of Skåne between 1938 and 1967 and 1989–96 (Tyler & Olsson 1997) showedno significant change in frequency (0) or a significant positive or negative change of 16–30% (1), 31–45% (2), 46–60% (3), 61–75% (4) or more than 75% (5). (c) A re-analysis of a total of 93 permanent circular plots from all ecosystems in two parishes inSkåne was undertaken between 1958 and 1964 and 1989–93 and the change in number of plots with the species present given(Oredsson 1999). (d) Species responses in nitrogen fertilization experiments in deciduous and coniferous forests in Sweden wereclassified as in (a) (Kellner & Mårshagen 1991; Falkengren-Grerup 1993; Hallbäcken & Zhang (1998); van Dobben et al. 1999).(e) Changes in species frequency or abundance observed in permanent plot studies in Central European forests (Trepl 1982; Kuhnet al. 1987; Rost-Siebert & Jahn 1988; Medvecka-Kornas & Gawronski 1991; Rodenkirchen 1992; Thimonier et al. 1992, 1994)were classified as increasing (+), decreasing (–), or unclear results (+ –)
Ndev Observed species response
Species pH index Skåne Småland Region 3 (a) (b) (c) (d) (e)
Aegopodium podagraria 5.4 –1.8 – 1.3 + +1 +11Agrostis capillaris 4.0 2.9 –2.9 –6.0 0 –2 + –Alliaria petiolata 5.3 – 1.4 1.4 +3Anemone hepatica 5.1 –3.4 –3.9 –2.2 –2 –1 +Anthoxanthum odouratum 3.9 –5.0 –1.2 –4.2 0 –14 –Anthriscus sylvestris 5.0 –0.6 –0.4 0.3 0 +9Athyrium filix-femina 4.7 19.8 – 4.1 + +1 +3 +Calamagrostis arundinacea 4.7 – –8.0 4.6 0 –1 +Campanula persicifolia 4.2 – 2.7 –1.7 +1 –1Campanula rotundifolia 4.1 –8.9 7.5 – 0 –10Cardamine bulbifera 5.1 – –9.7 0.6 – 0Carex digitata 4.9 –2.0 –5.9 –4.2 –3 0 – –Carex muricata agg. 4.4 – 2.5 4.0 +3 +4a
Carex pilulifera 3.6 –1.0 – – +1 +8Carex sylvatica 5.9 – – –3.1 + 0 + –Chelidonium majus 4.3 – 13.2 – +2Convallaria majalis 4.5 –6.4 0.1 –1.4 = 0 –7 –Dactylis glomerata 4.5 0.2 1.6 1.9 0Deschampsia cespitosa 5.0 3.5 13.8 1.8 = 0 +5 +Deschampsia flexuosa 3.8 –5.6 1.1 6.0 = 0 +4 + –Dryopteris carthusiana 3.9 17.3 9.1 –0.4 0 +3 + +Dryopteris dilatata 3.5 12.0 – – +3 +6b +Dryopteris filix-mas 4.7 –5.1 3.5 4.6 + +1 +3 +Elymus caninus 5.8 – –1.9 0.8 0Epilobium angustifolium 3.7 6.6 – – + 0 +11 + +Equisetum sylvaticum 4.8 – – 7.2 0 +1Festuca gigantea 5.1 6.2 – –0.9 +2 –Festuca ovina 4.0 –11.7 –6.5 –3.7 0 –13Fragaria vesca 4.7 0.5 –1.9 –8.1 0 –18 –Galeopsis tetrahit + bifida 4.0 –2.5 15.2 20.4 + +1c +7 +Galium aparine 5.2 1.9 – –3.5 +2 +7 + –Galium boreale 4.2 – 9.1 11.3 –1 –4Galium odoratum 5.1 13.3 – –1.4 – +3Galium saxatile 3.6 1.3 – – 0 –5 +Geranium robertianum 5.0 2.8 –5.2 –1.8 0 +2 +Geranium sylvaticum 5.4 –1.1 –1.4 –1.1 0Geum urbanum 5.3 –4.1 –0.3 –0.1 +1 +1 +Hieracium sect. Hieracium 4.3 – 0.5 1.3 0 –Hieracium sect. Vulgata 4.3 – 4.4 –7.4 –12Holcus mollis 3.7 5.2 – – 0 +12 +Hypericum maculatum 4.0 – 2.4 –1.2 0 –3Juncus effusus 3.9 11.6 – – 0 +3d +Lamiastrum galeobdolon 4.1 2.9 – – = –1 0 +Lathyrus linifolius 4.2 –6.8 2.9 –1.3 0 –3 –Lathyrus vernus 5.3 – – –0.8 –3Luzula pilosa 4.0 –6.9 –6.0 9.0 = 0 +4 + –Maianthemum bifolium 4.5 –4.0 0.3 –7.9 = +1 +2 – –Melampyrum nemorosum 4.7 – –9.7 4.5Melampyrum pratense 4.1 –5.1 –5.7 –13.9 0 –3 – + –Melica nutans 4.8 –4.1 –3.5 –4.2 0 +1Melica uniflora 4.9 –3.0 –3.4 –4.4 + 0 + –
a = Carex pairaei + C. spicata; b = Dryopteris dilatata + D. expansa; c = only Galeopsis tetrahit, d = Juncus conglomeratus + J. effusus; e = mainly St.nemorum. ssp. montana; f = mainly St. nemorum ssp. nemorum; g = both Viola reichenbachiana + V. riviniana.
JEC_639.fm Page 113 Monday, January 28, 2002 6:12 PM
114M. Diekmann & U. Falkengren-Grerup
© 2002 British Ecological Society, Journal of Ecology, 90, 108–120
Mercurialis perennis 5.2 1.7 –4.0 –0.8 – 0 –1Milium effusum 4.9 8.6 15.4 –2.1 + +3 + –Moehringia trinervia 4.3 –1.4 12.6 6.3 +2 +9 +Molinia caerulea 3.2 –4.4 – 1.3 0 +3Mycelis muralis 4.9 4.6 10.5 –1.0 + +2 +5Oxalis acetosella 4.3 –3.6 –0.1 2.0 = 0 –2 – –Poa nemoralis 4.7 –6.4 –0.7 –2.4 + 0 +2 – + –Polygonatum multiflorum 5.4 –1.3 – 0.1 – +1 0 + –Polygonatum odoratum 4.4 – –1.0 –3.2 –3 +1Polypodium vulgare 4.1 – –6.0 –5.8 0 –15Potentilla erecta 3.9 –1.1 –11.3 – 0 –24 +Primula veris 5.4 – –8.7 –5.0 –1Pteridium aquilinum 3.9 –1.5 –4.3 – 0 –6 –Rubus idaeus 3.9 7.2 5.9 15.2 + +1 +11 + +Rubus saxatilis 5.2 –3.5 –3.4 –4.0 1 –1Rumex acetosa 4.0 –2.3 7.2 –5.3 0 –15Sanicula europaea 5.2 – – –8.4 –3Solidago virgaurea 4.5 – –9.1 –7.6 +1 –5 – –Stachys sylvatica 5.6 – – 3.0 0 –1 +Stellaria graminea 4.1 –3.8 –1.4 – 0 –12Stellaria holostea 4.3 –3.0 – 1.0 + +4 –Stellaria media 4.2 –3.5 1.0 – 0 –8 +Stellaria nemorum 4.7 12.0e – 6.5f + 0 =Taraxacum sect. Ruderalia 5.4 –6.0 6.2 –0.6 –3 +Trientalis europaea 3.5 –2.8 – – +1 +1 + +Urtica dioica 5.0 4.1 – 5.1 + 0 +13 +Vaccinium myrtillus 3.8 –5.3 –1.2 3.5 0 –5 –Vaccinium vitis-idaea 3.6 –8.9 –13.5 – –1 –16 –Veronica chamaedrys 4.4 –5.1 –4.0 –1.4 0 –9 –Veronica officinalis 4.2 –4.8 0.7 11.1 0 –9 –Vicia sepium 4.9 –2.3 1.8 –2.5 0 –Viola reichenbachiana 5.3 – – –12.6 –2 + –Viola riviniana 4.8 – 0.1 –3.3 –g 0 –1 –
Ndev Observed species response
Species pH index Skåne Småland Region 3 (a) (b) (c) (d) (e)
a = Carex pairaei + C. spicata; b = Dryopteris dilatata + D. expansa; c = only Galeopsis tetrahit, d = Juncus conglomeratus + J. effusus; e = mainly St.nemorum. ssp. montana; f = mainly St. nemorum ssp. nemorum; g = both Viola reichenbachiana + V. riviniana.
Table 2 Continued
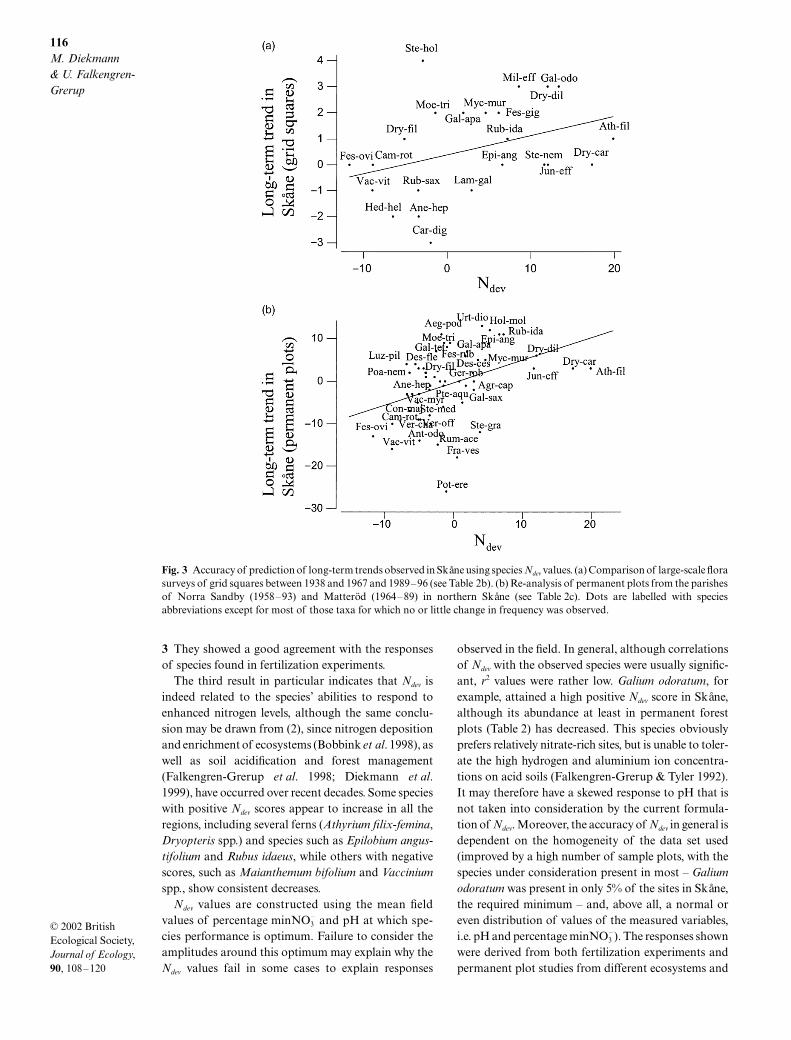
highly significantly positive correlation (Table 3b, Fig. 3a),despite a large scatter in Ndev values for those specieswith no long-term change in abundance. A secondstudy from Skåne, also including a wide array of eco-systems, is the re-analysis of a total of 93 permanentcircular plots (25 m in radius) from two parishes in thenorth of the province, Matteröd (1964–89) and NorraSandby (1958–93; Oredsson 1999). The observedchanges in species frequency for both parishes com-bined (and for individual parishes, data not shown)were again highly positively correlated with regionalNdev values (Table 3c, Fig. 3b).
Changes in species abundance observed in perm-anent plot studies of Central European forests were wellpredicted by Ndev in Skåne and region 3 and marginallyso in Småland (Table 3e).
’
There was a tendency of differences in Ndev to be cor-related with taxonomic groups (P = 0.054 and 0.073),
but not with Raunkiaer life forms (P c. 0.3–0.4). Mostferns inhabiting mesic to moist forest sites, such asAthyrium filix-femina and Dryopteris spp., showed amarked increase in abundance, whereas those fromdryer habitats (Polypodium vulgare, Pteridium aquilinum)showed decreasing trends (Table 2). No marked differ-ences were found between broad-leaved and narrow-leaved grasses.
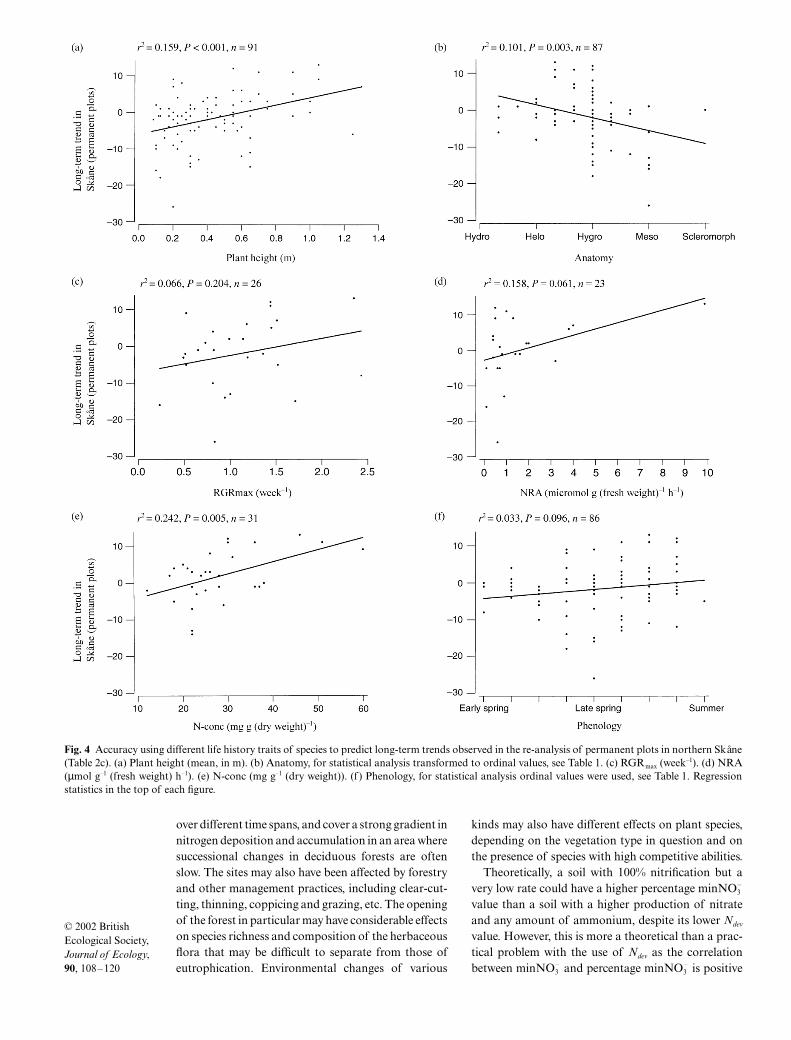
Species with increasing abundance were gener-ally taller than those with decreasing abundance, e.g.Anthriscus sylvestris, Epilobium angustifolium andRubus idaeus vs. Fragaria vesca, Potentilla erecta andViola spp. The correlations between plant heightand the long-term trends of species in Skåne were highlysignificant using mean (Table 3, Fig. 4a), minimum ormaximum height.
There was a negative association between anatomy(expressed as a score that increases with increasingdegree of scleromorphy; Table 1) and species changesin only two types of studies (Table 3, columns c and e).Hydro- to helomorph species showed largely increas-ing trends, whereas mesomorphs (such as Festuca
JEC_639.fm Page 114 Monday, January 28, 2002 6:12 PM
115Species response to atmospheric nitrogen
© 2002 British Ecological Society, Journal of Ecology, 90, 108–120
ovina, Polypodium vulgare and Potentilla erecta) tendedto decline (Fig. 4b shows data from Table 3c).
Among the physiological life history traits, RGRmax
and NRA had a rather low accuracy of prediction, eventhough both variables tended to be consistently higherin species with increasing abundance (Table 3, Fig. 4c,d). In contrast, the leaf nitrogen concentration ofspecies was significantly correlated with abundancetrends, but only in permanent plot studies in Skåne andin Central Europe (Table 3, columns c and e, Fig. 4e).The species with the three highest nitrogen concentra-tions (Aegopodium podagraria, Anthriscus sylvestris andUrtica dioica) showed marked increases in abundance.
Species with a late phenological development tendedto increase in abundance in the long-term studies inSkåne at the expense of early developing species(Table 3, columns a–c; Fig. 4f). Whereas there was aconsiderable scatter among the late spring and summerspecies, it is striking that nearly all herbaceous speciesflowering in early spring (mostly geophytes, such asAnemone spp., Corydalis spp., Gagea lutea, Ranunculusficaria and Viola spp.) showed negative trends.
True forest species (specialists) and species of edges,clearings and meadows (generalists) showed no differ-
ences in their long-term trends (Table 3, habitat type).It is, however, remarkable that many generalist taxacharacteristic of shady and fertile forest fringes, suchas Aegopodium podagraria, Anthriscus sylvestris,Moehringia trinervia and Urtica dioica, were among thespecies with the highest increase in abundance. Manytypical meadow species, on the other hand, appearedto decrease, for example Rumex acetosa and Stellariagraminea.
Discussion
N DEV ’
Three observations make us believe that the Ndev valueshave an ecological meaning:1 The Ndev values of the most common species werepositively correlated between neighbouring regions.2 They were significantly positively correlated withspecies changes in frequency observed in long-termstudies in Skåne and to some extent in those in CentralEurope.
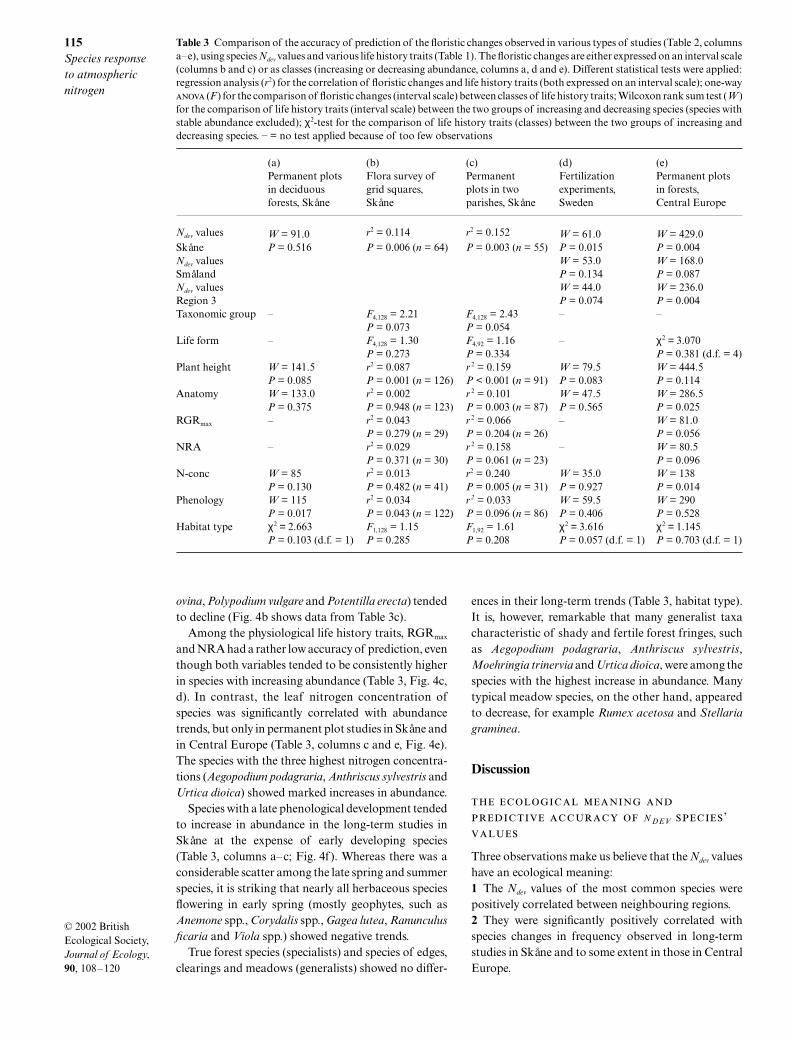
Table 3 Comparison of the accuracy of prediction of the floristic changes observed in various types of studies (Table 2, columnsa–e), using species Ndev values and various life history traits (Table 1). The floristic changes are either expressed on an interval scale(columns b and c) or as classes (increasing or decreasing abundance, columns a, d and e). Different statistical tests were applied:regression analysis (r2) for the correlation of floristic changes and life history traits (both expressed on an interval scale); one-way (F ) for the comparison of floristic changes (interval scale) between classes of life history traits; Wilcoxon rank sum test (W )for the comparison of life history traits (interval scale) between the two groups of increasing and decreasing species (species withstable abundance excluded); χ2-test for the comparison of life history traits (classes) between the two groups of increasing anddecreasing species. – = no test applied because of too few observations
(a) Permanent plots in deciduous forests, Skåne
(b) Flora survey of grid squares, Skåne
(c) Permanent plots in two parishes, Skåne
(d) Fertilization experiments, Sweden
(e) Permanent plots in forests, Central Europe
Ndev values W = 91.0 r2 = 0.114 r2 = 0.152 W = 61.0 W = 429.0Skåne P = 0.516 P = 0.006 (n = 64) P = 0.003 (n = 55) P = 0.015 P = 0.004Ndev values W = 53.0 W = 168.0Småland P = 0.134 P = 0.087Ndev values W = 44.0 W = 236.0Region 3 P = 0.074 P = 0.004Taxonomic group – F4,128 = 2.21 F4,128 = 2.43 – –
P = 0.073 P = 0.054Life form – F4,128 = 1.30 F4,92 = 1.16 – χ2 = 3.070
P = 0.273 P = 0.334 P = 0.381 (d.f. = 4)Plant height W = 141.5 r2 = 0.087 r 2 = 0.159 W = 79.5 W = 444.5
P = 0.085 P = 0.001 (n = 126) P < 0.001 (n = 91) P = 0.083 P = 0.114Anatomy W = 133.0 r2 = 0.002 r 2 = 0.101 W = 47.5 W = 286.5
P = 0.375 P = 0.948 (n = 123) P = 0.003 (n = 87) P = 0.565 P = 0.025RGRmax – r2 = 0.043 r 2 = 0.066 – W = 81.0
P = 0.279 (n = 29) P = 0.204 (n = 26) P = 0.056NRA – r2 = 0.029 r 2 = 0.158 – W = 80.5
P = 0.371 (n = 30) P = 0.061 (n = 23) P = 0.096N-conc W = 85 r2 = 0.013 r2 = 0.240 W = 35.0 W = 138
P = 0.130 P = 0.482 (n = 41) P = 0.005 (n = 31) P = 0.927 P = 0.014Phenology W = 115 r2 = 0.034 r 2 = 0.033 W = 59.5 W = 290
P = 0.017 P = 0.043 (n = 122) P = 0.096 (n = 86) P = 0.406 P = 0.528Habitat type χ2 = 2.663 F1,128 = 1.15 F1,92 = 1.61 χ2 = 3.616 χ2 = 1.145
P = 0.103 (d.f. = 1) P = 0.285 P = 0.208 P = 0.057 (d.f. = 1) P = 0.703 (d.f. = 1)
JEC_639.fm Page 115 Monday, January 28, 2002 6:12 PM
116M. Diekmann & U. Falkengren-Grerup
© 2002 British Ecological Society, Journal of Ecology, 90, 108–120
3 They showed a good agreement with the responsesof species found in fertilization experiments.
The third result in particular indicates that Ndev isindeed related to the species’ abilities to respond toenhanced nitrogen levels, although the same conclu-sion may be drawn from (2), since nitrogen depositionand enrichment of ecosystems (Bobbink et al. 1998), aswell as soil acidification and forest management(Falkengren-Grerup et al. 1998; Diekmann et al.1999), have occurred over recent decades. Some specieswith positive Ndev scores appear to increase in all theregions, including several ferns (Athyrium filix-femina,Dryopteris spp.) and species such as Epilobium angus-tifolium and Rubus idaeus, while others with negativescores, such as Maianthemum bifolium and Vacciniumspp., show consistent decreases.
Ndev values are constructed using the mean fieldvalues of percentage minNO3
– and pH at which spe-cies performance is optimum. Failure to consider theamplitudes around this optimum may explain why theNdev values fail in some cases to explain responses
observed in the field. In general, although correlationsof Ndev with the observed species were usually signific-ant, r2 values were rather low. Galium odoratum, forexample, attained a high positive Ndev score in Skåne,although its abundance at least in permanent forestplots (Table 2) has decreased. This species obviouslyprefers relatively nitrate-rich sites, but is unable to toler-ate the high hydrogen and aluminium ion concentra-tions on acid soils (Falkengren-Grerup & Tyler 1992).It may therefore have a skewed response to pH that isnot taken into consideration by the current formula-tion of Ndev. Moreover, the accuracy of Ndev in general isdependent on the homogeneity of the data set used(improved by a high number of sample plots, with thespecies under consideration present in most – Galiumodoratum was present in only 5% of the sites in Skåne,the required minimum – and, above all, a normal oreven distribution of values of the measured variables,i.e. pH and percentage minNO3
– ). The responses shownwere derived from both fertilization experiments andpermanent plot studies from different ecosystems and
Fig. 3 Accuracy of prediction of long-term trends observed in Skåne using species Ndev values. (a) Comparison of large-scale florasurveys of grid squares between 1938 and 1967 and 1989–96 (see Table 2b). (b) Re-analysis of permanent plots from the parishesof Norra Sandby (1958–93) and Matteröd (1964–89) in northern Skåne (see Table 2c). Dots are labelled with speciesabbreviations except for most of those taxa for which no or little change in frequency was observed.
JEC_639.fm Page 116 Monday, January 28, 2002 6:12 PM
117Species response to atmospheric nitrogen
© 2002 British Ecological Society, Journal of Ecology, 90, 108–120
over different time spans, and cover a strong gradient innitrogen deposition and accumulation in an area wheresuccessional changes in deciduous forests are oftenslow. The sites may also have been affected by forestryand other management practices, including clear-cut-ting, thinning, coppicing and grazing, etc. The openingof the forest in particular may have considerable effectson species richness and composition of the herbaceousflora that may be difficult to separate from those ofeutrophication. Environmental changes of various
kinds may also have different effects on plant species,depending on the vegetation type in question and onthe presence of species with high competitive abilities.
Theoretically, a soil with 100% nitrification but avery low rate could have a higher percentage minNO3
–
value than a soil with a higher production of nitrateand any amount of ammonium, despite its lower Ndev
value. However, this is more a theoretical than a prac-tical problem with the use of Ndev as the correlationbetween minNO3
– and percentage minNO3– is positive
Fig. 4 Accuracy using different life history traits of species to predict long-term trends observed in the re-analysis of permanent plots in northern Skåne(Table 2c). (a) Plant height (mean, in m). (b) Anatomy, for statistical analysis transformed to ordinal values, see Table 1. (c) RGRmax (week–1). (d) NRA(µmol g–1 (fresh weight) h–1). (e) N-conc (mg g–1 (dry weight)). (f ) Phenology, for statistical analysis ordinal values were used, see Table 1. Regressionstatistics in the top of each figure.
JEC_639.fm Page 117 Monday, January 28, 2002 6:12 PM
118M. Diekmann & U. Falkengren-Grerup
© 2002 British Ecological Society, Journal of Ecology, 90, 108–120
and highly significant for the studied sites (r2 = 0.512,P < 0.001, n = 648). We therefore believe that percent-age minNO3
– can be used to represent the complexity ofnitrogen availability in a soil: it takes into account theform of inorganic nitrogen produced in the soil andalso, indirectly, through the correlation with the nitri-fication rate, the amount of both ammonium (low per-centage minNO3
– ) and nitrate.
’
Various mechanisms responsible for vegetation changesdue to increased nitrogen deposition and availabilityhave been recognized, namely changes in soil chemistryper se, an increased density of the tree canopy (Kellner& Mårshagen 1991), altered patterns of herbivory(Ellenberg 1988) and changes in the mycorrhizal struc-ture of the soil (Arnebrant 1994). The changes incompetitive relationships between species, however,appear to be of primary importance (Kellner &Redbo-Torstensson 1995; Bobbink et al. 1998), andthese are likely to be affected by life history traits.Using functional traits or groups of species sharingcommon attributes has the advantage of arriving atmore general conclusions than a single-species approach.
Some attributes were, at least partly, correlated withobserved responses, although less well than the ecolo-gical measure (Ndev) based on soil chemistry. Neitherthe analysis of taxonomy nor life form gave any clearresults. This was not unexpected as both are large andheterogeneous groups. The physiological amplitude ofsingle taxonomic groups such as monocots is verybroad, and the same is true for most Raunkiaer lifeforms (such as the hemicryptophytes) defined on thebasis of the position of regenerating buds over the inac-tive season. Positive and negative changes in abun-dance were observed in both broad- and narrow-leavedgrasses, in contrast to studies showing that narrow-leaved grasses were favoured by nitrogen deposition(Rosén et al. 1992), but consistent with observationsthat potential growth rate varies with factors otherthan leaf width (Falkengren-Grerup 1998).
Plant height was the best predictor among the lifehistory traits tested and was also significantly posi-tively correlated with Ndev (for Skåne, for example,r2 = 0.109, P = 0.007, n = 66). This means that tall-growing species are generally favoured by a high nitro-gen deposition and percentage minNO3
– : pH ratio atany given site, at the expense of smaller species; suchspecies are able to overgrow and thereby outshade andoutcompete smaller species when conditions arefavourable. Height was positively related to RGRmax
(r2 = 0.168, P = 0.024, n = 30), an observation alsomade by Grime & Hunt (1975) in an experimental studyof grassland species. Leaf nitrogen concentration showedhigher correlations with the observed species trendsthan the other two physiological traits. In their screeningof life history attributes Grime et al. (1997) found a
close correlation between foliar nutrient concentra-tions and the capacity for rapid growth under produc-tive conditions (see also Meerts 1997). The primarystrategies of the C-S-R model developed by Grime(1979), on the other hand, did not show any agreementwith the observed species trends and do not appear tobe good predictors of the species’ responses to nitrogendeposition. The large majority of species in deciduousforests are competitors or stress-tolerant and/or ruderalcompetitors, and the mean responses of species thatwere observed did not differ between strategy types.
Plant anatomy was linked to the observed speciestrends and was also intercorrelated to N-conc (r2 =0.168, P = 0.009, n = 40; cf. Meerts 1997). Many spe-cies with a more or less helomorph anatomy (Aegopo-dium podagraria, Anthriscus sylvestris, Mercurialisperennis, Urtica dioica) also have a high foliar nitrogenconcentration and appear to be favoured by high nitro-gen deposition. This coincides with the observationthat plants cultivated under nitrogen shortage developa more xeromorph leaf anatomy than plants cultivatedon fertile soil (Müller-Stoll 1947; cited in Ellenberg1996). In other words, increased nitrogen availabilitymay favour an increasingly hydro-helomorph architec-ture. A second observation made in grasslands is thatfertilization of dry grasslands causes the vegetation todevelop a more mesic character (i.e. nitrogen in a way‘replaces’ water), because plants on nitrogen-rich soilhave a better water-use efficiency (Ellenberg 1996).
We did not expect any correlation between pheno-logical development and species trends, because thescores reflect the sequence of flowering rather than thegrowth of roots, shoots and leaves. However, thereseems to be a positive correlation between the seasonaldevelopment of different parts of the plant, and therewas a trend (albeit with low r2) for late-developingspecies to increase in abundance. One reason for thismay be that phenological development and plantheight are highly positively correlated (r2 = 0.368,P < 0.001, n = 130).
The results of our study allow us to define a so–calledattribute syndrome, i.e. a set of co-occurring attributes(Lavorel et al. 1999). We predict that species that arefound in sites with a high ratio of percentage minNO3
–
to pH or have tall stature, hydro- to helomorph ana-tomy, high leaf nitrogen concentration and late pheno-logical development, will increase in abundance inresponse to enhanced nitrogen levels. Athyrium filix-femina, Epilobium angustifolium and Urtica dioica areexamples where these attributes co-occur, but Calama-grostis arundinacea and Pteridium aquilinum, two talland late-developing species, have negative Ndev valuesand, partly, negative trends, and Moehringia trinervia,a small, rather early developing species with positiveNdev values, appears to increase in abundance. Other,less well-known attributes of forest vascular plants there-fore appear to affect the species’ responses to nitrogenenrichment, such as morphological characteristics ofthe plant or of the plant-mycorrhizal root system, the
JEC_639.fm Page 118 Monday, January 28, 2002 6:12 PM
119Species response to atmospheric nitrogen
© 2002 British Ecological Society, Journal of Ecology, 90, 108–120
nutrient (other than nitrogen) content of the plant, etc.We need to gain a better knowledge of the basic life his-tory of species in order to be able to make more accuratepredictions of their responses to atmospheric deposi-tion. Another interesting task would be to studywhether relevant life history traits differ in importancebetween deciduous forest sites with different soil acid-ity and nutrient regimes, or between deciduous forestsand other habitat types suffering from airbornenitrogen deposition, such as grasslands, heaths andwetlands.
Acknowledgements
We thank Germund Tyler and Åke Rühling for kindlyallowing us to use their sample plots from Skåne andSmåland. We are grateful to Anita Balogh who wasresponsible for most of the soil analyses. Two anony-mous referees, John Lee and Lindsay Haddon mademany valuable comments on earlier drafts of the paper.The study was made possible by research grants fromMISTRA.
References
Anonymous (1998) MINITAB. Minitab Inc., State College,Pennsylvania.
Arnebrant, K. (1994) Nitrogen amendments reduce thegrowth of extramatrical ectomycorrhizal mycelium.Mycorrhiza, 5, 7–15.
Aronsson, A. (1984) Förändringar i skogsträdens mineral-sammansättning vid gödsling. Skogsfakta (Suppl.) 5, 55–60.
Binkley, D. & Högberg, P. (1997) Does atmospheric deposi-tion of nitrogen threaten Swedish forests? Forest Ecologyand Management, 92, 119–152.
Bobbink, R., Hornung, M. & Roelofs, J.G.M. (1998) Theeffects of air-borne nitrogen pollutants on species diversityin natural and semi-natural European vegetation. Journalof Ecology, 86, 717–738.
Bråkenhielm, S. & Liu, Q. (1995) Impact of sulphur and nitro-gen deposition on plant species assemblages in naturalvegetation. Water Air and Soil Pollution, 85, 1581–1586.
Brunet, J., Falkengren-Grerup, U. & Tyler, G. (1996) Herblayer vegetation of south Swedish beech and oak forests –effects of management and soil acidity during one decade.Forest Ecology and Management, 88, 259–272.
Curtin, D., Campbell, C.A. & Jalil, A. (1998) Effects of acidityon mineralization: pH-dependence of organic mattermineralization in weakly acidic soils. Soil Biology andBiogeochemistry, 30, 57–64.
Diekmann, M. (1994) Deciduous forest vegetation in Boreo-nemoral Scandinavia. Acta Phytogeographica Suecica, 80,1–112.
Diekmann, M., Brunet, J., Rühling, Å. & Falkengren-Grerup,U. (1999) Effects of nitrogen deposition: results of a temporal-spatial analysis of deciduous forests in South Sweden. PlantBiology, 1, 471–481.
Diekmann, M. & Falkengren-Grerup, U. (1998) A new spe-cies index for forest vascular plants: development of func-tional indices based on mineralization rates of variousforms of nitrogen. Journal of Ecology, 86, 269–283.
Dierschke, H. (1983) Symphänologische Artengruppensommergrüner Laubwälder und verwandter GesellschaftenMitteleuropas. Verhandlungen der Gesellschaft für Ökologie,11, 71–87.
Dinic, A. & Misic, V. (1975) Experimental study of the effectsof isolation of the root system of spruce fir on the stratum ofherbaceous plants in the community Piceetum-excelsae-serbicum on the mountain Kopaonin. Arhiv BioloskihNauka, 27 (3–4), 155–168.
van Dobben, H.F., ter Braak, C.J.F. & Dirkse, G.M. (1999)Undergrowth as a biomonitor for deposition of nitrogenand acidity in pine forest. Forest Ecology and Management,114, 83–95.
Ellenberg, Heinz (1996) Vegetation Mitteleuropas Mit DenAlpen, 5th edn. Verlag Eugen Ulmer, Stuttgart.
Ellenberg, Hermann (1988) Eutrophierung – Veränderungender Waldbodenvegetation – Folgen für den Rehverbiss unddessen Rückwirkungen auf die Vegetation. SchweizerZeitschrift für Forstwesen, 139, 261–282.
Falkengren-Grerup, U. (1990) Biometric and chemical ana-lysis of five herbs in a regional acid-base gradient in Swedishbeech forest soils. Acta Oecologia, Oecologia Plantarum,11, 755–766.
Falkengren-Grerup, U. (1993) Effects on beech forest speciesof experimentally enhanced nitrogen deposition. Flora,188, 85–91.
Falkengren-Grerup, U. (1995) Long-term changes in floraand vegetation in deciduous forests of southern Sweden.Ecological Bulletins, 44, 215–226.
Falkengren-Grerup, U. (1998) Nitrogen response of herbs andgraminoids in experiments with simulated acid soil solution.Environmental Pollution, 102 (Suppl. 1), 93–99.
Falkengren-Grerup, U., Brunet, J. & Diekmann, M. (1998)Nitrogen mineralisation in deciduous forest soils in southSweden in gradients of soil acidity and deposition. Environ-mental Pollution, 102 (Suppl. 1), 415–420.
Falkengren-Grerup, U. & Tyler, G. (1992) Chemical condi-tions limiting survival and growth of Galium odoratum(L.) Scop. in acid forest soil. Acta Oecologica, 13, 169–180.
Fenn, M.E., Poth, M.A., Aber, J.D., Baron, J.S., Bormann, B.T.,Johnson, D.W., Lemly, A.D., McNulty, S.G., Ryan, D.E. &Stottlemyer, R. (1998) Nitrogen excess in North Americanecosystems: predisposing factors, ecosystem responses, andmanagement strategies. Ecological Applications, 8, 706–733.
Gebauer, G., Rehder, H. & Wollenweber, B. (1988) Nitrate,nitrate reduction and organic nitrogen in plants from dif-ferent ecological and taxonomic groups of Central Europe.Oecologia, 75, 371–385.
Gharbi, A. & Hipkin, C.R. (1984) Studies on nitrate reductasein British angiosperms. I. A comparison of nitrate reduct-ase activity in ruderal, woodland-edge and woody species.New Phytologist, 97, 629–639.
Grime, J.P. (1979) Plant Strategies and Vegetation Processes.John Wiley & Sons, Chichester.
Grime, J.P. & Hunt, R. (1975) Relative growth-rate: its rangeand adaptive significance in a local flora. Journal of Eco-logy, 63, 393–422.
Grime, J.P., Thompson, K., Hunt, R., Hodgson, J.G.,Cornelisson, J.H.C. et al. (1997) Integrated screening valid-ates primary axes of specialisation in plants. Oikos, 79,259–281.
Hallbäcken, L. & Zhang, L. (1998) Effects of experimentalacidification, nitrogen addition and liming on groundvegetation in a mature stand of Norway spruce (Picea abies(L.) Karst.) in SE Sweden. Forest Ecology and Management,108, 201–213.
Havill, D.C., Lee, J.A. & Stewart, G.R. (1974) Nitrate util-ization by species from acidic and calcareous soils. NewPhytologist, 73, 1221–1231.
Högbom, L. & Ohlson, M. (1991) Nitrate assimilation incoexisting vascular plants in mire and swamp forest habi-tats in Central Sweden. Oecologia, 87, 495–499.
Höhne, H. (1962) Vergleichende Untersuchungen über
JEC_639.fm Page 119 Monday, January 28, 2002 6:12 PM
120M. Diekmann & U. Falkengren-Grerup
© 2002 British Ecological Society, Journal of Ecology, 90, 108–120
Mineralstoff- und Stickstoffgehalt sowie Trockensubstanzpro-duktion von Waldbodenpflanzen. Archiv für Forstwesen,11, 1085–1141.
Höhne, H. (1963) Der Mineral- und Stickstoffgehalt vonWaldbodenpflanzen in Abhängigkeit vom Standort. Archivfür Forstwesen, 12, 791–805.
Höhne, H. (1970) Blattanalytische Untersuchungen an einemmit hohen Stickstoffgaben gedüngten Mischbestand.Tagungs-Berichte DAL, 103, 145–165.
Höhne, H. (1978) Untersuchungen über Mineralstoff- undStickstoffgehalt der Flora in einem Waldbestand auf Serpen-tinit im sächsischen Granitgebirge. Flora, 167, 177–196.
Höhne, H., Fiedler, H.J. & Ilgen, G. (1981) Content ofmineral elements in Deschampsia flexuosa as an essentialcomponent in spruce ecosystems. Flora, 171, 199–215.
Janiesch, P. (1973) Ökophysiologische Untersuchungen anUmbelliferen nitrophiler Säume. Oecologia Plantarum, 8,335–352.
Karlsson, T. (1997) Checklist of Swedish vascular plants (inSwedish). Svensk Botanisk Tidskrift, 91, 241–560.
Kellner, O. & Mårshagen, M. (1991) Effects of irrigation andfertilization on the ground vegetation in a 130-year-oldstand of Scots pine. Canadian Journal of Forest Research,21, 733–738.
Kellner, O. & Redbo-Torstensson, P. (1995) Effects of elevatednitrogen deposition on the field-layer vegetation in conifer-ous forests. Ecological Bulletins, 44, 227–237.
Kinzel, H. (1982) Pflanzenökologie und Mineralstoffwechsel.Verlag Eugen Ulmer, Stuttgart.
Kriebitzsch, W.-U. (1978) Stickstoffnachlieferung in saurenWaldböden Nordwest-Deutschlands. Scripta Geobotanica,14, 7–63.
Kuhn, N., Amiet, R. & Hufschmid, N. (1987) Veränderungenin der Waldbodenvegetation der Schweiz infolge Nährstof-fanreicherungen aus der Atmosphäre. Allgemeine Forst-und Jagdzeitung, 158 (5/6), 77–84.
Lagner, J., Persson, C., Robertson, L. & Ullerstig, A. (1996)Air Pollution Assessment Study Using the MATCH Model-ling System – Application to Sulphur and Nitrogen Com-pounds over Sweden, 1994. SMHI RMK Report. SMHIRMK, Norrköping.
Lavorel, S., McIntyre, S. & Grigulis, K. (1999) Plant responseto disturbance in a Mediterranean grassland: how manyfunctional groups? Journal of Vegetation Science, 10, 661–672.
Lavorel, S., McIntyre, S., Landsberg, J. & Forbes, T.D.A.(1997) Plant functional classifications: from general groupsto specific groups based on response to disturbance. Trendsin Ecology and Evolution, 12, 474–478.
Lee, J.A. & Stewart, G.R. (1978) Ecological aspects of nitro-gen assimilation. Advances in Botanical Research, 6, 1–43.
Lindacher, R. (1995) PHANART. Datenbank der Gefässp-flanzen Mitteleuropas. Erklärung der Kennzahlen, Aufbauund Inhalt. Veröffentlichungen des Geobotanischen Institutsder Eidgenössischen Technischen Hochschule, StiftungRübel, Zürich, 125, 1–436.
Liu, Q. & Bråkenhielm, S. (1996) Variability of plant speciesdiversity in Swedish natural forest and its relation to atmos-pheric deposition. Vegetatio, 125, 63–72.
van der Maarel, E. (1979) Transformation of cover-abundancevalues in phytosociology and its effects on communitysimilarity. Vegetatio, 39, 97–114.
Medvecka-Kornas, A. & Gawronski, S. (1991) Acidophilousmixed forests in the Ojcow National Park: thirty years pres-sure of air pollution. Veröffentlichungen des GeobotanischenInstitutes der Eidgenössischen Technischen Hochschule,Stiftung Rübel, Zürich, 106, 174–207.
Meerts, P. (1997) Foliar macronutrient concentrations offorest understorey species in relation to Ellenberg’s indicesand potential relative growth rate. Plant and Soil, 189,257–265.
Müller-Stoll, W.R. (1947) Der Einfluß der Ernährung auf dieXeromorphie der Hochmoorpflanzen. Planta (Berlin), 35,225–251.
Nordin, A., Näsholm, T. & Ericsson, L. (1998) Effects ofsimulated N deposition on understorey vegetation of aboreal coniferous forest. Functional Ecology, 12, 691–699.
Oberdorfer, E. (1990) Pflanzensoziologische Exkursionsflora,6th edn. Verlag Eugen Ulmer, Stuttgart.
Olsson, M.O. & Falkengren-Grerup, U. (2000) Potential nitri-fication as an indicator of preferential uptake of ammo-nium or nitrate by plants in an oak woodland understorey.Annals of Botany, 85, 299–305.
Oredsson, A. (1999) Recent changes in the flora of northernScania, Sweden (in Swedish). Svensk Botanisk Tidskrift, 93,303–326.
Robinson, D. & Rorison, I.H. (1985) A quantitative analysisof the relationship between root distribution and nitrogenuptake from soil by 2 grass species. Journal of Soil Sciences,36, 71–86.
Rodenkirchen, H. (1992) Effects of acidic precipitation, fertil-ization and liming on the ground vegetation in coniferousforests of southern Germany. Water, Air and Soil Pollution,61, 279–294.
Rosén, K., Gundersen, P., Tegnhammar, L., Johansson, M. &Frogner, T. (1992) Nitrogen enrichment of Nordic forestecosystems. The concept of critical loads. Ambio, 21, 364–368.
Rost-Siebert, K. & Jahn, G. (1988) Veränderungen der Wald-bodenvegetation während der letzten Jahrzehnte – Eignungzur Bioindikation von Immissionswirkungen? Forst undHolz, 43 (4), 75–81.
Rothmaler, W. (1986) Exkursionsflora für die Gebiete der DDRund der BRD. Band 4. Kritischer Band, 6th edn. Volk undWissen Volkseigener-Verlag, Berlin.
Thimonier, A., Dupouey, J.L., Bost, F. & Becker, M. (1994)Simultaneous eutrophication and acidification of a forestecosystem in North-East France. New Phytologist, 126,533–539.
Thimonier, A., Dupouey, J.L. & Timbal, J. (1992) Floristicchanges in the herb-layer vegetation of a deciduous forest inthe Lorraine Plain under the influence of atmosphericdeposition. Forest Ecology and Management, 55, 149–167.
Trepl, L. (1982) Zur anthropogenen Beeinträchtigung stadt-naher Wälder. Das Beispiel der Eilenriede bei Hannover.Tuexenia, 3, 195–208.
Tyler, T. & Olsson, K.-A. (1997) Changes in the flora ofScania during the years 1938–96 – a statistical analysis ofthe results of two large-scale surveys (in Swedish). SvenskBotanisk Tidskrift, 91, 143–185.
Received 6 February 2001revision accepted 20 July 2001
JEC_639.fm Page 120 Monday, January 28, 2002 6:12 PM