Embed Size (px)
Citation preview
Alexandria Engineering Journal (2018) 57, 211–221
HO ST E D BY
Alexandria University
Alexandria Engineering Journal
www.elsevier.com/locate/aejwww.sciencedirect.com
Prediction of small hydropower plant power
production in Himreen Lake dam (HLD) using
artificial neural network
* Corresponding author at: Faculty of Electrical & Electronics
Engineering, University Malaysia Pahang, 26600 Pekan, Malaysia.
E-mail addresses: [email protected] (A.T. Hammid),
[email protected] (M.H.B. Sulaiman), [email protected] (A.
N. Abdalla).
Peer review under responsibility of Faculty of Engineering, Alexandria
University.
http://dx.doi.org/10.1016/j.aej.2016.12.0111110-0168 Production and hosting by Elsevier B.V. on behalf of Faculty of Engineering, Alexandria University.This is an open access article under the CC BY-NC-ND license (http://creativecommons.org/licenses/by-nc-nd/4.0/).
Ali Thaeer Hammid a,b,*, Mohd Herwan Bin Sulaiman a, Ahmed N. Abdalla c
aFaculty of Electrical & Electronics Engineering, University Malaysia Pahang, 26600 Pekan, MalaysiabDepartment of Computer Engineering Techniques, Al Yarmouk University College, 32001 Ba’aqubah, Diyala, IraqcFaculty of Engineering Technology, University Malaysia Pahang, 26350 Gambang, Malaysia
Received 11 September 2016; revised 8 December 2016; accepted 15 December 2016Available online 7 January 2017
KEYWORDS
Himreen Lake Dam;
Small Hydropower plants;
Artificial Neural Networks;
Feed forward-back propaga-
tion model;
Generation system’s
prediction
Abstract In developing countries, the power production is properly less than the request of power
or load, and sustaining a system stability of power production is a trouble quietly. Sometimes, there
is a necessary development to the correct quantity of load demand to retain a system of power pro-
duction steadily. Thus, Small Hydropower Plant (SHP) includes a Kaplan turbine was verified to
explore its applicability. This paper concentrates on applying on Artificial Neural Networks
(ANNs) by approaching of Feed-Forward, Back-Propagation to make performance predictions
of the hydropower plant at the Himreen lake dam-Diyala in terms of net turbine head, flow rate
of water and power production that data gathered during a research over a 10 year period. The
model studies the uncertainties of inputs and output operation and there’s a designing to network
structure and then trained by means of the entire of 3570 experimental and observed data. Further-
more, ANN offers an analyzing and diagnosing instrument effectively to model performance of the
nonlinear plant. The study suggests that the ANN may predict the performance of the plant with a
correlation coefficient (R) between the variables of predicted and observed output that would be
higher than 0.96.Production and hosting by Elsevier B.V. on behalf of Faculty of Engineering, Alexandria University. This
is an open access article under the CC BY-NC-ND license (http://creativecommons.org/licenses/by-nc-nd/
4.0/).
1. Introduction
Hydropower golden age was in the first half of the 20th cen-tury before oil control on the force of dominant in the provi-
sion of energy. Several growth republics gradually began toget rid of traditional energy origins that built on oil, coal,and natural gas, owing to oil price increment, fossil fuel cost,thermal pollution and crisis of worldwide energy and renew-
able hydro plants facilitated over conventional [1].
212 A.T. Hammid et al.
Currently, the power demand is growing with all day, whichneed more generation resources and different grid construc-tions. The developing countries that need to get and make
enough resources must achieve load cracking so as to accom-plish stability of the power system. While the load is increas-ing, the generators that coupled to a hydro-turbine begin to
be sluggish affected on changing the output by reducing thefrequency of electrical power. Thus the entire system wouldcollapse; this situation is called blackout or cascaded failure
[2]. Usually, reliability observations of generation systemsregard the resource of energy for the power production asavailable continuously. This indicates that just one cause ofthe power production deficit has been an electrical generation
part fiasco of power plant generally. In the hydropower pro-duction situation, when the reservoir is sufficient to assurethe energy, abundance of power production is over the rule
of the flow rate of water so that this model is right [3].The flow rate of water in discharge gates is a suitable choice
for the optimization difficult and it relies on the relevance
among the capacity of the hydro-turbine in the reservoir andthe water height in the reservoir (hydro-turbine net head).The hydropower production structure is regarded as essential
basics for the accurate modeling of the optimization difficultin Small Hydropower Plants (SHP). The structure links upin the hydropower system let plans on how the water cansmoothly be achieved in all detail of discharges of the hydro-
plant. In power production optimization of hydro-turbine,the relation between the flow rate of water and power produc-tion regarded as complicated and nonlinear; rely on the unit
numbers in operation. It has been gotten more complicatedbecause the system general loss relies on the all units dis-charged in the plant. The behavior and situation of nonlinear-
ity method rely on linear programming success, where one ofthe production path solutions is a mixed integer with linearprogramming model [4].
In fact, the main reason of high reliability on the work ofthe Himreen lake dam Hydropower plant was on the damnot on the river. In spite of the high reliability of actual powerproduction in this hydropower plant, it is unstable due to
change in load demand and flow rate of water inputs to theturbine.
The method in this paper represents the dam flow rate and
net head as variables to hydro turbine inputs and the powerProduction of generator unit was variables of output by usingartificial neural network model. Experimental data (net head,
flow rate and power production) for specific locations in Him-reen lake dam hydropower plant were used as variable input-output parameters. Experimental mathematical analysis hasbeen performed dependable inputs and output values of
Hydropower plant.The problem is how to overcome the complicated relations
that happen between a variety of operations and identify the
dynamic performance of Himreen Lake dam Hydropowerplant by applying an ANN model. Operation and control ofthe specific plant can be succeeded by emerging an ANN
model for making the plant performance prediction relyingon previous observations certain data to product excellenceparameters. Moreover, analysis of hydropower production is
difficult quietly because of the complex existence of nonlinearrelationships in the input variable. Power analyses present anessential part of the plan and process in several works of river-ine resources planning and development.
The target of this work is to discover the artificial neuralnetwork’s ability to predict power generation regarded as themain role in the training the networks and to establish rela-
tionships among input-output hydropower plant through afeed forward with back propagation algorithm. Moreover,the main purpose was to overcome high nonlinear of the speci-
fic system by applying the method of soft computing. Thus,numerous ANN models have been developed properly andtypical parameters are employed to predict the models’ accu-
racy. Owing to the prediction of higher accuracy, among manyArtificial Intelligence (AI) built on soft computing methods,the artificial neural network (ANN) is used widely in specificoperations. Therefore, the Artificial Neural Network (ANN)
gives a fast and flexible passage for integration of data anddevelopment of the model.
2. Small hydropower plants (SHP)
The hydro-turbine obtains mechanic hydropower and changesit to rotational power mechanically and it’s coupled to an elec-
tric power generator. Actually, the turbine efficiency dependson the turbine’s power, the turbine’s type, fluid percentage,etc. Kaplan turbine may be observed that its efficiency is
reaching to the maximum value for a various flow rate ofwater, proving these kinds of turbines can be desirable for ariver with a variant in the regime of water flow rate [3]. The
unit of generating power of a hydropower plant relies on fourfactors which are ground acceleration, the flow rate of water,the height of the water drop and the general efficiency, whichillustrated in Eq. (1)
P ¼ g �Q �H � g ð1ÞP = generated power (KW);
g = ground acceleration;Q = flow water rate (m3/s);
H = net head of Turbine (m);g = general efficiency
In general, the electrical power generators employed inSmall Hydropower Plant (SHP) are synchronous machineswhich generate electrical power by alternating current, where,
this synchronous machine has been strongly linked up with theturbine shaft to convert the mechanical rotational energy intoelectrical power [2,5].
3. Development of artificial neural networks
ANNs are a computing model derived from the brain of thehuman being and system of nervous. ANNs can essentially
simulate regular intelligence since they study skills and makesuperior to other models. Moreover, they are ‘‘data-driven”and contain several numbers of interconnected operation ele-
ments known as neurons [6,7]. They also contain an inputlayer, hidden layer, and output layer respectively. They havethe ability to learn, save and make relevance between inputs
and outputs, which have the capability to be missed from expe-riential procedures [8,9].
The learning operation of ANNs happens by regulating the
weights related to all correlations, and for this reason, the realoutput is corresponding to the wanted output. ANNs areessentially a statistical instrument and regarded as a kind of
Prediction of small hydropower plant power production 213
nonparametric regression model. ANN has been employed tomake a solution to complicated difficulties in lifetime condi-tions by creating a prediction and classification so that they
have been become a real part of models of prediction to applyuncertainty situations [10–12]. Because the instrumentationand measuring are expensive, there are some of necessary
needs to discover another method that makes measuring orprediction accurately. ANN is an active option since it hasan accuracy of prediction sufficiently when making a compar-
ison to classical methods [13].
3.1. Identification and properties of ANN models
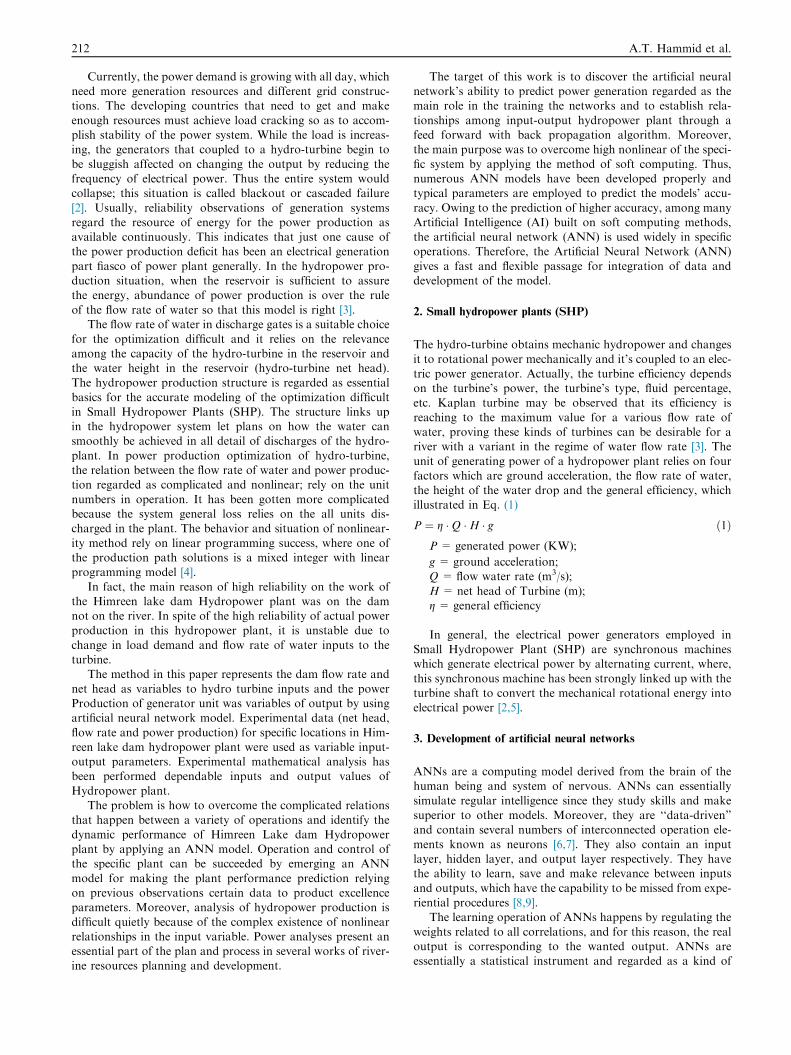
The majority of ANN models consist of three layers, and thearchitecture of these models are input, hidden and output lay-ers as illustrated in Fig. 1. Each layer is additionally formedneurons of the artificial network named as nodes. Allover
well-known parameters’ information is regarded as an inputto the input nodes. In return, these input nodes send forwardthis information to all over hidden layer nodes. Hidden nodes
received the information through overall input nodes and thenthe node of bias in the input layer is gathered as illustrated inEq. (2);
xH ¼Xj¼n
j¼1
whjij þ whbbi; ð2Þ
where XH is the gathered input, Whj is the general weightbetween input and hidden layer, Whb is the general weight
between hidden and bias node of the input layer, ‘b’ is the biasnode of the input layer, and ‘i’ is the input node. Then, math-ematically XH is preceded by using the activation function.There are some of the different types of activation functions
have been employed by several researchers [14,15].
3.2. Network types
The purpose is providing a valuable type model related to solv-ing a problem and proving information engineering. The primestructure of ANN is learning adjustment, generality, paral-
lelization, stiffness, association stored information and pro-cessing information. Thus the more commonly networkemployed in ANNs is the Multi-Layer Perceptron (MLP),
The Single-Layer Perceptron (SLP), and Feed-Forward basedon Back-Propagation (FF-BP) algorithm. The Single-LayerPerceptron (SLP) of the network contains the inputs, hidden
Figure 1 Structure of the ANNs.
and output layers correlated by biases and weights. The neu-ron numbers in the hidden layer of SLP are settled from threeup to twenty-five [16–19].
3.3. The network activation function
The method of mean square error (MSE) is most commonlyused for indication of predicting errors in overall training vec-
tors. It’s very valuable to make comparison among differentmodels and it also illustrates the ability of the network to pre-dict the accurate output. The MSE can be presented as in Eq.
(3).
MSE ¼ 1
n
Xn
i
ðhi � hmÞ2 ð3Þ
where hi and hm are the real and forecasted output valuesrespectively, for all the ith training vectors and N is the entirevalues of training [20]. The Root Mean Square of Error(RMSE) was employed to measure a performance of the net-
work training by using Eq. (4), where hn illustrates the mea-sured value of output and number of training patterns isillustrated by n [21,22].
RMSE ð%Þ ¼ffiffiffiffiffiffiffiffiffiffiffiffiffiffiffiffiffiffiffiffiffiffiffiffiffiffiffiffiffiffiffiPn
1ðhn � hmÞ� �
ðn� 1Þ
sð4Þ
Mean Absolute Error (MAE) was employed to make filter-
ing in the most likely optimal networks on two cases trainingand checking data sets. Training and checking of the networkperformances are resolved by taking the considered outcomes
of the mean absolute error (MAE) as presented in Eq. (5).Obviously, the typical values of RMSE and MAE are zeroor nearly zero [23,24].
MAE ¼ 1
n
Xn
i¼1
jhn � hmj ð5Þ
The correlation coefficient (R2) is widely used to check thepredictions of output accuracy level. It was computed to choicethe best and right network by using Eq. (6) [25].
R2 ¼ 1�
ffiffiffiffiffiffiffiffiffiffiffiffiffiffiffiffiffiffiffiffiffiffiffiffiffiffiffiffiffiffiffiffiffiffiffiffiPn1jðhn � hmÞj2
� �hn
vuut ð6Þ
3.4. Standardizing and normalized data
The neuron numbers in all input-output layers have beenselected corresponding to the designated influences and opera-
tion responses completely. The input and hidden layers havebeen specified a sigmoidal transfer function that was com-monly employed to relationships of complex and nonlinear[26,27]:
fðxUÞ ¼ 1
1þ e�xUð7Þ
where XU is the weighted algebraic summation of inputs intothe transfer function and where the hidden layer working iscomputing the outputs through the inputs and forwarding all
to the output layer as inputs automatically. Eq. (7) wasapproved to be the logarithmic Sigmoid function is the mostcommonly used for neuron activation function and is created

214 A.T. Hammid et al.
for the slope and construction activation of ANNs. Thus, this
makes equilibrium between linear and nonlinear performance.The output variable of the logarithmic sigmoid function is lim-ited from 0 to 1, which is regularly selected by using the signal
whose output variety range is between 0 and 1 [28,29].All vectors in Eq. (8) are normalized function employed to
obtain the feature standards of values between the ranges from0 to 1 before fusion individuality by using all min values and
all max values in normalization method given as follows:
Xi ¼ Xni �minðXnÞmaxðXnÞ �minðXnÞ ð8Þ
where, Xn = (Xn1, . . .,Xnn) and Xi is ith normalized data. Xni isthe ith input data that need to normalize it. Eq. (8) is used asthe mathematical formula is described and employed in the
MATLAB codes were built into the data normalized. Thus,all inputs-outputs data values have been scaled into the rangeof 0–1. The neural network’s prediction was tested by the out-
comes and then made comparing with the real standard anal-ysis data set for the selected duration. Ordinarily, the range ofnormalized amplitude in the neuron output is limited either as
the interval of near item (0–1) or as the optional (�1 to 1). Thelogistic function sufficiently accepts a continual variety of val-ues between (0 and 1), and it’s simply distinguished [30,31].
4. Climate scenarios and flow rate variation in hydropower
production
It should be highlighted that the influence of temperature andrainfall on the flow of water rate for the same month and theprevious ones. In fact reason for this temperature and rainfallfrom the previous period might influence the flow of water rate
in the next period and it would be high because of climatic con-dition influence during a previous period [32].
The investigated flow scenarios were employed to build on
the operational constraints of winter hydropower. During con-sidered period of 1985–2010 hydropower plants stopped 36times, in which 29 times were shut down between 1 and 2 h,
the longest noticed shutdown was 6 h. By using mentionedinformation, the scenarios were investigated built on a set ofshutdown periods of a hydropower plant and the obligatory
shutdown of the upstream hydropower plants.The related influences the stability of the ice cover in the
reaches downstream and the ice and environmental situationsin the upstream reaches of a hydropower plant. The reason for
matter of several shutdowns is that there are limitations onwater upstream during the period of shutdown given to stopan ice breakup in the reaches downstream and following flood
problems downstream in the regulation permit [4,33].
5. Study case and area
Province of Diyala/Iraq has been frequently exposed to severalmajor floods along the Diyala River. There are five times ofmajor floods occurred between the years of 1946–1986. Such
floods usually lead to the human life loss and huge scale dam-age to the agricultural region and properties in the vicinity ofthe rivers. Thus the main purpose of this dam was to put flood
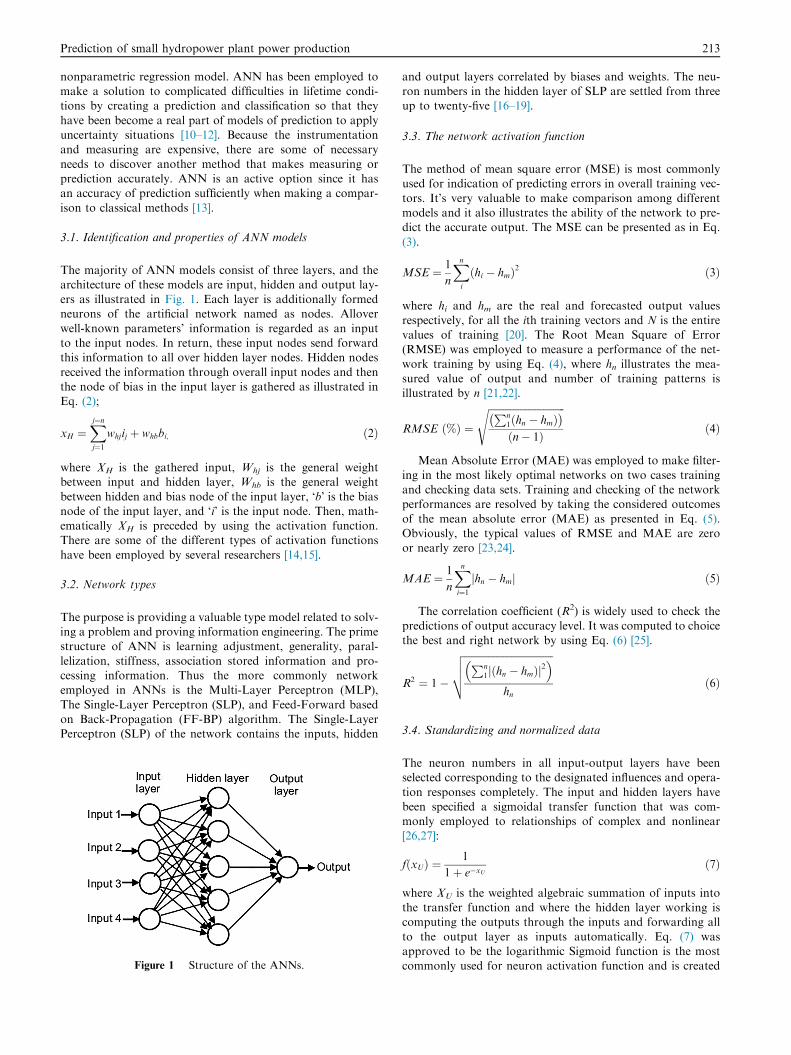
under control, irrigation and hydropower production.The study area was located in Himreen town as illustrated
in Fig. 2. This area is located in the Province of Diyala/Iraq.
The Himreen Dam is a dam at the end of the Himreen moun-tain range that contains Himreen Lake and it is about 100 kmnortheast of Baghdad, Iraq. It is employed to control the water
flow of the Diyala River and its specifications are as follows:Dam Length: 3360 m, maximum height: 40 m, the amount ofdictation: 3.65 million cubic meters of dirt, mud, consisting
of pulp deaf and there to fill the origin of a concrete quantity:150,000 cubic meters of liquefied water.
Structurally, this dam was built between the years of 1986
to 1991 by the Yugoslav company GIK Hidrogradnja (ofSarajevo, now Bosnia-Herzegovina). All the equipments ofthe Himreen hydropower plant such as gates, turbines, gener-ators were also fully completed by the -Yugoslav companies.
This plant consists of two units with a total installed capacityof 50 MW. Its turbine type used is Kaplan; K5S-3.8/3.686 andthe generator type used is three phase synchronous with per-
manent magnet
6. Data set collection and train model
Artificial Neural Networks (ANNs) model was used to developmodel simulations of Himreen Lake dam hydropower Plant.This small hydropower plant is located in Diyala/Iraq that
serves to produce electrical power for feeding power to thepeople beside it.
Measurements of the parameters that include net head, flow
rate, and power production have been collected over a 10 yearperiod, and the obtained data were from 1st January of 2005 to31th December of 2015. This duration was properly acceptableand it includes all seasons, which cover all the different possi-
bilities in the work variables because all over the historical dataare taken out on a daily reading basis. These historical datahave brought and been checked from two ministries (The
two ministries of water resources and electricity in Iraq) sincethe dams and hydropower plants are a related field betweenthese ministries. Thus the data used are reliable due to checked
from two specific destinations.All data are used carefully and there is no delete and negli-
gible for any raw data except little days indicated for cut-off
power transmission lines that are not exceeded to one monthcollectively and its data not taken into consideration are notnoted. The chosen dam covered the ranges of stable irrigationchannels and drains with flow rates of water from 8 m3/s to
175 m3/s as shown in Fig. 3. Net head of turbine from 14.17to 29.84 meters is shown in Fig. 4 and power production from0 to 44,000 KW is shown in Fig. 5. On the other hand the value
of zero generation was due to a very few maintenance workersthat are less mature in the power production safety and theyleave the turbine works as a default with no power production
and water flow through it at very few periods.The weather in all over Iraq may be considered as warm
nicely, and it’s more than 45 Celsius of a summer season. Inreturn, the winter season turns into the cold with the regular
temperature and that goes down to the end of 5 Celsius. Butthere is no time period of snow and frost as shown in Fig. 6.Thus, there is no shutdown of Himreen Hydropower plant
and it can work continuously for all year times.Production data of small hydropower plant (SHP) actually
have a complicated and nonlinear relation, and may be con-
tained irregular and loud data. And the measurement of thevariable data is commonly changed that creates values of unre-
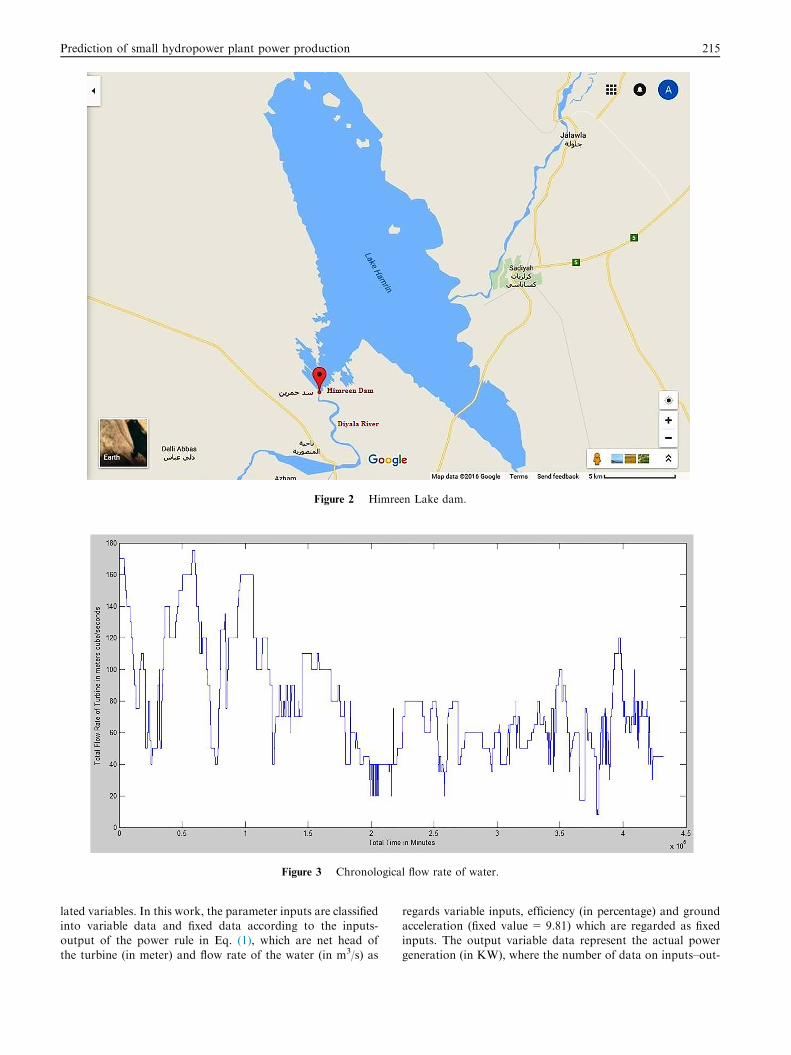
Figure 2 Himreen Lake dam.
Figure 3 Chronological flow rate of water.
Prediction of small hydropower plant power production 215
lated variables. In this work, the parameter inputs are classifiedinto variable data and fixed data according to the inputs-output of the power rule in Eq. (1), which are net head of
the turbine (in meter) and flow rate of the water (in m3/s) as
regards variable inputs, efficiency (in percentage) and groundacceleration (fixed value = 9.81) which are regarded as fixedinputs. The output variable data represent the actual power
generation (in KW), where the number of data on inputs–out-
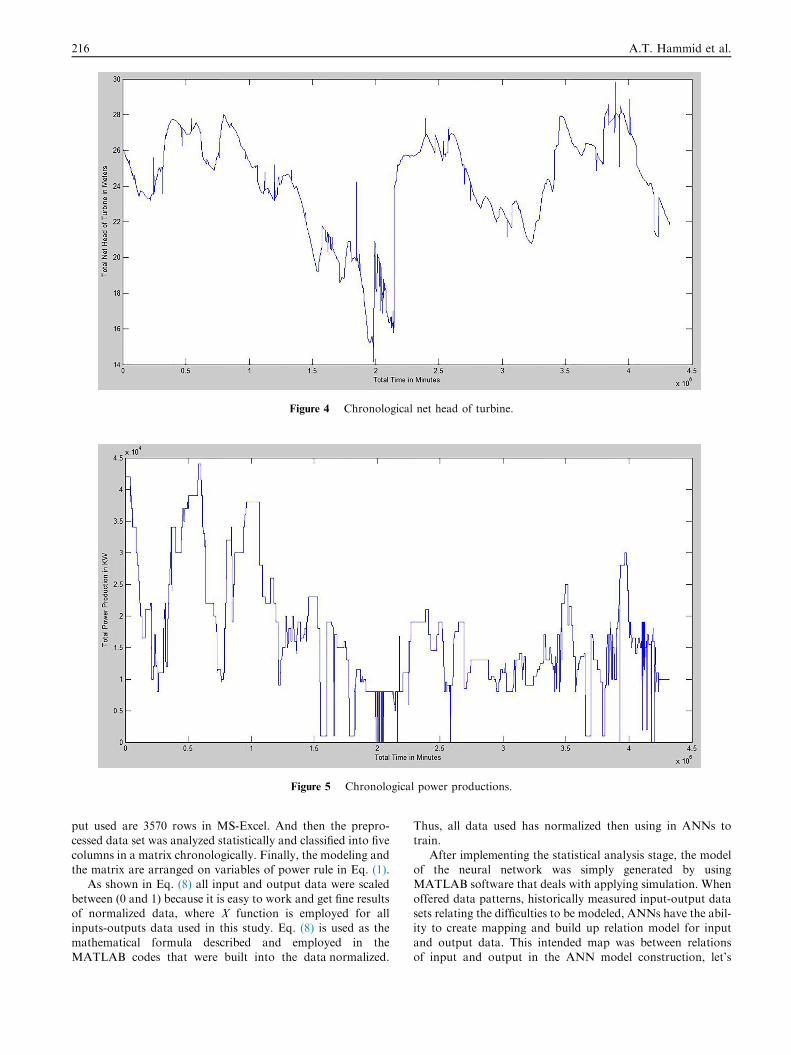
Figure 4 Chronological net head of turbine.
Figure 5 Chronological power productions.
216 A.T. Hammid et al.
put used are 3570 rows in MS-Excel. And then the prepro-cessed data set was analyzed statistically and classified into five
columns in a matrix chronologically. Finally, the modeling andthe matrix are arranged on variables of power rule in Eq. (1).
As shown in Eq. (8) all input and output data were scaled
between (0 and 1) because it is easy to work and get fine resultsof normalized data, where X function is employed for allinputs-outputs data used in this study. Eq. (8) is used as the
mathematical formula described and employed in theMATLAB codes that were built into the data normalized.
Thus, all data used has normalized then using in ANNs totrain.
After implementing the statistical analysis stage, the modelof the neural network was simply generated by usingMATLAB software that deals with applying simulation. When
offered data patterns, historically measured input-output datasets relating the difficulties to be modeled, ANNs have the abil-ity to create mapping and build up relation model for input
and output data. This intended map was between relationsof input and output in the ANN model construction, let’s
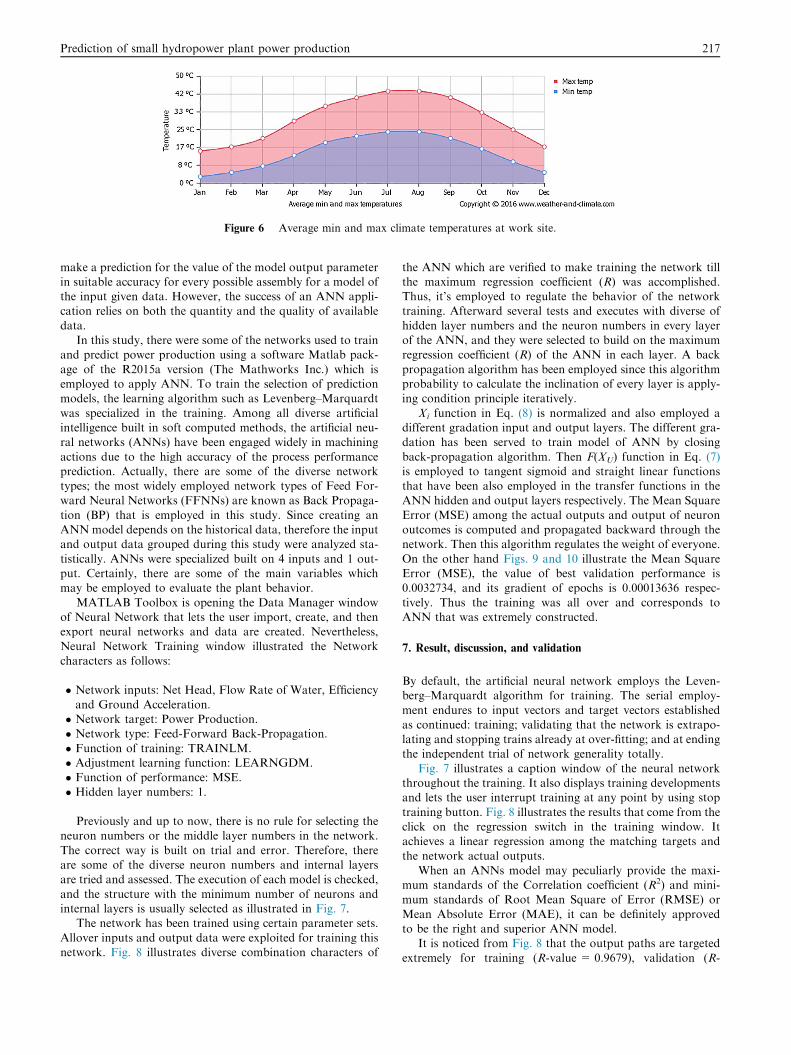
Figure 6 Average min and max climate temperatures at work site.
Prediction of small hydropower plant power production 217
make a prediction for the value of the model output parameterin suitable accuracy for every possible assembly for a model ofthe input given data. However, the success of an ANN appli-cation relies on both the quantity and the quality of available
data.In this study, there were some of the networks used to train
and predict power production using a software Matlab pack-
age of the R2015a version (The Mathworks Inc.) which isemployed to apply ANN. To train the selection of predictionmodels, the learning algorithm such as Levenberg–Marquardt
was specialized in the training. Among all diverse artificialintelligence built in soft computed methods, the artificial neu-ral networks (ANNs) have been engaged widely in machining
actions due to the high accuracy of the process performanceprediction. Actually, there are some of the diverse networktypes; the most widely employed network types of Feed For-ward Neural Networks (FFNNs) are known as Back Propaga-
tion (BP) that is employed in this study. Since creating anANN model depends on the historical data, therefore the inputand output data grouped during this study were analyzed sta-
tistically. ANNs were specialized built on 4 inputs and 1 out-put. Certainly, there are some of the main variables whichmay be employed to evaluate the plant behavior.
MATLAB Toolbox is opening the Data Manager windowof Neural Network that lets the user import, create, and thenexport neural networks and data are created. Nevertheless,
Neural Network Training window illustrated the Networkcharacters as follows:
� Network inputs: Net Head, Flow Rate of Water, Efficiency
and Ground Acceleration.� Network target: Power Production.� Network type: Feed-Forward Back-Propagation.
� Function of training: TRAINLM.� Adjustment learning function: LEARNGDM.� Function of performance: MSE.
� Hidden layer numbers: 1.
Previously and up to now, there is no rule for selecting theneuron numbers or the middle layer numbers in the network.
The correct way is built on trial and error. Therefore, thereare some of the diverse neuron numbers and internal layersare tried and assessed. The execution of each model is checked,
and the structure with the minimum number of neurons andinternal layers is usually selected as illustrated in Fig. 7.
The network has been trained using certain parameter sets.
Allover inputs and output data were exploited for training thisnetwork. Fig. 8 illustrates diverse combination characters of
the ANN which are verified to make training the network tillthe maximum regression coefficient (R) was accomplished.Thus, it’s employed to regulate the behavior of the networktraining. Afterward several tests and executes with diverse of
hidden layer numbers and the neuron numbers in every layerof the ANN, and they were selected to build on the maximumregression coefficient (R) of the ANN in each layer. A back
propagation algorithm has been employed since this algorithmprobability to calculate the inclination of every layer is apply-ing condition principle iteratively.
Xi function in Eq. (8) is normalized and also employed adifferent gradation input and output layers. The different gra-dation has been served to train model of ANN by closing
back-propagation algorithm. Then F(XU) function in Eq. (7)is employed to tangent sigmoid and straight linear functionsthat have been also employed in the transfer functions in theANN hidden and output layers respectively. The Mean Square
Error (MSE) among the actual outputs and output of neuronoutcomes is computed and propagated backward through thenetwork. Then this algorithm regulates the weight of everyone.
On the other hand Figs. 9 and 10 illustrate the Mean SquareError (MSE), the value of best validation performance is0.0032734, and its gradient of epochs is 0.00013636 respec-
tively. Thus the training was all over and corresponds toANN that was extremely constructed.
7. Result, discussion, and validation
By default, the artificial neural network employs the Leven-berg–Marquardt algorithm for training. The serial employ-
ment endures to input vectors and target vectors establishedas continued: training; validating that the network is extrapo-lating and stopping trains already at over-fitting; and at endingthe independent trial of network generality totally.
Fig. 7 illustrates a caption window of the neural networkthroughout the training. It also displays training developmentsand lets the user interrupt training at any point by using stop
training button. Fig. 8 illustrates the results that come from theclick on the regression switch in the training window. Itachieves a linear regression among the matching targets and
the network actual outputs.When an ANNs model may peculiarly provide the maxi-
mum standards of the Correlation coefficient (R2) and mini-mum standards of Root Mean Square of Error (RMSE) or
Mean Absolute Error (MAE), it can be definitely approvedto be the right and superior ANN model.
It is noticed from Fig. 8 that the output paths are targeted
extremely for training (R-value = 0.9679), validation (R-
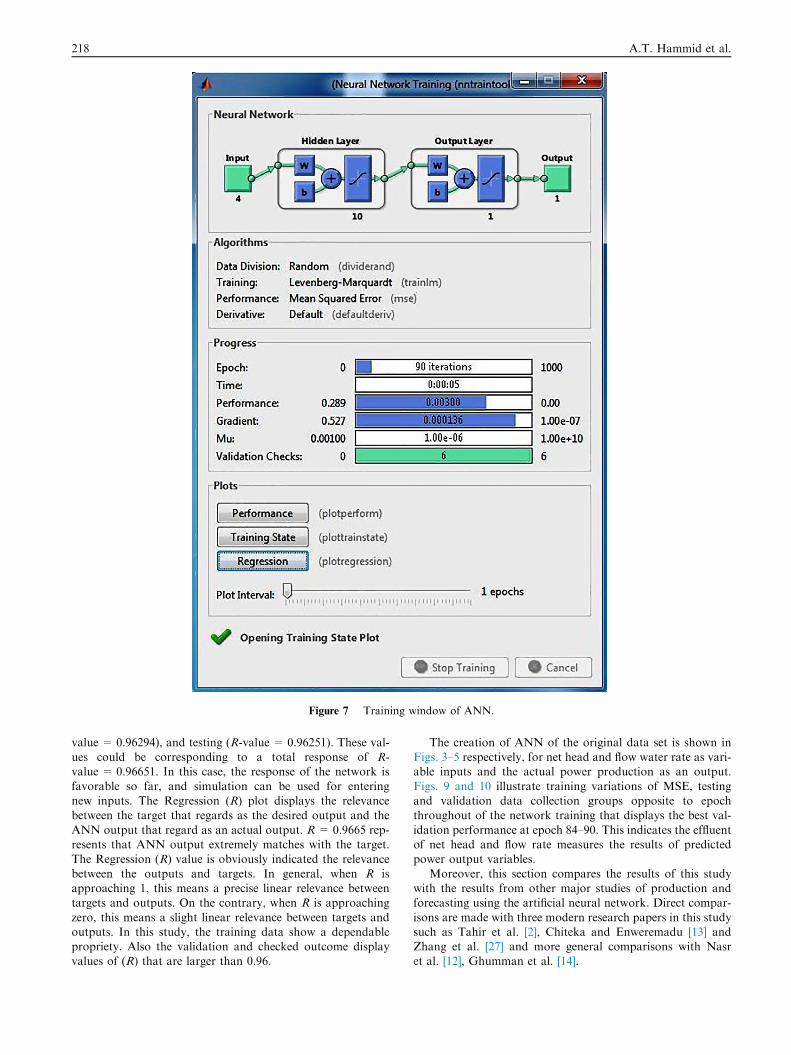
Figure 7 Training window of ANN.
218 A.T. Hammid et al.
value = 0.96294), and testing (R-value = 0.96251). These val-ues could be corresponding to a total response of R-value = 0.96651. In this case, the response of the network is
favorable so far, and simulation can be used for enteringnew inputs. The Regression (R) plot displays the relevancebetween the target that regards as the desired output and the
ANN output that regard as an actual output. R= 0.9665 rep-resents that ANN output extremely matches with the target.The Regression (R) value is obviously indicated the relevance
between the outputs and targets. In general, when R isapproaching 1, this means a precise linear relevance betweentargets and outputs. On the contrary, when R is approaching
zero, this means a slight linear relevance between targets andoutputs. In this study, the training data show a dependablepropriety. Also the validation and checked outcome displayvalues of (R) that are larger than 0.96.
The creation of ANN of the original data set is shown inFigs. 3–5 respectively, for net head and flow water rate as vari-able inputs and the actual power production as an output.
Figs. 9 and 10 illustrate training variations of MSE, testingand validation data collection groups opposite to epochthroughout of the network training that displays the best val-
idation performance at epoch 84–90. This indicates the effluentof net head and flow rate measures the results of predictedpower output variables.
Moreover, this section compares the results of this studywith the results from other major studies of production andforecasting using the artificial neural network. Direct compar-
isons are made with three modern research papers in this studysuch as Tahir et al. [2], Chiteka and Enweremadu [13] andZhang et al. [27] and more general comparisons with Nasret al. [12], Ghumman et al. [14].
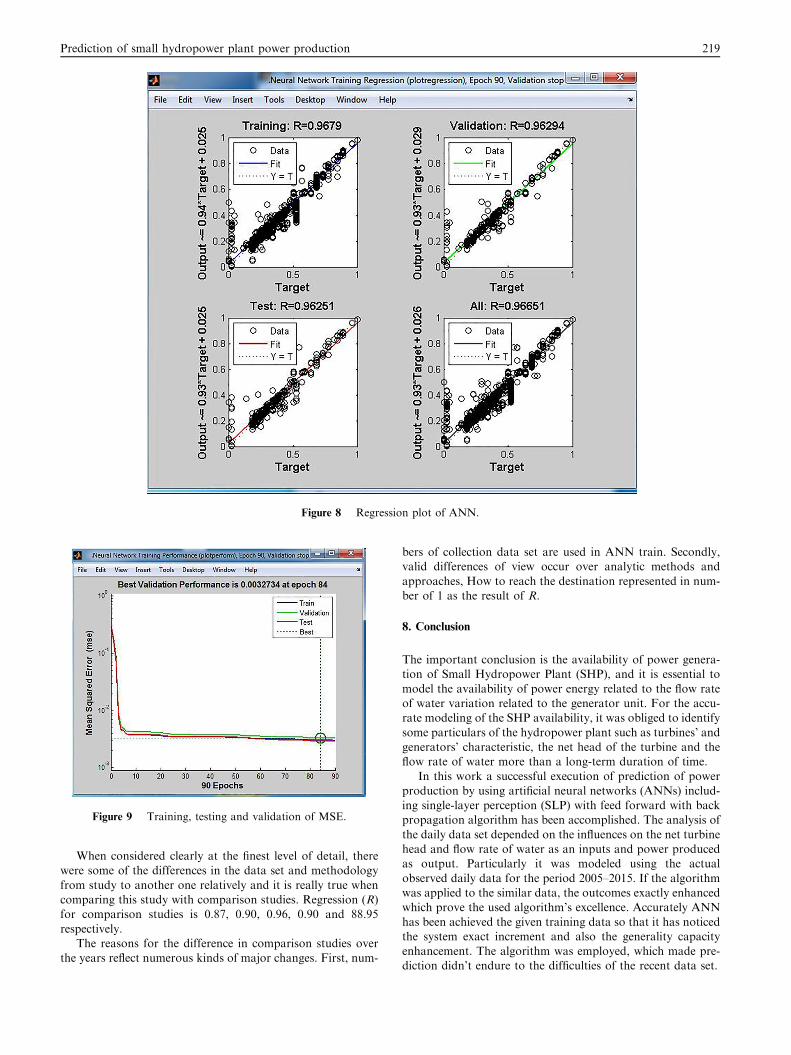
Figure 8 Regression plot of ANN.
Figure 9 Training, testing and validation of MSE.
Prediction of small hydropower plant power production 219
When considered clearly at the finest level of detail, therewere some of the differences in the data set and methodology
from study to another one relatively and it is really true whencomparing this study with comparison studies. Regression (R)for comparison studies is 0.87, 0.90, 0.96, 0.90 and 88.95
respectively.The reasons for the difference in comparison studies over
the years reflect numerous kinds of major changes. First, num-
bers of collection data set are used in ANN train. Secondly,valid differences of view occur over analytic methods and
approaches, How to reach the destination represented in num-ber of 1 as the result of R.
8. Conclusion
The important conclusion is the availability of power genera-tion of Small Hydropower Plant (SHP), and it is essential to
model the availability of power energy related to the flow rateof water variation related to the generator unit. For the accu-rate modeling of the SHP availability, it was obliged to identify
some particulars of the hydropower plant such as turbines’ andgenerators’ characteristic, the net head of the turbine and theflow rate of water more than a long-term duration of time.
In this work a successful execution of prediction of powerproduction by using artificial neural networks (ANNs) includ-ing single-layer perception (SLP) with feed forward with backpropagation algorithm has been accomplished. The analysis of
the daily data set depended on the influences on the net turbinehead and flow rate of water as an inputs and power producedas output. Particularly it was modeled using the actual
observed daily data for the period 2005–2015. If the algorithmwas applied to the similar data, the outcomes exactly enhancedwhich prove the used algorithm’s excellence. Accurately ANN
has been achieved the given training data so that it has noticedthe system exact increment and also the generality capacityenhancement. The algorithm was employed, which made pre-diction didn’t endure to the difficulties of the recent data set.
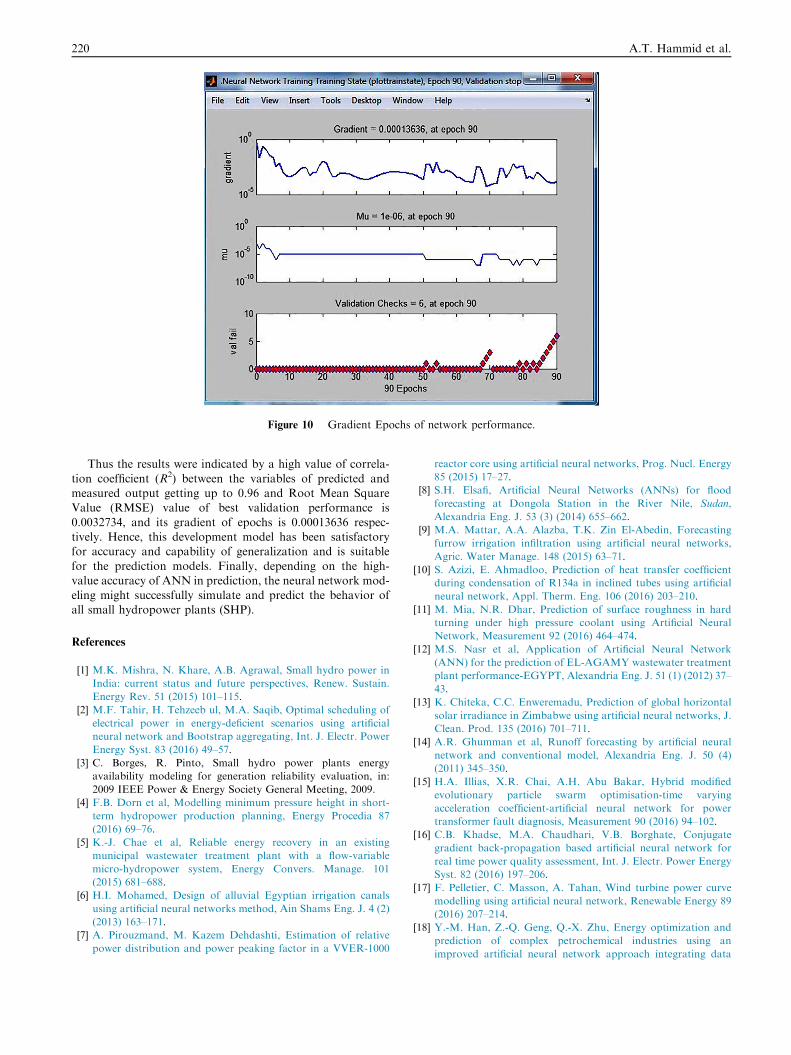
Figure 10 Gradient Epochs of network performance.
220 A.T. Hammid et al.
Thus the results were indicated by a high value of correla-
tion coefficient (R2) between the variables of predicted andmeasured output getting up to 0.96 and Root Mean SquareValue (RMSE) value of best validation performance is
0.0032734, and its gradient of epochs is 0.00013636 respec-tively. Hence, this development model has been satisfactoryfor accuracy and capability of generalization and is suitable
for the prediction models. Finally, depending on the high-value accuracy of ANN in prediction, the neural network mod-eling might successfully simulate and predict the behavior ofall small hydropower plants (SHP).
References
[1] M.K. Mishra, N. Khare, A.B. Agrawal, Small hydro power in
India: current status and future perspectives, Renew. Sustain.
Energy Rev. 51 (2015) 101–115.
[2] M.F. Tahir, H. Tehzeeb ul, M.A. Saqib, Optimal scheduling of
electrical power in energy-deficient scenarios using artificial
neural network and Bootstrap aggregating, Int. J. Electr. Power
Energy Syst. 83 (2016) 49–57.
[3] C. Borges, R. Pinto, Small hydro power plants energy
availability modeling for generation reliability evaluation, in:
2009 IEEE Power & Energy Society General Meeting, 2009.
[4] F.B. Dorn et al, Modelling minimum pressure height in short-
term hydropower production planning, Energy Procedia 87
(2016) 69–76.
[5] K.-J. Chae et al, Reliable energy recovery in an existing
municipal wastewater treatment plant with a flow-variable
micro-hydropower system, Energy Convers. Manage. 101
(2015) 681–688.
[6] H.I. Mohamed, Design of alluvial Egyptian irrigation canals
using artificial neural networks method, Ain Shams Eng. J. 4 (2)
(2013) 163–171.
[7] A. Pirouzmand, M. Kazem Dehdashti, Estimation of relative
power distribution and power peaking factor in a VVER-1000
reactor core using artificial neural networks, Prog. Nucl. Energy
85 (2015) 17–27.
[8] S.H. Elsafi, Artificial Neural Networks (ANNs) for flood
forecasting at Dongola Station in the River Nile, Sudan,
Alexandria Eng. J. 53 (3) (2014) 655–662.
[9] M.A. Mattar, A.A. Alazba, T.K. Zin El-Abedin, Forecasting
furrow irrigation infiltration using artificial neural networks,
Agric. Water Manage. 148 (2015) 63–71.
[10] S. Azizi, E. Ahmadloo, Prediction of heat transfer coefficient
during condensation of R134a in inclined tubes using artificial
neural network, Appl. Therm. Eng. 106 (2016) 203–210.
[11] M. Mia, N.R. Dhar, Prediction of surface roughness in hard
turning under high pressure coolant using Artificial Neural
Network, Measurement 92 (2016) 464–474.
[12] M.S. Nasr et al, Application of Artificial Neural Network
(ANN) for the prediction of EL-AGAMY wastewater treatment
plant performance-EGYPT, Alexandria Eng. J. 51 (1) (2012) 37–
43.
[13] K. Chiteka, C.C. Enweremadu, Prediction of global horizontal
solar irradiance in Zimbabwe using artificial neural networks, J.
Clean. Prod. 135 (2016) 701–711.
[14] A.R. Ghumman et al, Runoff forecasting by artificial neural
network and conventional model, Alexandria Eng. J. 50 (4)
(2011) 345–350.
[15] H.A. Illias, X.R. Chai, A.H. Abu Bakar, Hybrid modified
evolutionary particle swarm optimisation-time varying
acceleration coefficient-artificial neural network for power
transformer fault diagnosis, Measurement 90 (2016) 94–102.
[16] C.B. Khadse, M.A. Chaudhari, V.B. Borghate, Conjugate
gradient back-propagation based artificial neural network for
real time power quality assessment, Int. J. Electr. Power Energy
Syst. 82 (2016) 197–206.
[17] F. Pelletier, C. Masson, A. Tahan, Wind turbine power curve
modelling using artificial neural network, Renewable Energy 89
(2016) 207–214.
[18] Y.-M. Han, Z.-Q. Geng, Q.-X. Zhu, Energy optimization and
prediction of complex petrochemical industries using an
improved artificial neural network approach integrating data
Prediction of small hydropower plant power production 221
envelopment analysis, Energy Convers. Manage. 124 (2016) 73–
83.
[19] A.G.R. Vaz et al, An artificial neural network to assess the
impact of neighbouring photovoltaic systems in power
forecasting in Utrecht, the Netherlands, Renewable Energy 85
(2016) 631–641.
[20] A. Nabavi-Pelesaraei et al, Modeling energy consumption and
greenhouse gas emissions for kiwifruit production using artificial
neural networks, J. Clean. Prod. 133 (2016) 924–931.
[21] R. Olawoyin, Application of backpropagation artificial neural
network prediction model for the PAH bioremediation of
polluted soil, Chemosphere 161 (2016) 145–150.
[22] H.R.R. Ashtiani, P. Shahsavari, A comparative study on the
phenomenological and artificial neural network models to
predict hot deformation behavior of AlCuMgPb alloy, J.
Alloy. Compd. 687 (2016) 263–273.
[23] M. Buyukada, Co-combustion of peanut hull and coal blends:
Artificial neural networks modeling, particle swarm
optimization and Monte Carlo simulation, Bioresour. Technol.
216 (2016) 280–286.
[24] F.-V. Gutierrez-Corea et al, Forecasting short-term solar
irradiance based on artificial neural networks and data from
neighboring meteorological stations, Sol. Energy 134 (2016)
119–131.
[25] E.A. Dil et al, Trace determination of safranin O dye using
ultrasound assisted dispersive solid-phase micro extraction:
Artificial neural network-genetic algorithm and response
surface methodology, Ultrason. Sonochem. 33 (2016) 129–140.
[26] X. Yu, C. Ye, L. Xiang, Application of artificial neural network
in the diagnostic system of osteoporosis, Neurocomputing.
[27] K. Zhang et al, Modeling and optimization of Newfoundland
shrimp waste hydrolysis for microbial growth using response
surface methodology and artificial neural networks, Mar. Pollut.
Bull. 109 (1) (2016) 245–252.
[28] M. Afrand et al, Predicting the viscosity of multi-walled carbon
nanotubes/water nanofluid by developing an optimal artificial
neural network based on experimental data, Int. Commun. Heat
Mass Transfer 77 (2016) 49–53.
[29] H. Mekki, A. Mellit, H. Salhi, Artificial neural network-based
modelling and fault detection of partial shaded photovoltaic
modules, Simul. Model. Pract. Theory 67 (2016) 1–13.
[30] J. Jagtap, M. Kokare, Human age classification using facial skin
aging features and artificial neural network, Cognit. Syst. Res.
40 (2016) 116–128.
[31] Y. Zhang et al, Artificial neural network-genetic algorithm
based optimization for the immobilization of cellulase on the
smart polymer Eudragit L-100, Bioresour. Technol. 101 (9)
(2010) 3153–3158.
[32] S. Kostic, M. Stojkovic, S. Prohaska, Hydrological flow rate
estimation using artificial neural networks: Model development
and potential applications, Appl. Math. Comput. 291 (2016)
373–385.
[33] N. Timalsina, F. Beckers, K. Alfredsen, Modelling winter
operational strategies of a hydropower system, Cold Reg. Sci.
Technol. 122 (2016) 1–9.