Embed Size (px)
Citation preview
Prediction of SINR Improvement with a Directional
Antenna or Antenna Array in a Cellular System
Karthik KS
Department of Electrical Engineering,
Indian Institute of Technology Madras,
Chennai, 600036, India
Email: [email protected]
Bhaskar Ramamurthi
Department of Electrical Engineering,
Indian Institute of Technology Madras,
Chennai, 600036, India
Email: [email protected]
Abstract—We consider a reuse-1 cellular system and study theimprovement in SINR possible for a fixed/nomadic receiver, fromthe use of an optimally oriented directional patch antenna or aUniform Linear Array (ULA) with 2 or 4 antenna elements alongwith Minimum Mean Square Error (MMSE) combining. Weperform the studies with a ray-tracing propagation model as wellas an empirical statistical model that is based on measurementvalues, in an urban macro scenario. The results show that amean improvement of around 5 dB in SINR is possible usingeither the directional antenna or a 2-antenna ULA. In contrast,a 4-antenna ULA gives a mean improvement of around 11 dB.Interestingly, the results are similar with both channel models.
Index Terms—Ray-tracing, SINR, directional antenna, ULA,MMSE, relay.
I. INTRODUCTION
Comprehensive planning is essential for building a mobile
cellular network, especially for the major emerging standards
of the next-generation cellular networks that target high spec-
tral efficiency. Although there is no frequency planning due
to 1:1 spectrum reuse, the locations of base stations and their
configurations and specifications still need to be determined
and an accurate prediction of coverage and capacity is essen-
tial. There exist a number of prediction models which can be
used for this purpose.
One method of estimating the behavior of signals in a
mobile communication system is by the use of a statistical
propagation model. These models are empirically derived
estimates of attenuation and propagation of electromagnetic
waves within the geographical area of the cell. They make use
of various parameters such as building heights, transmitter and
receiver heights, transmitter-receiver distance and frequency.
Since these are empirical models, an accurate characterization
of the environment with precise building data is not taken
into consideration and the prediction for a receiver location
represents only a typical estimate. The cells are characterized
as urban, suburban and rural, and the model parameters are
varied accordingly.
Ray-tracing [1] is a technique that provides a deterministic
estimate of the mobile radio channel at a particular location.
A model of the actual 3-D environment is created and the
physical wave propagation process is modeled. The radiation
emitted by the transmitter is subjected to suitable formulations
of propagation phenomena such as reflection, refraction and
scattering until several multi-path components reach the re-
ceiver. This ray-tracing technique is used, for example, in the
Radio Propagation Simulator1 (RPS) tool in a deterministic
manner using Geometrical Optics and Uniform Theory of
Diffraction.
The emerging wireless cellular networks are likely to re-
use spectrum in every sector (1:1 reuse) in order to maximize
the system spectrum efficiency. This in turn can lead to
a situation where the receivers near the cell edge experi-
ence a poor SINR (Signal-to-Interference-plus-Noise-Ratio)
due to significant Co-Channel Interference (CCI) from the
adjacent cells. One of the ways to increase the SINR for
fixed/nomadic users is to use a directional antenna at the
receiver in order to suppress the CCI from the adjacent cells.
Employing multiple antennas at the receiver and using some
well-known receiver-based techniques such as MinimumMean
Square Error (MMSE) combining also results in interference
suppression [2].
Using ray-tracing technique in a 3-D model of Dresden city,
we find that the number of strong interferers is mostly limited
to 3 or less in a reuse-1 cellular system. Hence significant
improvement in SINR is possible using either a directional
antenna, or a uniform linear array with MMSE combining at
the receiver. The results are compared with the urban macro-
cell scenario of the WINNER (Wireless World Initiative New
Radio) II generic channel model [3].
The emerging cellular networks are expected to have relays
and pico base stations in large numbers [4]. Relays can be
used to address the problem of poor SINR at cell edges.
In this paper, we attempt to obtain insights regarding the
SINR improvement in cellular networks due to the large-
scale deployment of wireless relays using well-known SINR
improvement techniques, with two different channel models.
Both the models are seen to predict similar improvements,
and hence either of the two models can be used to study
deployment-related issues on wireless relays.
The paper is organized as follows. The ray tracing simula-
tion using RPS is introduced in Section II, followed by the
comparison with WINNER model in Section III. The simula-
1Product of Actix GmbH
tion results are discussed in Section IV, before concluding in
Section V.
II. RAY TRACING SIMULATION
The RPS ray tracing simulation algorithms are based on
geometrical optics. The simulator determines the propagation
paths that can contribute to the signal at a given receiver
position. Besides the geometrical calculation, the propagation
loss is determined for each ray separately.
The transmitters and the receivers are placed as points
in a 3-D topographical database. The RPS accesses the 3-
D database and launches a finite number of rays from each
transmitter position into all directions with 1 deg resolution
in the three-dimensional space. When a ray encounters an
obstacle, the radio propagation effects of reflection, diffraction
and scattering are applied by the RPS simulation algorithms
as per the material properties of the obstacles, which are read
from the material property database. Each ray is traced until a
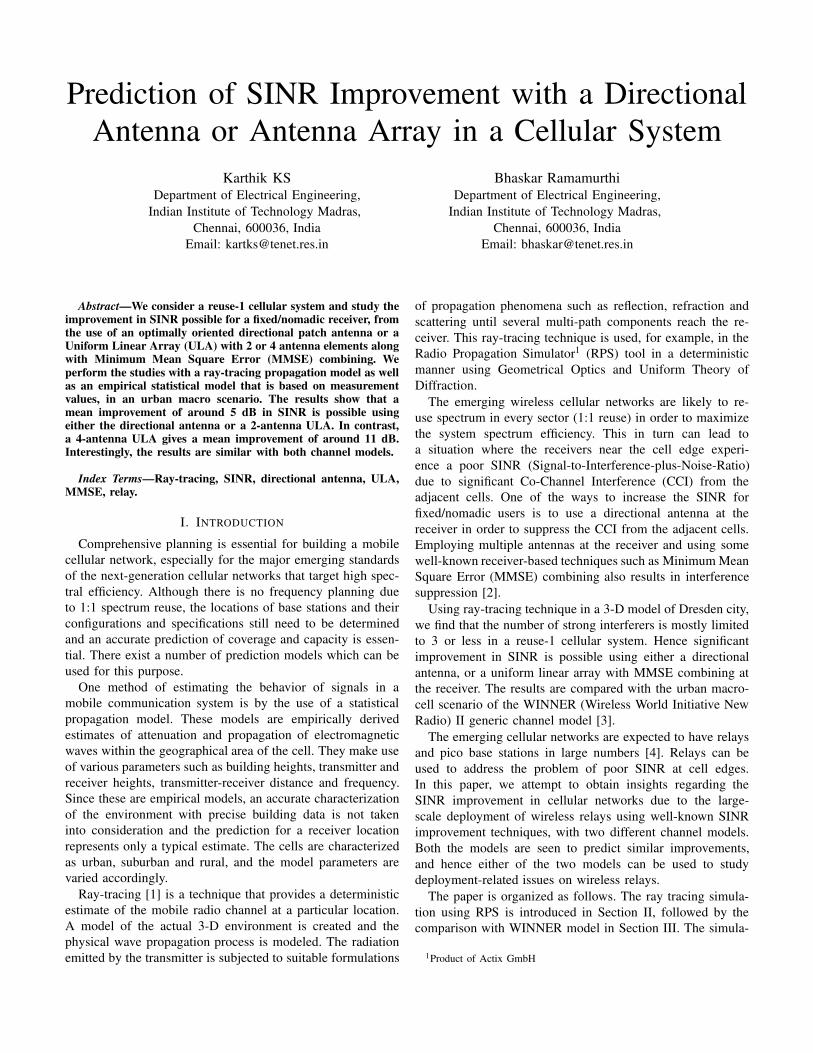
given maximum path loss is exceeded. A part of the Dresden
3-D environment model along with the rays is as shown in
Fig. 1.
Fig. 1. Dresden 3-D model snapshot
The algorithm calculates the properties of the electromag-
netic field, the complex channel gains, Angle of Departure
(AoD), Angle of Arrival (AoA), and Time Delay of Arrival
(TDoA) for every ray of every transmitter-receiver combi-
nation. The effects of the beam patterns of the transmit
and receiver antennas are taken into account by the ray
tracing algorithm during simulation. The result of the ray
tracing algorithm is a time-invariant (single sample point)
complex impulse response of a Single-Input-Single-Output
(SISO) radio channel between a particular pair of transmitter
and receiver, which can be written as:
hSISO =∑
n
βn (1)
where,
βn = αnexp
(
−j2πdn
λ
)
(2)
for a flat-fading channel [5]. Here, n denotes the path index
between transmitter-receiver pair, αn is the attenuation co-
efficient corresponding to the nthpath/ray, dn is the distance
between the transmitter and the receiver on path n, λ is
the carrier wavelength. RPS tool provides the values of βn
for every ray received in every receiver from each of the
transmitters.
The channel impulse response of a Multiple-Input-Multiple-
Output (MIMO) channel is in the form of a matrix and depends
on the antenna configuration that is used in transmitter and the
receiver as described in [6]. Separate placement of individual
antenna elements in the 3-D database, for an antenna array
with elements few centimeters apart from each other as in the
case of ULAs at a receiver, is not feasible since the resolution
is insufficient. Hence, the channel impulse response matrix is
constructed from the SISO channel impulse response (1) using
the plane wave model and the procedure explained in [6]. In
our simulations, we have considered the inter-element distance
of the ULA to be equal to δ = 0.5λ. The channel impulse
response matrix of a receiver with ULA having Nr antenna
elements can be constructed as a vector of length 1xNr as:
h =∑
n
αnexp
(
−j2πdn
λ
)
1
e−j2π∆ cos φn
...
e−j2π∆(Nr−1) cos φn
(3)
where, ∆ is the spacing between the antenna elements
within the ULA normalized w.r.t λ and φ is the angle of the
incoming ray w.r.t the ULA.
Ray tracing simulation using the RPS tool was carried out
for 100 receiver locations in the Dresden environment. The
entire geographical area was covered by 7 base-stations, each
having three sectors each. The sector antennas were oriented
at 120 degrees from each other and were located well above
(about 25 m) the average height of buildings. The sector
antennas used had a 3 dB bandwidth of 70 deg and a gain of
17 dBi, and a down tilt of 12 degrees. The transmitter power
in each sector of the base-station was fixed at 40 dBm. An
inter-site distance of at least 600 m or more was maintained.
The receivers were placed very close to the buildings, in
a random manner with heights varying from 1.5 m to 6.5
m, to simulate placement near windows. The simulation was
performed at 2 GHz center frequency with the channel band-
width set to 180 kHz, with the assumption that the channel is
approximately flat within 180 kHz bandwidth. The bandwidth
of a single Resource Block in the 3GPP LTE standard [7]
is 180 kHz. Rays were launched from every transmitter and
each ray was traced until a maximum path loss of −155 dBm
was reached. After the completion of ray-tracing simulation,
channel impulse responses were calculated as per (1) and the
SINR was calculated as follows for each transmitter-receiver
pair:
SINRik SISO =|hSISOik|
2
∑K
j=1,j 6=k |hSISOij |2 + σ2
(4)
where, SINRik SISO denotes the SINR at the ith receiver
due to kth transmitter, K is the total number of transmitters
which in our simulation is equal to 21 sectors. σ2 denotes
the thermal noise power corresponding to 180 kHz. We had
set the thermal noise level at −174 dBm/Hz. The transmitter
corresponding to the maximum SINR for a particular receiver
is considered as its best serving transmitter/cell.
We first considered omni-directional antennas at the re-
ceivers and performed the ray-tracing simulation. Next the
antennas were changed to directional patch antennas having
a gain of 5.5 dBi. Since the paths of the rays have been traced
already, it is not necessary to repeat the entire simulation
again. Instead, the channel gain co-efficients are re-calculated
taking the receivers’ antenna beam pattern and orientation into
consideration. The SINR was then calculated for each receiver-
transmitter pair using equation (4) by changing the horizontal
orientation of the receiver (i.e, the directional antenna) in
steps of 1 degree. The maximum SINR was taken to be the
SINR for that particular receiver from its serving cell, and
the corresponding angle taken as the best orientation angle. It
should be noted that the best angle is not necessarily in the
direction of the base-station with the strongest signal.
We then calculated the channel impulse response matrix
for a receiver with multiple antenna elements using (3), for
1x2 and 1x4 cases. Using these channel matrices, MMSE
combining was performed at each receiver and post-processing
SINR was calculated.
The tap weights of the MMSE combining receiver are
calculated as given in [2]:
wik = R−1ik hik (5)
where, Rik denotes the co-variance matrix (2x2 or 4x4 accord-
ingly) of the CCI signals at the receiver i with kth transmitter
considered as the serving cell. Rik is given by
Rik =
K∑
j=1,j 6=k
hijhHij + σ2
I. (6)
MMSE post-processing SINR is calculated for each receiver-
transmitter pair using the following formula:
SINRik M = hHikR
−1ik hik (7)
The transmitter corresponding to the maximum SINR for a
particular receiver is considered as its best serving transmit-
ter/cell, which need not be the same as the one found for the
receiver with a single omni-directional antenna.
III. COMPARISON WITH WINNER GENERIC CHANNEL
MODEL
For validating these results, we took the WINNER II generic
channel model with urban macro cell scenario. WINNER II
generic channel model is a geometry-based stochastic model
whose modeling approach is recommended by International
Telecommunication Union (ITU) for the evaluation of Interna-
tional Mobile Communications-Advanced (IMT-A) candidate
radio interface technologies [8]. In this model, the channel
parameters for the individual snapshots are determined in
a stochastic manner, based on the statistical distributions
extracted from several channel sounding measurement cam-
paigns. The distributions are defined for the large-scale param-
eters such as the delay spread, angle spread, shadow fading
etc., and these are drawn randomly from the tabulated distribu-
tions. The small-scale parameters and the channel realizations
are then generated using these values as control parameters.
In the urban macro cell scenario, 100 receivers were
“dropped” at locations having same x-y co-ordinates as was
done for ray-tracing. The base-stations were placed at the same
locations with the same orientation for the sector antennas. The
generic channel model was built as per the steps enumerated
in [3] for four different cases: single omnidirectional antenna
at all the receivers, single directional patch antenna at all
the receivers, and 1x2 and 1x4 ULA MIMO configurations
respectively. For the directional patch antenna, the same an-
tenna pattern was used as in ray-tracing and the orientation
was varied from 0 deg to 359 deg in steps of 1 deg in the
horizontal direction. After obtaining the channel co-efficients,
the best serving-cell SINR was calculated for each receiver-
transmitter pair.
IV. DISCUSSION OF SIMULATION RESULTS
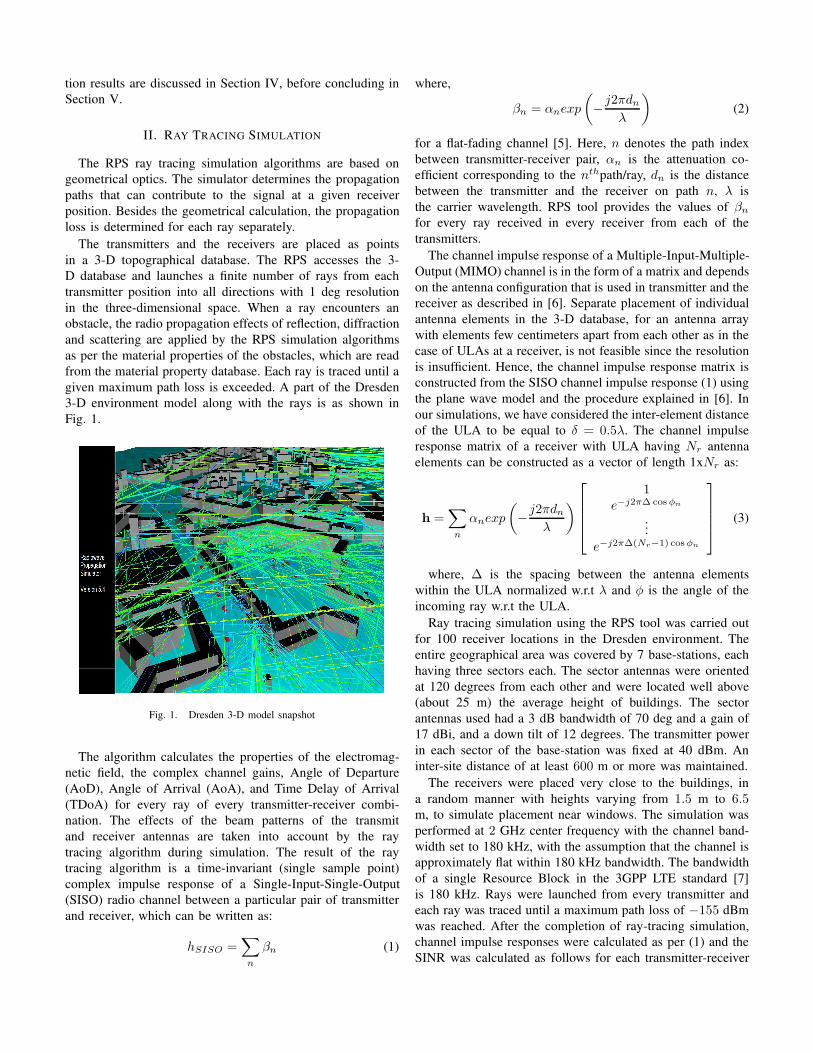
The cdf of SINR of all the receivers with different an-
tenna configurations obtained with both ray-tracing as well
as generic channel model are shown in Fig. 2 and Fig. 3. It
is seen that the ray-tracing and statistical models give very
similar results.
−10 0 10 20 300
0.2
0.4
0.6
0.8
1
SINR in dB
cdf of SINR
Pro
bability[S
INR
≤ a
bscis
sa]
Omnidirectional (RT)
Directional antenna (RT)
Directional antenna (GCM)
Omnidirectional (GCM)
Fig. 2. CDF of SINR of receivers with Ray-Tracing (RT) and WINNERGeneric Channel Model (GCM)

−10 0 10 20 30 40 500
0.2
0.4
0.6
0.8
1
SINR in dB
cdf of SINRP
robability[S
INR
≤ a
bscis
sa]
1x2 ULA + MMSE (RT)
1x4 ULA + MMSE (RT)
1x2 ULA + MMSE (GCM)
1x4 ULA + MMSE (GCM)
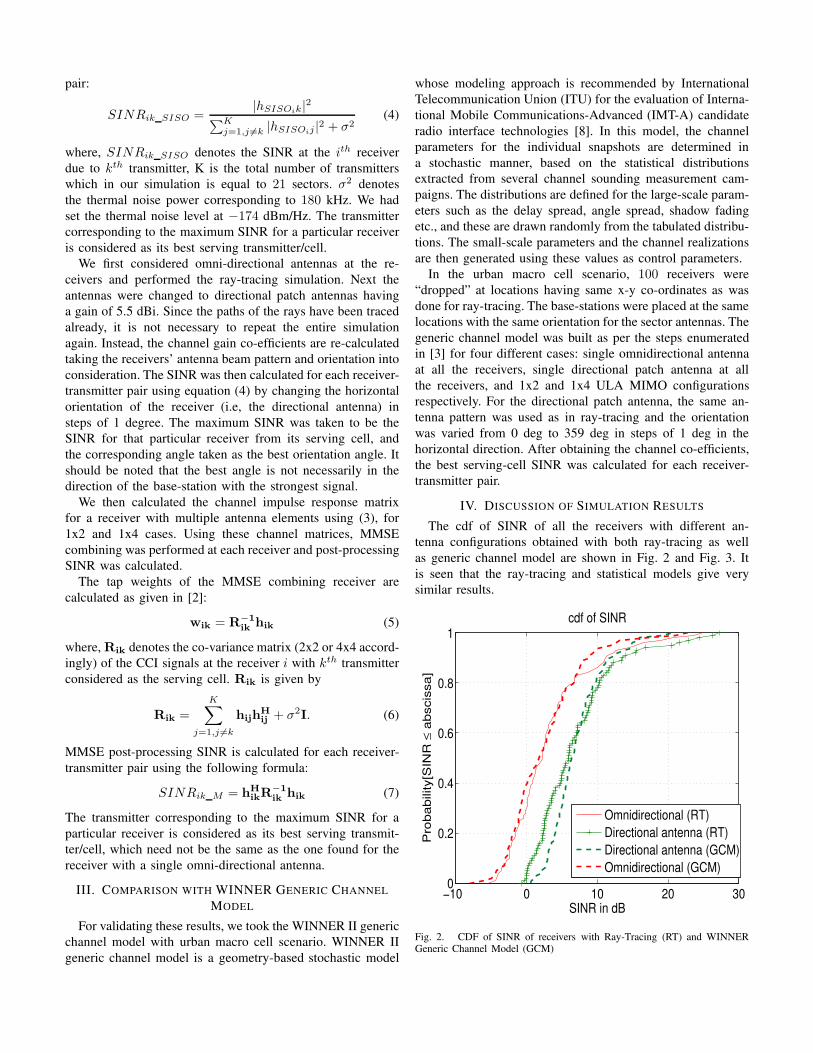
Fig. 3. CDF of SINR of receivers with Ray-Tracing (RT) and WINNERGeneric Channel Model (GCM)
The mean improvement in SINR is around 5 dB for the
directional patch antenna as well as the 1x2 ULA configura-
tion with MMSE combining at the receiver, while the mean
improvement with 1x4 ULA configuration is around 11 dB.
We found that the mean improvement in SINR is similar
in the results obtained from both the ray-tracing technique as
well as WINNER generic channel model. Hence, either of the
two models can be used to study the SINR profiles in reuse-1
cellular system. The cdf of SINR improvement is plotted in
Fig. 4.
0 10 20 30 400
0.2
0.4
0.6
0.8
1
SINR in dB
cdf of improvement in SINR
Pro
ba
bility[S
INR
≤ a
bscis
sa
]
1x2 ULA + MMSE (RT)
1x4 ULA + MMSE (RT)
Directional antenna (RT)
Directional antenna (GCM)
1x2 ULA + MMSE (GCM)
1x4 ULA + MMSE (GCM)
Fig. 4. CDF of improvement in SINR with Ray-Tracing(RT) and WINNERGeneric Channel Model
We see that, the 1x4 ULA followed by MMSE processing at
the receiver provides the best SINR gain in all the investigated
cases. This is not surprising, as it has been shown in [2] that
an N-antenna receiver with MMSE combining can completely
cancel interference if there are N-1 interferers or less(in the
absence of noise). Hence, the 1x4 ULA based receiver with
MMSE combining can cancel upto 3 strong interferers. In
contrast, a 2-element ULA with MMSE processing can cancel
only a single source of interference. The SINR cdf of receivers,
plotted by taking into consideration only the three strongest
interferers and neglecting the remaining interference, showed
that the number of strong interferers is mostly limited to 3 or
less, as seen in Fig. 5. Thus, 1x4 ULA receiver with MMSE
combining can cancel the three strongest interferers most of
the time, thereby giving a significant improvement in SINR.
−10 −5 0 5 10 15 20 25 300
0.2
0.4
0.6
0.8
1
SINR in dB
Pro
ba
bility[S
INR
≤ a
bscis
sa
]
SINR CDF calculated with strong interferers − all with omnidirectional antennas
SINR with all interferers
SINR with 3 strong interferers
SINR with 1 strong interferer
Fig. 5. SINR CDF with ray-tracing with 1, 3 and all interferers respectivelywith omnidirectional antenna
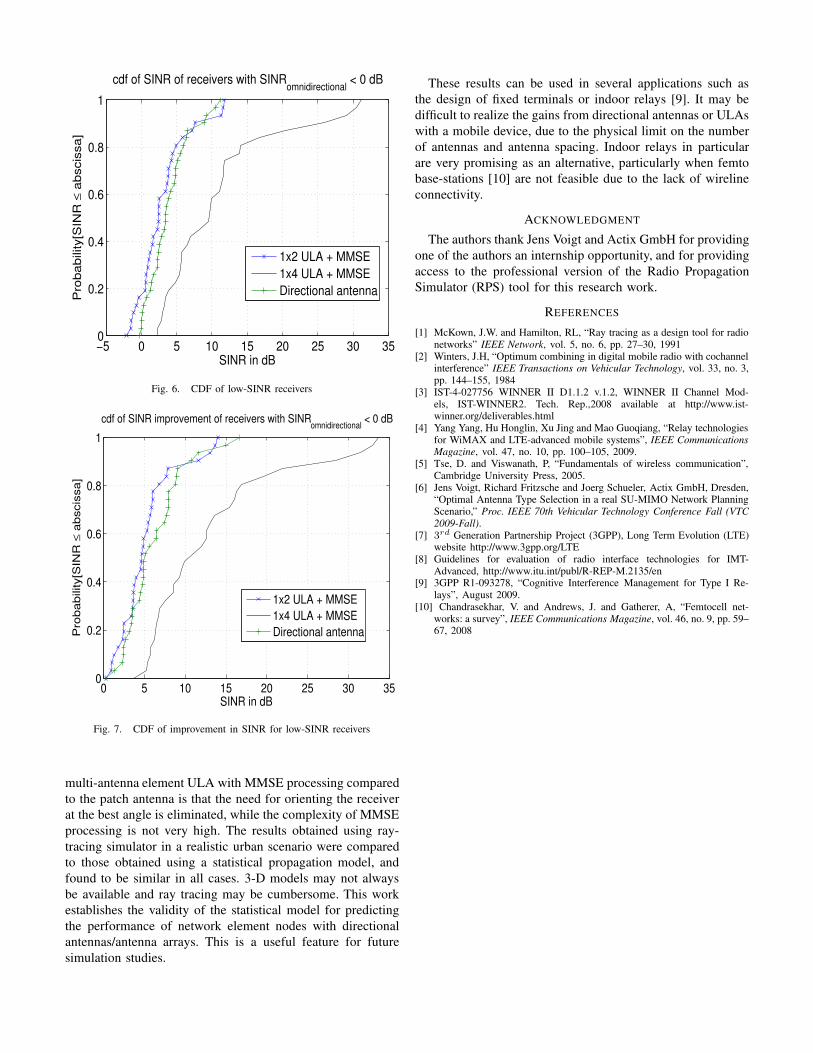
We then plotted the cdf of SINR of receivers with SINR
less than 0 dB with omnidirectional antenna. Typically, one
can expect the cell-edge receivers to have a low SINR. There
is at least a mean improvement of 5 dB for low-SINR receivers
using either 1x2 ULA with MMSE combining or a directional
antenna oriented at the best angle. With 1x4 ULA, the mean
improvement is more than 10 dB. Fig. 6 shows the absolute
SINR cdf for receivers which had a SINRSISO less than 0
dB with an omni-directional antenna, while Fig. 7 shows the
cdf of improvement in SINR for these receivers, compared to
the case with omni-directional SISO receiver antenna.
V. CONCLUSION
Use of a 4-antenna ULA followed by MMSE combining
provides a significant improvement in SINR on the downlink
for fixed/nomadic terminals, while the patch antenna oriented
at the best angle also performs as well as a 2-element ULA
with MMSE combining at the receiver. The advantage of
−5 0 5 10 15 20 25 30 350
0.2
0.4
0.6
0.8
1
SINR in dB
cdf of SINR of receivers with SINRomnidirectional
< 0 dBP
rob
ab
ility[S
INR
≤ a
bscis
sa
]
1x2 ULA + MMSE
1x4 ULA + MMSE
Directional antenna
Fig. 6. CDF of low-SINR receivers
0 5 10 15 20 25 30 350
0.2
0.4
0.6
0.8
1
SINR in dB
cdf of SINR improvement of receivers with SINRomnidirectional
< 0 dB
Pro
ba
bility[S
INR
≤ a
bscis
sa
]
1x2 ULA + MMSE
1x4 ULA + MMSE
Directional antenna
Fig. 7. CDF of improvement in SINR for low-SINR receivers
multi-antenna element ULA with MMSE processing compared
to the patch antenna is that the need for orienting the receiver
at the best angle is eliminated, while the complexity of MMSE
processing is not very high. The results obtained using ray-
tracing simulator in a realistic urban scenario were compared
to those obtained using a statistical propagation model, and
found to be similar in all cases. 3-D models may not always
be available and ray tracing may be cumbersome. This work
establishes the validity of the statistical model for predicting
the performance of network element nodes with directional
antennas/antenna arrays. This is a useful feature for future
simulation studies.
These results can be used in several applications such as
the design of fixed terminals or indoor relays [9]. It may be
difficult to realize the gains from directional antennas or ULAs
with a mobile device, due to the physical limit on the number
of antennas and antenna spacing. Indoor relays in particular
are very promising as an alternative, particularly when femto
base-stations [10] are not feasible due to the lack of wireline
connectivity.
ACKNOWLEDGMENT
The authors thank Jens Voigt and Actix GmbH for providing
one of the authors an internship opportunity, and for providing
access to the professional version of the Radio Propagation
Simulator (RPS) tool for this research work.
REFERENCES
[1] McKown, J.W. and Hamilton, RL, “Ray tracing as a design tool for radionetworks” IEEE Network, vol. 5, no. 6, pp. 27–30, 1991
[2] Winters, J.H, “Optimum combining in digital mobile radio with cochannelinterference” IEEE Transactions on Vehicular Technology, vol. 33, no. 3,pp. 144–155, 1984
[3] IST-4-027756 WINNER II D1.1.2 v.1.2, WINNER II Channel Mod-els, IST-WINNER2. Tech. Rep.,2008 available at http://www.ist-winner.org/deliverables.html
[4] Yang Yang, Hu Honglin, Xu Jing and Mao Guoqiang, “Relay technologiesfor WiMAX and LTE-advanced mobile systems”, IEEE Communications
Magazine, vol. 47, no. 10, pp. 100–105, 2009.[5] Tse, D. and Viswanath, P, “Fundamentals of wireless communication”,
Cambridge University Press, 2005.[6] Jens Voigt, Richard Fritzsche and Joerg Schueler, Actix GmbH, Dresden,
“Optimal Antenna Type Selection in a real SU-MIMO Network PlanningScenario,” Proc. IEEE 70th Vehicular Technology Conference Fall (VTC
2009-Fall).[7] 3
rd Generation Partnership Project (3GPP), Long Term Evolution (LTE)website http://www.3gpp.org/LTE
[8] Guidelines for evaluation of radio interface technologies for IMT-Advanced, http://www.itu.int/publ/R-REP-M.2135/en
[9] 3GPP R1-093278, “Cognitive Interference Management for Type I Re-lays”, August 2009.
[10] Chandrasekhar, V. and Andrews, J. and Gatherer, A, “Femtocell net-works: a survey”, IEEE Communications Magazine, vol. 46, no. 9, pp. 59–67, 2008