Embed Size (px)
Citation preview
ABSTRACT: Watershed and aquatic ecosystem managementrequires methods to predict and understand thermal impacts onstream habitat from urbanization. This study evaluates thermaleffects of projected urbanization using a modeling framework andconsiders the biological implications to the fish community. TheStream Network Temperature Model (SNTEMP) was used in com-bination with the Hydrologic Simulation Program Fortran (HSPF)to assess changes in stream thermal habitat under altered stream-flow, shade, and channel width associated with low, medium, andhigh density urban developments in the Back Creek watershed(Roanoke County, Virginia). Flow alteration by the high densitydevelopment scenario alone caused minimal heating of mean dailysummer base flow (mean +0.1°C). However, when flow changeswere modeled concurrently with reduced shade and increased chan-nel width, mean daily temperature increased 1°C. Maximum dailytemperatures exceeding the state standard (31°C) increased from1.1 to 7.6 percent of the time using summer 2000 climatic condi-tions. Model results suggest that additional urban development willalter stream temperature, potentially limiting thermal habitat andshifting the fish community structure from intolerant to tolerantfish species in Back Creek. More research is needed on the sub-lethal or chronic effects of increased stream temperature regimeson fish, particularly for those species already living in habitats neartheir upper limits.(KEY TERMS: temperature modeling; SNTEMP; HSPF; fish habi-tat; watershed management; aquatic ecosystems; urbanization.)
Krause, Colin W., Brendan Lockard, Tammy J. Newcomb, David Kibler, VinodLohani, and Donald J. Orth, 2004. Predicting Influences of Urban Developmenton Thermal Habitat in a Warm Water Stream. Journal of the American WaterResources Association 40(6):1645-1658.
INTRODUCTION
Stream habitat and aquatic biota may be adverselyaffected by the altered pathways water takes throughan urbanized watershed. Urbanization creates imper-vious and compacted surfaces that increase stormwater runoff and reduce infiltration during stormevents. This in turn impairs ground water rechargeand decreases base flow (Ferguson and Suckling,1990; Horner et al., 1994; Leith and Whitfield, 2000).Reduced base flow can decrease stream habitat avail-ability for fish, desiccate sections of stream, andincrease stream temperature during summer months(Horner et al., 1994; Finkenbine et al., 2000).Increased runoff volume and higher watershed con-veyance causes greater storm flows, more frequentflooding, erosion, channel widening or incision, andloss of shade producing riparian vegetation (Booth,1990; Ferguson and Suckling, 1990; Horner etal.,1994; LeBlanc et al., 1997; Trimble, 1997).Armantrout (1998) defines storm flow as the compo-nent of stream flow representing the flow response toa storm event in excess of base flow; whereas the baseflow component of stream flow is derived from naturalstorage or sources other than rainfall that createssurface runoff.
Water temperatures can become elevated in urban-ized systems and indirectly harm fish by lowering dis-solved oxygen levels and/or increasing contaminanttoxicity (Brooker, 1981; Calow and Petts, 1992). High
1Paper No. 03057 of the Journal of the American Water Resources Association (JAWRA) (Copyright © 2004). Discussions are open untilJune 1, 2005.
2Lab and Research Specialist (Krause) and Department Head (Orth), Department of Fisheries and Wildlife, Virginia Tech University, 100Cheatham Hall, Blacksburg, Virginia 24061; Environmental Engineer (Lockard), Naval Facilities Engineering, P.O. Box 190010, NorthCharleston, South Carolina 29419; Lake Huron Basin Coordinator (Newcomb), MDNR Fisheries Division, P.O. Box 30446, Lansing, Michigan48909; Professor (Kibler), Department of Civil and Environmental Engineering, Virginia Tech University, 221-E Patton Hall, Blacksburg, Vir-ginia 24061; and Assistant Professor (Lohani), Engineering Fundamentals, Virginia Tech University, 332-A Randolph Hall, Blacksburg, Vir-ginia 24061 (E-Mail/Orth: [email protected]).
JOURNAL OF THE AMERICAN WATER RESOURCES ASSOCIATION 1645 JAWRA
JOURNAL OF THE AMERICAN WATER RESOURCES ASSOCIATIONDECEMBER AMERICAN WATER RESOURCES ASSOCIATION 2004
PREDICTING INFLUENCES OF URBAN DEVELOPMENT ONTHERMAL HABITAT IN A WARM WATER STREAM1
Colin W. Krause, Brendan Lockard, Tammy J. Newcomb, David KiblerVinod Lohani, and Donald J. Orth2
temperatures and altered thermal regimes also havethe potential to cause stress, mortality, or shiftspecies assemblages toward tolerant species (Chavin,1973; Reynolds and Casterlin, 1979; Wang et al.,2000). Elevated water temperatures occur due toincreased solar input from channel widening, reducedbase flow, diminished vegetative shading, as well asthermally enhanced runoff that passes over hotimpervious surfaces (Galli, 1990; James and Verspa-gen, 1997; Van Buren et al., 2000). Loss of speciesdiversity has been reported when total imperviousarea exceeds approximately 10 percent of a watershed(Horner et al., 1994; Schueler, 1995; Booth and Jack-son, 1997; Wang et al., 2000, 2001). This level ofimpervious area within a watershed causes streamsystems to become less resilient to negative effects ofurban land uses, thus numbers of fish species decline(Wang et al., 2000).
With the exception of water temperature, theeffects on stream habitat from urban development arewell documented (Galli, 1990; Horner et al., 1994;James and Verspagen, 1997; Finkenbine et al., 2000;Van Buren et al., 2000). Many studies have used orevaluated stream temperature prediction models (Sul-livan et al., 1990; Bartholow, 1991; Hostetler, 1991;Rutherford et al., 1997; Chen et al., 1998a, 1998b), butfew have modeled stream temperature as a result ofurban development (LeBlanc et al., 1997). The com-monly used SNTEMP has been used to assess timberremoval, channel restoration, fish habitat enhance-ment, and hydropower facilities (Lifton, 1985; Wilsonet al., 1987; Waddle, 1989; Sullivan et al., 1990;Bartholow, 1991, 2000). However, previous studiesthat used SNTEMP to predict thermal impacts fromurbanization were not found. While several studiescompare the effects on fish assemblages from urbandevelopment over time, as well as to the amount ofconnected impervious surfaces (Scott et al., 1986;Weaver and Garman, 1994; Schueler, 1995; Onoratoet al., 1998; Newman et al., 1999; Wang et al., 2000,2001), studies connecting urban development tochanges in a fish community from thermal stress areunknown. Thermal stress may be chronic or acuteand while acute stress results in immediate mortality,chronic thermal stress may be one factor contributingto altered fish communities. The goal of this study isto address some of the information gaps betweenurban development and thermal stress by modelingthe thermal effects from urbanization in a warmwater, surface runoff driven stream and consideringthe biological implications to the fish community.
Study Site Description
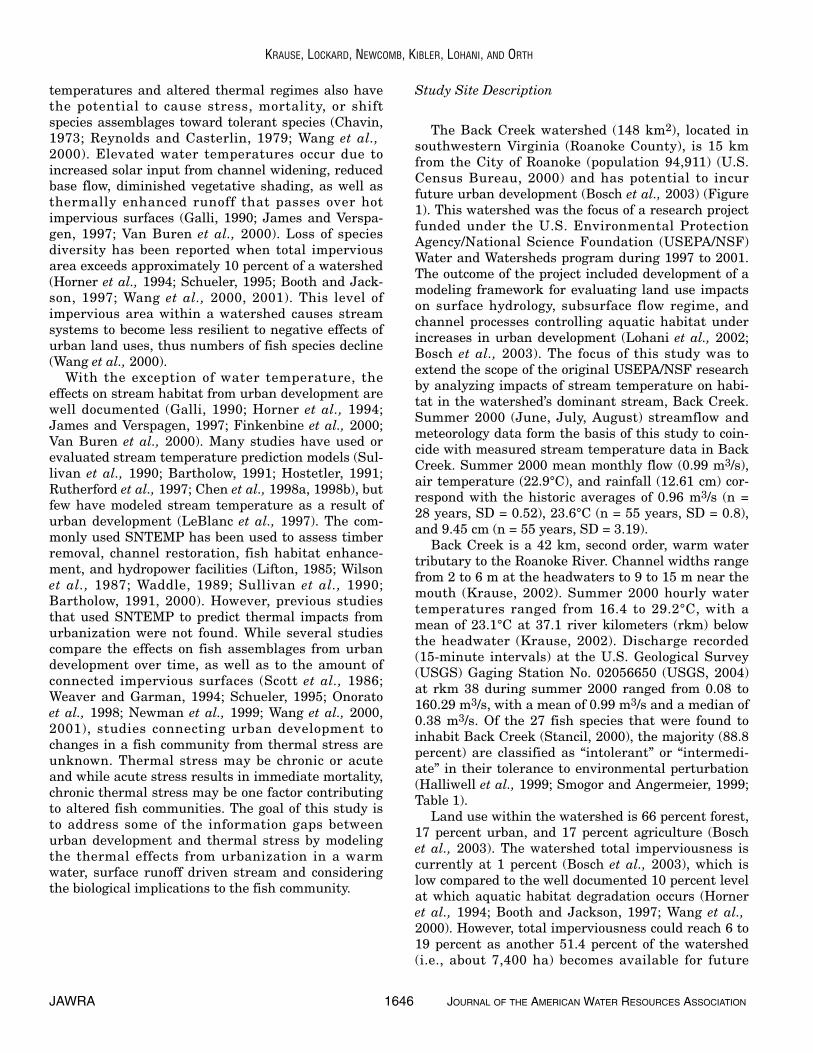
The Back Creek watershed (148 km2), located insouthwestern Virginia (Roanoke County), is 15 kmfrom the City of Roanoke (population 94,911) (U.S.Census Bureau, 2000) and has potential to incurfuture urban development (Bosch et al., 2003) (Figure1). This watershed was the focus of a research projectfunded under the U.S. Environmental ProtectionAgency/National Science Foundation (USEPA/NSF)Water and Watersheds program during 1997 to 2001.The outcome of the project included development of amodeling framework for evaluating land use impactson surface hydrology, subsurface flow regime, andchannel processes controlling aquatic habitat underincreases in urban development (Lohani et al., 2002;Bosch et al., 2003). The focus of this study was toextend the scope of the original USEPA/NSF researchby analyzing impacts of stream temperature on habi-tat in the watershed’s dominant stream, Back Creek.Summer 2000 (June, July, August) streamflow andmeteorology data form the basis of this study to coin-cide with measured stream temperature data in BackCreek. Summer 2000 mean monthly flow (0.99 m3/s),air temperature (22.9°C), and rainfall (12.61 cm) cor-respond with the historic averages of 0.96 m3/s (n =28 years, SD = 0.52), 23.6°C (n = 55 years, SD = 0.8),and 9.45 cm (n = 55 years, SD = 3.19).
Back Creek is a 42 km, second order, warm watertributary to the Roanoke River. Channel widths rangefrom 2 to 6 m at the headwaters to 9 to 15 m near themouth (Krause, 2002). Summer 2000 hourly watertemperatures ranged from 16.4 to 29.2°C, with amean of 23.1°C at 37.1 river kilometers (rkm) belowthe headwater (Krause, 2002). Discharge recorded(15-minute intervals) at the U.S. Geological Survey(USGS) Gaging Station No. 02056650 (USGS, 2004)at rkm 38 during summer 2000 ranged from 0.08 to160.29 m3/s, with a mean of 0.99 m3/s and a median of0.38 m3/s. Of the 27 fish species that were found toinhabit Back Creek (Stancil, 2000), the majority (88.8percent) are classified as “intolerant” or “intermedi-ate” in their tolerance to environmental perturbation(Halliwell et al., 1999; Smogor and Angermeier, 1999;Table 1).
Land use within the watershed is 66 percent forest,17 percent urban, and 17 percent agriculture (Boschet al., 2003). The watershed total imperviousness iscurrently at 1 percent (Bosch et al., 2003), which islow compared to the well documented 10 percent levelat which aquatic habitat degradation occurs (Horneret al., 1994; Booth and Jackson, 1997; Wang et al.,2000). However, total imperviousness could reach 6 to19 percent as another 51.4 percent of the watershed(i.e., about 7,400 ha) becomes available for future
JAWRA 1646 JOURNAL OF THE AMERICAN WATER RESOURCES ASSOCIATION
KRAUSE, LOCKARD, NEWCOMB, KIBLER, LOHANI, AND ORTH
urbanization (Bosch et al., 2003). Approximately 85percent of the length of Back Creek has a riparianbuffer within 10 m of the stream and 57 percent has ariparian buffer within the adjacent 5 m of the stream(as measured in this study). The average riparianvegetation shading density (i.e., average screeningfactor, 0 to 100 percent of shade producing vegetation)throughout Back Creek is 47 percent. Stancil (2000)measured canopy closure in upper, middle, and lowersections of Back Creek at 68, 62, and 51 percent,respectively. Steep topography throughout a largeportion of the Back Creek watershed produces arunoff driven stream characterized by sharp dis-charge peaks in its hydrograph which are closelyassociated with precipitation events.
METHODS
Hydrologic Modeling
Hydrologic changes resulting from urbanization inthe Back Creek watershed were modeled using HSPF (Bicknell et al., 1997). HSPF is a comprehen-sive hydrologic model based upon a compartmental-ized mass balance approach. The model is used for
simulating water quantity and quality processes thatoccur in a watershed as a result of changes in landuse. The channel network within the Back Creekwatershed was divided into ten reaches based on esti-mated travel time through these segments. Exactstart/end points were selected based on tributaryentrances or road crossings. Once the reaches wereselected, subbasin areas were defined and delineated(Figure 1). Land area and average slope were calcu-lated for each subbasin using a geographic informa-tion system (GIS) based watershed delineator (ESRI,1997) which is an extension for ArcView (Version 3.2).Land use data were obtained from the Virginia Geo-graphic Approach to Planning for Biological Diversity(GAP) project. The major classes of land use in GAPdata included deciduous forest, coniferous forest,mixed forest, herbaceous mostly agriculture, openwater, and disturbed/lack of vegetation. Geographicinformation system data layers and techniques wereused to aggregate GAP data layers into four broadcategories (herbaceous/agricultural, forest, mixed,and disturbed). Model calibration effort required twosteps. The first involved adjustments to the size of thelarger storages in an effort to balance the overallwater budget. The second step was to adjust theparameters that partitioned runoff between surfaceand subsurface processes. Initial estimates of key
JOURNAL OF THE AMERICAN WATER RESOURCES ASSOCIATION 1647 JAWRA
PREDICTING INFLUENCES OF URBAN DEVELOPMENT ON THERMAL HABITAT IN A WARM WATER STREAM
Figure 1. Location of Back Creek, Watershed Boundary, and the Ten HSPF Land Segment Divisions in Southwestern Virginia.
model parameters, which varied with land use, werethose used in the upper James River component of theUSEPA Chesapeake Bay model. The model was cali-brated using the USGS/USEPA HSPEXP expert sys-tem using three years of data (1995 to1997). Theexpert system uses an objective calibration sequencebased on error statistics computed from simulatedand observed results for annual flow volume, highand low flow volumes, storm flows, and seasonal vol-ume differences. The performance of the calibratedmodel was then validated with water year 1998 andjudged satisfactory in terms of the same metrics usedfor calibration. Calibration and validation details,
including plots of observed and simulated flows andother related details, can be found in Lohani et al.(2002).
To simulate long term streamflows, the calibratedHSPF model was applied to 43 years of hourly rainfallrecords (water years 1957 to 1999) available from theRoanoke regional airport rain gage (17 km from theBack Creek watershed). Airport rainfall data wereadjusted (using a regression developed from four com-mon years of hourly rainfall) to produce a dataset rep-resentative of rainfall over the Back Creek watershed.Potential evapotranspiration (PET) data were extend-ed from 4 to 43 years using a simple extrapolation
JAWRA 1648 JOURNAL OF THE AMERICAN WATER RESOURCES ASSOCIATION
KRAUSE, LOCKARD, NEWCOMB, KIBLER, LOHANI, AND ORTH
TABLE 1. Proportion, Number Sampled, and Lethal Temperature Limit of Fish Species in Back Creek That are Classifiedas Intolerant, Intolerant/Intermediate Tolerance, Medium Tolerance, and Tolerant to Environmental Perturbations
(Barbour et al., 1999; Halliwell et al., 1999; Smogor and Angermeier, 1999).
LethalProportion Species Classified Into Tolerance Categories Number (˚C)
18.6 Percent Intolerant bluehead chub* (Nocomis leptocephalus) 1,074Roanoke hogsucker* (Hypentelium roanokense) 88golden redhorse (Moxostoma erythrurum) 12northern hogsucker (Hypentelium nigricans) 7brown trout (Salmo trutta) 5 22 to 26rosyside dace (Clinostomus funduloides) 4rainbow trout (Oncorhynchus mykiss) 1 25
2.4 Percent Intolerant/Intermediate** black jumprock* (Moxostoma cervinum) 97riverweed darter* (Etheostoma podostemone) 50v-lip redhorse* (Moxostoma pappillosum) 5Roanoke darter* (Percina roanoka) 2
67.8 Percent Intermediate mountain redbelly dace* (Phoxinus oreas) 1,636fantail darter (Etheostoma flabellare) 1,297crescent shiner* (Luxilus cerasinus) 1,043 31*margined madtom (Noturus insignis) 134swallowtail shiner (Notropis procne) 71 31 to 32redbreast sunfish (Lepomis auritus) 67 36rosefin shiner (Lythrurus ardens) 47johnny darter (Etheostoma nigrum) 26smallmouth bass (Micropterus dolomieu) 9 35largemouth bass (Micropterus salmoides) 1 33 to 36white shiner* (Luxilus albeolus) 1
11.2 Percent Tolerant central stoneroller (Campostoma anomalum) 299white sucker (Catostomus commersoni) 220 29 to 32blacknose dace (Rhinichthys a. atratulus) 192 29yellow bullhead (Ameiurus natalis) 2creek chub (Semotilus atromaculatus) 1 32
**Tolerance information is based on data from other species in the same genus.**The intolerant/intermediate category was created for species that had other species in the same genus with both intolerant and intermedi-**ate tolerance classifications.Note: Sources of temperature criteria are Aho et al. (1986), Brown (1974), Brungs and Jones (1977), Jenkins and Burkhead (1993), McMahon (1982), Raleigh et al. (1984), Stuber (1982), Trial et al. (1983), and Twomey et al. (1984). Proportions were calculated based on fish num-bers sampled by Stancil (2000) at four sites during 1998 and 1999.
procedure based on relative precipitation classifica-tion of each water year (dry, wet, normal year). Fur-ther details on rainfall data adjustment and PET dataextension are given in Lockard (2002). All other modeldata were left unchanged from the original BackCreek four-year model. The extension of the dataallowed evaluation of land use changes on streamflow based on 43 years of simulated hourly flows. Ascenario generator/post processor was developed forthe purpose of creating alternative scenarios of landdevelopment and retrieval/processing the large vol-ume of HSPF output. The post-processor created vari-ous patterns of land development via a user friendlyinterface and displayed the results showing hydrolog-ic response in a tabular fashion. Further details onpost-processor development are given in Lockard etal. (2002).
The SNTEMP Model, Data Collection, and FieldMeasurements
The SNTEMP is a mechanistic, one-dimensionalheat transport model based on an energy balanceequation. The equation predicts mean and maximumdaily water temperature as a function of stream dis-tance and environmental heat flux based on meteoro-logical, discharge, water temperature, streamgeometry, and shade parameters (Theurer et al., 1984;Bartholow, 2000). Meteorological parameters wereobtained from the Roanoke weather station (17 kmfrom Back Creek) via the National Climactic DataCenter (NCDC, 2004). The Cooperative Networks forRenewable Resource Measurements (CONFRRM,2004) in Bluefield, West Virginia, 124 km away, pro-vided solar radiation values while soil temperaturedata were obtained from the Virginia AgriculturalExperiment Station (2004) in Whitethorne, Virginia,57 km from Back Creek. Discharge data were fromthe USGS Gaging Station No. 02056650 located 38rkm below the headwater. Hourly water temperatureswere recorded from July 8, 1999, to February 29,2001, at 3.7, 15.4, and 37.1 rkm below the headwaterfor model calibration and validation, using Onset®
StowAway XTI temperature loggers.Stream width, topographic angle, riparian vegeta-
tion height, shade density, crown width, and offsetfrom stream bank were measured (according to meth-ods outlined in Bartholow, 1989) at 168 random loca-tions along each stream bank from 2.7 to 37.0 rkm.Topographic angle, the angle from the stream surfaceto topographic horizon, was measured with a clinome-ter. Riparian vegetation height was calculated bymeasuring the distance from observer to tree multi-plied by the tangent of the angle from water surfaceto top-of-tree measured with a clinometer. Shade
density was determined by comparing radiant lightenergy measured in foot candles with a light meter in-the-sun versus in-the-shade reflected off a standard-ized surface (e.g., a photographic gray card whichreflects 18 percent of incident white light). Vegetationcrown width and offset from water’s edge were visual-ly estimated and periodically measured to verify esti-mations. Elevation, latitude, longitude, riverkilometer locations, and azimuth were determinedfrom a topographic map. Channel width coefficientand exponent parameters, which enable SNTEMP tovary width according to flow, were calculated with theequation, W = a Qb, where W is width (m), Q is dis-charge (m3/s), and a and b are empirically derivedcoefficients (Bartholow 1989). The width/flow rela-tionship was developed at four locations by measuringwetted width and flow at 3.3, 10.5, and 25.0 rkmusing a Price AA current meter and at 38.0 rkm usingthe USGS gage. This was performed in August 2000,January 2001, and March 2001 to incorporate a rangeof flow levels.
SNTEMP Calibration and Validation
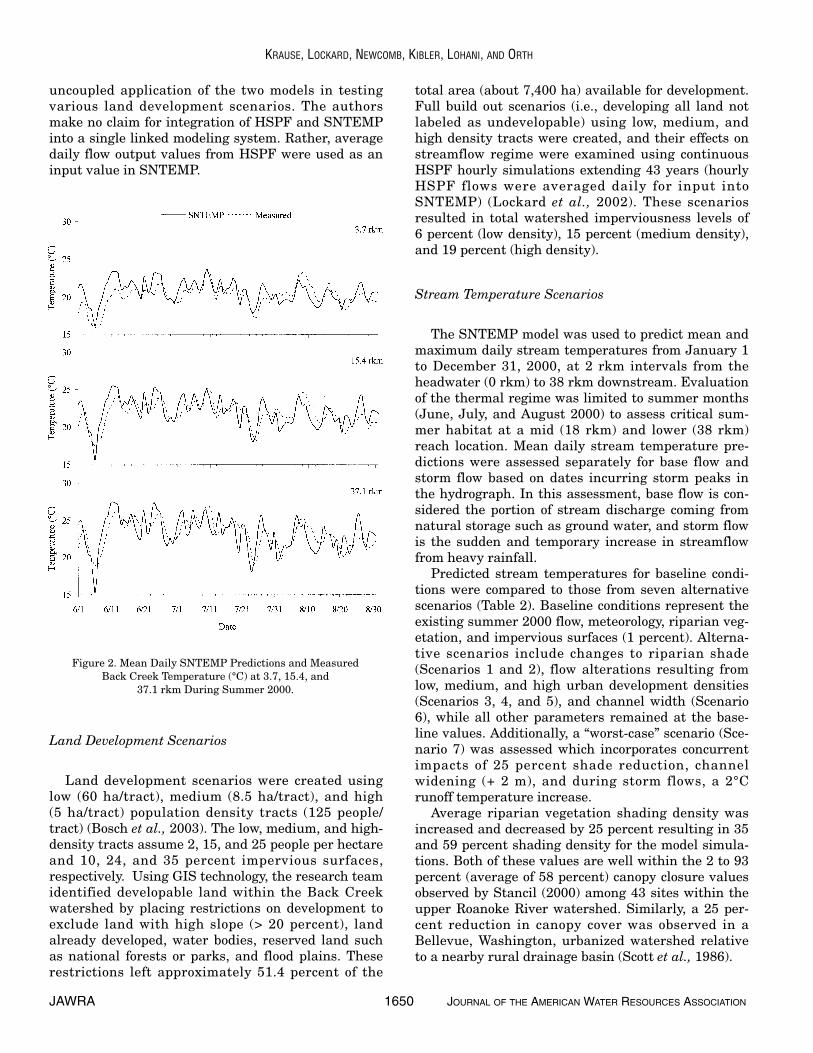
The SNTEMP model was calibrated by systemati-cally adjusting input parameters until the trend ofthe predicted and measured mean daily water tem-perature closely matched when compared graphicallyat the three temperature logger locations (Figure 2).Mean monthly soil temperature was used in place ofthe default mean annual air temperature for the lat-eral inflow temperature parameter. Once calibrated,the mean daily absolute residuals (i.e., absolute valueof the difference between predicted and measuredmean daily temperatures) averaged over June, July,and August 2000 (n = 92 days) were 1.1, 1.1, and1.3˚C and for daily maximum temperatures the abso-lute residuals were 2.0, 2.0, and 2.2˚C at 3.7, 15.4,and 37.1 rkm, respectively.
Model validation was assessed with a one-sided chisquare test, to test for difference between counts ofabsolute residuals (at 37.1 rkm) for the calibratedsummer (1999) and the test summer (2000; Conover,1971). Daily residual values for the two compared sea-sons were placed into either an optimal predictiveability category of 0 to 1˚C or an acceptable categoryof greater than 1 to 3˚C and counts were tested with a2 by 2 contingency table. The predictive ability cate-gories selected for the validation procedure werebased on Bartholow’s (1989) suggested validation cri-teria of 1˚C dispersion error and 1.5˚C maximumerror.
Both HSPF and SNTEMP were calibrated and vali-dated separately and independently using well estab-lished criteria. This approach is consistent with the
JOURNAL OF THE AMERICAN WATER RESOURCES ASSOCIATION 1649 JAWRA
PREDICTING INFLUENCES OF URBAN DEVELOPMENT ON THERMAL HABITAT IN A WARM WATER STREAM
uncoupled application of the two models in testingvarious land development scenarios. The authorsmake no claim for integration of HSPF and SNTEMPinto a single linked modeling system. Rather, averagedaily flow output values from HSPF were used as aninput value in SNTEMP.
Land Development Scenarios
Land development scenarios were created usinglow (60 ha/tract), medium (8.5 ha/tract), and high (5 ha/tract) population density tracts (125 people/tract) (Bosch et al., 2003). The low, medium, and high-density tracts assume 2, 15, and 25 people per hectareand 10, 24, and 35 percent impervious surfaces,respectively. Using GIS technology, the research teamidentified developable land within the Back Creekwatershed by placing restrictions on development toexclude land with high slope (> 20 percent), landalready developed, water bodies, reserved land suchas national forests or parks, and flood plains. Theserestrictions left approximately 51.4 percent of the
total area (about 7,400 ha) available for development.Full build out scenarios (i.e., developing all land notlabeled as undevelopable) using low, medium, andhigh density tracts were created, and their effects onstreamflow regime were examined using continuousHSPF hourly simulations extending 43 years (hourlyHSPF flows were averaged daily for input intoSNTEMP) (Lockard et al., 2002). These scenariosresulted in total watershed imperviousness levels of 6 percent (low density), 15 percent (medium density),and 19 percent (high density).
Stream Temperature Scenarios
The SNTEMP model was used to predict mean andmaximum daily stream temperatures from January 1to December 31, 2000, at 2 rkm intervals from theheadwater (0 rkm) to 38 rkm downstream. Evaluationof the thermal regime was limited to summer months(June, July, and August 2000) to assess critical sum-mer habitat at a mid (18 rkm) and lower (38 rkm)reach location. Mean daily stream temperature pre-dictions were assessed separately for base flow andstorm flow based on dates incurring storm peaks inthe hydrograph. In this assessment, base flow is con-sidered the portion of stream discharge coming fromnatural storage such as ground water, and storm flowis the sudden and temporary increase in streamflowfrom heavy rainfall.
Predicted stream temperatures for baseline condi-tions were compared to those from seven alternativescenarios (Table 2). Baseline conditions represent theexisting summer 2000 flow, meteorology, riparian veg-etation, and impervious surfaces (1 percent). Alterna-tive scenarios include changes to riparian shade(Scenarios 1 and 2), flow alterations resulting fromlow, medium, and high urban development densities(Scenarios 3, 4, and 5), and channel width (Scenario6), while all other parameters remained at the base-line values. Additionally, a “worst-case” scenario (Sce-nario 7) was assessed which incorporates concurrentimpacts of 25 percent shade reduction, channelwidening (+ 2 m), and during storm flows, a 2°Crunoff temperature increase.
Average riparian vegetation shading density wasincreased and decreased by 25 percent resulting in 35and 59 percent shading density for the model simula-tions. Both of these values are well within the 2 to 93percent (average of 58 percent) canopy closure valuesobserved by Stancil (2000) among 43 sites within theupper Roanoke River watershed. Similarly, a 25 per-cent reduction in canopy cover was observed in aBellevue, Washington, urbanized watershed relativeto a nearby rural drainage basin (Scott et al., 1986).
JAWRA 1650 JOURNAL OF THE AMERICAN WATER RESOURCES ASSOCIATION
KRAUSE, LOCKARD, NEWCOMB, KIBLER, LOHANI, AND ORTH
Figure 2. Mean Daily SNTEMP Predictions and MeasuredBack Creek Temperature (°C) at 3.7, 15.4, and
37.1 rkm During Summer 2000.
Despite documentation affirming that urbanizationcauses larger and more frequent discharges whichcause stream channels to enlarge (Horner et al., 1994;Schueler, 1995), literature documenting actual widthchanges resulting from levels of urbanization was notfound. LeBlanc et al. (1997) calculated expected widthenlargement factors for a southern Ontario watershedat 0, 20, 40, 60, and 80 percent urbanization. Usingthe 60 percent urbanized width enlargement factor(1.33) as an estimate for channel width enlargementin Back Creek (currently 17.1 percent urbanized withanother 51.4 percent available for urbanization), cal-culated upstream widths increased 0.7 to 2 m wherepresent widths are 2 to 6 m and downstream widthsincreased 3 to 5 m where present widths are 9 to 15m. Thus the 2 m increase in channel width scenarioposed within this study falls within realistic bound-aries.
Low, medium, and high development densities(Scenarios 3, 4, and 5) were also modeled withincreased runoff temperature to account for thermalheating of runoff passing over warmed impervioussurfaces during storm flows (James and Verspagen,1997; Van Buren et al., 2000). A 1˚C and 2°C increasein runoff temperature was modeled based on VanBuren et al. (2000) who recorded a 1.9˚C and 3.6°C
difference between the average afternoon runoff tem-perature over a parking lot (24.9°C) and an outfallsewer before entering a stream (23.0°C) and from theupstream catchment (21.3°C). Hourly stream temper-ature increases up to 6.6°C occurred during stormflows in a Pennsylvania urbanized system studied byLieb and Carline (2000). Though there is no parame-ter specifically for overland runoff temperature in theSNTEMP model, the lateral inflow temperatureparameter was adjusted to reflect warmed runoff. TheSNTEMP model documentation recommends thatmean annual air temperature (a surrogate for groundwater temperature) be used for the lateral inflow tem-perature parameter. However, the Back CreekSNTEMP model required soil temperature (a surro-gate for overland runoff temperature) to enable cor-rect predictions, thus, adjustment of the lateral inflowtemperature parameter was assumed a reasonableapproximation of increased runoff temperature.
A “drought year” flow scenario was also modeledfor the baseline condition and all alternative scenar-ios. Year 2000 flows were reduced by 18.5 percent,corresponding to the lowest mean annual flowobserved in 43 years of simulated Back Creek flowrecords. Only flow was altered and not meteorologicaldata so that the effect of one parameter could beobserved.
Evaluation of Potential Biological Implications
In absence of a predictive tool for fish communityresponse to thermal alterations, single species valuesfor known lethal temperatures were assessed alongwith their tolerance rating for persisting in impairedenvironments. The proportion of time that the Vir-ginia Department of Environmental Quality (VADEQ)water quality standards for warm water streams wereexceeded was also evaluated.
RESULTS
Flow Changes From Development Level
Flow regimes predicted by HSPF for increasedurban development densities, caused reduced baseflows and increased storm flows (Table 3). Changes inflow occurred from the increase in impervious area,causing rainfall that would have provided rechargeover a longer time period to reach the stream morequickly as overland runoff. Medium and high densitydevelopment patterns (Scenarios 4 and 5) caused thelargest reduction in mean base flow (-0.1 m3/s; 11 per-
JOURNAL OF THE AMERICAN WATER RESOURCES ASSOCIATION 1651 JAWRA
PREDICTING INFLUENCES OF URBAN DEVELOPMENT ON THERMAL HABITAT IN A WARM WATER STREAM
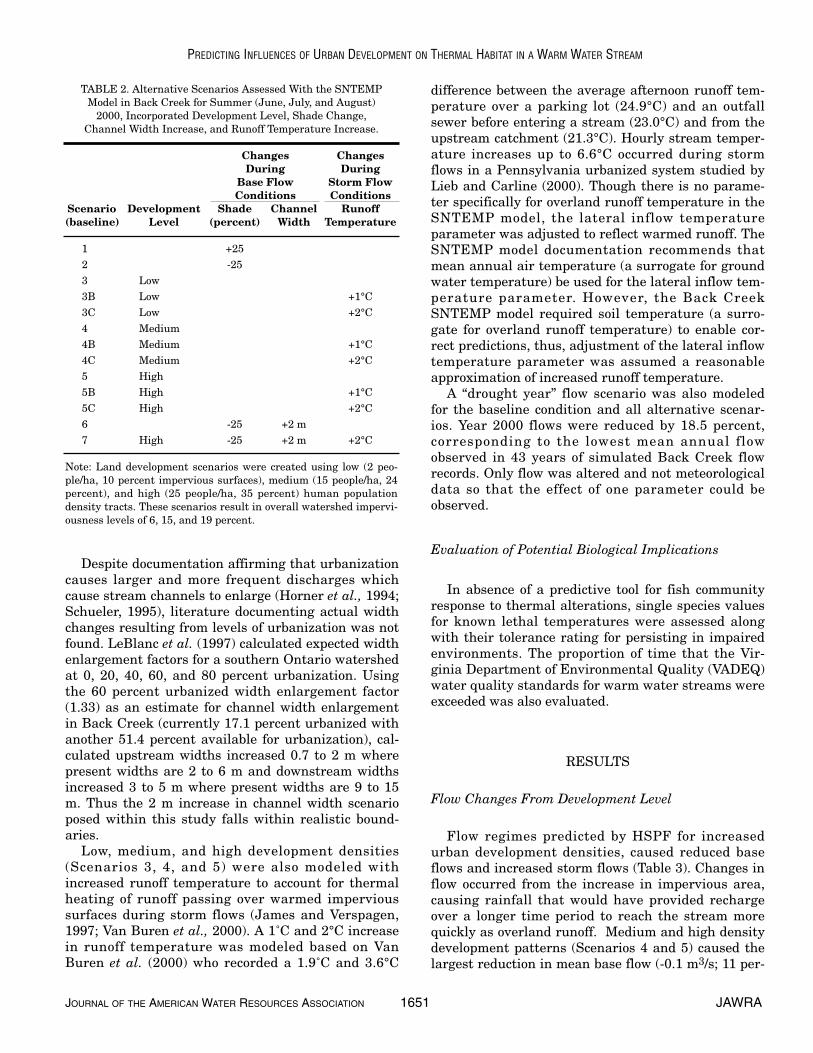
TABLE 2. Alternative Scenarios Assessed With the SNTEMPModel in Back Creek for Summer (June, July, and August)
2000, Incorporated Development Level, Shade Change,Channel Width Increase, and Runoff Temperature Increase.
Changes ChangesDuring During
Base Flow Storm FlowConditions Conditions
Scenario Development Shade Channel Runoff(baseline) Level (percent) Width Temperature
1 +252 -253 Low3B Low +1°C3C Low +2°C4 Medium4B Medium +1°C4C Medium +2°C5 High5B High +1°C5C High +2°C6 -25 +2 m7 High -25 +2 m +2°C
Note: Land development scenarios were created using low (2 peo-ple/ha, 10 percent impervious surfaces), medium (15 people/ha, 24percent), and high (25 people/ha, 35 percent) human populationdensity tracts. These scenarios result in overall watershed impervi-ousness levels of 6, 15, and 19 percent.
cent reduction) and high density development (Sce-nario 5) caused the largest increase in mean stormflow (+ 1.4 m3/s; 82 percent increase) from baselineconditions averaged over summer 2000 (Table 3).Reduced flow, simulating a drought year, loweredsummer averaged base flow from 0.9 m3/s to 0.8 m3/sand average storm flow from 1.7 m3/s to 1.4 m3/s(Table 3).
Temperature Model Calibration and Validation
There was no statistical difference (p = 0.43)between counts of residuals in the optimal and accept-able error categories for summer 1999 and summer2000. Thus the model was considered valid and capa-ble of producing acceptable results with scenarioapplications. Though solar radiation and soil temper-ature were not locally measured, SNTEMP success-fully calibrated with high predictive ability.
Alternative Stream Temperature Scenarios
Shade and Channel Width. A decrease in shade(-25 percent, Scenario 2) resulted in an increase (+0.7°C) in mean daily stream temperature duringsummer base flow conditions at 18 rkm, while a 25percent increase in shade (Scenario 1) resulted in a decrease of 0.7°C (Table 4). The magnitude of temperature change resulting from shade declined
downstream (e.g., 38 rkm) and during storm flows(Table 4). This trend was consistent in the majority ofthe assessed alternative scenarios and is due togreater water volume in downstream reaches. Whenshade reduction was combined with increased channelwidth (Scenario 6), mean daily stream temperaturewas further increased (+0.9°C during base flow condi-tions at 18 rkm, Table 4).
Urban Development Densities. Stream temper-ature increased under scenarios representing increas-ing development density. During base flow conditions,medium and high density development (Scenarios 4and 5) caused the greatest increase in mean dailytemperature (+0.1°C at 18 rkm; Table 4). The reducedbase flow from lowered infiltration and ground waterrecharge led to a smaller volume of water in thestream which is more easily altered thermally than alarger volume of water. During storm flows, mediumand high density development (Scenarios 4 and 5)decreased mean daily temperatures (-0.3 ˚C and -0.4°C, respectively, at 18 rkm) with no change underlow density development (Scenario 3). However, ifrunoff during storm flows was warmed by the imper-vious surfaces, stream temperature increased. Forexample, Scenario 3B (runoff +2°C) caused a 0.8°Cincrease in mean daily temperature during summerstorm flows at 18 rkm (Table 4). An unexpected resultwas the larger temperature change that occurred withlow, rather than high density development, whenrunoff temperature was increased. This is due to less-er volumes of water in the channel during storm flows
JAWRA 1652 JOURNAL OF THE AMERICAN WATER RESOURCES ASSOCIATION
KRAUSE, LOCKARD, NEWCOMB, KIBLER, LOHANI, AND ORTH
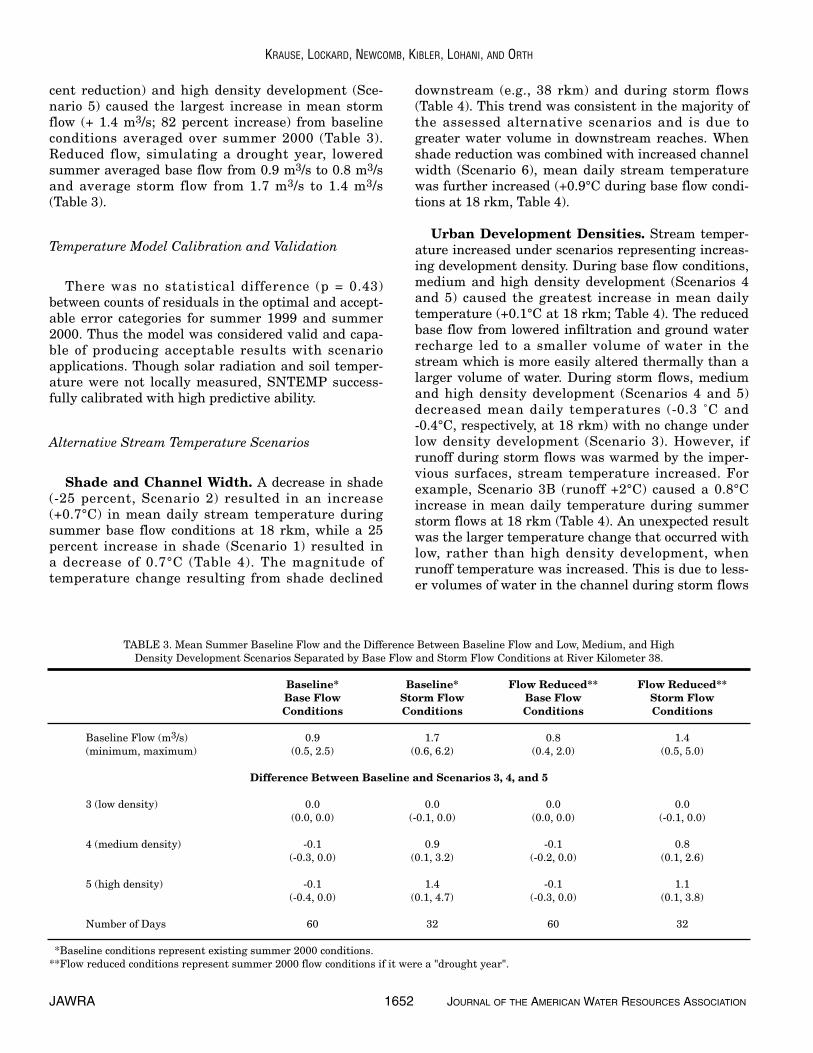
TABLE 3. Mean Summer Baseline Flow and the Difference Between Baseline Flow and Low, Medium, and HighDensity Development Scenarios Separated by Base Flow and Storm Flow Conditions at River Kilometer 38.
Baseline* Baseline* Flow Reduced** Flow Reduced**Base Flow Storm Flow Base Flow Storm FlowConditions Conditions Conditions Conditions
Baseline Flow (m3/s) 0.9 1.7 0.8 1.4(minimum, maximum) (0.5, 2.5) (0.6, 6.2) (0.4, 2.0) (0.5, 5.0)
Difference Between Baseline and Scenarios 3, 4, and 5
3 (low density) 0.0 0.0 0.0 0.0(0.0, 0.0) (-0.1, 0.0) (0.0, 0.0) (-0.1, 0.0)
4 (medium density) -0.1 0.9 -0.1 0.8(-0.3, 0.0) (0.1, 3.2) (-0.2, 0.0) (0.1, 2.6)
5 (high density) -0.1 1.4 -0.1 1.1(-0.4, 0.0) (0.1, 4.7) (-0.3, 0.0) (0.1, 3.8)
Number of Days 60 32 60 32
**Baseline conditions represent existing summer 2000 conditions.**Flow reduced conditions represent summer 2000 flow conditions if it were a "drought year".
under the low density Scenarios 3A and 3B and theassumption that the Back Creek watershed is runoffdriven.
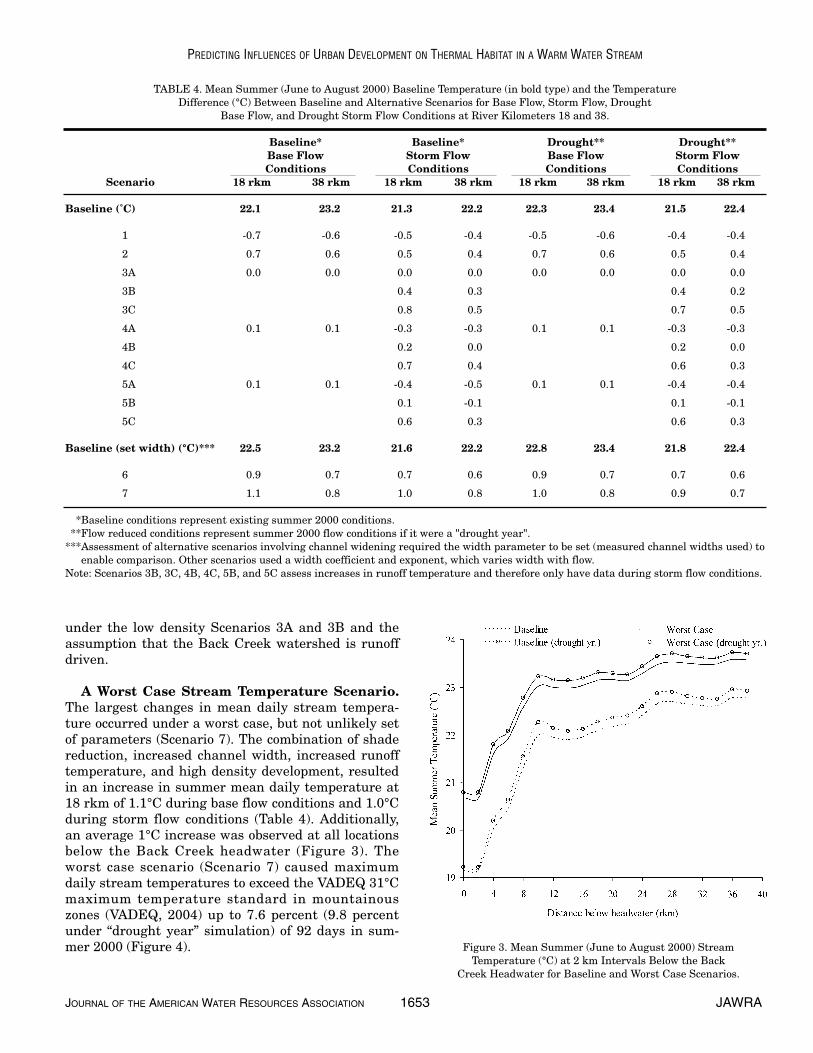
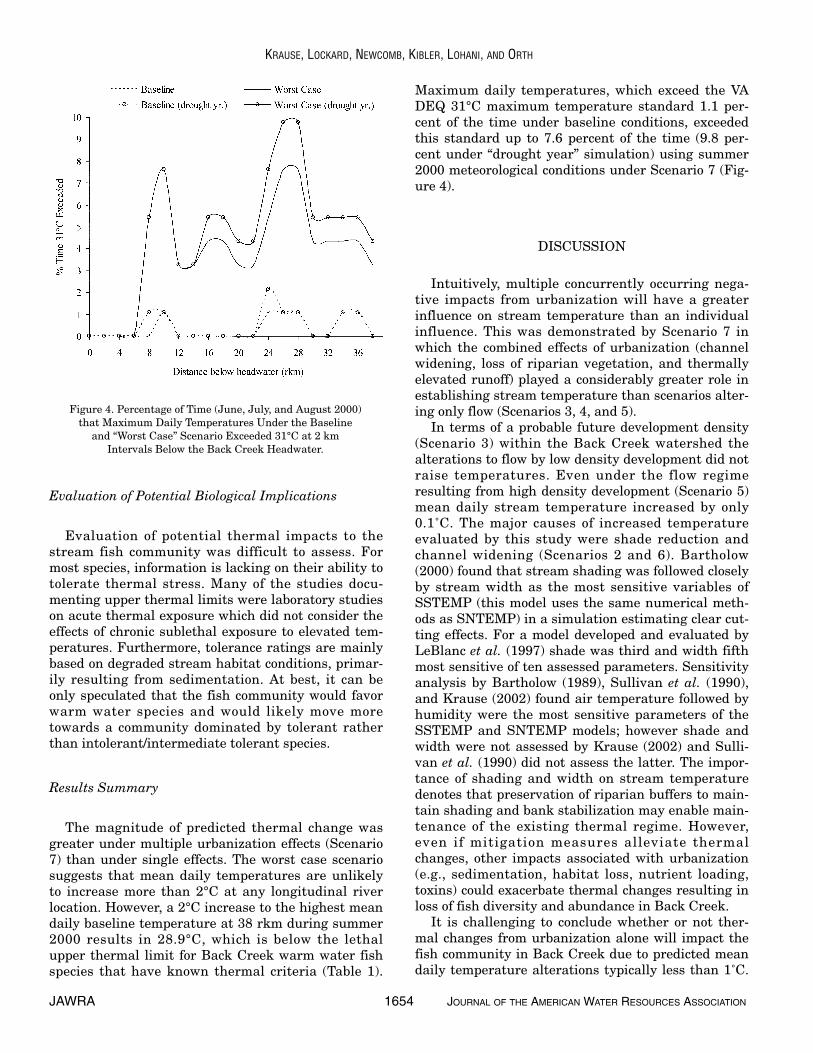
A Worst Case Stream Temperature Scenario.The largest changes in mean daily stream tempera-ture occurred under a worst case, but not unlikely setof parameters (Scenario 7). The combination of shadereduction, increased channel width, increased runofftemperature, and high density development, resultedin an increase in summer mean daily temperature at18 rkm of 1.1°C during base flow conditions and 1.0°Cduring storm flow conditions (Table 4). Additionally,an average 1°C increase was observed at all locationsbelow the Back Creek headwater (Figure 3). Theworst case scenario (Scenario 7) caused maximumdaily stream temperatures to exceed the VADEQ 31°Cmaximum temperature standard in mountainouszones (VADEQ, 2004) up to 7.6 percent (9.8 percentunder “drought year” simulation) of 92 days in sum-mer 2000 (Figure 4).
JOURNAL OF THE AMERICAN WATER RESOURCES ASSOCIATION 1653 JAWRA
PREDICTING INFLUENCES OF URBAN DEVELOPMENT ON THERMAL HABITAT IN A WARM WATER STREAM
TABLE 4. Mean Summer (June to August 2000) Baseline Temperature (in bold type) and the TemperatureDifference (°C) Between Baseline and Alternative Scenarios for Base Flow, Storm Flow, Drought
Base Flow, and Drought Storm Flow Conditions at River Kilometers 18 and 38.
Baseline* Baseline* Drought** Drought**Base Flow Storm Flow Base Flow Storm FlowConditions Conditions Conditions Conditions
Scenario 18 rkm 38 rkm 18 rkm 38 rkm 18 rkm 38 rkm 18 rkm 38 rkm
Baseline (˚C) 22.1 23.2 21.3 22.2 22.3 23.4 21.5 22.4
1 -0.7 -0.6 -0.5 -0.4 -0.5 -0.6 -0.4 -0.4
2 0.7 0.6 0.5 0.4 0.7 0.6 0.5 0.4
3A 0.0 0.0 0.0 0.0 0.0 0.0 0.0 0.0
3B 0.4 0.3 0.4 0.2
3C 0.8 0.5 0.7 0.5
4A 0.1 0.1 -0.3 -0.3 0.1 0.1 -0.3 -0.3
4B 0.2 0.0 0.2 0.0
4C 0.7 0.4 0.6 0.3
5A 0.1 0.1 -0.4 -0.5 0.1 0.1 -0.4 -0.4
5B 0.1 -0.1 0.1 -0.1
5C 0.6 0.3 0.6 0.3
Baseline (set width) (°C)*** 22.5 23.2 21.6 22.2 22.8 23.4 21.8 22.4
6 0.9 0.7 0.7 0.6 0.9 0.7 0.7 0.6
7 1.1 0.8 1.0 0.8 1.0 0.8 0.9 0.7
***Baseline conditions represent existing summer 2000 conditions.***Flow reduced conditions represent summer 2000 flow conditions if it were a "drought year".***Assessment of alternative scenarios involving channel widening required the width parameter to be set (measured channel widths used) to ***enable comparison. Other scenarios used a width coefficient and exponent, which varies width with flow.Note: Scenarios 3B, 3C, 4B, 4C, 5B, and 5C assess increases in runoff temperature and therefore only have data during storm flow conditions.
Figure 3. Mean Summer (June to August 2000) StreamTemperature (°C) at 2 km Intervals Below the Back
Creek Headwater for Baseline and Worst Case Scenarios.
Evaluation of Potential Biological Implications
Evaluation of potential thermal impacts to thestream fish community was difficult to assess. Formost species, information is lacking on their ability totolerate thermal stress. Many of the studies docu-menting upper thermal limits were laboratory studieson acute thermal exposure which did not consider theeffects of chronic sublethal exposure to elevated tem-peratures. Furthermore, tolerance ratings are mainlybased on degraded stream habitat conditions, primar-ily resulting from sedimentation. At best, it can beonly speculated that the fish community would favorwarm water species and would likely move moretowards a community dominated by tolerant ratherthan intolerant/intermediate tolerant species.
Results Summary
The magnitude of predicted thermal change wasgreater under multiple urbanization effects (Scenario7) than under single effects. The worst case scenariosuggests that mean daily temperatures are unlikelyto increase more than 2°C at any longitudinal riverlocation. However, a 2°C increase to the highest meandaily baseline temperature at 38 rkm during summer2000 results in 28.9°C, which is below the lethalupper thermal limit for Back Creek warm water fishspecies that have known thermal criteria (Table 1).
Maximum daily temperatures, which exceed the VADEQ 31°C maximum temperature standard 1.1 per-cent of the time under baseline conditions, exceededthis standard up to 7.6 percent of the time (9.8 per-cent under “drought year” simulation) using summer2000 meteorological conditions under Scenario 7 (Fig-ure 4).
DISCUSSION
Intuitively, multiple concurrently occurring nega-tive impacts from urbanization will have a greaterinfluence on stream temperature than an individualinfluence. This was demonstrated by Scenario 7 inwhich the combined effects of urbanization (channelwidening, loss of riparian vegetation, and thermallyelevated runoff) played a considerably greater role inestablishing stream temperature than scenarios alter-ing only flow (Scenarios 3, 4, and 5).
In terms of a probable future development density(Scenario 3) within the Back Creek watershed thealterations to flow by low density development did notraise temperatures. Even under the flow regimeresulting from high density development (Scenario 5)mean daily stream temperature increased by only0.1˚C. The major causes of increased temperatureevaluated by this study were shade reduction andchannel widening (Scenarios 2 and 6). Bartholow(2000) found that stream shading was followed closelyby stream width as the most sensitive variables ofSSTEMP (this model uses the same numerical meth-ods as SNTEMP) in a simulation estimating clear cut-ting effects. For a model developed and evaluated byLeBlanc et al. (1997) shade was third and width fifthmost sensitive of ten assessed parameters. Sensitivityanalysis by Bartholow (1989), Sullivan et al. (1990),and Krause (2002) found air temperature followed byhumidity were the most sensitive parameters of theSSTEMP and SNTEMP models; however shade andwidth were not assessed by Krause (2002) and Sulli-van et al. (1990) did not assess the latter. The impor-tance of shading and width on stream temperaturedenotes that preservation of riparian buffers to main-tain shading and bank stabilization may enable main-tenance of the existing thermal regime. However,even if mitigation measures alleviate thermalchanges, other impacts associated with urbanization(e.g., sedimentation, habitat loss, nutrient loading,toxins) could exacerbate thermal changes resulting inloss of fish diversity and abundance in Back Creek.
It is challenging to conclude whether or not ther-mal changes from urbanization alone will impact thefish community in Back Creek due to predicted meandaily temperature alterations typically less than 1˚C.
JAWRA 1654 JOURNAL OF THE AMERICAN WATER RESOURCES ASSOCIATION
KRAUSE, LOCKARD, NEWCOMB, KIBLER, LOHANI, AND ORTH
Figure 4. Percentage of Time (June, July, and August 2000)that Maximum Daily Temperatures Under the Baseline
and “Worst Case” Scenario Exceeded 31°C at 2 kmIntervals Below the Back Creek Headwater.
The baseline thermal conditions of summer 2000 inBack Creek do not appear limiting to the warm waterfish community when upper thermal limits are con-sidered. Hourly measured water temperatures at 38rkm never exceeded 29.2˚C during summer 2000,which is at or below the known lethal thresholds forwarm water species in Back Creek (Table 1) as well asthe VADEQ 31˚C upper temperature standard (withthe exception of the cold water species, brown andrainbow trout, which were considered introduced)(Stancil, 2000). However, due to annual variation inmeteorological conditions other years have had highertemperatures. During summer of 1999, a dryer yearthan 2000, temperatures exceeded the VADEQ 31˚Cupper temperature standard. Therefore, multipleeffects of urbanization will elevate water temperatureand cause temperature to exceed the VADEQ stan-dard more frequently. Thermal conditions may notlimit the fish community from the standpoint of upperthermal limits, but chronic exposure to sublethal tem-peratures could reduce growth, induce stress and dis-ease, or impair reproductive capabilities. The summeraverage temperature increase up to 1˚C and increasedfrequency of maximum daily temperatures greaterthan 31˚C clearly portrays an increased chronic ther-mal impairment. In Back Creek the majority of thefish community is made up of species with intermedi-ate tolerance to environmental perturbation, followedby intolerant and intolerant/intermediate species(Table 1). The large proportion of intermediate toler-ant species may suggest little change would occur tothe fish community structure with the onset of chroni-cally elevated temperatures. However, there could bea decline in abundance of intolerant species and anincrease in tolerant species as was seen with macroin-vertebrates by Jones and Clark (1987) due to water-shed urbanization in Virginia. More research isneeded on the sublethal or chronic effects of increasedstream temperature regimes on fish, particularly forthose species already living in habitats near theirupper limits.
Thermal regime is important not only to fish, butalso to macroinvertebrates, which are an importantfood resource for many fish species. As with fish, cer-tain macroinvertebrate taxa (e.g., stoneflies) are morethermally sensitive to elevated temperatures (Hynes,2001). If impaired thermal conditions persist,macroinvertebrate survivorship decreases (Quinn etal., 1994; Cox and Rutherford, 2000). Mean and maxi-mum daily temperatures in three tributaries of BackCreek were approximately 3˚C to 6˚C warmer than inthree streams in a neighboring watershed with moreforested riparian land (Sponseller et al., 2001). Thosestreams with greater amounts of forested riparianland and lower water temperatures had moremacroinvertebrate diversity. This suggests that
additional loss of forested land due to urbanization inBack Creek could further increase the abundance oftolerant taxa while decreasing the abundance of non-tolerant taxa (Jones and Clark, 1987).
Flow and temperature prediction models are usefultools; however they are constrained by limitations andpredictive variability which should be kept in mindwhile examining the results presented herein. TheHSPF model is highly parameterized and acts as alumped model within a land segment. The SNTEMPmodel predicts mean and maximum daily stream tem-perature based on daily averaged input parameters.Predictions from daily models such as SNTEMP aremore conservative than that of dynamic models capa-ble of hourly predictions. Furthermore, the primaryassumptions of SNTEMP are steady state conditionsover the 24-hour averaging period and travel time ofwater flowing through the modeled network is lessthan or equal to the averaging period (Bartholow,2000). During storm flows, the steady state assump-tion may have been violated due to dramatic changesin flow during a 24-hour period. A travel time ofapproximately one day was assumed through theBack Creek system. Violation of assumptionsdegrades model predictive ability; however SNTEMPpredictive ability was found to be strong despite possi-ble violations (e.g., average error of 1.3˚C at 37.1rkm). A dynamic model may have predicted greaterand more frequent thermal impacts in Back Creek,but at a tradeoff of more detailed input data and usertime. For this study, a daily model was the appropri-ate choice based on available data. In small streamsystems, which are not necessarily the focus of waterquality or game fish studies, limited data are notuncommon. Use of the SNTEMP model was successfulas it predicted noticeable mean daily thermal changes(primarily for the “worst case” Scenario 7) allowingassessment of stream temperature under differenturbanization levels. Both HSPF and SNTEMP aretransferable modeling systems assuming the prereq-uisite input data are available; however, the resultspresented herein are specific to the Back Creekwatershed and should not be taken as absolute ortransferable.
CONCLUSION
This paper documented the conjunctive use ofwatershed hydrology and stream temperature models,HSPF and SNTEMP, in an attempt to assess urban-ization impacts on stream habitat. The uncoupled useof these particular models represents a uniqueapproach, which also allows prediction of prospectiveimpairment to fish communities prior to impacts,
JOURNAL OF THE AMERICAN WATER RESOURCES ASSOCIATION 1655 JAWRA
PREDICTING INFLUENCES OF URBAN DEVELOPMENT ON THERMAL HABITAT IN A WARM WATER STREAM
thus leaving time for appropriate management action.The study found the Back Creek thermal regime willbe altered if shade is reduced, the channel widened,and/or if total impervious area of the watershedincreases. No effect was seen on temperature whenimpervious surfaces were at 6 percent, but an effectwas seen at 15 percent. This may suggest that aquatichabitat degradation, which has been documented tooccur at 10 percent watershed imperviousness, couldalso occur in Back Creek. Summer mean temperaturewill increase about 1°C if urbanization causes shadereduction, channel widening, and 19 percent impervi-ous surfaces. Additionally, maximum daily tempera-tures will more frequently exceed the VADEQ 31°Cstandard with increased urbanization. The effects ofchronically elevated temperatures can potentiallyreduce fish community diversity and shift the struc-ture from intolerant to tolerant species. Of the threeurbanization levels assessed, the low developmentscenario (Scenario 3) is the most likely level of urban-ization projected for the Back Creek watershed in thenear future. However, the increased population of themedium and high density scenarios (Scenarios 4 and5) are quite plausible in the watersheds neighboringBack Creek. The simulation model predicted thatthermal habitat in Back Creek would be altered ifurban development proceeds without appropriate mit-igation and that associated temperature changes havethe potential to alter fish diversity and abundance.
ACKNOWLEDGMENTS
Temperature modeling work reported in this paper was fundedby the Virginia Water Resources Research Center and hydrologicmodeling work was supported by USEPA/NSF Water and Water-shed program grant No. R 825760-01-0. The authors acknowledgethe assistance of John Bartholow (USGS Fort Collins Science Cen-ter) with SNTEMP model development.
LITERATURE CITED
Aho, J.M., C.S. Anderson, and J.W. Terrell, 1986. Habitat Suitabili-ty Index Models and Instream Flow Suitability Curves: Red-breast Sunfish. U.S. Fish and Wildlife Service Biological Report82(10.119), 23 pp.
Armantrout, N.B., 1998. Glossary of Aquatic Habitat InventoryTerminology. American Fisheries Society, Bethesda, Maryland.
Barbour, M.T., J. Gerritsen, B.D. Snyder, and J.B. Stribling. 1999.Rapid Bioassessment Protocols for Use in Streams and Wade-able Rivers: Periphyton, Benthic Macroinvertebrates and Fish(Second Edition). EPA 841-B-99-002, U.S. Environmental Pro-tection Agency, Office of Water, Washington, D.C.
Bartholow, J.M., 1989. Stream Temperature Investigations: Fieldand Analytical Methods. Instream Flow Information Paper No.13, U.S. Fish Wildlife Service Biological Report 89(17), 139 pp.
Bartholow, J. M., 1991. A modeling Assessment of the ThermalRegime for an Urban Sport Fishery. Environmental Manage-ment 15(6):833-845.
Bartholow, J.M., 2000. The Stream Segment and Stream NetworkTemperature Models: A Self-Study Course, Version 2.0. U.S.Geological Survey Open File Report 99-112, 276 pp.
Bicknell, B.R., J.C. Imhoff, J.L. Kittle, A.S. Donigian Jr., and R.C. Johanson, 1997. Hydrological Simulation Program – FORTRAN, User’s Manual for Version 11.0. USEPA, NationalExposure Research Laboratory, Research Triangle Park, NorthCarolina.
Booth, D.B., 1990. Stream-Channel Incision Following Drainage-Basin Urbanization. Water Resources Bulletin 26(3):407-418.
Booth, D.B. and C.R. Jackson, 1997. Urbanization of Aquatic Sys-tems: Degradation Thresholds, Stormwater Detection, and theLimits of Mitigation. Journal of the American Water ResourcesAssociation (JAWRA) 33(5):1077-1090.
Bosch, D.J., V.K. Lohani, R.L. Dymond, D.F. Kibler, and K. Stephenson, 2003. Hydrological and Fiscal Impacts of Resi-dential Development: A Virginia Case Study. ASCE Journal ofWater Resources Planning and Management 129(2):107-114.
Brooker, M.P., 1981. The Impact of Impoundments on the Down-stream Fisheries and General Ecology of Rivers. In: Advances inApplied Biology, T.H. Croaker (Editor). Academic Press, NewYork, New York, Vol. 6, pp. 91-152.
Brown, H.W., 1974. Handbook of the Effects of Temperature onSome North American Fishes. American Electric Power Corpo-ration, Canton, Ohio.
Brungs, W.A. and B.R. Jones, 1977. Temperature Criteria forFreshwater Fish: Protocol and Procedures. EPA-600/3-77-061,U.S. Environmental Protection Agency Research Laboratory,Duluth, Minnesota, 129 pp.
Calow, P. and E. Petts, 1992. The Rivers Handbook, Volume 1.Blackwell Scientific Publications, Oxford, United Kingdom.
Chavin, W., 1973. Responses of Fish to Environmental Changes.Bannerstone House, Springfield, Illinois.
Chen, Y.D., R.F. Carsel, S.C. McCutcheon, and W.L. Nutter, 1998a.Watershed-Scale Model Development (Stream TemperatureSimulation of Forested Riparian Areas, Part 1). Journal of Envi-ronmental Engineering 124(4):304-315.
Chen, Y.D., S.C. McCutcheon, D.J. Norton, and W.L. Nutter, 1998b.Model Application (Stream Temperature Simulation of ForestedRiparian Areas, Part 2). Journal of Environmental Engineering124(4):316-328.
CONFRRM (Cooperative Networks for Renewable Resource Mea-surements), 2004. CONFRRM Solar Radiation Data: BluefieldState College. Available at http://rredc.nrel.gov/solar/new_data/confrrm/. Accessed in September 2004.
Conover, W.J., 1971. Practical Nonparametric Statistics. JohnWiley and Sons, Inc., New York, New York.
Cox, T.J. and J.C. Rutherford, 2000. Thermal Tolerances of TwoStream Invertebrates Exposed to Diurnally Varying Tempera-ture. New Zealand Journal of Marine and Freshwater Research34:203-208.
ESRI, 1997. Watershed Delineator Application – User's Manual.Environmental Systems Research Institute, Redlands, Califor-nia.
Ferguson, B.K. and P.W. Suckling, 1990. Changing Rainfall-RunoffRelationships in the Urbanizing Peachtree Creek Watershed,Atlanta, Georgia. Water Resources Bulletin 26(2):313-322.
Finkenbine, J.K., J.W. Atwater, and D.S. Mavinic, 2000. StreamHealth After Urbanization. Journal of the American WaterResources Association (JAWRA) 36(5):1149-1160.
Galli, J., 1990. Thermal Impacts Associated With Urbanization andStormwater Best Management Practices. Metropolitan Wash-ington Council of Governments, Washington, D.C., 188 pp.
JAWRA 1656 JOURNAL OF THE AMERICAN WATER RESOURCES ASSOCIATION
KRAUSE, LOCKARD, NEWCOMB, KIBLER, LOHANI, AND ORTH
Halliwell, D.B., R.W. Langdon, R.A. Daniels, J.P. Kurtenbach, andR.A. Jacobson, 1999. Classification of Freshwater Fish Speciesof the Northeastern United States for Use in the Development ofIndices of Biological Integrity, With Regional Applications. In:Assessing the Sustainability and Biological Integrity of WaterResources Using Fish Communities, T. P. Simon (Editor). CRCPress, Boca Raton, Florida, pp. 301-333.
Horner, R., J. Skupien, E. Livingston, and H. Shaver, 1994. Funda-mentals of Urban Runoff Management: Technical and Institu-tional Issues. Terrene Institute, Washington, D.C.
Hostetler, S.W., 1991. Analysis and Modeling of Long-Term StreamTemperatures on the Steamboat Creek Basin, Oregon: Implica-tions for Land Use and Fish Habitat. Water Resources Bulletin27(4):637-647.
Hynes, H.B.N., 2001. The Ecology of Running Waters. The Black-burn Press, Caldwell, New Jersey.
James, W. and B. Verspagen, 1997. Thermal Enrichment ofStormwater by Urban Pavement. In: Modeling the Managementof Stormwater Impacts, W. James (Editor). ComputationalHydraulics International, Guelph, Ontario, Vol. 5, pp. 155-177.
Jenkins, R.E. and N.M. Burkhead, 1993. Freshwater Fishes of Vir-ginia. American Fisheries Society, Bethesda, Maryland.
Jones, R.C. and C.C. Clark, 1987. Impact of Watershed Urbaniza-tion on Stream Insect Communities. Water Resources Bulletin23(6):1047-1055.
Krause, C.W., 2002. Evaluation and Use of Stream TemperaturePrediction Models for Instream Flow and Fish Habitat Manage-ment. M.S. Thesis, Virginia Polytechnic Institute and State Uni-versity, Blacksburg, Virginia.
LeBlanc, R.T., R.D. Brown, and J.E. FitzGibbon, 1997. Modelingthe Effects of Land Use Change on the Water Temperature inUnregulated Urban Streams. Journal of Environmental Man-agement 49(4):445-469.
Leith, R.M. and P.H. Whitfield, 2000. Some Effects of Urbanizationon Streamflow Records in a Small Watershed in the Lower Fras-er Valley, B. C. Northwest Science 74(1):69-75.
Lieb, D.A. and R.F. Carline, 2000. Effects of Urban Runoff From aDetention Pond on Water Quality, Temperature and CagedGammarus minus (Say) (Amphipoda) in a Headwater Stream.Hydrobiologia 441:107-116.
Lifton, W.S., K.A. Voos, and D. Gilbert, 1985. The Simulation of thePit 3, 4, and 5 Hydroelectric Project Using the USFWS InstreamTemperature Model. In: Waterpower 1985. Proceedings, Ameri-can Society of Civil Engineers, Vol. 3, pp. 1805-1814.
Lockard, B., 2002. Long Term Hydrologic Effects on Stream HealthFrom Residential Development Patterns. M.S. Thesis, Civil andEnvironmental Engineering, Virginia Tech, Blacksburg, Vir-ginia.
Lockard, B., V.K. Lohani, and D.F. Kibler, 2002. Long Term Hydro-logic Effects of Residential Development Patterns. Proceedings,Water Resources Planning and Management Conference, ASCE,Roanoke, Virginia, pp. 1-10.
Lohani, V.K., D.F. Kibler, and J. Chanat, 2002. Constructing aProblem Solving Environment Tool for Hydrologic Assessment ofLand Use Change. Journal of the American Water ResourcesAssociation (JAWRA) 38(2):439-452.
McMahon, T.E., 1982. Habitat Suitability Index Models: CreekChub. U.S. Fish and Wildlife Service, FWS/OBS-82/10.4, 23 pp.
NCDC (National Climatic Data Center), 2004. Roanoke RegionalAirport Weather Station. Available at http://www4.ncdc.noaa.gov/cgi-win/wwcgi.dll?wwDI~StnSrch~StnID~20027051.Accessed in September 2004.
Newman, K.R., D.B. Hates, and W.W. Taylor, 1999. The Effect ofUrbanization on Fish Community Structure in a Large Michi-gan Watershed. Proceedings of the Symposium on EcosystemApproaches for Fisheries Management, Anchorage, Alaska.
University of Alaska Sea Grant College Program Report, AK-SG-99-01, pp. 467-479.
Onorato, D., K.R. Marion, and R.A. Angus, 1998. Longitudinal Vari-ations in the Ichthyofaunal Assemblages of the Upper CahabaRiver: Possible Effects of Urbanization in a Watershed. Journalof Freshwater Ecology 13(2):139-154.
Quinn, J.M., G.L. Steele, C.W. Hickey, and M.L. Vickers, 1994.Upper Thermal Tolerances of Twelve New Zealand StreamInvertebrate Species. New Zealand Journal of Marine andFreshwater Research 28:391-397.
Raleigh, R.F., T. Hickman, R.C. Solomon, and P.C. Nelson, 1984.Habitat Suitability Information: Rainbow Trout. U.S. Fish andWildlife Service. FWS/OBS-82/10.60, 64 pp.
Reynolds, W.W. and M.E. Casterlin, 1979. The Role of Temperaturein the Environmental Physiology of Fishes. In: EnvironmentalPhysiology of Fishes, M.A. Ali (Editor). Plenum Press, NewYork, New York, pp. 497-518.
Rutherford, C.J., S. Blackett, C. Blackett, L. Saito, and R.J. Davies-Colley, 1997. Predicting the Effects of Shade on Water Tempera-ture in Small Streams. New Zealand Journal of Marine andFreshwater Research 31:707-721.
Schueler, T., 1995. Site Planning for Urban Stream Protection.Metropolitan Washington Council of Governments, WashingtonD.C., 232 pp.
Scott, J.B., C.R. Steward, and Q.R. Stober, 1986. Effects of UrbanDevelopment on Fish Population Dynamics in Kelsey Creek,Washington. Transactions of the American Fisheries Society115:555-567.
Smogor, R.A. and P.L. Angermeier, 1999. Effects of Drainage Basinand Anthropogenic Disturbance on Relations Between StreamSize and IBI Metrics in Virginia. In: Assessing the Sustainabili-ty and Biological Integrity of Water Resources Using Fish Com-munities, T.P. Simon (Editor). CRC Press, Boca Raton, Florida,pp. 249-272.
Sponseller, R.A., E.F. Benfield, and H.M. Valett, 2001. Relation-ships Between Land Use, Spatial Scale, and Stream Macroin-vertebrate Communities. Freshwater Biology 46(10):1409-1424.
Stancil, V.F., 2000. Effects of Watershed and Habitat Conditions onStream Fishes in the Upper Roanoke River Watershed, Virginia.M.S. Thesis, Virginia Polytechnic Institute and State University,Blacksburg, Virginia.
Stuber, R.J., G. Gebhart, and O.E. Maughan, 1982. Habitat Suit-ability Index Models: Largemouth Bass. U.S. Fish and WildlifeService, FWS/OBS-82/10.16, 32 pp.
Sullivan, K., J. Tooley, K. Doughty, J.E. Caldwell, and P. Knudsen,1990. Evaluation of Prediction Models and Characterization ofStream Temperature Regimes in Washington. Timber/Fish/Wildlife Report No. TFW-WQ3-90-006, Washington Departmentof Natural Resources, Olympia, Washington, 224 pp.
Theurer, F.D., K.A. Voos, and W.J. Miller, 1984. Instream WaterTemperature Model. Instream Flow Information Paper 16, U.S.Fish and Wildlife Service, FWS/OBS-84/15, 200 pp.
Trial, J.G., J.G. Stanley, M. Batcheller, G. Gebhart, O.E. Maughan,and P.C. Nelson, 1983. Habitat Suitability Information: Black-nose Dace. U.S. Fish and Wildlife Service, FWS/OBS-82/10.41,28 pp.
Trimble, S.W., 1997. Contribution of Stream Channel Erosion toSediment Yield From an Urbanizing Watershed. Science278:1442-1444.
Twomey, K.A., K.L. Williamson, and P.C. Nelson, 1984. HabitatSuitability Index Models and Instream Flow Suitability Curves:White Sucker. U.S. Fish and Wildlife Service, FWS/OBS-82/10.64, 56 pp.
U.S Census Bureau, 2000. Roanoke Virginia Fact Sheet. Availableat http://factfinder.census.gov. Accessed in September 2004.
JOURNAL OF THE AMERICAN WATER RESOURCES ASSOCIATION 1657 JAWRA
PREDICTING INFLUENCES OF URBAN DEVELOPMENT ON THERMAL HABITAT IN A WARM WATER STREAM
USGS (U.S. Geological Survey), 2004. Real-Time Data for USGS02056650 Back Creek Near Dundee Virginia. Available athttp://waterdata.usgs.gov/va/nwis/dv/?site_no=02056650&PARAmeter_cd=00060. Accessed in September 2004.
VADEQ (Virginia Department of Environmental Quality), 2004.Virginia Water Quality Standards. Available at http://www.deq.state.va.us/wqs/download.html. Accessed in September2004.
Van Buren, M.A., W.E. Watt, J. Marsalek, and B.C. Anderson, 2000.Thermal Enhancement of Stormwater Runoff by Paved Sur-faces. Water Research 34(4):1359-1371.
Virginia Agricultural Experiment Station, 2004. Kentland FarmOperation – Weather Data. Available at http://www.vaes.vt.edu/colleges/kentland/weather/. Accessed in September 2004.
Waddle, T.J., 1989. Water Temperature Data Analysis and Simula-tion for the Salmon River, Osewgo County, New York, Summer,1986. U.S. Fish and Wildlife Service. National Ecology ResearchCenter, Fort Collins, Colorado, 83 pp.
Wang, L., J. Lyons, P. Kanehl, R. Bannerman, and E. Emmons,2000. Watershed Urbanization and Changes in Fish Communi-ties in Southeastern Wisconsin Streams. Journal of the Ameri-can Water Resources Association (JAWRA) 36(5):1173-1189.
Wang, L., J. Lyons, and P. Kanehl, 2001. Impacts of Urbanizationon Stream Habitat and Fish Across Multiple Spatial Scales.Environmental Management 28(2): 255-266.
Weaver, L.A. and G.C. Garman, 1994. Urbanization of a Watershedand Historical Changes in a Stream Fish Assemblage. Transac-tions of the American Fisheries Society 123:162-172.
Wilson, W.J., M.D. Kelly, and P.R. Meyer, 1987. Instream Tempera-ture Modeling and Fish Impact Assessment for a ProposedLarge Scale Alaska Hydroelectric Project. In: RegulatedStreams: Advances in Ecology, J.F. Craig and J.B. Kemper (Edi-tors). Plenum Press, New York, New York, pp. 183-206.
JAWRA 1658 JOURNAL OF THE AMERICAN WATER RESOURCES ASSOCIATION
KRAUSE, LOCKARD, NEWCOMB, KIBLER, LOHANI, AND ORTH