Embed Size (px)
Citation preview

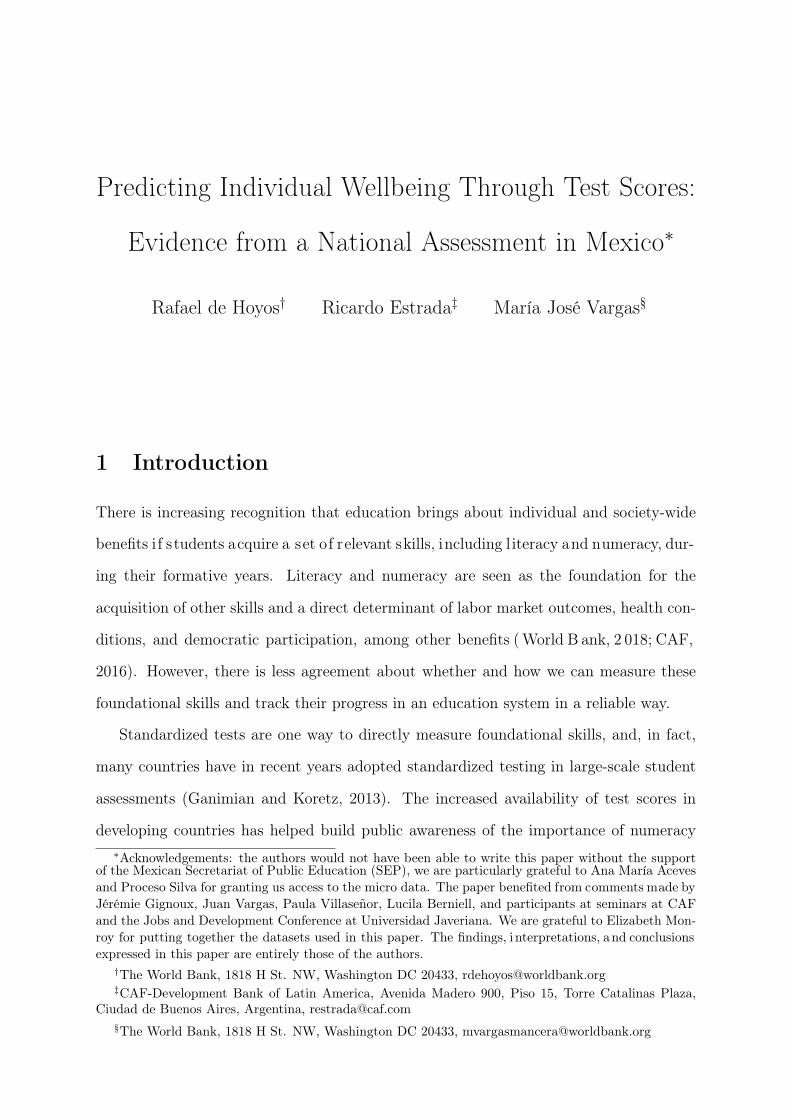
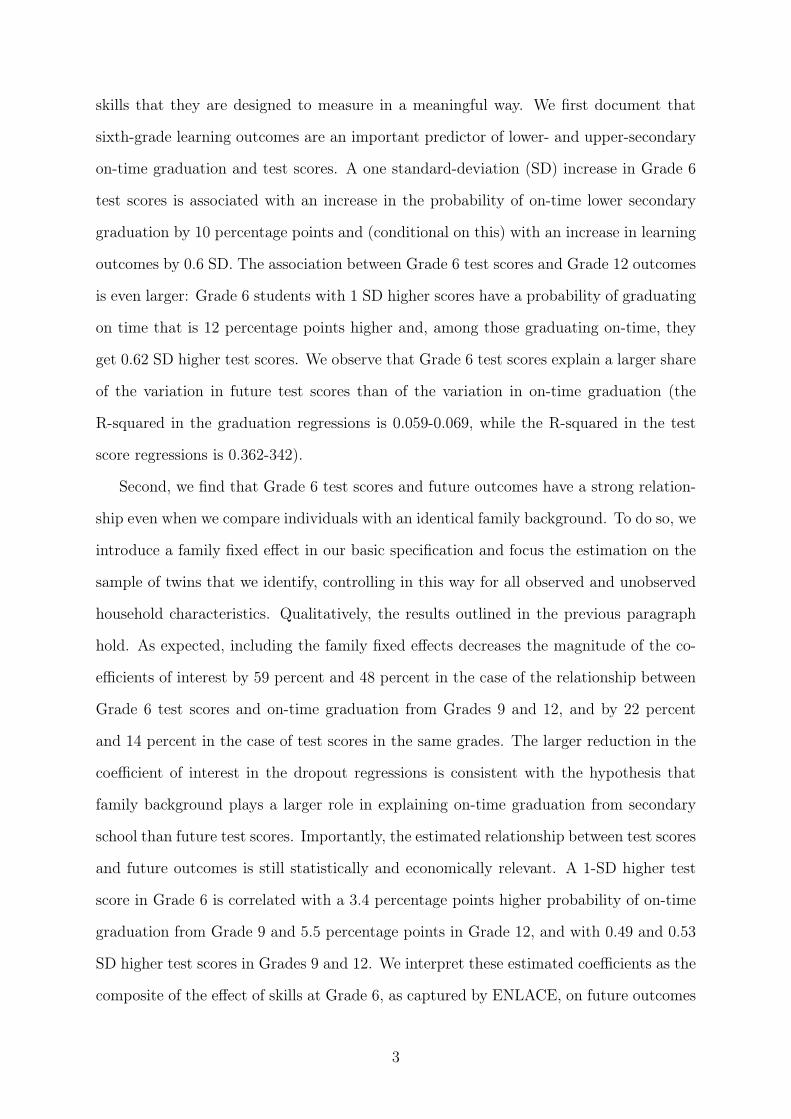
Policy Research Working Paper 8459
Predicting Individual Wellbeing Through Test Scores
Evidence from a National Assessment in Mexico
Rafael de HoyosRicardo Estrada
María José Vargas
Education Global PracticeMay 2018
WPS8459P
ublic
Dis
clos
ure
Aut
horiz
edP
ublic
Dis
clos
ure
Aut
horiz
edP
ublic
Dis
clos
ure
Aut
horiz
edP
ublic
Dis
clos
ure
Aut
horiz
ed

Produced by the Research Support Team
Abstract
The Policy Research Working Paper Series disseminates the findings of work in progress to encourage the exchange of ideas about development issues. An objective of the series is to get the findings out quickly, even if the presentations are less than fully polished. The papers carry the names of the authors and should be cited accordingly. The findings, interpretations, and conclusions expressed in this paper are entirely those of the authors. They do not necessarily represent the views of the International Bank for Reconstruction and Development/World Bank and its affiliated organizations, or those of the Executive Directors of the World Bank or the governments they represent.
Policy Research Working Paper 8459
This paper is a product of the Education Global Practice. It is part of a larger effort by the World Bank to provide open access to its research and make a contribution to development policy discussions around the world. Policy Research Working Papers are also posted on the Web at http://www.worldbank.org/research. The authors may be contacted at [email protected].
This paper constructs two longitudinal datasets that record students’ test scores in a national standardized exam in Mexico and track students from the end of primary (Grade 6) to the end of lower (Grade 9) and upper (Grade 12) second-ary school, then to university and labor market participation up to two years after graduation from upper secondary. The results show that test scores are a strong predictor of future education and labor market outcomes. Using a large sample of twins in the data, the paper shows that the relationship
between Grade 6 test scores and future education out-comes goes beyond family background. Finally, the paper exploits the within-individual correlation between subject test scores and finds evidence that this standardized assess-ment captures in a meaningful way the specific skills that it is designed to measure. These results show that, despite their limitations, large-scale standardized tests can capture skills that are important for future individual wellbeing.
Predicting Individual Wellbeing Through Test Scores:
Evidence from a National Assessment in Mexico∗
Rafael de Hoyos† Ricardo Estrada‡ María José Vargas§
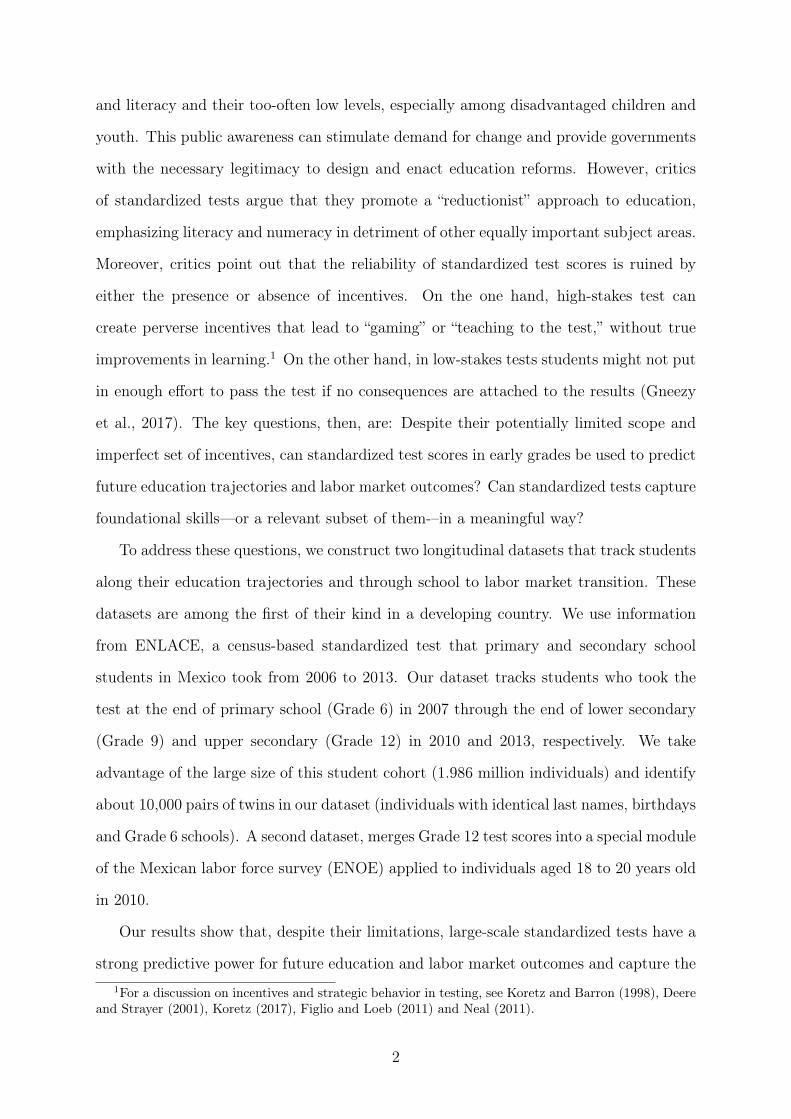
1 Introduction
There is increasing recognition that education brings about individual and society-wide
benefits i f students acquire a set of relevant skills, including l iteracy and numeracy, dur-
ing their formative years. Literacy and numeracy are seen as the foundation for the
acquisition of other skills and a direct determinant of labor market outcomes, health con-
ditions, and democratic participation, among other benefits (World B ank, 2 018; CAF,
2016). However, there is less agreement about whether and how we can measure these
foundational skills and track their progress in an education system in a reliable way.
Standardized tests are one way to directly measure foundational skills, and, in fact,
many countries have in recent years adopted standardized testing in large-scale student
assessments (Ganimian and Koretz, 2013). The increased availability of test scores in
developing countries has helped build public awareness of the importance of numeracy∗Acknowledgements: the authors would not have been able to write this paper without the support
of the Mexican Secretariat of Public Education (SEP), we are particularly grateful to Ana María Aceves and Proceso Silva for granting us access to the micro data. The paper benefited from comments made by Jérémie Gignoux, Juan Vargas, Paula Villaseñor, Lucila Berniell, and participants at seminars at CAF and the Jobs and Development Conference at Universidad Javeriana. We are grateful to Elizabeth Mon-roy for putting together the datasets used in this paper. The findings, i nterpretations, and conclusions expressed in this paper are entirely those of the authors.†The World Bank, 1818 H St. NW, Washington DC 20433, [email protected]‡CAF-Development Bank of Latin America, Avenida Madero 900, Piso 15, Torre Catalinas Plaza,
Ciudad de Buenos Aires, Argentina, [email protected]§The World Bank, 1818 H St. NW, Washington DC 20433, [email protected]
and literacy and their too-often low levels, especially among disadvantaged children and
youth. This public awareness can stimulate demand for change and provide governments
with the necessary legitimacy to design and enact education reforms. However, critics
of standardized tests argue that they promote a “reductionist” approach to education,
emphasizing literacy and numeracy in detriment of other equally important subject areas.
Moreover, critics point out that the reliability of standardized test scores is ruined by
either the presence or absence of incentives. On the one hand, high-stakes test can
create perverse incentives that lead to “gaming” or “teaching to the test,” without true
improvements in learning.1 On the other hand, in low-stakes tests students might not put
in enough effort to pass the test if no consequences are attached to the results (Gneezy
et al., 2017). The key questions, then, are: Despite their potentially limited scope and
imperfect set of incentives, can standardized test scores in early grades be used to predict
future education trajectories and labor market outcomes? Can standardized tests capture
foundational skills—or a relevant subset of them-–in a meaningful way?
To address these questions, we construct two longitudinal datasets that track students
along their education trajectories and through school to labor market transition. These
datasets are among the first of their kind in a developing country. We use information
from ENLACE, a census-based standardized test that primary and secondary school
students in Mexico took from 2006 to 2013. Our dataset tracks students who took the
test at the end of primary school (Grade 6) in 2007 through the end of lower secondary
(Grade 9) and upper secondary (Grade 12) in 2010 and 2013, respectively. We take
advantage of the large size of this student cohort (1.986 million individuals) and identify
about 10,000 pairs of twins in our dataset (individuals with identical last names, birthdays
and Grade 6 schools). A second dataset, merges Grade 12 test scores into a special module
of the Mexican labor force survey (ENOE) applied to individuals aged 18 to 20 years old
in 2010.
Our results show that, despite their limitations, large-scale standardized tests have a
strong predictive power for future education and labor market outcomes and capture the1For a discussion on incentives and strategic behavior in testing, see Koretz and Barron (1998), Deere
and Strayer (2001), Koretz (2017), Figlio and Loeb (2011) and Neal (2011).
2
skills that they are designed to measure in a meaningful way. We first document that
sixth-grade learning outcomes are an important predictor of lower- and upper-secondary
on-time graduation and test scores. A one standard-deviation (SD) increase in Grade 6
test scores is associated with an increase in the probability of on-time lower secondary
graduation by 10 percentage points and (conditional on this) with an increase in learning
outcomes by 0.6 SD. The association between Grade 6 test scores and Grade 12 outcomes
is even larger: Grade 6 students with 1 SD higher scores have a probability of graduating
on time that is 12 percentage points higher and, among those graduating on-time, they
get 0.62 SD higher test scores. We observe that Grade 6 test scores explain a larger share
of the variation in future test scores than of the variation in on-time graduation (the
R-squared in the graduation regressions is 0.059-0.069, while the R-squared in the test
score regressions is 0.362-342).
Second, we find that Grade 6 test scores and future outcomes have a strong relation-
ship even when we compare individuals with an identical family background. To do so, we
introduce a family fixed effect in our basic specification and focus the estimation on the
sample of twins that we identify, controlling in this way for all observed and unobserved
household characteristics. Qualitatively, the results outlined in the previous paragraph
hold. As expected, including the family fixed effects decreases the magnitude of the co-
efficients of interest by 59 percent and 48 percent in the case of the relationship between
Grade 6 test scores and on-time graduation from Grades 9 and 12, and by 22 percent
and 14 percent in the case of test scores in the same grades. The larger reduction in the
coefficient of interest in the dropout regressions is consistent with the hypothesis that
family background plays a larger role in explaining on-time graduation from secondary
school than future test scores. Importantly, the estimated relationship between test scores
and future outcomes is still statistically and economically relevant. A 1-SD higher test
score in Grade 6 is correlated with a 3.4 percentage points higher probability of on-time
graduation from Grade 9 and 5.5 percentage points in Grade 12, and with 0.49 and 0.53
SD higher test scores in Grades 9 and 12. We interpret these estimated coefficients as the
composite of the effect of skills at Grade 6, as captured by ENLACE, on future outcomes
3

and the within-family individual-level variation in factors that produce better outcomes
both in Grade 6 and later grades (e.g. intelligence, motivation, and health).
Furthermore, we find evidence that strongly supports the case that ENLACE captures
the subject-specific skills that the test is designed to measure. To do so, we adapt our
main specification and run a regression of ENLACE test scores in a particular subject
area at Grades 9 and 12 on the score for the same subject area in Grade 6 controlling
for the individual’s Grade 6 score in the other subject area, plus a vector of twin fixed
effects. The intuition behind this econometric model is that we can control for factors
that have a common effect on math and language test scores by including in the equation
scores on the other subject area. We find that Grade 6 test scores in mathematics (or
Spanish) have a strong relationship to test scores in the same subject in Grades 9 and
12, conditional on grade 6 test scores in the other subject. An increase of 1 SD in math
(or Spanish) test scores in Grade 6 is associated with increases of 0.26 (0.31) and 0.33
(0.32) SD in test scores in Grades 9 and 12. All results are statistically significant at the
one percent level.
In addition, our results show that Grade 12 test scores are a good predictor of college
enrollment and, conditional on being employed, hourly wages. A 1 SD increase in grade
12 test scores is correlated with a 10 percentage points increase in the likelihood of being
enrolled in university. Conditional on being employed, individuals with 1 SD higher test
scores in Grade 12 enjoy wages that are 6 percent higher one or two years after graduating,
even after controlling for upper secondary school GPA and other socio-economic variables.
Also, we observe that students enrolled in majors that require higher math (Spanish)
skills, e.g. engineering (Social Sciences), have higher test scores in this subject.
Evidence from high-income countries shows that achievement levels in test scores are
good predictors of future education and labor market trajectories. For instance, using
longitudinal data from the United States, Rose (2006) and Jencks and Phillips (2011)
show that high school test scores are positively correlated with earnings both for seven
and 10 years in the future. Rivera-Batiz (1992) finds a correlation between math test
scores and the likelihood of securing a full-time job. A positive correlation between test
4
scores, particularly math, and future labor market outcomes has been documented also
for the United Kingdom and Sweden (Lindqvist and Vestman, 2011; Meghir et al., 2013).
But high school test scores, are, in turn, predicted by test scores at earlier grades, meaning
that early grade test scores can, in principle, predict labor market outcomes. Chetty et al.
(2011) show that test scores at kindergarten are a good predictor of college attendance,
earnings at age 27, home ownership and savings for retirement. Although evidence on the
importance of early test scores for future education outcomes is very scarce, data for the
United Kingdom shows that higher test scores at age seven relate to higher test scores at
age 16 (Lindqvist and Vestman, 2011).
To the best of our knowledge, our paper is the first exploiting individual-level infor-
mation on the association between test scores and future education and labor market
trajectories in a developing country. In addition, the present paper contributes to the lit-
erature on the relevance of standardized tests showing that, despite their limitations, test
scores from large-scale, census-based, assessments have a strong relationship with future
outcomes, and that this relationship goes beyond socio-economic status. Furthermore,
we find evidence that supports the case that these assessments can accurately capture
the foundational skills that they are designed to measure, and that these skills are per-
sistent over the years of a young person’s life. Our results are particularly interesting
because they come from a national education system where people were subject to types
of incentives that can result in score inflation. The results presented here have two im-
portant policy implications. First, they support the design and implementation of this
type of assessments on a broad scale. Second, and importantly for the income inequality
and social mobility agendas, results from large-scale assessments, especially those of early
grades, could be used to target resources towards schools serving students with the low-
est learning levels—which tend to be the poorest. In a country like Mexico, with a large
concentration of wealth and high income disparities, building a public education system
that guarantees foundational skills to all children and youth can be an effective strategy
to reduce income inequality and promote social mobility.
The paper is organized in the following way. After this introduction, Section 2 de-
5
scribes the ENLACE national examination and the steps followed to construct the longi-
tudinal data. Section 3 of the paper describes the empirical approach followed to study
the relationship between test scores and future education and labor market trajectories.
Section 4 presents the results and, finally, Section 5 presents policy implications and
recommendations.
2 Constructing education trajectories and the transi-
tion to the labor market
We construct two longitudinal datasets for this paper: (1) the ENLACE panel and (2)
the ENILEMS-ENLACE panel. The first panel is formed by a cohort of students’ test
scores at the end of primary school (Grade 6) in 2007, end of lower-secondary school
(Grade 9) in 2010 and end of upper-secondary school (Grade 12) in 2013. The second
panel merges a special module of the Mexican labor survey, Encuesta Nacional de Empleo
y Ocupaciones, ENOE, applied to individuals aged 18, 19 and 20 years during the third
quarter of 2010, with students that sat for the ENLACE test in Grade 12 in 2008, 2009,
and 2010.
2.1 The ENLACE test
From 2006 to 2013, the Mexican Secretariat of Public Education (SEP) applied the
census-based standardized test Evaluación Nacional de Logro Académico en Centros Es-
colares, ENLACE. The test gathered information at the end of each academic year on
student performance in math, Spanish, and a rotating subject for all third to ninth graders
in private and public schools. Starting in 2008, ENLACE was also applied to students
finishing upper secondary school (Grade 12). ENLACE was originally designed as a low-
stakes assessment and had no bearing for students on GPA, graduation, or admission.
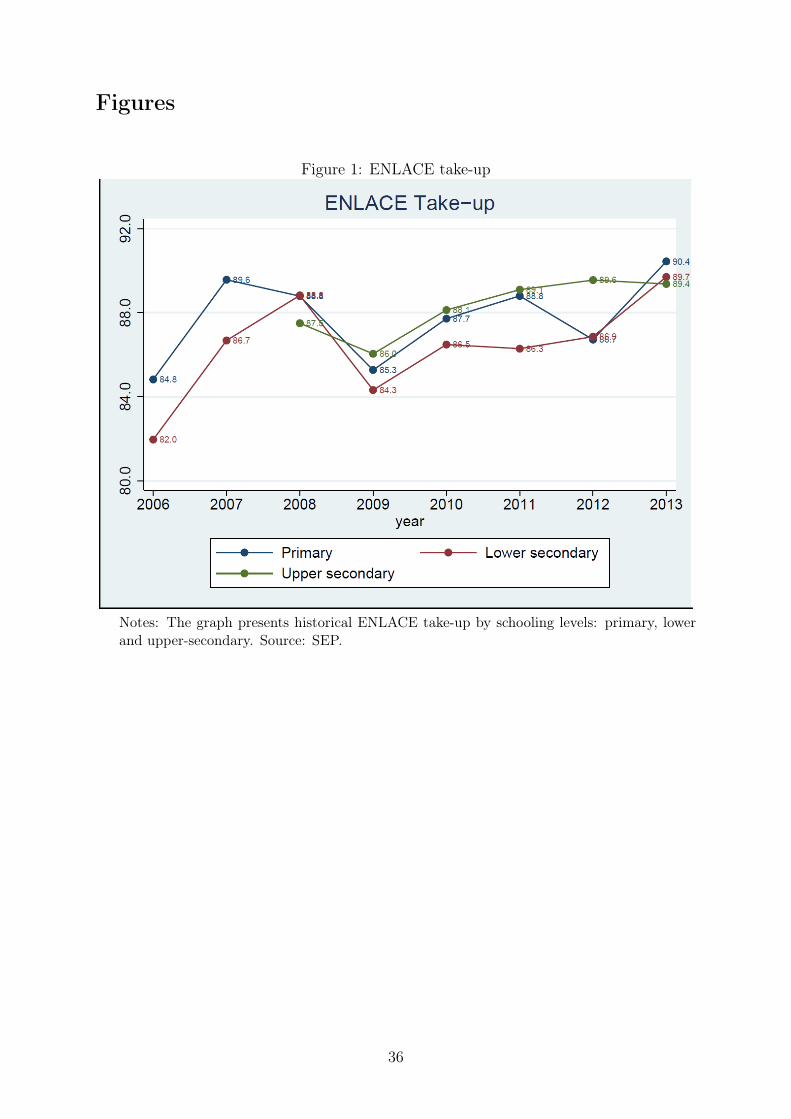
Nonetheless, the take-up of the test was consistently close to 90 percent (Figure 1). A
total of 15.1 million students in 136,000 schools took the examination in 2013, the last
year when ENLACE was applied.
6
The purpose of ENLACE was to strengthen school accountability by informing parents
and society at large about the levels and evolution of learning outcomes. In this regard,
the results from ENLACE received wide attention from the Mexican public. Every year,
ENLACE results made it to the front page of most newspapers in Mexico; civil society
organizations were empowered thanks to ENLACE results. In an effort to use all the
information produced by ENLACE to guide school improvement plans, SEP produced
school report cards and a related online platform. Still, few schools viewed ENLACE
as a diagnostic tool, limiting its effectiveness in improvement strategies (de Hoyos et al.,
2017).
By design, ENLACE had a national mean score of 500 and a standard deviation of 100
for every subject area and grade in its first year of implementation. In addition, the test’s
designers categorized scores into four achievement levels: insufficient, elementary, good,
and excellent. ENLACE’s methodology followed item response theory (IRT), allowing
horizontal comparability of results (same grade over time), but not vertical comparisons
(between grades). Implementation of the test involved parent volunteer monitors, external
test coordinators hired by SEP, and close to a million teachers.
In 2008, SEP decided to use ENLACE scores to measure teacher performance in
Carrera Magisterial (CM), a national teacher incentive program that operated in primary
and lower secondary schools from 1992 to 2015. CM offered salary bonuses to primary
and lower secondary teachers who took professional development courses and agreed to be
subject to yearly evaluations. In 2008, ENLACE scores among their students were given
a weight of 20 percent in the program’s total score, and this was increased to 50 percent
in 2011. Almost all eligible teachers chose to take part in CM (Santibáñez et al., 2007).
The decision to link it with CM made ENLACE a de facto high-stakes test encouraging
“strategic behavior” among teachers and, without the proper controls, it probably resulted
in grade inflation (Contreras and Backoff, 2014). Anomalies in ENLACE and the creation
of a national autonomous evaluation institute (INEE) helped cause the test to be replaced
by a new one called PLANEA, implemented for the first time in 2015.
7
2.2 The ENLACE Panel
ENLACE created a unique personal identifier (Clave Única de Registro Poblacional or
CURP) for all test takers, enabling the construction of a panel of students with learning
outcomes at different points in their education trajectory. In addition to these outcomes,
the ENLACE dataset included a school identifier, socioeconomic information for each
school based on its geographical location,2 and age and sex of the student. Using the
CURP, we merge the information from all Grade 6 students who took the exam in 2007
with their results in the 2010 (Grade 9) and 2013 (Grade 12) exams. We begin the panel
in 2007 because of the relatively low take-up in 2006 and the lack of availability of the
unique identifier in some states during that year. Among the 1,986,190 students who sat
for the exam in 2007, we were able to identify 71 percent three years later in ENLACE
Grade 9 of 2010 and 32 percent in the Grade 12 exam in 2013 (Figure 2).
The large attrition observed in the panel is caused by (1) grade repetition, (2) school
drop-out, (3) exam take-up rates of less than 100 percent and (4) imperfect matching
due to administrative data or coding errors. If a large share of the attrition in the
panel is caused by a low test take-up or imperfect matching, we would not be able
to identify accurately the effects of Grade 6 test scores on lower- and upper-secondary
on-time graduation rates. To quantify the magnitude of the causes behind attrition,
we use administrative data from the annual school census (Formato 911 ) to estimate the
expected survival rates given state-level repetition and drop-out rates in lower and upper-
secondary. Given the school trajectories implied by administrative data, 77 percent of
the student population that completed Grade 6 in 2007 was expected to finish Grade 9 in
2010 and 39 percent to graduate from upper secondary in 2013 (Figure 2). Therefore, our
ENLACE panel has a survival rate that is 6 and 7 percentage points lower vis-a-vis the
survival rate implied by administrative data, in lower- and upper-secondary, respectively.
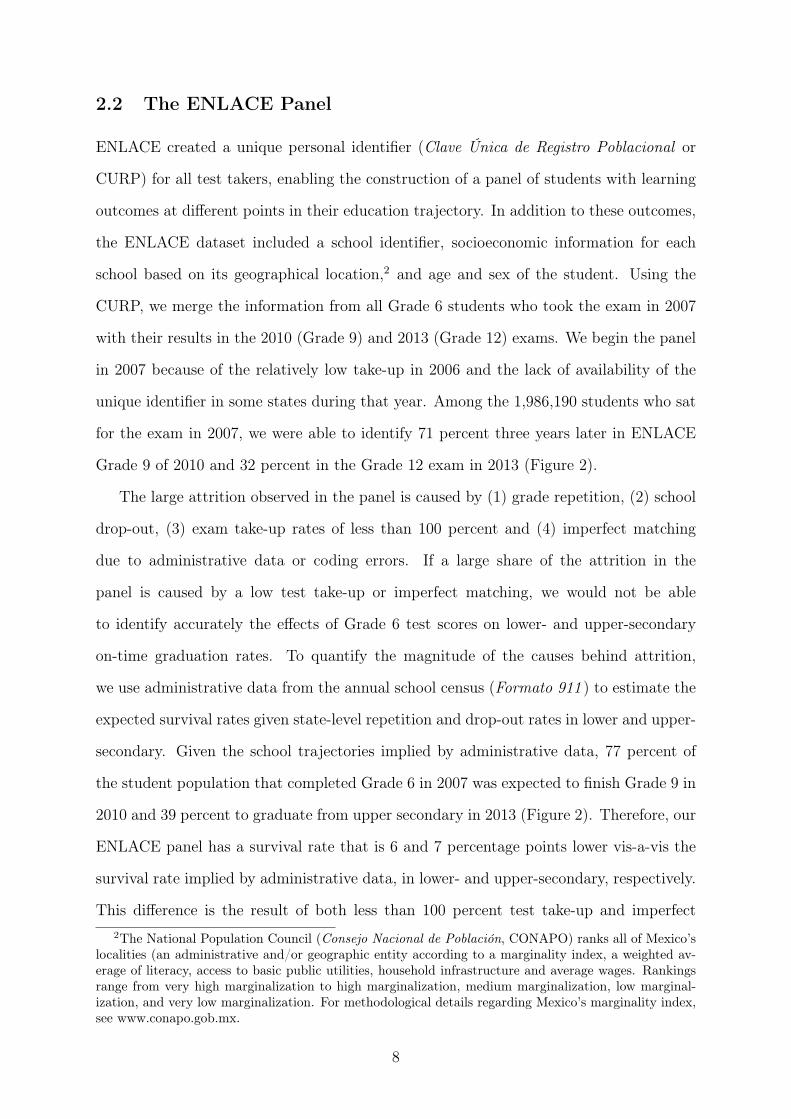
This difference is the result of both less than 100 percent test take-up and imperfect2The National Population Council (Consejo Nacional de Población, CONAPO) ranks all of Mexico’s
localities (an administrative and/or geographic entity according to a marginality index, a weighted av-erage of literacy, access to basic public utilities, household infrastructure and average wages. Rankingsrange from very high marginalization to high marginalization, medium marginalization, low marginal-ization, and very low marginalization. For methodological details regarding Mexico’s marginality index,see www.conapo.gob.mx.
8
matching. Take-up rate in the ENLACE test is high, 87.3 percent of the population
finishing lower secondary in 2010 and 89.4 percent of the population finishing upper
secondary in 2013. The difference in graduation or survival rates between the ENLACE
panel and administrative data is not trivial (6 or 7 percentage points, depending on the
grade), but it is reassuring that most of the attrition observed in the panel is explained
by grade repetition and school dropouts, subjects we want to examine in this paper.
Two additional issues should be addressed. First, the states of Oaxaca and Michoacán
are excluded from the panel because they had very low test take-up rates in 2007 (65
percent and 49 percent, respectively) and even lower in 2010 (34 percent and 0.7 percent,
respectively). Second, the states of Nuevo Leon and to a lesser extent Coahuila and
San Luis de Potosi have two-year upper secondary schools (as opposed to three-years),
reducing substantially the matching between lower- and upper-secondary students in
these states. Despite the significant share of two-year upper secondary schools in these
states, they were kept in the sample.
ENLACE included a context questionnaire which was applied to a random sample
of students (and parents in the case of primary and lower-secondary students) to gather
information on socioeconomic characteristics, schooling aspirations, and studying habits.
Although the sample size was relatively large,3 including controls from the context ques-
tionnaire reduces considerably the number of observations in the regression analysis, as
we will show in the results section.
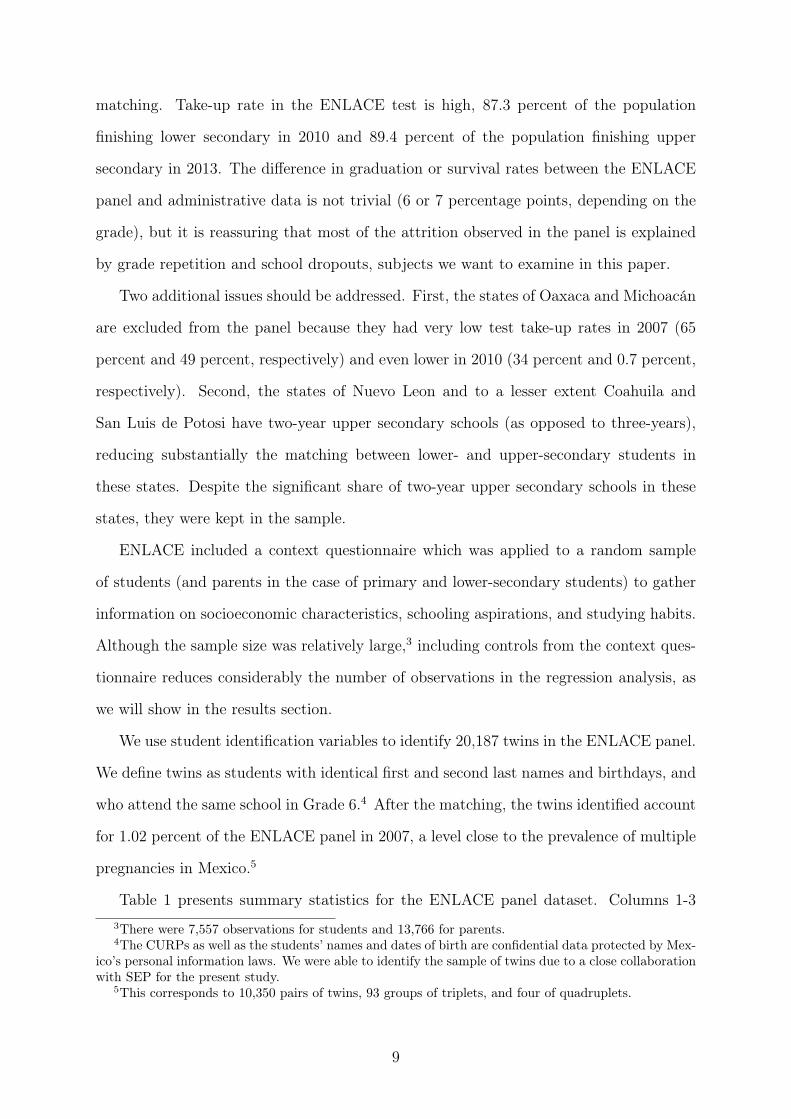
We use student identification variables to identify 20,187 twins in the ENLACE panel.
We define twins as students with identical first and second last names and birthdays, and
who attend the same school in Grade 6.4 After the matching, the twins identified account
for 1.02 percent of the ENLACE panel in 2007, a level close to the prevalence of multiple
pregnancies in Mexico.5
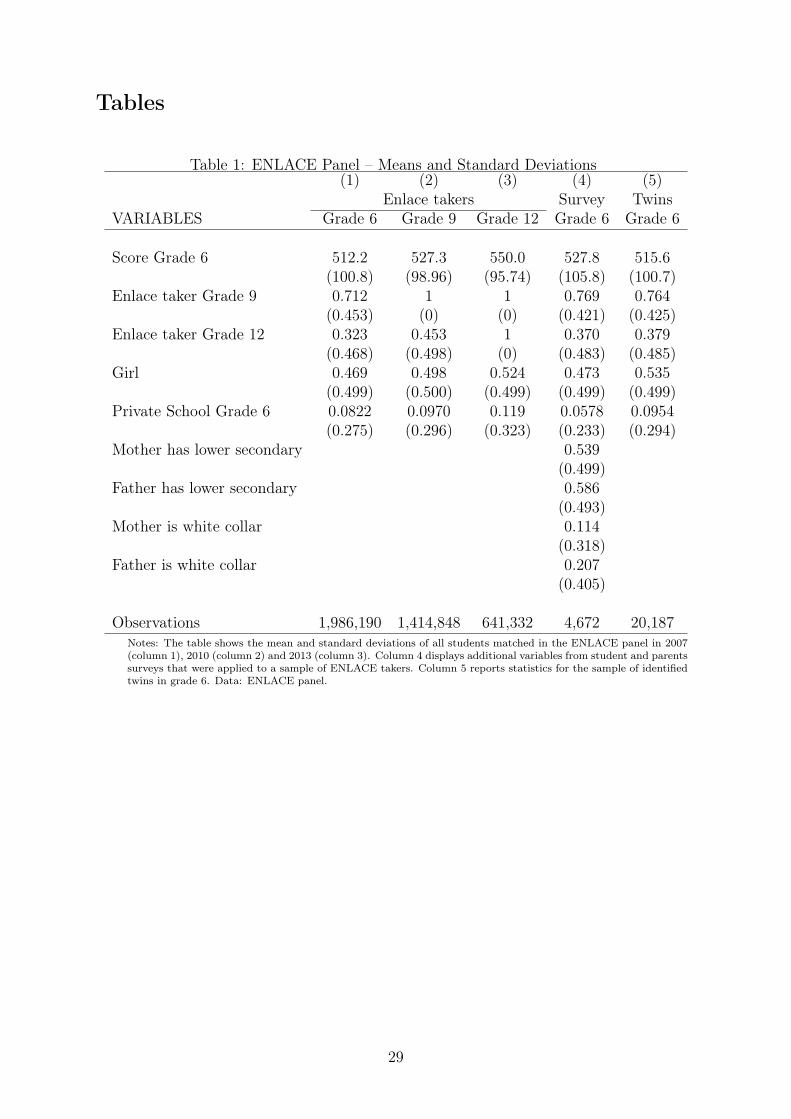
Table 1 presents summary statistics for the ENLACE panel dataset. Columns 1-33There were 7,557 observations for students and 13,766 for parents.4The CURPs as well as the students’ names and dates of birth are confidential data protected by Mex-
ico’s personal information laws. We were able to identify the sample of twins due to a close collaborationwith SEP for the present study.
5This corresponds to 10,350 pairs of twins, 93 groups of triplets, and four of quadruplets.
9

report statistics for test takers in Grades 6, 9, and 12, respectively. Columns 4 and 5
report statistics for the ENLACE survey sample and the twins sample, respectively, in
Grade 6. A simple comparison of means across the first three columns in Table 1 indicates
that students who graduate on time from lower- and upper-secondary were more likely to
have had higher test scores at Grade 6, be female, and enrolled in a private school. Table
A.1 in the Online Appendix reports differences in means between the sample of twins
and non-twins. Although statistically significant at conventional levels, the differences
are very small and support the idea that multiple (versus single) pregnancies are mostly
a random event.
2.3 ENILEMS-ENLACE
Every quarter, the Mexican statistics office, INEGI, collects labor market information
through the Encuesta Nacional de Ocupación y Empleo (ENOE), a nationally- and state-
representative rotating household survey.6 In most quarters ENOE’s core survey is com-
plemented by a thematic module usually capturing information sought by different secre-
tariats and government agencies. During the third quarter of 2010 (July to September),
ENOE’s special module was the Encuesta Nacional de Inserción Laboral de los Egresa-
dos de Educación Media Superior (ENILEMS), a survey targeting upper secondary school
graduates aged 18, 19, and 20. The objective of ENILEMS was to provide information on
the transition between the end of mandatory schooling (Grade 12) and higher education
or the labor market.7
The ENILEMS-ENLACE panel merges information from the respondents of the ENILEMS
2010 survey with their results in the ENLACE Grade 12 taken in May of 2008, 2009, or
2010. Although ENILEMS 2010 did not capture the CURP, it included all the necessary
information to create a pseudo-CURP formed by name, sex, age, and state where the
student was born. The difference between the pseudo-CURP and the CURP is that the
former does not have the last three digits of the student identification code that the Mexi-
can government generates. We created the pseudo-CURP for 7,105 observations included6For more information on ENOE, see http://www.beta.inegi.org.mx/proyectos/enchogares/regulares/enoe/.7For more information on ENILEMS, see http://www.beta.inegi.org.mx/proyectos/enchogares/modulos/enilems/.
10
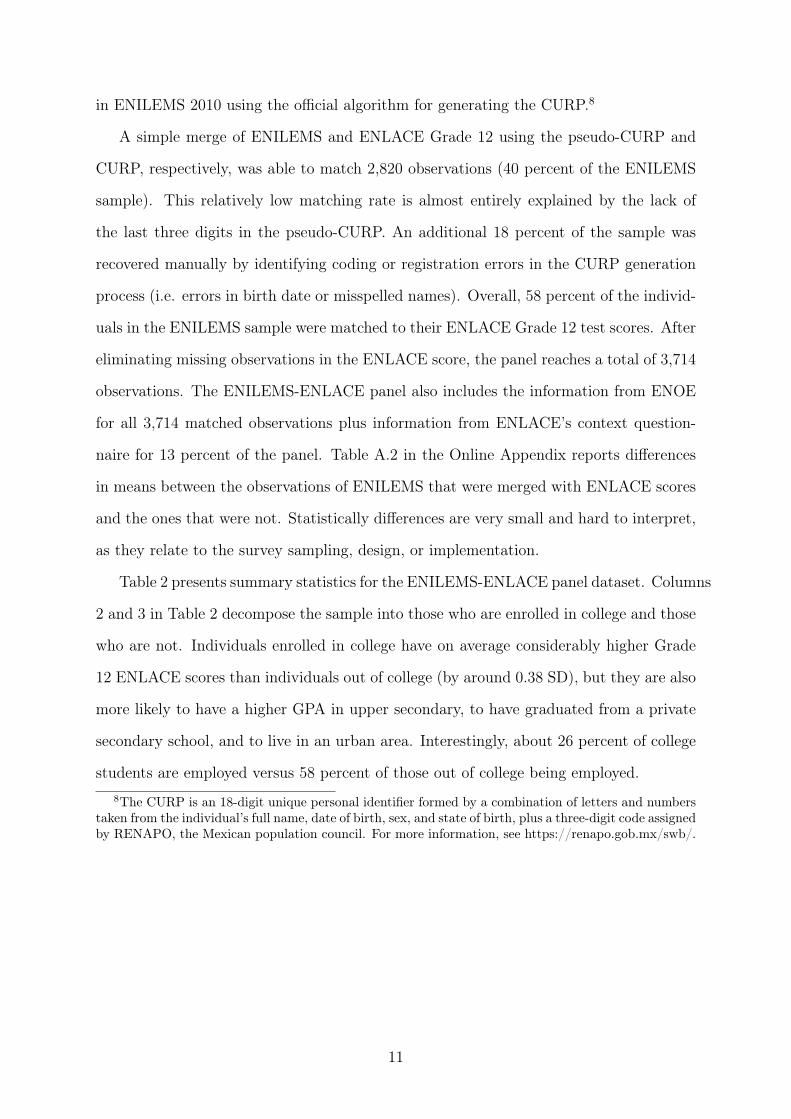
in ENILEMS 2010 using the official algorithm for generating the CURP.8
A simple merge of ENILEMS and ENLACE Grade 12 using the pseudo-CURP and
CURP, respectively, was able to match 2,820 observations (40 percent of the ENILEMS
sample). This relatively low matching rate is almost entirely explained by the lack of
the last three digits in the pseudo-CURP. An additional 18 percent of the sample was
recovered manually by identifying coding or registration errors in the CURP generation
process (i.e. errors in birth date or misspelled names). Overall, 58 percent of the individ-
uals in the ENILEMS sample were matched to their ENLACE Grade 12 test scores. After
eliminating missing observations in the ENLACE score, the panel reaches a total of 3,714
observations. The ENILEMS-ENLACE panel also includes the information from ENOE
for all 3,714 matched observations plus information from ENLACE’s context question-
naire for 13 percent of the panel. Table A.2 in the Online Appendix reports differences
in means between the observations of ENILEMS that were merged with ENLACE scores
and the ones that were not. Statistically differences are very small and hard to interpret,
as they relate to the survey sampling, design, or implementation.
Table 2 presents summary statistics for the ENILEMS-ENLACE panel dataset. Columns
2 and 3 in Table 2 decompose the sample into those who are enrolled in college and those
who are not. Individuals enrolled in college have on average considerably higher Grade
12 ENLACE scores than individuals out of college (by around 0.38 SD), but they are also
more likely to have a higher GPA in upper secondary, to have graduated from a private
secondary school, and to live in an urban area. Interestingly, about 26 percent of college
students are employed versus 58 percent of those out of college being employed.8The CURP is an 18-digit unique personal identifier formed by a combination of letters and numbers
taken from the individual’s full name, date of birth, sex, and state of birth, plus a three-digit code assignedby RENAPO, the Mexican population council. For more information, see https://renapo.gob.mx/swb/.
11
3 Methods
3.1 Econometric model
We are interested in the predictive power of ENLACE test scores over future schooling
and labor market outcomes. In particular, we are interested in the link between test
scores and three outcome variables: future educational attainment, student achievement,
and labor market outcomes including employment and wages. With this purpose in mind,
we write the following model:
yi = β0 + β1enlacei + β2girli + εi (1)
in which yi denotes an education or labor market outcome of individual i, enlacei is the
individual’s ENLACE test score in Grade 6 as a predictor of future education outcomes or
test scores at Grade 12 as a predictor for labor market outcomes or university enrollment.
and εi is a disturbance term. Our main parameter of interest is β1.
We use the ENLACE panel to study the relationship between Grade 6 test scores
and future education outcomes. First we estimate the relationship between Grade 6 test
scores and the probability of on-time graduation from lower- and upper-secondary school,
proxied by observing student “i” sitting for ENLACE in Grades 9 and 12, respectively.
We also use the ENLACE panel to examine the relationship between Grade 6 test scores
and test scores three and six years later, conditional on sitting for the tests.
The ENILEMS-ENLACE panel is used to examine the relationship between Grade 12
test scores and university enrollment and, conditional on not being enrolled in university,
labor market outcomes. The labor market outcomes included in our analysis are the
probability of being employed–conditional on not being enrolled in college–, and, among
those employed, the logarithm of the hourly wage, and the probability of having a formal
job.
Learning achievement is measured using an aggregated ENLACE test score, the simple
average of the math and Spanish scores, in our main specification. However, we also run
math and Spanish test scores in separate regressions (the results are presented in the
12
online Appendix 5).
We estimate Equation 1 using OLS. Because several of our outcomes are binary vari-
ables (e.g. graduating on time from high school, enrolling in university, etc.), one could
be worried about potential biases introduced in the estimation of β1 due to the linear
projection of test scores. As a robustness check, we run a Probit model for the binary
outcomes, which does not impose linear parameters as the OLS model and limit the pre-
dicted values of the dependent variable to the interval [0,1]. Results are presented in the
online Appendix 5.
As already stated, in this paper we aim, first, to study the predictive power of EN-
LACE test scores over future schooling and labor market outcomes, and second, to un-
derstand how much of ENLACE’s predictive power is related to the skills it captures as
opposed to just family background. In this second endeavor we face a couple of empirical
challenges, due to relevant variables being omitted from the analysis.
The main empirical challenge behind the identification of the relationship between
test scores and future outcomes is related to the correlation between test scores, future
outcomes, and family background. Test scores at Grade 6 have a positive relationship
with both school dropouts in subsequent grades and family income. Now, suppose, in an
extreme scenario, that school dropout is only explained by family income irrespective of
6th grade student achievement. In this case, since family background and test scores are
highly correlated, we will then find that 6th grade test scores predict schooling trajectories
—in line with our first research question—but this would not be due to the effects of skills,
which is important for our second research question. We use the richness of our datasets
to understand the contribution of family background to the simple correlation between
test scores at Grade 6 and future outcomes. To clarify ideas, we modify Equation 1 as
yi = β0 + β1enlacei + β2girli + τf + εi (2)
where τf denotes a family fixed effect. Including τf in the estimation and looking at
changes in β̂1 helps to understand the role of families in the simple correlation. This re-
quires, of course, having individuals who share the same family and who ideally were born
13
on the same day, to avoid changes in family circumstances or birth rank that bias the esti-
mation. By identifying twins in our large data set, we are able to estimate 2. To account
for the effects of all observable and unobservable family characteristics on education and
labor market outcomes, we run our model on a sample of twins with family fixed effects.
The fixed effects specification on the sample exploits just the within-family (between
twins) variation on 6th grade ENLACE, identifying, therefore, the relationship between
test scores and education and labor market outcomes net of family characteristics. We
interpret these estimated coefficients as the composite of the effect of skills at Grade 6,
as captured by ENLACE, on future outcomes and the (within-family) individual-level
variation in factors that produce better outcomes both in Grade 6 and later grades (e.g.
intelligence, motivation, and health). We also follow a more conventional approach in
which we substitute the vector τf for a vector X ′i of k student, and household observable
characteristics. In the ENLACE panel, this last specification uses the sample of students
who answered the ENLACE context questionnaire to control for differences in household
characteristics with respect to both maternal and paternal education (graduation from
lower secondary school or not) and parents’ occupation (blue- versus white-collar). In the
ENILEMS-ENLACE panel regressions, X ′i includes upper secondary school grade point
average (GPA), a dummy variable indicating graduation from a private upper secondary
school, residence in an urban area, sex, and age.
ENLACE test scores are likely not independent of other student characteristics which
are, in turn, important determinants of education and labor market trajectories. For
instance, math scores might be correlated with socio-emotional skills such as motivation
or perseverance that produce higher test scores today and better attainment, achievement
and labor market outcomes in the future. This type of omitted variable bias is not
necessarily a limitation of our empirical strategy since the objective of our exercise is not
to identify the effect of an exogenous change in, say, math skills at the end of primary
school holding constant all other student characteristics. Instead we want to understand
what drives the predictive power of test scores for future wellbeing. Test score outcomes
will surely be the result of a combination of previous subject-specific knowledge and
14
other factors such as socio-emotional skills. In Section 4 we discuss what are the skills
that ENLACE does capture and propose an empirical strategy to identify the impacts of
changes in subject-specific skills versus other characteristics such as personality traits or
socio-emotional skills.
4 Results
4.1 Grade 6 ENLACE and Secondary School Outcomes
Figure 3 plots local means of on-time graduation and test scores in Grades 9 and 12 by
ENLACE score percentile in Grade 6. We find a clear and positive relationship between
these variables. Higher test scores in Grade 6 are associated with a higher probability of
on-time graduation in Grades 9 and 12, and, conditional on this, with higher test scores
in Grades 9 and 12, as presented in panels (a) and (b) respectively. The differences in
outcomes between students in the top and bottom of the test score distribution in sixth
grade are startling. For example, less than 20 percent of students in the bottom decile of
the test score distribution in Grade 6 are enrolled in Grade 12 six years later, compared
to more than 50 percent of students in the top decile.
Table 3 quantifies the relationship depicted in Figure 3 by regressing graduation and
test scores in Grades 9 and 12 on ENLACE test scores at Grade 6, and a dummy for
whether the student is female, using the individual-level data. The results confirm the
strong association between ENLACE test scores at Grade 6 and secondary school out-
comes.
A one standard deviation (SD) increase in ENLACE test scores at Grade 6 is asso-
ciated with an increase in the probability of on-time graduation from lower and upper
secondary school of 10.3 percentage points and 11.9 percentage points, respectively. Both
results are statistically significant at the one-percent level (see columns 1 and 2). A sim-
ilar story goes for future test scores. A one SD increase in ENLACE test scores at Grade
6 is correlated with a 0.61-0.62 SD increase in test scores in Grades 9 and 12, conditional
on taking the ENLACE exam. Again, these results are statistically significant at the
15
one-percent level (see columns 3 and 4).
Note that Grade 6 test scores explain a larger share of the variation in future test
scores than of the variation in on-time graduation. The R-squared in the graduation
regressions is 0.059 and 0.069 (in Grades 9 and 12, respectively) while the R-squared in
the test score regressions is 0.362 and 0.342 (in the same grades). This implies that the
variables not included in this regression (such as family background) are relatively more
important explaining on-time graduation than future test scores.
We move now to study the degree to which the relationship between test scores and
future outcomes is driven by family background, which, very likely, affects both 6th grade
test scores and future education outcomes. To do so, we exploit the sample of twins in the
ENLACE Panel and run a specification including a vector of twin (family) fixed effects.
This allows us to study how variation in test scores at Grade 6 predicts variation in future
student outcomes holding constant all family characteristics (observed and unobserved).
We first estimate the same model used in Table 3 to verify that any change in the
coefficients of interest is due to the introduction of the family fixed effects and not due to
sample variation between the population of twins and the total population of ENLACE
takers. Columns 1-4 in Table 4 report the results from a model restricted to the sample of
twins and not including family fixed effects. Reassuringly, the estimated coefficients are
similar to those reported before. A 1 SD increase in Grade 6 test scores is associated with
a 8.2 and 10.5 percentage points higher probability of on-time graduation from Grades 9
and 12 (versus 10.3 and 11.9 in the full sample), and with 0.63 and 0.61 SD higher test
scores in Grades 9 and 12 (versus 0.61 and 0.62 in the full sample). For details, see columns
1-2 and 3-4. Columns 5-8 in Table 4 report the results of the estimations that include the
family fixed effects. Qualitatively, the findings are the same as the ones from previous
specifications: test scores at Grade 6 predict on-time graduation from Grades 9 and 12,
and conditional on this, test scores in Grades 9 and 12. In the four cases, the results
have a high statistical significance. However, as expected, the coefficients from the family
fixed-effects specification are smaller than those estimated using the main specification
16
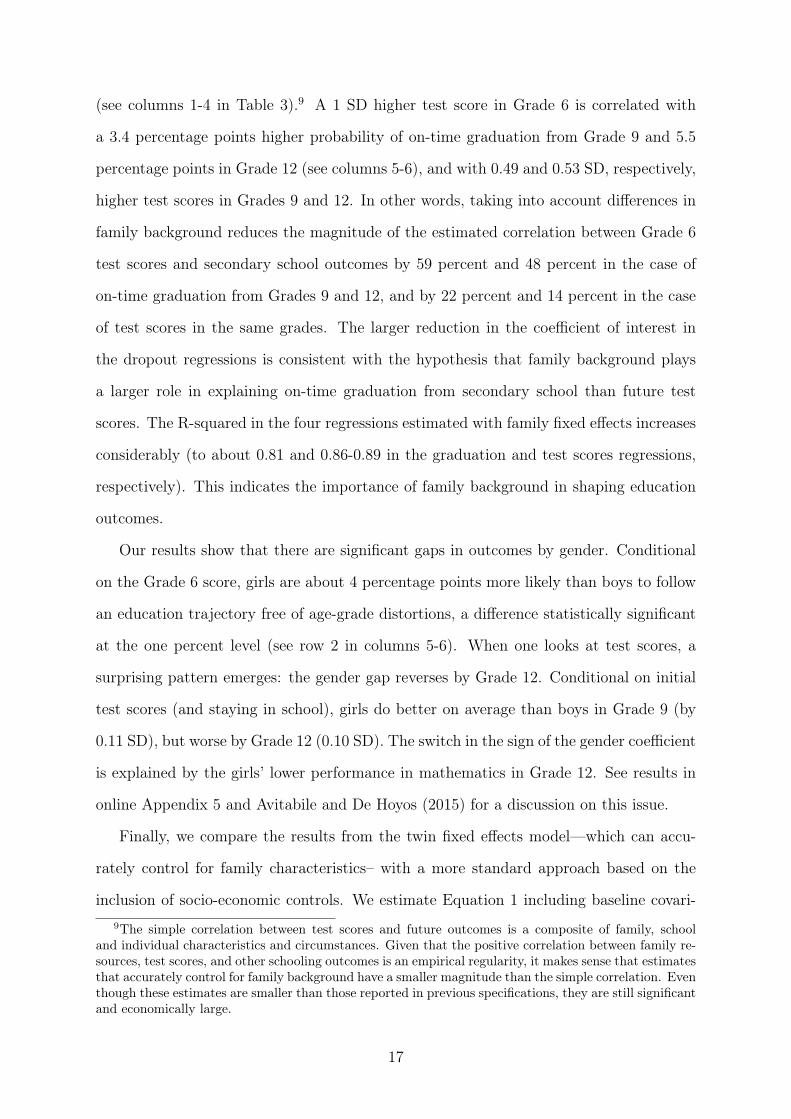
(see columns 1-4 in Table 3).9 A 1 SD higher test score in Grade 6 is correlated with
a 3.4 percentage points higher probability of on-time graduation from Grade 9 and 5.5
percentage points in Grade 12 (see columns 5-6), and with 0.49 and 0.53 SD, respectively,
higher test scores in Grades 9 and 12. In other words, taking into account differences in
family background reduces the magnitude of the estimated correlation between Grade 6
test scores and secondary school outcomes by 59 percent and 48 percent in the case of
on-time graduation from Grades 9 and 12, and by 22 percent and 14 percent in the case
of test scores in the same grades. The larger reduction in the coefficient of interest in
the dropout regressions is consistent with the hypothesis that family background plays
a larger role in explaining on-time graduation from secondary school than future test
scores. The R-squared in the four regressions estimated with family fixed effects increases
considerably (to about 0.81 and 0.86-0.89 in the graduation and test scores regressions,
respectively). This indicates the importance of family background in shaping education
outcomes.
Our results show that there are significant gaps in outcomes by gender. Conditional
on the Grade 6 score, girls are about 4 percentage points more likely than boys to follow
an education trajectory free of age-grade distortions, a difference statistically significant
at the one percent level (see row 2 in columns 5-6). When one looks at test scores, a
surprising pattern emerges: the gender gap reverses by Grade 12. Conditional on initial
test scores (and staying in school), girls do better on average than boys in Grade 9 (by
0.11 SD), but worse by Grade 12 (0.10 SD). The switch in the sign of the gender coefficient
is explained by the girls’ lower performance in mathematics in Grade 12. See results in
online Appendix 5 and Avitabile and De Hoyos (2015) for a discussion on this issue.
Finally, we compare the results from the twin fixed effects model—which can accu-
rately control for family characteristics– with a more standard approach based on the
inclusion of socio-economic controls. We estimate Equation 1 including baseline covari-9The simple correlation between test scores and future outcomes is a composite of family, school
and individual characteristics and circumstances. Given that the positive correlation between family re-sources, test scores, and other schooling outcomes is an empirical regularity, it makes sense that estimatesthat accurately control for family background have a smaller magnitude than the simple correlation. Eventhough these estimates are smaller than those reported in previous specifications, they are still significantand economically large.
17
ates measured in the ENLACE context questionnaire, which allows us to also control for
parental education and occupation. Specifically, the model includes a set of dummy vari-
ables equal to one when the mother (or father) completed lower secondary and a dummy
capturing if she (or he) is a white-collar worker. As before, we first estimate the simple
equation to verify that any change in the coefficients of interest is due to the inclusion of
covariates and not due to sample variation. Table 5 (columns 1 to 4) reports the results
without controls for parental characteristics but restricted to the sample included in the
ENLACE context questionnaire, which are similar to those already reported. Columns
5-8 in the same table report the results from the regressions that include family charac-
teristics. As expected, ENLACE test scores at Grade 6 are strong predictors of on-time
graduation and test scores at Grades 9 and 12, even after including in the model variables
that directly control for family background at the individual level. The inclusion of these
covariates reduces the point-estimator of the association between Grade 6 test scores and
the probability of on-time graduation in Grade 9 and 12 by 22 percent and 13 percent,
respectively; and by 3 percent for test scores for both Grades 9 and 12, respectively. This
reduction in the estimated parameter is considerably smaller than the reduction observed
by the inclusion of twin fixed effects, which shows the importance of unobserved family
characteristics, orthogonal to the conventional parental control, that are important in
determining future education outcomes.
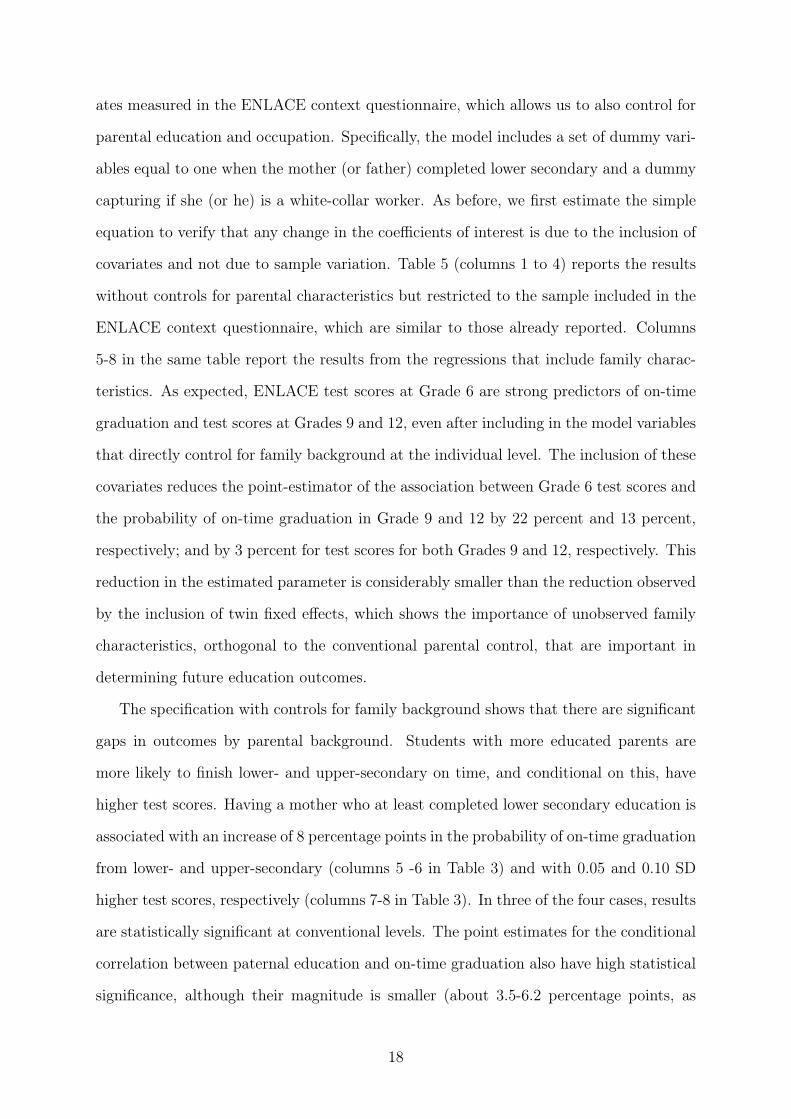
The specification with controls for family background shows that there are significant
gaps in outcomes by parental background. Students with more educated parents are
more likely to finish lower- and upper-secondary on time, and conditional on this, have
higher test scores. Having a mother who at least completed lower secondary education is
associated with an increase of 8 percentage points in the probability of on-time graduation
from lower- and upper-secondary (columns 5 -6 in Table 3) and with 0.05 and 0.10 SD
higher test scores, respectively (columns 7-8 in Table 3). In three of the four cases, results
are statistically significant at conventional levels. The point estimates for the conditional
correlation between paternal education and on-time graduation also have high statistical
significance, although their magnitude is smaller (about 3.5-6.2 percentage points, as
18
shown in columns 5 -6 on Table 3). In contrast, we do not observe a statistical relationship
between paternal education and test scores in Grades 9 and 12 (columns 7-8 in Table 3).
Summing up, we find that test scores at the end of primary school are a large and
robust predictor of on-time graduation and test scores in lower- and upper-secondary.
Conditional on Grade 6 test scores, there are clear gender and socioeconomic gaps in
graduation and achievement in secondary school. Students with lower test scores in
Grade 6 face a larger risk of dropping out of school and going through life with low levels
of skills. These findings persist when we accurately deal with family background using
the sample of twins. We also find that (1) Grade 6 test scores explain a larger share of
the variation in future test scores than in on-time graduation, and (2) family background
has a more prominent role driving the simple correlation between Grade 6 test scores and
on-time graduation than between Grade 6 test scores and future test scores. This finding
suggests that family background plays a larger role in explaining on-time graduation from
secondary school than future test scores.
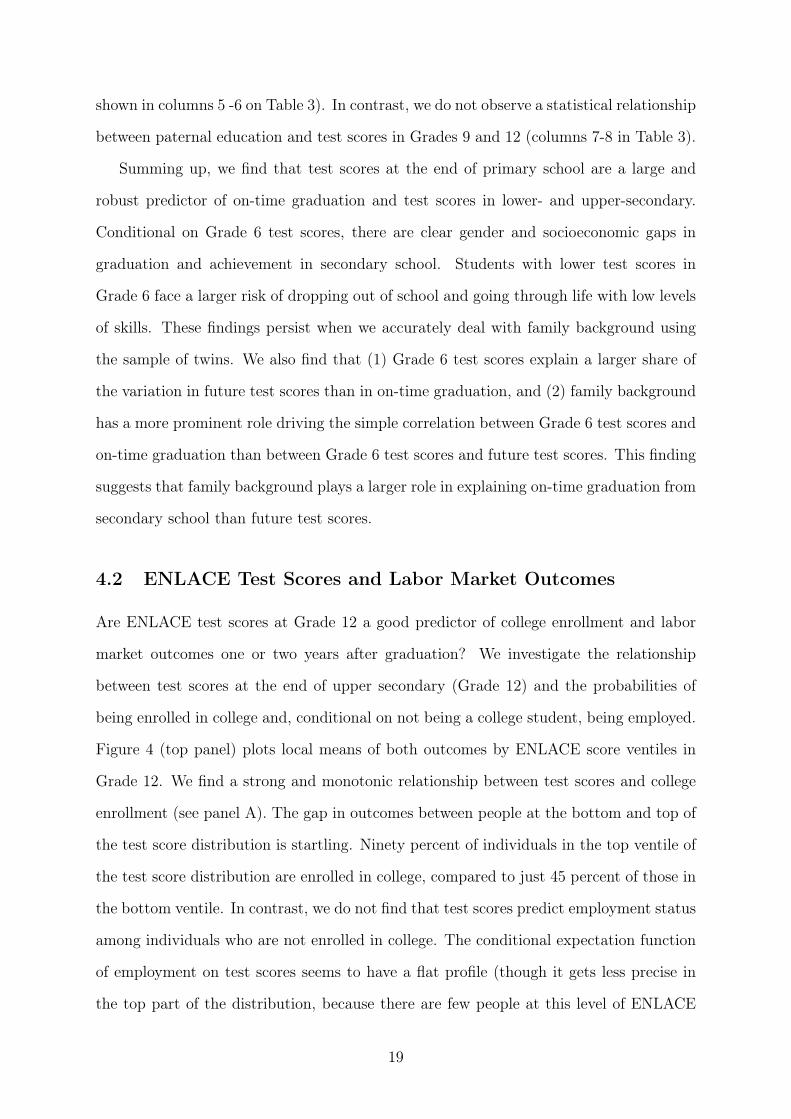
4.2 ENLACE Test Scores and Labor Market Outcomes
Are ENLACE test scores at Grade 12 a good predictor of college enrollment and labor
market outcomes one or two years after graduation? We investigate the relationship
between test scores at the end of upper secondary (Grade 12) and the probabilities of
being enrolled in college and, conditional on not being a college student, being employed.
Figure 4 (top panel) plots local means of both outcomes by ENLACE score ventiles in
Grade 12. We find a strong and monotonic relationship between test scores and college
enrollment (see panel A). The gap in outcomes between people at the bottom and top of
the test score distribution is startling. Ninety percent of individuals in the top ventile of
the test score distribution are enrolled in college, compared to just 45 percent of those in
the bottom ventile. In contrast, we do not find that test scores predict employment status
among individuals who are not enrolled in college. The conditional expectation function
of employment on test scores seems to have a flat profile (though it gets less precise in
the top part of the distribution, because there are few people at this level of ENLACE
19
who are out of college). Figure 4 (bottom panels) also depicts the relationship between
test scores and employment characteristics among the employed. We observe here that
higher test scores predict higher wages, with the exception of the top decile, but because
only 20% of individuals in this decile work, we have less precision here. There seems not
to be a statistical association between test scores and the probability of being employed
in the formal sector of the economy (conditional on being employed).
To estimate if the predictive power of test scores at Grade 12 over college enrollment
and wages is robust to the inclusion of controls, we ran an alternative specification. Table
6 reports the results of regressing post-secondary school outcomes on Grade 12 test scores,
GPA for upper secondary, indicators for whether the individual is a female, a graduate
of a private high school, and an urban resident, plus a vector of state and year of birth
fixed-effects. We find a strong relationship between test scores and college enrollment (see
column 1). A 1-SD increase in the ENLACE score is associated with a 10 percentage point
increase in the probability of college enrollment (a result statistically significant at the
one percent level). The GPA in upper secondary school is also positively associated with
college enrollment. A 1-SD increase in the former predicts an increase of 7 percentage
points in the latter, with statistical significance at the one percent level.
It stands out that conditional on these two measures of ability, females are 5 percentage
points less likely to be enrolled in college (statistical significance at the ten percent level)
and graduates of private secondary schools are 11 percentage points more likely to be
enrolled in college (statistical significance at the one percent level). In other words,
holding constant test scores and secondary school GPA, there is a gender and family
background gap in college enrollment against women and public school graduates.
Estimates in column 2 confirm that among those individuals out of college there is no
association between test scores and employment status. Among those who are employed,
we do not find that test scores have predictive power over being employed in a formal firm
(see column 4). However, among those employed, test scores have a large and significant
relationship with future hourly wages. As reported in column 3 of Table 6, a 1-SD increase
in test scores is associated with an increase of about 7 percent in the hourly wage.
20
In summary, we find that test scores at the end of secondary school predict college
enrollment and, for individuals who are employed, hourly wages. This relationship is
robust even when controlling for upper secondary GPA and graduation from a private
senior secondary school (a proxy for family background). We also find that, conditional
on test scores and upper secondary GPA, women and graduates from public schools are
less likely to be enrolled in college.
4.3 Robustness Checks
As discussed in Section 3, the estimation of a linear probability model, as applied so far,
could lead to potential biases in β̂1 due to the linear projection of test scores. To address
this concern, we estimate probit regressions for our binary outcomes, using the same
variables as in the OLS estimation. The estimations using this alternative specification
are similar to those presented in the previous subsection. We find a positive and strong
(statistically and economically) relationship between test scores at Grade 6 and on-time
graduation in Grades 9 and 12. The same is true for the relationship between test scores
at Grade 12 and college enrollment. The probit results show that test scores at Grade
12 do not predict the conditional probability of being employed nor of being employed
in a formal firm, which is consistent with the OLS results reported above. Results are
available in online Appendix 5.
4.4 What Skills Do Test Scores Capture?
In Section 3, we discussed a finding that, even holding constant a student’s family back-
ground, ENLACE scores could capture both the numeracy and literacy skills that the
test is designed to measure, as well as other unobservable skills or cofounders that pro-
duce higher test scores, such as health, motivation, or other socio-emotional skills. Given
our interest in understanding what drives the relationship between test scores and future
outcomes, we turn now to further investigate this issue. To formalize these ideas, we
suppose that the production function of test scores can be modeled in the following way:
21
enlacesist = α0 + α1aist + α2git + τf + eit (3)
where enlacesit is student i from family f ’s test score in subject s„ αist is the specific
skills to subject s of student i from family f , git is general skills of student i from family
f , τf is a vector of family fixed effects, and eit is a random disturbance term.This model
makes explicit that test scores are produced by both general and subject-specific skills.
Now, since test scores in two different subjects, math and language, are available, we can
estimate the following specification:
enlacemathit = β0 + β1enlace
mathit−1 + β2enlace
languageit−1 + τf + εit (4)
Equation 4 is a modified version of our main specification that allows us to study the
relationship between student i’s test score in a particular subject area at Grade 6 and the
score for the same area in Grades 9 and 12 controlling for the Grade 6 score in the other
subject area. The underlying assumption in Equation 4 is that there are skills that have
a common effect on math and language test scores and which can therefore be captured
by including them in the equation scores on the other subject area. Our strategy does
not deal with the component of skills that produces higher test scores in one subject, nor
with other potential cofounders that affect Grade 6 and later test scores and that are
subject-specific and within-family specific. In other words, this specification is useful to
deal with individual-level factors that affect test scores in math and language in a similar
fashion (e.g. student motivation to perform in standardized exams). We interpret β1
in Equation 4 as the composite effect of subject-specific skills in Grade 6 on future test
scores and other (within-family) factors that affect subject-specific test scores in Grade
6 and subsequent grades.
Table 7 reports the results of estimating Equation 4 in the sample of twins. Both
math and Spanish scores in Grade 6 predict scores in those subject areas in Grades 9 and
12, even when controlling for Grade 6 scores in the other subject area. The coefficients of
interest (see row 1 in columns 1 and 2 and row 2 in columns 3 and 4) have a large statistical
22
and economical significance. Notice that the point estimator of β1 in specification 4 is
significantly smaller than the one presented in Table 4, as one would expect if test scores
were driven by both initial subject-specific and general skills. Once the effects of general
skills are removed, the association between one SD higher test scores in Grade 6 is about
0.25-0.34 SD on test scores in 9th and 12th grades (as opposed to the 0.49-0.52 SD
reported in Table 4). The implied estimates for general skills at Grade 6 on future test
scores is about 0.2 SD and highly significant–see row 2 in columns 1 and 2 and row 1
in columns 3 and 4 in Table 7. These results suggest that test scores at Grade 6 are
a strong predictor of future education trajectories with the persistence working through
the positive link between initial and future subject-specific skills and through the positive
effects of initial general skills on future education outcomes.
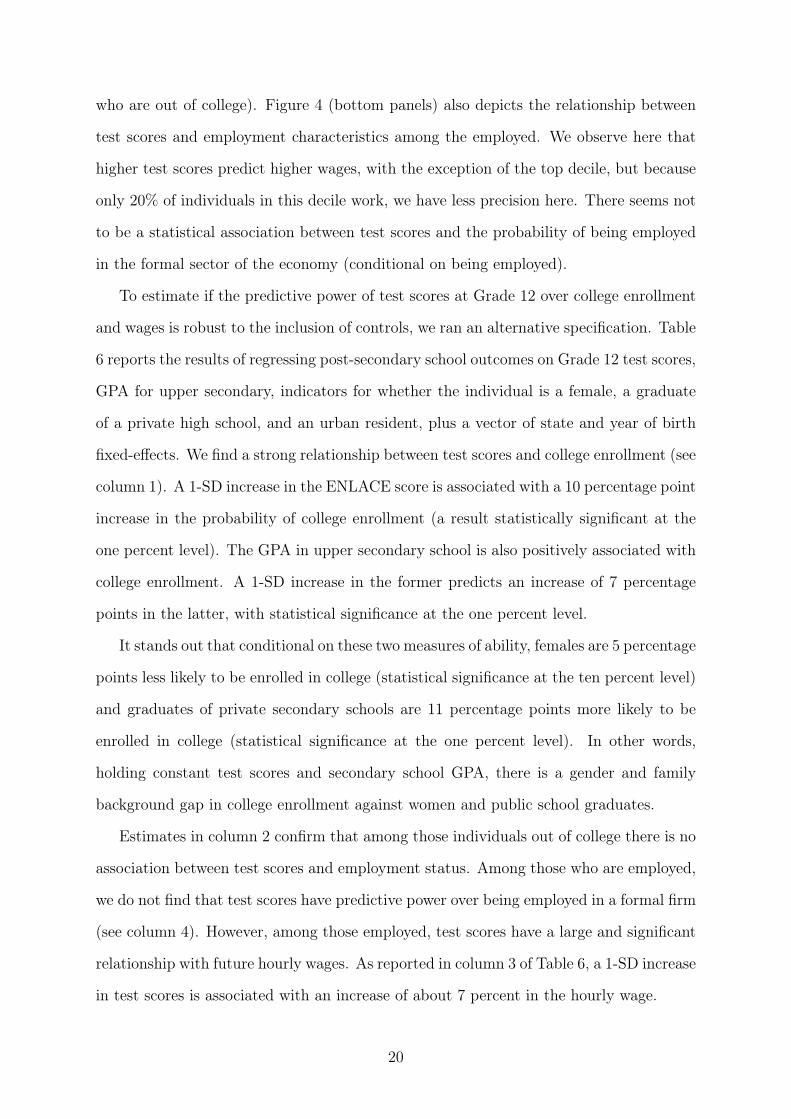
Finally, we go back to the ENILEMS-ENLACE panel and look at average ENLACE
test scores in mathematics and Spanish (at the end of secondary school) by university
field of studies (see Figure 5). If ENLACE captures specific skills and students tend to
self-select to university degrees that match better their stock of skills, one would expect
to observe that students enrolled in majors that require higher math (Spanish) skills,
have higher test scores in this subject. Importantly for our story, engineering students
tend to have higher test scores in mathematics than in Spanish, while the opposite is true
for Social Science students. We interpret this pattern as complementary evidence that
ENLACE indeed captures the specific skills it is designed to measure. Furthermore, to
our knowledge, this is the first piece of evidence about how university students sort by
ability into fields of study in Mexico.
5 Conclusions
Using the Mexican census-based standardized test ENLACE, we construct a longitudinal
dataset tracking students’ completion of and test scores in Grades 6, 9, and 12. Our
analysis shows that higher test scores at Grade 6 have a large and significant relationship
with the student’s likelihood of finishing lower- and upper-secondary school on time and,
23
among those who finish, with their test scores levels. Using a sample of twins to deal
with differences by family background, we find that a reduction of 1 SD in test scores in
sixth grade reduces by 5.5 percentage points the probability of graduating from upper
secondary (the mandatory education level), and, among those who graduated, it reduces
their Grade 12 test scores by 0.53 SD. We present compelling evidence that these effects
are driven by the levels of subject-specific knowledge at sixth grade (as captured by the
standardized test) rather than by unobservables such as socio-emotional skills.
The paper also assesses the short-term relationship between Grade 12 test scores and
post-secondary outcomes such as university enrollment, employment in the formal sector,
and hourly wages. For this objective, we merge upper secondary ENLACE test scores
with a labor market survey to follow students one or two years after graduation. Our
results show that test scores are a strong and positive predictor of university enrollment,
and, conditional on students not being enrolled and being employed, it also correlates
positively with hourly wages. A positive change of one SD in test scores at the end of
upper-secondary is associated with a 10 percentage point increase in the likelihood of
enrolling in university, and, conditional on being employed, it increases hourly wages
by 6 percent. We found no significant effects of Grade 12 test scores on the likelihood
of being employed in the formal sector. All these results are robust to the inclusion of
socio-economic controls, state, and year of birth fixed-effects and upper secondary grade
point average (GPA).
The significant relationship between Grade 12 test scores and wages is somewhat
surprising considering that all the individuals in our panel have the same number of years
of schooling and many of them are holding their first jobs. Most likely, the relationship
between upper secondary test scores and wages is a lower-bound estimate of the medium-
and long-run estimates. This would be the case if, for instance, employers have imperfect
information about the true skills of high school graduate applicants, and they learn
progressively about those skills as the new employees spend more time on the job. A
second possible reason for expecting a larger association between test scores and wages
in the medium- to long-term is if individuals accumulate human capital in the workplace,
24
enabling those with relatively high test scores to increase their wages.
These results shed light on how disadvantages at early stages in the education tra-
jectories can have important and persistent implications for future education and labor
market outcomes. The concept that learning begets learning is corroborated by evidence
presented here showing that a low learning outcome in sixth grade can have a negative
consequence in personal incomes 10 years later. The lower performance in sixth grade
works its way forward in time, signaling lower chances of completing upper secondary
and, if the student graduates, reduced learning outcomes which, in turn, diminish the
individual’s probability of entering university, and among those who do not enter, reduce
their wages. This should make a failing mark at the end of primary school–or earlier–a
trigger for strong attention and support for the student. We believe that, despite their
limitations, large-scale standardized tests like ENLACE capture skills that are important
for wellbeing. Our findings support the rationale for using test score results in com-
bination with information on family background to identify students at risk and set in
motion the necessary remediation steps to reduce the path dependency that we present
here. By identifying early in their education trajectories students who need more sup-
port, large-scale standardized tests can help create an education system that promotes
equality and social mobility, rather than one that simply replicates or even exacerbates
existing inequalities.
25
References
Avitabile, C. and R.E De Hoyos, “The Heterogeneous effect of information on student
performance : evidence from a randomized control trial in Mexico,” 2015. Policy
Research working paper; no. WPS 7422. Washington, D.C. : World Bank Group.
CAF, RED 2016. Más habilidades para el trabajo y la vida: los aportes de la familia, la
escuela, el entorno y el mundo laboral., Bogotá: CAF, 2016.
Chetty, Raj, John N. Friedman, Nathaniel Hilger, Emmanuel Saez, Di-
ane Whitmore Schanzenbach, and Danny Yagan, “How Does Your Kindergarten
Classroom Affect Your Earnings? Evidence from Project Star *,” The Quarterly Jour-
nal of Economics, 2011, 126 (4), 1593–1660.
Contreras, S and E Backoff, “Tendencias en el aprendizaje de la educación en México:
una comparación entre ENLACE, Excale y Pisa,” 2014. Nexos.
de Hoyos, Rafael, Vicente A Garcia-Moreno, and Harry Anthony Patrinos,
“The impact of an accountability intervention with diagnostic feedback: Evidence from
Mexico,” Economics of Education Review, 2017, 58, 123–140.
Deere, Donald and Wayne Strayer, “Putting schools to the test: School account-
ability, incentives, and behavior,” Department of Economics, Texas A&M University
(March 2001), 2001.
Figlio, David and Susanna Loeb, “School Accountability,” in Erik Hanushek, Stephen
Machin, and Ludger Woessmann, eds., Handbook of The Economics of Education, 1
ed., Vol. 3, Elsevier, 2011, chapter 08, pp. 383–421.
Ganimian, A. J. and D. M Koretz, “(How) Can we use international large-scale
assessments to benchmark educational performance?,” 2013. Unpublished manuscript.
Cambridge, MA: Harvard Graduate School of Education.
26
Gneezy, Uri, John A List, Jeffrey A Livingston, Sally Sadoff, Xiangdong Qin,
and Yang Xu, “Measuring success in education: the role of effort on the test itself,”
Technical Report, National Bureau of Economic Research 2017.
Jencks, Christopher and Meredith Phillips, The Black-White test score gap, Brook-
ings Institution Press, 2011.
Koretz, Daniel, The Testing Charade: Pretending to Make Schools Better, University
of Chicago Press, 2017.
Koretz, Daniel M and Sheila I Barron, The Validity of Gains in Scores on the
Kentucky Instructional Results Information System (KIRIS)., ERIC, 1998.
Lindqvist, Erik and Roine Vestman, “The Labor Market Returns to Cognitive and
Noncognitive Ability: Evidence from the Swedish Enlistment,” American Economic
Journal: Applied Economics, January 2011, 3 (1), 101–128.
Meghir, Costas, Mårten Palme, and Emilia Simeonova, “Education, Cognition
and Health: Evidence from a Social Experiment,” Working Paper 19002, National
Bureau of Economic Research April 2013.
Neal, Derek, “The Design of Performance Pay inEducation,” in Erik Hanushek, Stephen
Machin, and Ludger Woessmann, eds., Handbook of The Economics of Education, 1
ed., Vol. 4, Elsevier, 2011, chapter 06, pp. 495–550.
Rivera-Batiz, Francisco L, “Quantitative literacy and the likelihood of employment
among young adults in the United States,” Journal of Human Resources, 1992, pp. 313–
328.
Rose, Heather, “Do gains in test scores explain labor market outcomes?,” Economics
of Education Review, 2006, 25 (4), 430–446.
Santibáñez, Lucrecia, José Felipe Martínez, Ashlesha Datar, Patrick J McE-
wan, Claude Messan Setodji, and Ricardo Basurto-Dávila, “Haciendo camino,”
2007.
27

World Bank, World Development Report 2018: Learning to Realize Education’s
Promise, Washington, DC: World Bank, 2018.
28
Tables
Table 1: ENLACE Panel – Means and Standard Deviations(1) (2) (3) (4) (5)
Enlace takers Survey TwinsVARIABLES Grade 6 Grade 9 Grade 12 Grade 6 Grade 6
Score Grade 6 512.2 527.3 550.0 527.8 515.6(100.8) (98.96) (95.74) (105.8) (100.7)
Enlace taker Grade 9 0.712 1 1 0.769 0.764(0.453) (0) (0) (0.421) (0.425)
Enlace taker Grade 12 0.323 0.453 1 0.370 0.379(0.468) (0.498) (0) (0.483) (0.485)
Girl 0.469 0.498 0.524 0.473 0.535(0.499) (0.500) (0.499) (0.499) (0.499)
Private School Grade 6 0.0822 0.0970 0.119 0.0578 0.0954(0.275) (0.296) (0.323) (0.233) (0.294)
Mother has lower secondary 0.539(0.499)
Father has lower secondary 0.586(0.493)
Mother is white collar 0.114(0.318)
Father is white collar 0.207(0.405)
Observations 1,986,190 1,414,848 641,332 4,672 20,187Notes: The table shows the mean and standard deviations of all students matched in the ENLACE panel in 2007(column 1), 2010 (column 2) and 2013 (column 3). Column 4 displays additional variables from student and parentssurveys that were applied to a sample of ENLACE takers. Column 5 reports statistics for the sample of identifiedtwins in grade 6. Data: ENLACE panel.
29
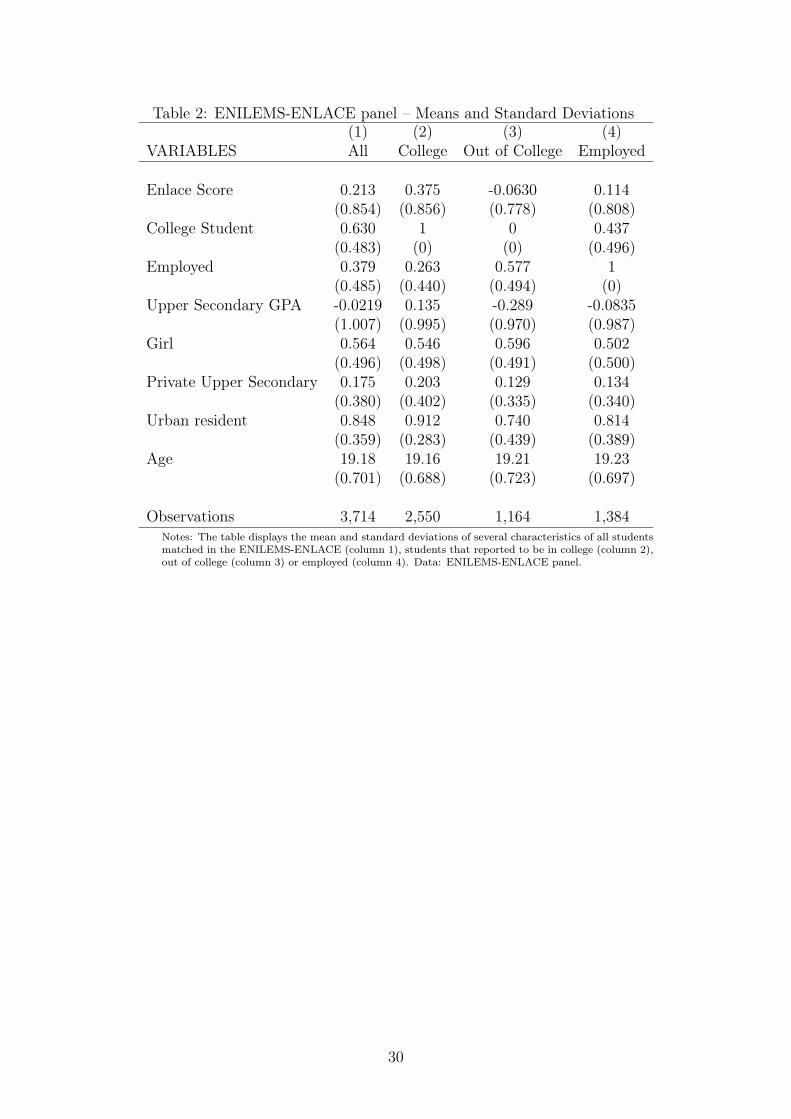
Table 2: ENILEMS-ENLACE panel – Means and Standard Deviations(1) (2) (3) (4)
VARIABLES All College Out of College Employed
Enlace Score 0.213 0.375 -0.0630 0.114(0.854) (0.856) (0.778) (0.808)
College Student 0.630 1 0 0.437(0.483) (0) (0) (0.496)
Employed 0.379 0.263 0.577 1(0.485) (0.440) (0.494) (0)
Upper Secondary GPA -0.0219 0.135 -0.289 -0.0835(1.007) (0.995) (0.970) (0.987)
Girl 0.564 0.546 0.596 0.502(0.496) (0.498) (0.491) (0.500)
Private Upper Secondary 0.175 0.203 0.129 0.134(0.380) (0.402) (0.335) (0.340)
Urban resident 0.848 0.912 0.740 0.814(0.359) (0.283) (0.439) (0.389)
Age 19.18 19.16 19.21 19.23(0.701) (0.688) (0.723) (0.697)
Observations 3,714 2,550 1,164 1,384Notes: The table displays the mean and standard deviations of several characteristics of all studentsmatched in the ENILEMS-ENLACE (column 1), students that reported to be in college (column 2),out of college (column 3) or employed (column 4). Data: ENILEMS-ENLACE panel.
30
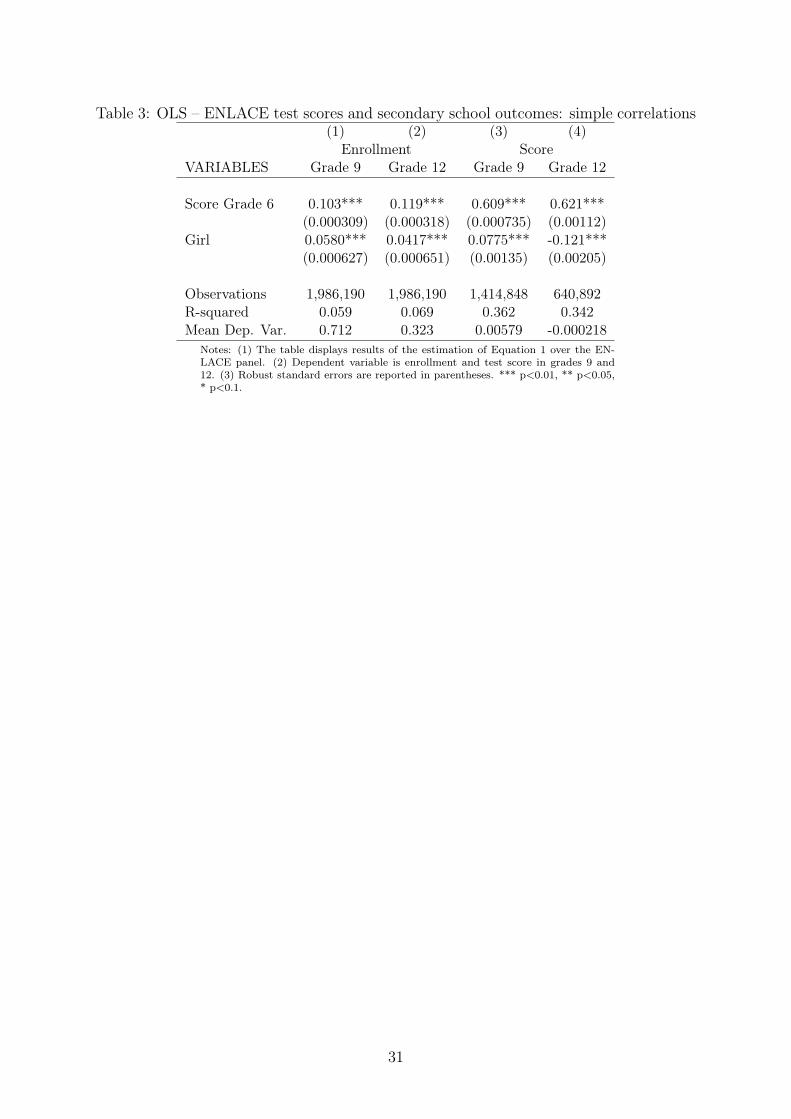
Table 3: OLS – ENLACE test scores and secondary school outcomes: simple correlations(1) (2) (3) (4)
Enrollment ScoreVARIABLES Grade 9 Grade 12 Grade 9 Grade 12
Score Grade 6 0.103*** 0.119*** 0.609*** 0.621***(0.000309) (0.000318) (0.000735) (0.00112)
Girl 0.0580*** 0.0417*** 0.0775*** -0.121***(0.000627) (0.000651) (0.00135) (0.00205)
Observations 1,986,190 1,986,190 1,414,848 640,892R-squared 0.059 0.069 0.362 0.342Mean Dep. Var. 0.712 0.323 0.00579 -0.000218
Notes: (1) The table displays results of the estimation of Equation 1 over the EN-LACE panel. (2) Dependent variable is enrollment and test score in grades 9 and12. (3) Robust standard errors are reported in parentheses. *** p<0.01, ** p<0.05,* p<0.1.
31
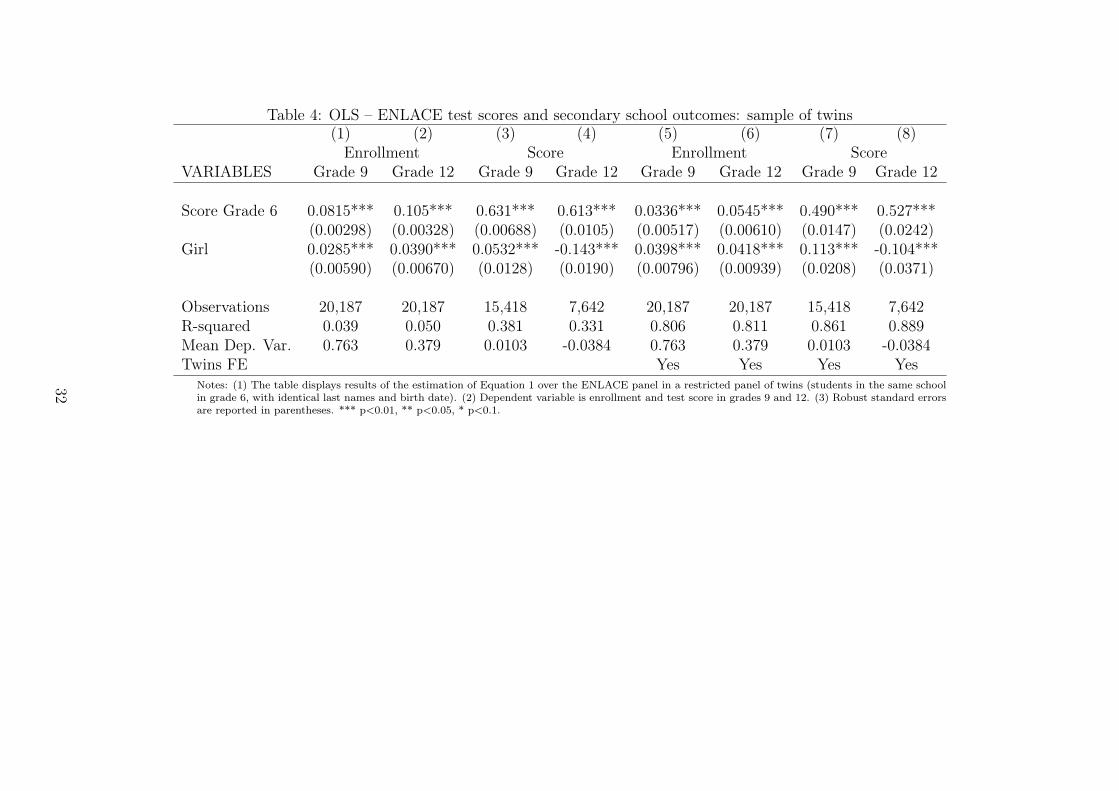
Table 4: OLS – ENLACE test scores and secondary school outcomes: sample of twins(1) (2) (3) (4) (5) (6) (7) (8)Enrollment Score Enrollment Score
VARIABLES Grade 9 Grade 12 Grade 9 Grade 12 Grade 9 Grade 12 Grade 9 Grade 12
Score Grade 6 0.0815*** 0.105*** 0.631*** 0.613*** 0.0336*** 0.0545*** 0.490*** 0.527***(0.00298) (0.00328) (0.00688) (0.0105) (0.00517) (0.00610) (0.0147) (0.0242)
Girl 0.0285*** 0.0390*** 0.0532*** -0.143*** 0.0398*** 0.0418*** 0.113*** -0.104***(0.00590) (0.00670) (0.0128) (0.0190) (0.00796) (0.00939) (0.0208) (0.0371)
Observations 20,187 20,187 15,418 7,642 20,187 20,187 15,418 7,642R-squared 0.039 0.050 0.381 0.331 0.806 0.811 0.861 0.889Mean Dep. Var. 0.763 0.379 0.0103 -0.0384 0.763 0.379 0.0103 -0.0384Twins FE Yes Yes Yes Yes
Notes: (1) The table displays results of the estimation of Equation 1 over the ENLACE panel in a restricted panel of twins (students in the same schoolin grade 6, with identical last names and birth date). (2) Dependent variable is enrollment and test score in grades 9 and 12. (3) Robust standard errorsare reported in parentheses. *** p<0.01, ** p<0.05, * p<0.1.
32
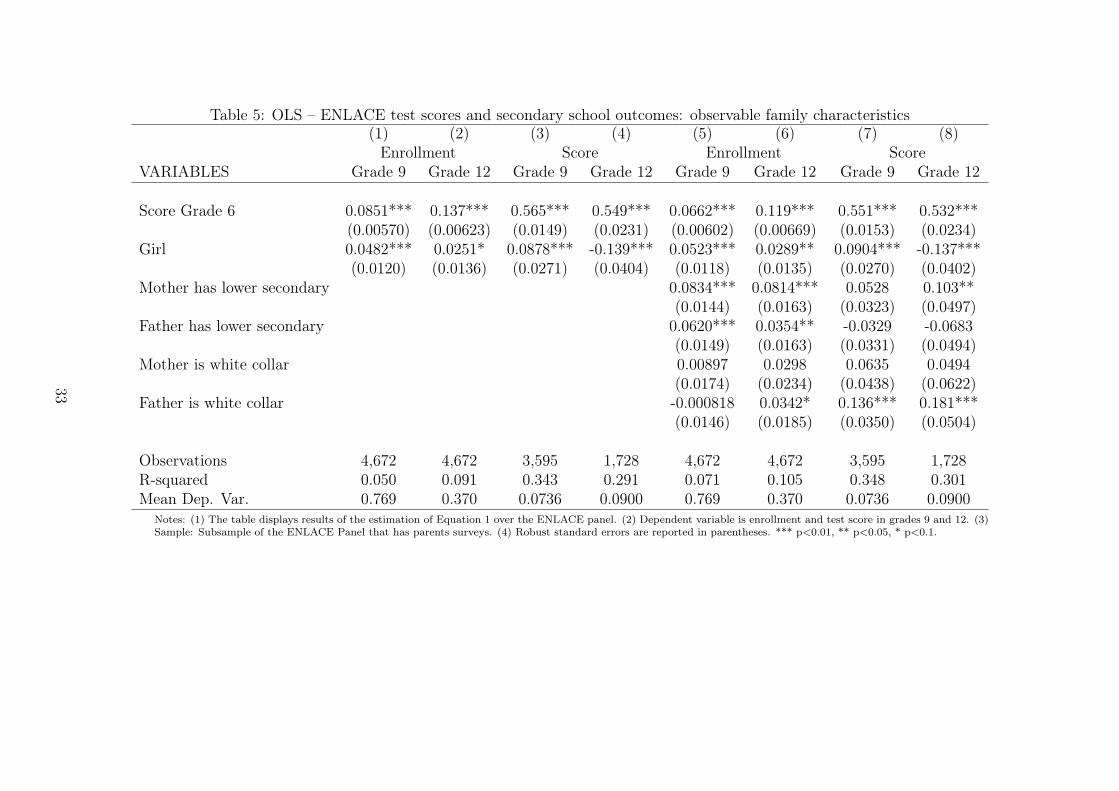
Table 5: OLS – ENLACE test scores and secondary school outcomes: observable family characteristics(1) (2) (3) (4) (5) (6) (7) (8)Enrollment Score Enrollment Score
VARIABLES Grade 9 Grade 12 Grade 9 Grade 12 Grade 9 Grade 12 Grade 9 Grade 12
Score Grade 6 0.0851*** 0.137*** 0.565*** 0.549*** 0.0662*** 0.119*** 0.551*** 0.532***(0.00570) (0.00623) (0.0149) (0.0231) (0.00602) (0.00669) (0.0153) (0.0234)
Girl 0.0482*** 0.0251* 0.0878*** -0.139*** 0.0523*** 0.0289** 0.0904*** -0.137***(0.0120) (0.0136) (0.0271) (0.0404) (0.0118) (0.0135) (0.0270) (0.0402)
Mother has lower secondary 0.0834*** 0.0814*** 0.0528 0.103**(0.0144) (0.0163) (0.0323) (0.0497)
Father has lower secondary 0.0620*** 0.0354** -0.0329 -0.0683(0.0149) (0.0163) (0.0331) (0.0494)
Mother is white collar 0.00897 0.0298 0.0635 0.0494(0.0174) (0.0234) (0.0438) (0.0622)
Father is white collar -0.000818 0.0342* 0.136*** 0.181***(0.0146) (0.0185) (0.0350) (0.0504)
Observations 4,672 4,672 3,595 1,728 4,672 4,672 3,595 1,728R-squared 0.050 0.091 0.343 0.291 0.071 0.105 0.348 0.301Mean Dep. Var. 0.769 0.370 0.0736 0.0900 0.769 0.370 0.0736 0.0900
Notes: (1) The table displays results of the estimation of Equation 1 over the ENLACE panel. (2) Dependent variable is enrollment and test score in grades 9 and 12. (3)Sample: Subsample of the ENLACE Panel that has parents surveys. (4) Robust standard errors are reported in parentheses. *** p<0.01, ** p<0.05, * p<0.1.
33
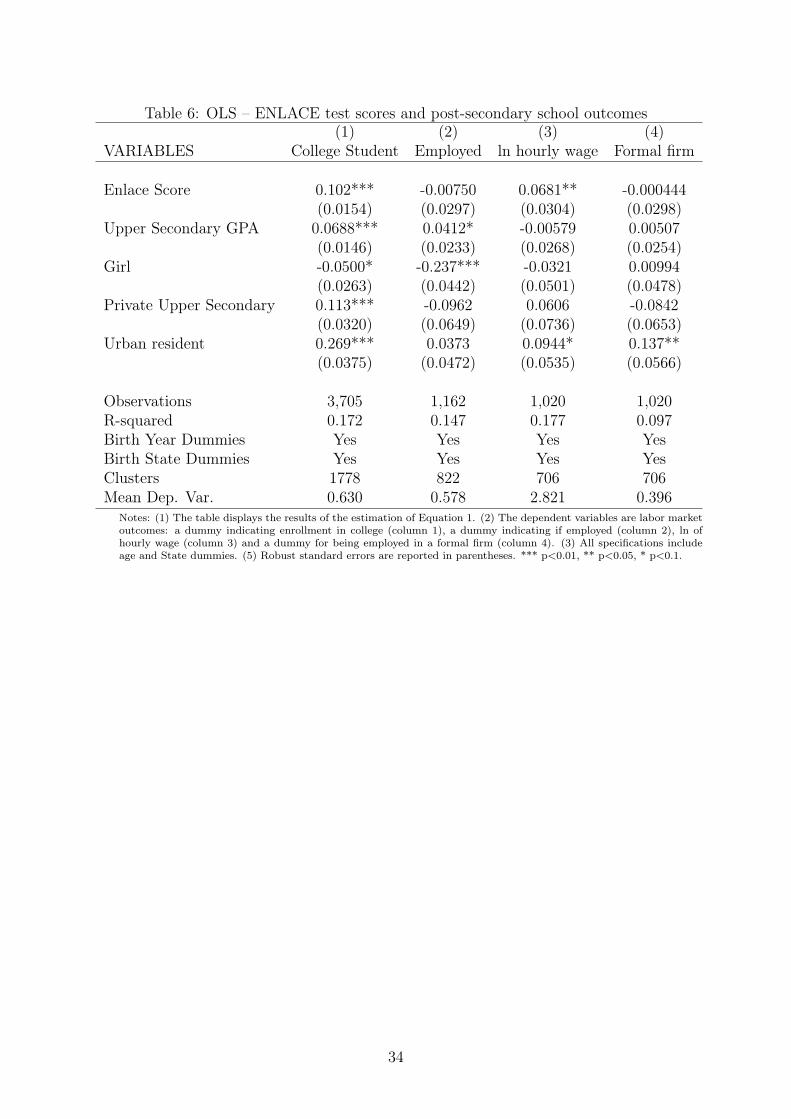
Table 6: OLS – ENLACE test scores and post-secondary school outcomes(1) (2) (3) (4)
VARIABLES College Student Employed ln hourly wage Formal firm
Enlace Score 0.102*** -0.00750 0.0681** -0.000444(0.0154) (0.0297) (0.0304) (0.0298)
Upper Secondary GPA 0.0688*** 0.0412* -0.00579 0.00507(0.0146) (0.0233) (0.0268) (0.0254)
Girl -0.0500* -0.237*** -0.0321 0.00994(0.0263) (0.0442) (0.0501) (0.0478)
Private Upper Secondary 0.113*** -0.0962 0.0606 -0.0842(0.0320) (0.0649) (0.0736) (0.0653)
Urban resident 0.269*** 0.0373 0.0944* 0.137**(0.0375) (0.0472) (0.0535) (0.0566)
Observations 3,705 1,162 1,020 1,020R-squared 0.172 0.147 0.177 0.097Birth Year Dummies Yes Yes Yes YesBirth State Dummies Yes Yes Yes YesClusters 1778 822 706 706Mean Dep. Var. 0.630 0.578 2.821 0.396
Notes: (1) The table displays the results of the estimation of Equation 1. (2) The dependent variables are labor marketoutcomes: a dummy indicating enrollment in college (column 1), a dummy indicating if employed (column 2), ln ofhourly wage (column 3) and a dummy for being employed in a formal firm (column 4). (3) All specifications includeage and State dummies. (5) Robust standard errors are reported in parentheses. *** p<0.01, ** p<0.05, * p<0.1.
34
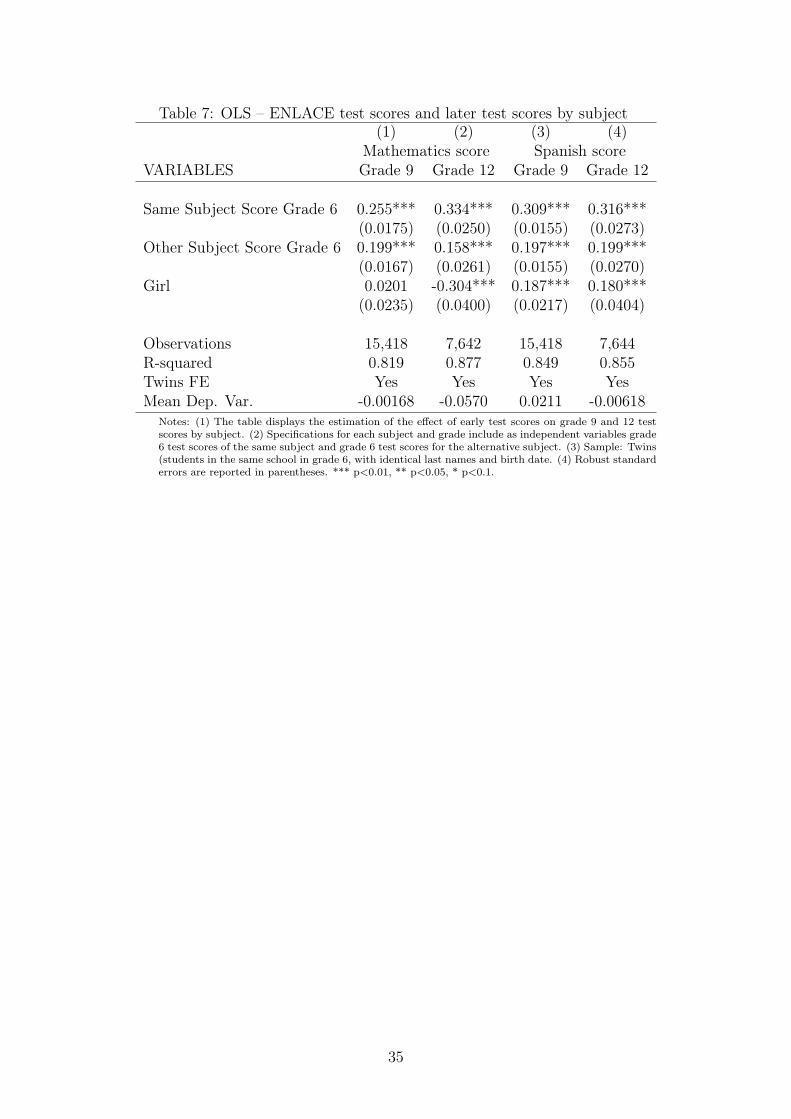
Table 7: OLS – ENLACE test scores and later test scores by subject(1) (2) (3) (4)
Mathematics score Spanish scoreVARIABLES Grade 9 Grade 12 Grade 9 Grade 12
Same Subject Score Grade 6 0.255*** 0.334*** 0.309*** 0.316***(0.0175) (0.0250) (0.0155) (0.0273)
Other Subject Score Grade 6 0.199*** 0.158*** 0.197*** 0.199***(0.0167) (0.0261) (0.0155) (0.0270)
Girl 0.0201 -0.304*** 0.187*** 0.180***(0.0235) (0.0400) (0.0217) (0.0404)
Observations 15,418 7,642 15,418 7,644R-squared 0.819 0.877 0.849 0.855Twins FE Yes Yes Yes YesMean Dep. Var. -0.00168 -0.0570 0.0211 -0.00618
Notes: (1) The table displays the estimation of the effect of early test scores on grade 9 and 12 testscores by subject. (2) Specifications for each subject and grade include as independent variables grade6 test scores of the same subject and grade 6 test scores for the alternative subject. (3) Sample: Twins(students in the same school in grade 6, with identical last names and birth date. (4) Robust standarderrors are reported in parentheses. *** p<0.01, ** p<0.05, * p<0.1.
35
Figures
Figure 1: ENLACE take-up
Notes: The graph presents historical ENLACE take-up by schooling levels: primary, lowerand upper-secondary. Source: SEP.
36

Figure 2: ENLACE panel matching
Notes: The graph presents the observations found in the ENLACE panel in 2007, 2010 and2013 and the expected observations given the school trajectories in secondary school. Data:authors’ estimations based on ENLACE panel and Formato 911.
37

Figure 3: ENLACE test scores and secondary school outcomes
0.2
.4.6
.81
On-
time
Gra
duat
ion
(%)
0 10 20 30 40 50 60 70 80 90 100Enlace Test Score Percentile in Grade 6
(a) On-time Graduation: Grades 9 and 12
-1-.5
0.5
11.
5E
nlac
e Te
st S
core
(SD
)
0 10 20 30 40 50 60 70 80 90 100Enlace Test Score Percentile in Grade 6
Grade 9 Grade 12
(b) Test Scores: Grades 9 and 12
Notes: The graph plots local means of secondary school outcomes by ENLACE test scorepercentile in grade 6 in 2007. The solid line shows a linear fit estimated using the groupeddata. Panel (a) reports the probability of on-time graduation from grades 9 and 12, proxiedby siting in the Enlace exam in those grades. Panel (b) reports Enlace test scores in grades9 and 12 (normalised with mean 0 and SD 1) conditional on taking the Enlace exam in 2010and 2013. Data: ENLACE panel.
38
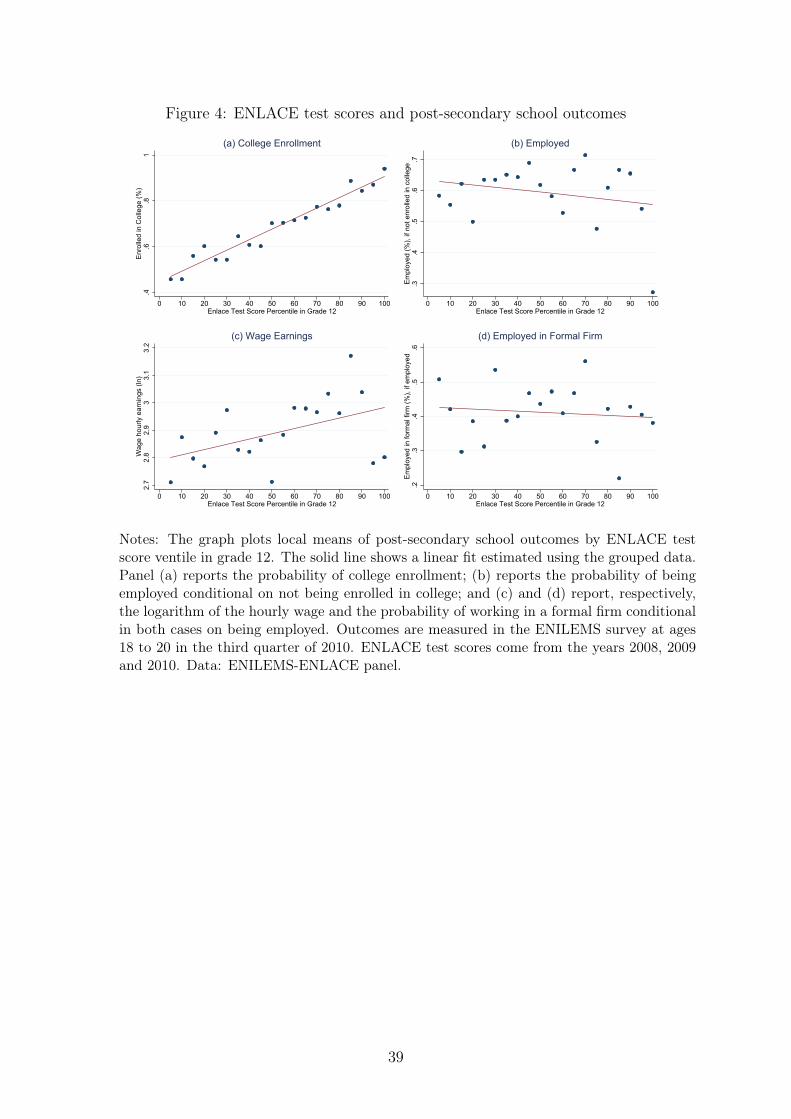
Figure 4: ENLACE test scores and post-secondary school outcomes
.4.6
.81
Enr
olle
d in
Col
lege
(%)
0 10 20 30 40 50 60 70 80 90 100Enlace Test Score Percentile in Grade 12
(a) College Enrollment
.3.4
.5.6
.7E
mpl
oyed
(%),
if no
t enr
olle
d in
col
lege
0 10 20 30 40 50 60 70 80 90 100Enlace Test Score Percentile in Grade 12
(b) Employed2.
72.
82.
93
3.1
3.2
Wag
e ho
urly
ear
ning
s (ln
)
0 10 20 30 40 50 60 70 80 90 100Enlace Test Score Percentile in Grade 12
(c) Wage Earnings
.2.3
.4.5
.6E
mpl
oyed
in fo
rmal
firm
(%),
if em
ploy
ed
0 10 20 30 40 50 60 70 80 90 100Enlace Test Score Percentile in Grade 12
(d) Employed in Formal Firm
Notes: The graph plots local means of post-secondary school outcomes by ENLACE testscore ventile in grade 12. The solid line shows a linear fit estimated using the grouped data.Panel (a) reports the probability of college enrollment; (b) reports the probability of beingemployed conditional on not being enrolled in college; and (c) and (d) report, respectively,the logarithm of the hourly wage and the probability of working in a formal firm conditionalin both cases on being employed. Outcomes are measured in the ENILEMS survey at ages18 to 20 in the third quarter of 2010. ENLACE test scores come from the years 2008, 2009and 2010. Data: ENILEMS-ENLACE panel.
39
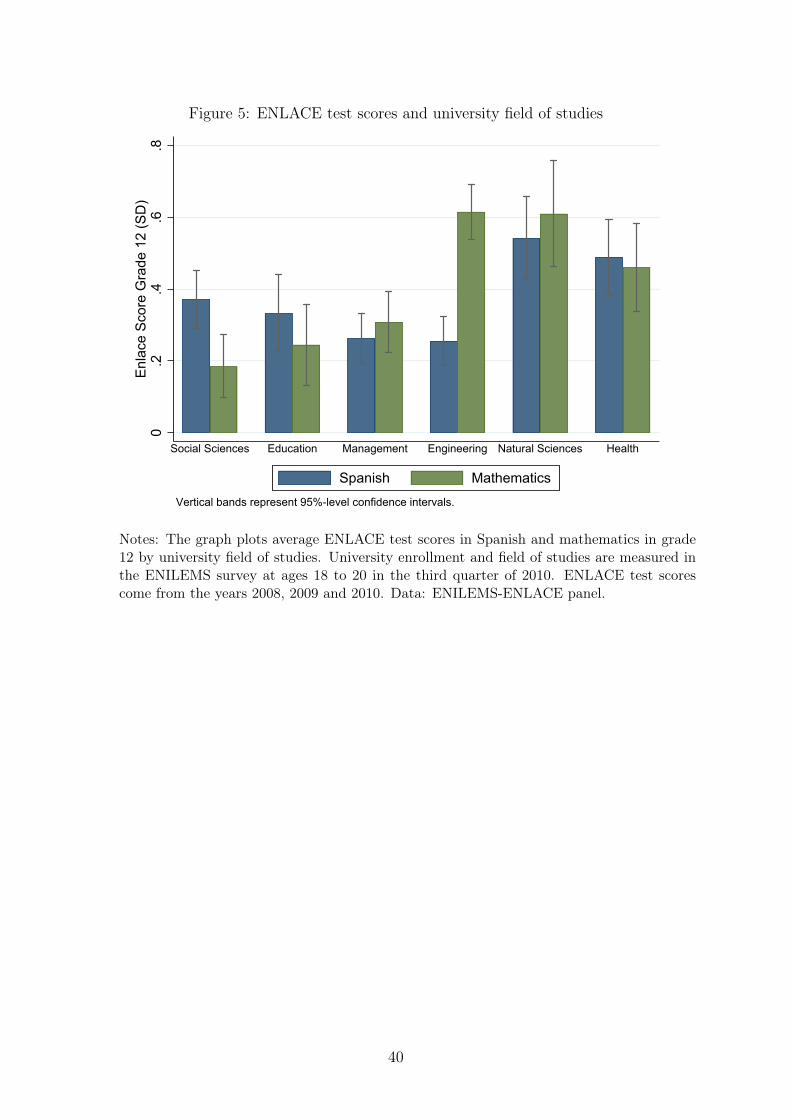
Figure 5: ENLACE test scores and university field of studies
0.2
.4.6
.8E
nlac
e S
core
Gra
de 1
2 (S
D)
Social Sciences Education Management Engineering Natural Sciences Health
Spanish MathematicsVertical bands represent 95%-level confidence intervals.
Notes: The graph plots average ENLACE test scores in Spanish and mathematics in grade12 by university field of studies. University enrollment and field of studies are measured inthe ENILEMS survey at ages 18 to 20 in the third quarter of 2010. ENLACE test scorescome from the years 2008, 2009 and 2010. Data: ENILEMS-ENLACE panel.
40
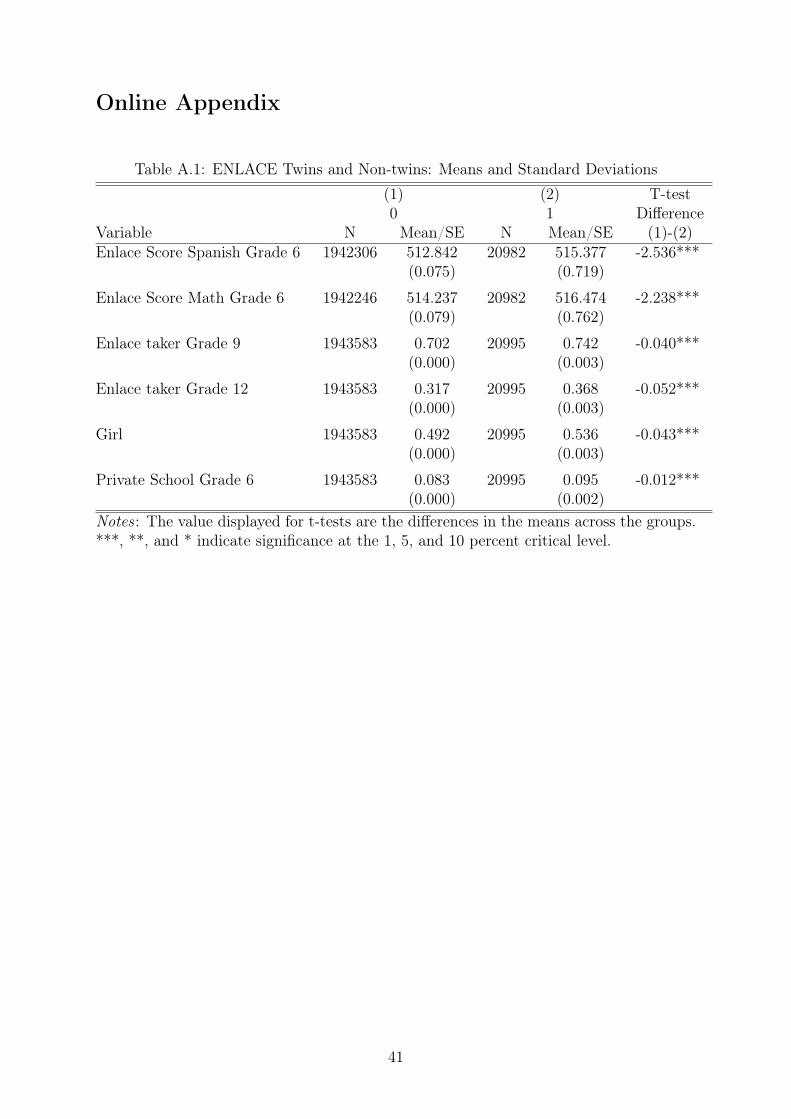
Online Appendix
Table A.1: ENLACE Twins and Non-twins: Means and Standard Deviations(1) (2) T-test0 1 Difference
Variable N Mean/SE N Mean/SE (1)-(2)Enlace Score Spanish Grade 6 1942306 512.842
(0.075)20982 515.377
(0.719)-2.536***
Enlace Score Math Grade 6 1942246 514.237(0.079)
20982 516.474(0.762)
-2.238***
Enlace taker Grade 9 1943583 0.702(0.000)
20995 0.742(0.003)
-0.040***
Enlace taker Grade 12 1943583 0.317(0.000)
20995 0.368(0.003)
-0.052***
Girl 1943583 0.492(0.000)
20995 0.536(0.003)
-0.043***
Private School Grade 6 1943583 0.083(0.000)
20995 0.095(0.002)
-0.012***
Notes : The value displayed for t-tests are the differences in the means across the groups.***, **, and * indicate significance at the 1, 5, and 10 percent critical level.
41
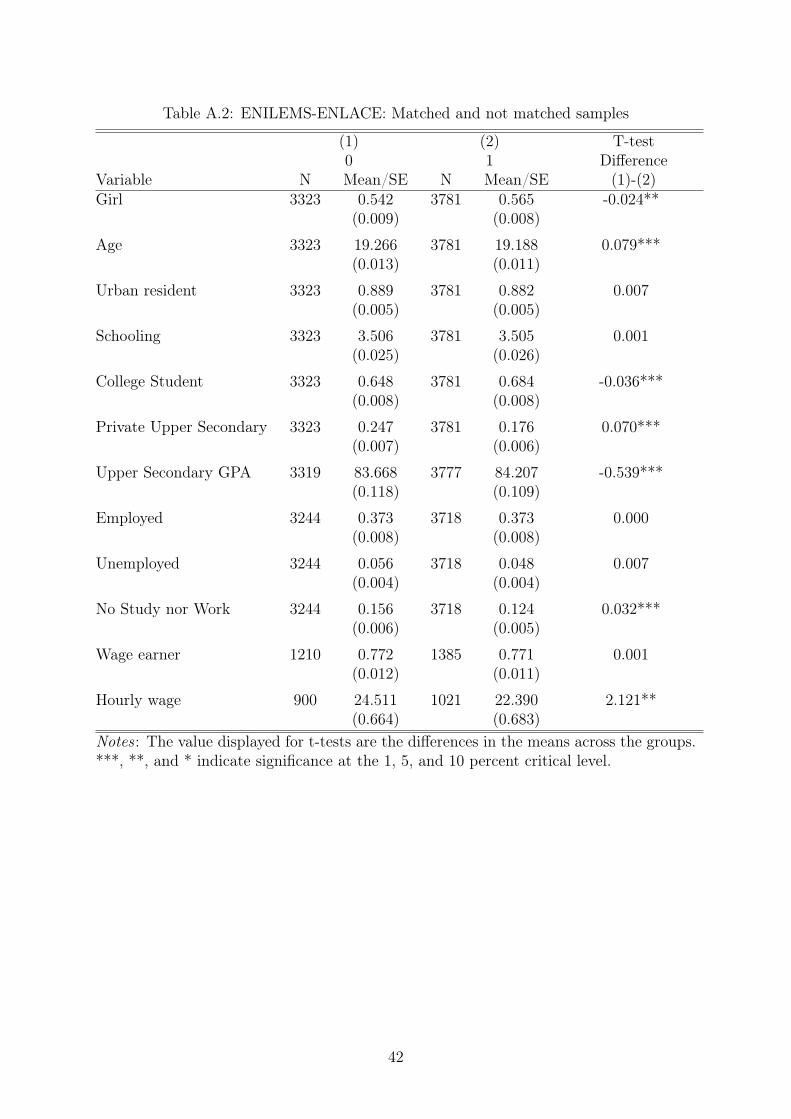
Table A.2: ENILEMS-ENLACE: Matched and not matched samples
(1) (2) T-test0 1 Difference
Variable N Mean/SE N Mean/SE (1)-(2)Girl 3323 0.542
(0.009)3781 0.565
(0.008)-0.024**
Age 3323 19.266(0.013)
3781 19.188(0.011)
0.079***
Urban resident 3323 0.889(0.005)
3781 0.882(0.005)
0.007
Schooling 3323 3.506(0.025)
3781 3.505(0.026)
0.001
College Student 3323 0.648(0.008)
3781 0.684(0.008)
-0.036***
Private Upper Secondary 3323 0.247(0.007)
3781 0.176(0.006)
0.070***
Upper Secondary GPA 3319 83.668(0.118)
3777 84.207(0.109)
-0.539***
Employed 3244 0.373(0.008)
3718 0.373(0.008)
0.000
Unemployed 3244 0.056(0.004)
3718 0.048(0.004)
0.007
No Study nor Work 3244 0.156(0.006)
3718 0.124(0.005)
0.032***
Wage earner 1210 0.772(0.012)
1385 0.771(0.011)
0.001
Hourly wage 900 24.511(0.664)
1021 22.390(0.683)
2.121**
Notes : The value displayed for t-tests are the differences in the means across the groups.***, **, and * indicate significance at the 1, 5, and 10 percent critical level.
42

Table A.3: OLS – ENLACE mathematics and Spanish test scores and secondary school outcomes(1) (2) (3) (4) (5) (6) (7) (8)Enrollment Spanish Score Enrollment Math Score
VARIABLES Grade 9 Grade 12 Grade 9 Grade 12 Grade 9 Grade 12 Grade 9 Grade 12
Spanish Score Grade 6 0.0350*** 0.0490*** 0.415*** 0.418***(0.00474) (0.00552) (0.0142) (0.0248)
Math Score Grade 6 0.0200*** 0.0399*** 0.359*** 0.414***(0.00475) (0.00557) (0.0154) (0.0227)
Girl 0.0379*** 0.0404*** 0.180*** 0.174*** 0.0432*** 0.0466*** 0.0520** -0.278***(0.00799) (0.00939) (0.0221) (0.0411) (0.00796) (0.00940) (0.0237) (0.0403)
Observations 20,187 20,187 15,418 7,644 20,187 20,187 15,418 7,642R-squared 0.806 0.811 0.845 0.851 0.805 0.811 0.815 0.875Twins FE Yes Yes Yes Yes Yes Yes Yes YesMean Dep. Var. 0.763 0.379 0.0211 -0.00618 0.763 0.379 -0.00168 -0.0570
Notes: (1) The table displays the estimation of the effect of early test scores on grade 9 and 12 test scores and enrollment by subject andgrade. (2) Specifications for each subject and grade include as independent variables grade 6 test scores of the same subject. (3) Sample:Twins (students in the same school in grade 6, with identical last names and birth date. (4) All specifications include twins fixed effects. (5)Robust standard errors are reported in parentheses. *** p<0.01, ** p<0.05, * p<0.1.
43
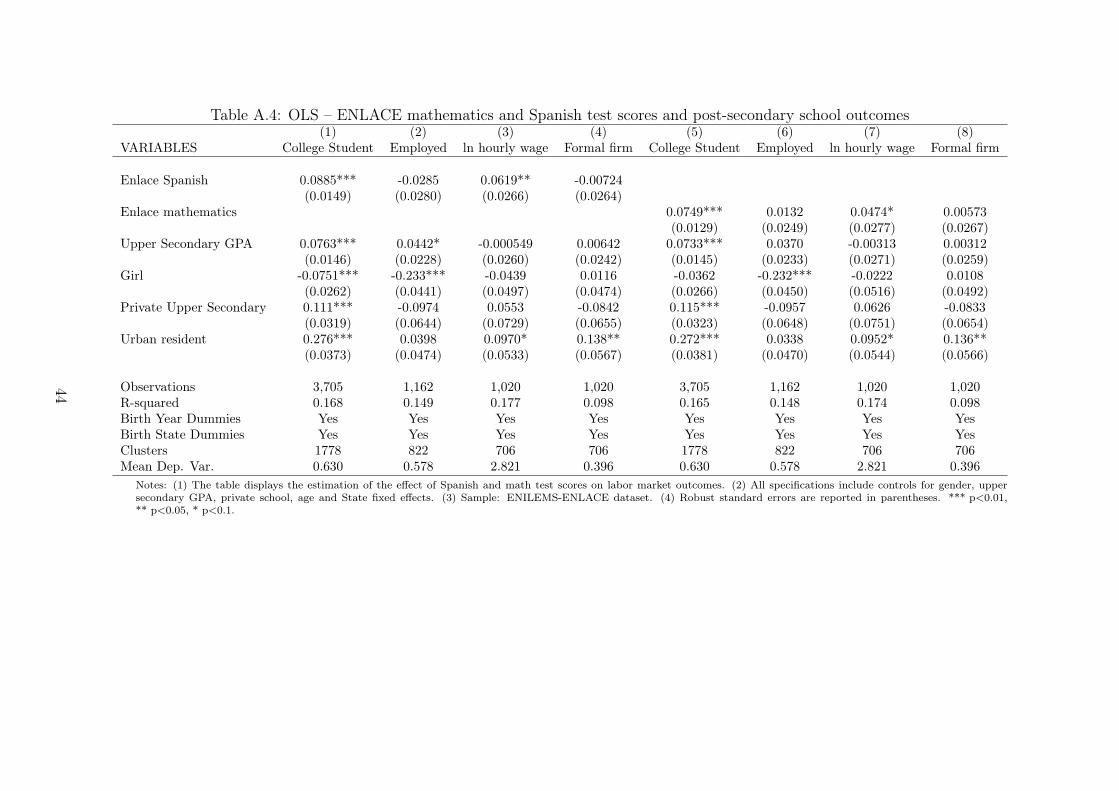
Table A.4: OLS – ENLACE mathematics and Spanish test scores and post-secondary school outcomes(1) (2) (3) (4) (5) (6) (7) (8)
VARIABLES College Student Employed ln hourly wage Formal firm College Student Employed ln hourly wage Formal firm
Enlace Spanish 0.0885*** -0.0285 0.0619** -0.00724(0.0149) (0.0280) (0.0266) (0.0264)
Enlace mathematics 0.0749*** 0.0132 0.0474* 0.00573(0.0129) (0.0249) (0.0277) (0.0267)
Upper Secondary GPA 0.0763*** 0.0442* -0.000549 0.00642 0.0733*** 0.0370 -0.00313 0.00312(0.0146) (0.0228) (0.0260) (0.0242) (0.0145) (0.0233) (0.0271) (0.0259)
Girl -0.0751*** -0.233*** -0.0439 0.0116 -0.0362 -0.232*** -0.0222 0.0108(0.0262) (0.0441) (0.0497) (0.0474) (0.0266) (0.0450) (0.0516) (0.0492)
Private Upper Secondary 0.111*** -0.0974 0.0553 -0.0842 0.115*** -0.0957 0.0626 -0.0833(0.0319) (0.0644) (0.0729) (0.0655) (0.0323) (0.0648) (0.0751) (0.0654)
Urban resident 0.276*** 0.0398 0.0970* 0.138** 0.272*** 0.0338 0.0952* 0.136**(0.0373) (0.0474) (0.0533) (0.0567) (0.0381) (0.0470) (0.0544) (0.0566)
Observations 3,705 1,162 1,020 1,020 3,705 1,162 1,020 1,020R-squared 0.168 0.149 0.177 0.098 0.165 0.148 0.174 0.098Birth Year Dummies Yes Yes Yes Yes Yes Yes Yes YesBirth State Dummies Yes Yes Yes Yes Yes Yes Yes YesClusters 1778 822 706 706 1778 822 706 706Mean Dep. Var. 0.630 0.578 2.821 0.396 0.630 0.578 2.821 0.396
Notes: (1) The table displays the estimation of the effect of Spanish and math test scores on labor market outcomes. (2) All specifications include controls for gender, uppersecondary GPA, private school, age and State fixed effects. (3) Sample: ENILEMS-ENLACE dataset. (4) Robust standard errors are reported in parentheses. *** p<0.01,** p<0.05, * p<0.1.
44
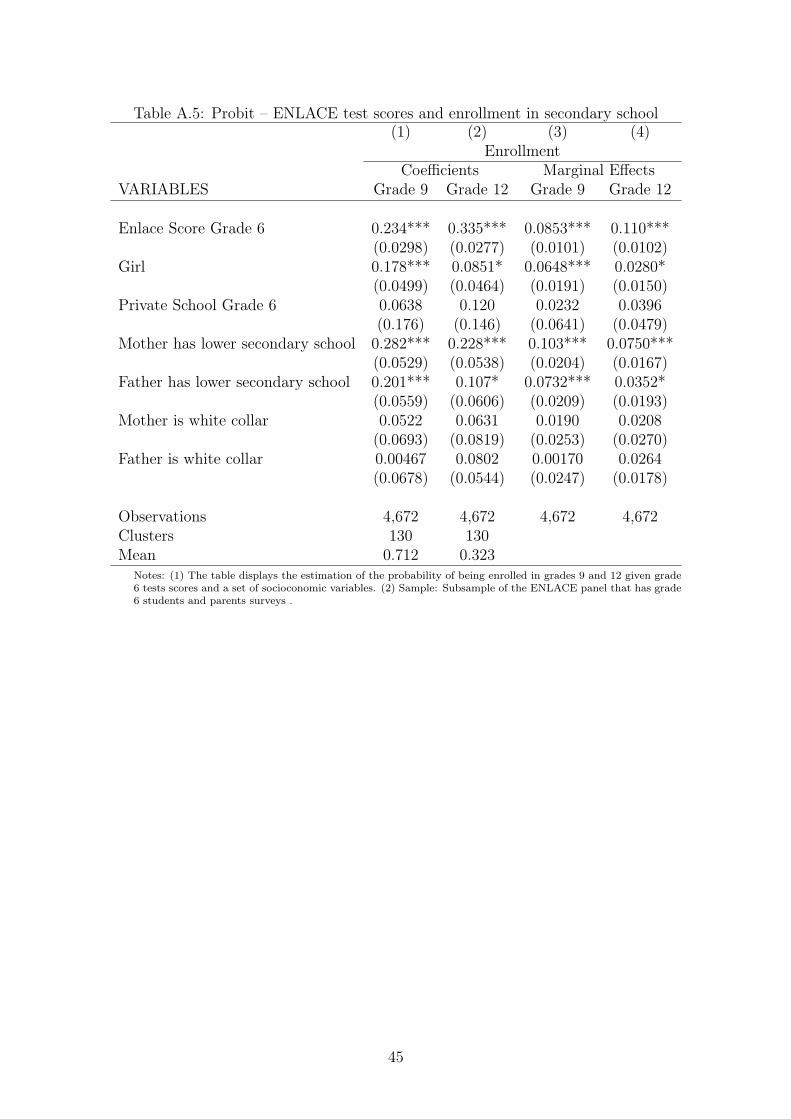
Table A.5: Probit – ENLACE test scores and enrollment in secondary school(1) (2) (3) (4)
EnrollmentCoefficients Marginal Effects
VARIABLES Grade 9 Grade 12 Grade 9 Grade 12
Enlace Score Grade 6 0.234*** 0.335*** 0.0853*** 0.110***(0.0298) (0.0277) (0.0101) (0.0102)
Girl 0.178*** 0.0851* 0.0648*** 0.0280*(0.0499) (0.0464) (0.0191) (0.0150)
Private School Grade 6 0.0638 0.120 0.0232 0.0396(0.176) (0.146) (0.0641) (0.0479)
Mother has lower secondary school 0.282*** 0.228*** 0.103*** 0.0750***(0.0529) (0.0538) (0.0204) (0.0167)
Father has lower secondary school 0.201*** 0.107* 0.0732*** 0.0352*(0.0559) (0.0606) (0.0209) (0.0193)
Mother is white collar 0.0522 0.0631 0.0190 0.0208(0.0693) (0.0819) (0.0253) (0.0270)
Father is white collar 0.00467 0.0802 0.00170 0.0264(0.0678) (0.0544) (0.0247) (0.0178)
Observations 4,672 4,672 4,672 4,672Clusters 130 130Mean 0.712 0.323
Notes: (1) The table displays the estimation of the probability of being enrolled in grades 9 and 12 given grade6 tests scores and a set of socioconomic variables. (2) Sample: Subsample of the ENLACE panel that has grade6 students and parents surveys .
45

Table A.6: Probit – ENLACE test scores and post-secondary school outcomes(1) (2) (3) (4) (5) (6)
Coefficients Marginal effectsVARIABLES College Student Employed Formal firm College Student Employed Formal firm
Enlace Score 0.301*** -0.0474 -0.0474 0.114*** -0.0152 -0.0175(0.0499) (0.0870) (0.0811) (0.0186) (0.0280) (0.0298)
Upper secondary GPA 0.223*** 0.128* 0.0667 0.0846*** 0.0409* 0.0246(0.0427) (0.0671) (0.0661) (0.0162) (0.0216) (0.0245)
Girl -0.194** -0.661*** -0.0615 -0.0736** -0.212*** -0.0227(0.0792) (0.132) (0.127) (0.0291) (0.0339) (0.0473)
Private upper secondary 0.275*** -0.277 -0.271 0.104*** -0.0886 -0.100(0.102) (0.186) (0.173) (0.0392) (0.0585) (0.0646)
Urban resident 0.244*** -0.0709 0.486*** 0.0926*** -0.0227 0.179***(0.0838) (0.136) (0.124) (0.0327) (0.0431) (0.0417)
Observations 3,714 1,164 1,021 3,714 1,164 1,021Clusters 1780 824 706Mean Dep. Var. 0.686 0.604 0.413
Notes: (1) The table displays the estimation of the probability of being enrolled in college, employed, or employed in a formal firm given ENLACE grade 12scores and a set of socioconomic variables. (2) Sample: ENILEMS-ENLACE panel. (3) All specifications include school fixed effects
46