Embed Size (px)
Citation preview
1
Predicting individual speech intelligibility from the
neural tracking of acoustic- and phonetic-level speech
representations
Lesenfants D1, Vanthornhout J1, Verschueren E1, Decruy L1, Francart T1
1Experimental Oto-Rhino-Laryngology, Department of Neurosciences, KU Leuven, Belgium.
Corresponding Author:
Tom Francart, Ph.D.
KU Leuven Department of Neurosciences, ExpORL
Herestraat 49 bus 721
B-3000 Leuven, Belgium
Search Terms: neural speech tracking, objective measure, speech intelligibility, auditory processing, speech
representations.
Highlights:
Objective EEG-based measure of speech intelligibility
Improved prediction of speech intelligibility by combining speech representations
Neural tracking of speech in the delta EEG band monotonically increased with SNRs
Neural responses in the theta EEG band best predicted the speech reception threshold
Disclosure: The authors report no disclosures relevant to the manuscript.
was not certified by peer review) is the author/funder. All rights reserved. No reuse allowed without permission. The copyright holder for this preprint (whichthis version posted November 17, 2018. . https://doi.org/10.1101/471367doi: bioRxiv preprint
2
ABSTRACT
Objective - To objectively measure speech intelligibility of individual subjects from the EEG, based
on neural tracking of different representations of speech: low-level acoustical, higher-level
discrete, or a combination (FS). To compare each model’s prediction of the speech reception
threshold (SRT) for each individual with the behaviorally measured SRT.
Methods – Nineteen participants listened to Flemish Matrix sentences presented at different
signal-to-noise ratios (SNRs), corresponding to different levels of speech understanding. For
different EEG frequency bands (delta, theta, alpha, beta or low-gamma), a model was built to
predict the EEG signal from various speech representations: envelope, spectrogram, phonemes,
phonetic features or a combination of the spectrogram and phonetic features, hereinafter-named
FS. The same model was used for all subjects. For each subject, the model predictions were then
compared to the actual EEG for the different SNRs, and the prediction accuracy in function of SNR
was used to predict the SRT.
Results – The model based on the FS speech representation and the delta EEG band (i.e., FS-delta)
yielded the highest monotonicity of neural tracking in function of SNR. This model also
outperformed the envelope-delta model for a majority of the participants. The FS-theta model
yielded the best SRT predictions, with a difference between the behavioral and objective SRT
below 1 decibel for 53% and below 2 decibels for 89% of the subjects.
Conclusion – A model including low- and higher-level speech features led to a reliable EEG-based
neural marker of speech intelligibility, a keystone in the development of an objective diagnostics
of hearing for clinical routine.
was not certified by peer review) is the author/funder. All rights reserved. No reuse allowed without permission. The copyright holder for this preprint (whichthis version posted November 17, 2018. . https://doi.org/10.1101/471367doi: bioRxiv preprint
3
INTRODUCTION
Nowadays, nearly six percent of individuals in the world has a disabling hearing loss, i.e., hearing
loss greater than 40 decibels (dB) in the better hearing ear (report of the World Health
Organization 2013). It is estimated that by 2050 this prevalence will double. Untreated hearing
loss has been linked to cognitive decline, anxiety, depression, and social exclusion (Li et al. 2014),
highlighting the importance of adequately evaluating and treating hearing disabilities. Current
clinical measurement of hearing impairment relies on behavioral evaluation of hearing. While this
gold standard is relatively fast and reliable in healthy adults, when performed by a well-trained
audiologist with suitable equipment, it requires manual intervention, which is labor intensive,
subjective and depends on the examiner’s experience and patient’s active participation.
Moreover, the patient’s engagement can fluctuate over time (e.g., children) or even be absent
(e.g., unconscious patients, see Lesenfants et al. 2016).
Electroencephalography (EEG)-based measures of hearing might provide a good alternative, as
they are objective and can be performed automatically. However, current clinically-available
objective measures of hearing, based on auditory brainstem responses (Jewett et al. 1970;
Verhaert et al. 2008; Anderson et al. 2013) or auditory steady state responses (Galambos et al.
1981; Stapells et al. 1984; Picton et al. 2005; Luts et al. 2006; Gransier et al. 2016), can only
complement behavioral evaluation. This is mainly because they rely on simple non-realistic
auditory stimuli (e.g. clicks) leading to a measure of hearing and not speech understanding. A brain
measure of natural running speech could overcome these issues and provide realistic and
objective measures of a patient speech intelligibility in clinical routine.
Because the temporal fluctuations of the speech stimulus envelope are critical for speech
understanding (Shannon et al. 1995), in particular modulation frequencies below 20 Hz (Drullman
et al. 1994b; Drullman et al. 1994a), many researchers (Aiken & Picton 2008; Ding & Simon 2013;
Gonçalves et al. 2014; Biesmans et al. 2017) have evaluated the potential of tracking the neural
responses of the speech envelope using surface EEG Recently, Vanthornhout et al. (2018)
proposed to objectively measure speech intelligibility using the neural tracking of the speech
envelope and showed a strong correlation between behavioral and objective electrophysiological
measures of speech intelligibility. However, while this can be considered a major breakthrough,
the correlation between the behavioral and objective measures of speech intelligibility only
explained 50% of the variance. Recently, Di Liberto et al. (2015, 2016 & 2017) showed that the
neural encoding of running speech is better characterized using a model integrating both low-level
spectro-temporal speech information (e.g., the speech envelope) and discrete higher-level
phonetic features.
We here aimed to evaluate the potential of using different speech representations to objectively
predict speech intelligibility in different EEG frequency bands. Following Di Liberto and colleagues,
we hypothesized that the level of speech intelligibility could be better evaluated using a more
complex model integrating both acoustic and phonetic representations.
was not certified by peer review) is the author/funder. All rights reserved. No reuse allowed without permission. The copyright holder for this preprint (whichthis version posted November 17, 2018. . https://doi.org/10.1101/471367doi: bioRxiv preprint
4
METHODS
We analyzed data acquired in our previous study aiming to predict speech intelligibility using the
neural entrainment of the speech envelope with a linear backward model (Vanthornhout et al.
2018).
Participants
Nineteen native Flemish-speaking volunteers (7 men; age 24 ± 2 years; 2 were left-handed)
participated in this study. Each participant reported normal hearing, verified by pure tone
audiometry (pure tone thresholds lower than 20 dB HL for 125 Hz to 8000 Hz using a MADSEN
Orbiter 922–2 audiometer). The study was approved by the Medical Ethics Committee UZ KU
Leuven/Research (KU Leuven, Belgium) with reference S59040 and all participants provided
informed consent.
Experiments
The experiments were conducted on a laptop running Windows using the APEX 3 (version 3.1)
software platform developed at ExpORL (Dept. Neurosciences, KU Leuven) (Francart et al. 2008),
an RME Multiface II sound card (RME, Haimhausen, Germany), and Etymotic ER-3A insert phones
(Etymotic Research, Inc., IL, USA) which were electromagnetically shielded using CFL2 boxes from
Perancea Ltd. (London, UK). The setup was calibrated in a 2-cm3 coupler (Brüel & Kjaer, type 4152,
Nærum, Denmark) using the stationary speech weighted noise corresponding to the Matrix
speech material. The experiments took place in an electromagnetically shielded and soundproofed
room.
Behavioral – Each participant started the experiment with a behavioral evaluation of speech
understanding using the Flemish Matrix sentences (Luts et al. 2014) presented at three fixed SNRs
(-9.5; -6.5 and -3.5 dB SNR) around the Speech Reception Threshold (SRT; the SNR at which a
person can understand 50% of spoken words). For each SNR, we counted the number of correctly
repeated words following the presentation of each of 20 Matrix sentences. Then, we fitted a
psychometric function through the data points to obtain the behavioral SRT. This method is
currently the gold standard in measuring speech intelligibility, both in research and clinical
practice. Sentences were spoken by a female speaker and presented to the right ear. Each
sentence of the Flemish Matrix material is composed of 5 words that follow a fixed syntactic
structure of Name + Verb + Numeral + Adjective + Object (e.g., “Sofie ziet zes grijze pennen”; “Sofie
sees six gray pens”), each of them randomly selected from a set of 10 possibilities, each
combination yielding similar behavioral speech intelligibility scores. In order to minimize the effect
of higher order language processing, these sentences sound perfectly natural, but are
grammatically trivial and completely unpredictable.
Electrophysiological - Each subject listened to the children's story “Milan” (hereinafter named
condition “Story”), written and narrated in Flemish by Stijn Vranken. The stimulus was 14 minutes
long and was presented binaurally without any noise. We then consecutively presented binaurally
sequences of 40 Flemish Matrix sentences, each lasting 2 min, at different levels SNRs, in random
was not certified by peer review) is the author/funder. All rights reserved. No reuse allowed without permission. The copyright holder for this preprint (whichthis version posted November 17, 2018. . https://doi.org/10.1101/471367doi: bioRxiv preprint
5
order, with the speech level fixed at 60 dBA. The noise was stationary, with the same long-term-
average spectrum as the speech. Silences between sentences ranged in duration between 0.8 and
1.2s. At the end of each 2-min stimulus, we asked the participant questions to ensure a satisfactory
level of attention on the task (e.g. ‘How many times did you hear “gray pens”?’). Group 1
underwent four presentations of five different SNRs (-9.5, -7.6, -5.5, -1 and 100 dB SNR). Group 2
underwent three presentations of seven different SNRs (-12.5, -9.5, -6.5, -3.5, -0.5, 2.5 and 100 dB
SNR). Note that the condition “100 dB SNR” corresponds to “no noise” (hereinafter named quiet
condition).
Recordings
EEG signals were recorded from 64 Ag/AgCl ring electrodes at a sampling frequency of 8192 Hz
using a Biosemi ActiveTwo system (Amsterdam, Netherlands). The electrodes were placed on the
scalp according to international 10-20 standards.
Data analysis
All analyses were done with custom-made Matlab (R2016b) scripts and the mTRF Toolbox (Crosse
et al. 2016; Gonçalves et al. 2014).
Speech features – We extracted five different representations of the speech stimulus, selected
according to Di Liberto et al. (2015):
1. The broadband amplitude envelope (Env) was extracted as the absolute value of the
(complex) Hilbert transform of the speech signal.
2. The spectrogram representation (Sgram) was obtained by first filtering the speech stimulus
into 16 logarithmically-spaced speech frequency bands using zero phase Butterworth
filters with 80 dB attenuation at 10 % outside the passband between 250 Hz and 8 kHz,
according to Greenwood's equation (Greenwood 1961), assuming linear spacing in the
cochlea. We then calculated the energy in each frequency band using a Hilbert transform
(see Env).
3. The time-aligned sequence of phonemes (Ph) was extracted using the speech alignment
component of the reading tutor (Duchateau et al. 2009), which allows for reading miscues
(skipped, repeated, misread words), automatically segmenting each word into phonemes
from the Dutch International Phonetic Alphabet (IPA) and performing forced alignment.
We then converted this into a binary matrix mask representing the starting and ending
time-points (i.e., a ‘1’ from the start until the end of each presentation) for each 37
phonemes present in both the story and the matrix sentences.
4. The time-aligned binary sequence of phonetic features (Fea) was assembled using the
following groups of phonemes: short vowels, long vowels, fricative consonants, nasal
consonants and plosive consonants.
5. The combination of time-aligned sequence of phonetic features and the spectrogram as
proposed by Di Liberto et al. (2015), hereinafter named FS.
EEG signal processing – EEG artifacts were removed using a multi-channel Wiener filter algorithm
(Somers et al. 2018). We then re-referenced each EEG signal to a common-average reference
was not certified by peer review) is the author/funder. All rights reserved. No reuse allowed without permission. The copyright holder for this preprint (whichthis version posted November 17, 2018. . https://doi.org/10.1101/471367doi: bioRxiv preprint
6
before downsampling from 8192 to 1024 Hz to decrease processing time. EEG signals were
bandpass filtered between 0.5-4 Hz (delta), 4-8 Hz (theta), 8-15 Hz (alpha), 15-30 Hz (beta), or 30-
45 Hz (low gamma; for this frequency, we then computed the envelope of the filtered signals)
using zero phase Butterworth filters with 80 dB attenuation at 10 % outside the passband.
Stimulus representations and EEG signals were then downsampled to 128 Hz.
Temporal response function (TRF) estimation - A grand-average quantitative mapping (i.e., a grand-
average forward) between each speech representation and all the participants recorded story EEG
was computed using ridge regression with a temporal integration window of 0-400 ms. This grand-
average mapping was then used to predict EEG signals using each stimulus representation from
the Matrix test set. The neural tracking of speech was computed as the correlation (Spearman’s
rank-order correlation) between the recorded and predicted EEG signals at the different electrode
locations.
Models’ performance - To compare each model’s ability to track the participant’s speech
intelligibility, we first assessed the extent to which neural tracking increased monotonically with
the stimulus SNR. We defined a monotonicity score (MS) as follows: for a stimulus SNRi, we
compared the associated Spearman’s correlation ρ(SNRi) with ones obtained at lower and higher
SNRs (i.e., ρ(SNR1) … ρ(SNRi-1), ρ(SNRi+1)… ρ(SNRN)) as well as with the significance level (see
below). If ρ(SNRi) was above the significance level, we incremented the monotonicity score as
follows:
𝑀𝑆𝑟 = 𝑀𝑆𝑟 + (∑ ∃(𝜌(𝑆𝑁𝑅𝑘) ≤ 𝜌(𝑆𝑁𝑅𝑖)) + ∑ ∃(𝜌(𝑆𝑁𝑅𝑘) ≥ 𝜌(𝑆𝑁𝑅𝑖))𝑁
𝑘=𝑖+1𝑖−1𝑘=1 )
𝑁 − 1
i.e., for SNRi with a Spearman correlation ρ(SNRi) above the significance level, the monotonicity
score of the participant r (i.e., MSr) is increased by the ratio of the number of Spearman’s
correlation of lower SNR below or equal to ρ(SNRi) added to the ratio of the number of Spearman’s
correlation of higher SNR above or equal to ρ(SNRi). If ρ(SNRi) was below the significance level, the
score was not increased.
Next, we derived an objective EEG-based SRT (hereinafter-named correlation threshold, CT).
Similar to Vanthornhout et al. (2018), we fitted a sigmoid S to the Spearman’s correlation in
function of SNR in order to obtain the CT using the formula:
𝑆(𝑆𝑁𝑅) = 𝛾 + (1 − 𝛾 − 𝜆)1
1 + 𝑒𝑆𝑁𝑅−𝐶𝑇
𝛽
With 𝛾 the guess-rate, λ the lapse-rate, α the midpoint, and β the slope. Each subject’s CT was
then computed as the averaged α across presentations (i.e., four presentations for group 1, three
presentations for group 2), with only α in the range of -4 to -11 dB SNR taken into account in the
averaging. If none of the α were in this range, CT was considered as non-assessed (NA, see Fig. 5).
was not certified by peer review) is the author/funder. All rights reserved. No reuse allowed without permission. The copyright holder for this preprint (whichthis version posted November 17, 2018. . https://doi.org/10.1101/471367doi: bioRxiv preprint
7
Statistical analysis - A permutation test (Noirhomme et al. 2017; Nichols & Holmes 2002) was used
to evaluate the significance level for each model (1000 repetitions, p < .01). The significance of
change between conditions was assessed with a non-parametric Wilcoxon signed-rank test (2-
tailed, p < .01), with Bonferroni correction for multiple comparisons.
RESULTS
Behavioral evaluation of SRT
The mean of the individual behavioral SRTs was − 7.1 dB with an inter-subject standard deviation
of 1.5 dB, ranging from − 9.3 to − 4.7 dB for group 1, and − 8.5 dB with an inter-subject standard
deviation of 0.8 dB, ranging from − 10.3 to − 7.7 dB for group 2.
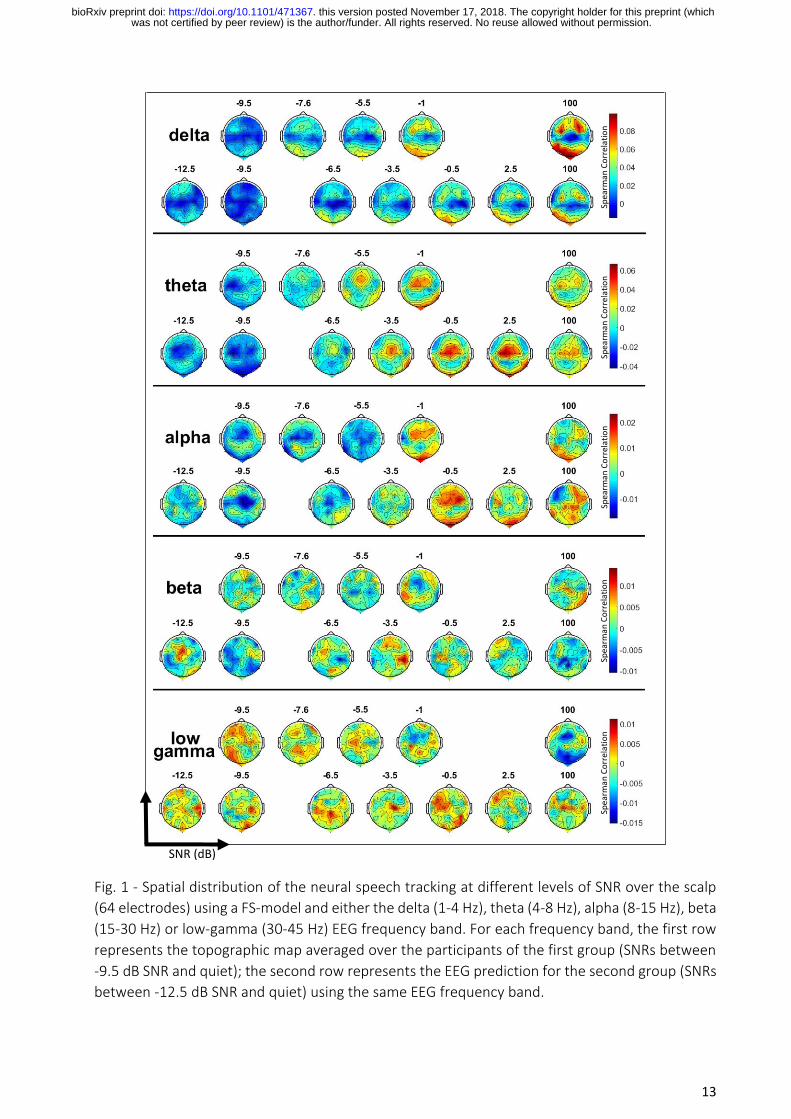
Spatial distribution of the neural tracking
We calculated the neural tracking over the scalp for the different EEG frequency bands averaged
across the participants for the FS-model. Averaged neural speech tracking in the delta EEG band
increased with SNR until reaching a maximum in quiet for both group 1 (see Fig. 1, row 1) and
group 2 (see Fig. 1, row 2). A left temporal and parieto-occipital dominant activation appears at
lower SNRs then followed by a right temporal activation. The average Spearman’s correlation in
the temporal and parieto-occipital areas in quiet is 0.06. In the theta EEG band (see Fig. 1, rows 3
and 4), we observed a central activation, increasing with the SNR, reaching a maximum (averaged
Spearman’s correlation around 0.04) between -0.5 and 2.5 dB SNR, then decreasing in quiet.
Interestingly, an occipital-right dominance appears using the alpha EEG band at -6.5 db SNR, then
followed by a centro-frontal dominance for SNR ranging between -5.5 and -1 dB SNR, finally
reaching a maximum at -0.5 dB SNR with a fronto-left occipital activation. In the beta and low-
gamma EEG bands, the neural speech tracking at each electrode location was below the
significance level, evaluated at around 0.01. Note the decrease of the neural speech tracking with
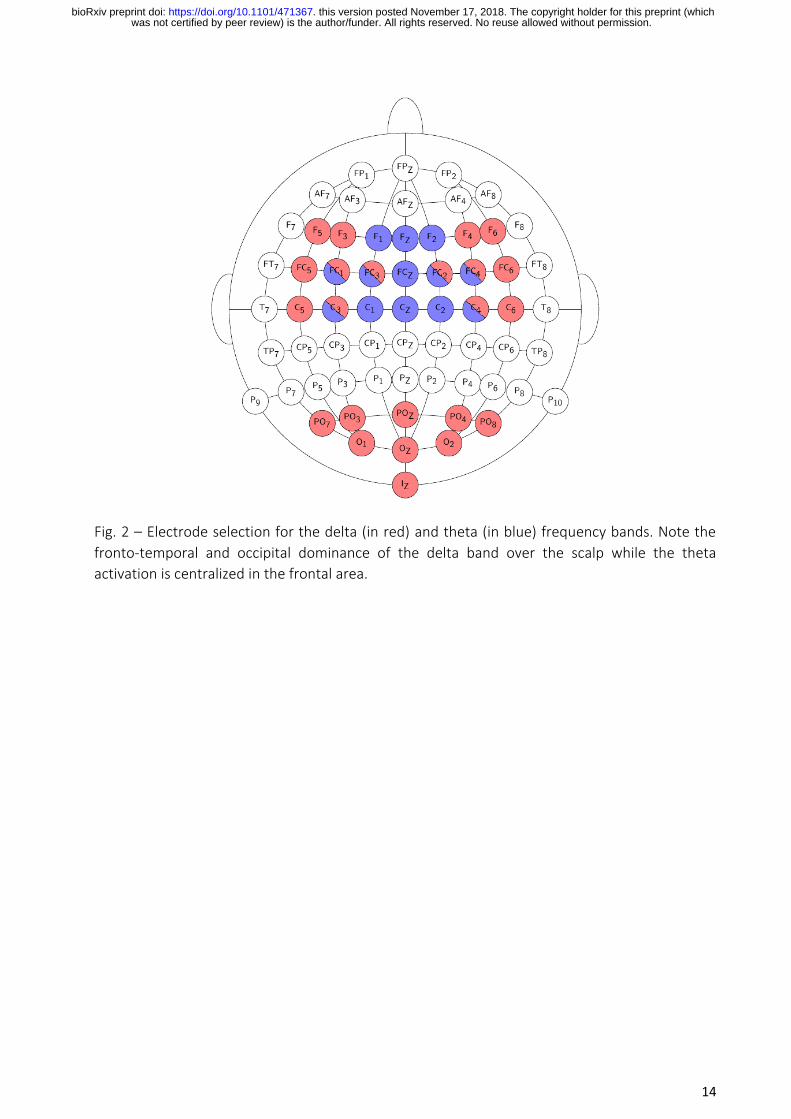
EEG frequency band. Based on the spatial distribution of the neural tracking of each speech
representation, we defined a region of interest (ROI) for the delta (see Fig. 2, in red) and theta
(see Fig. 2, in blue) frequency bands. A similar spatial distribution could be observed with the other
models (see Appendix A).
# Insert figure 1 here
# Insert figure 2 here
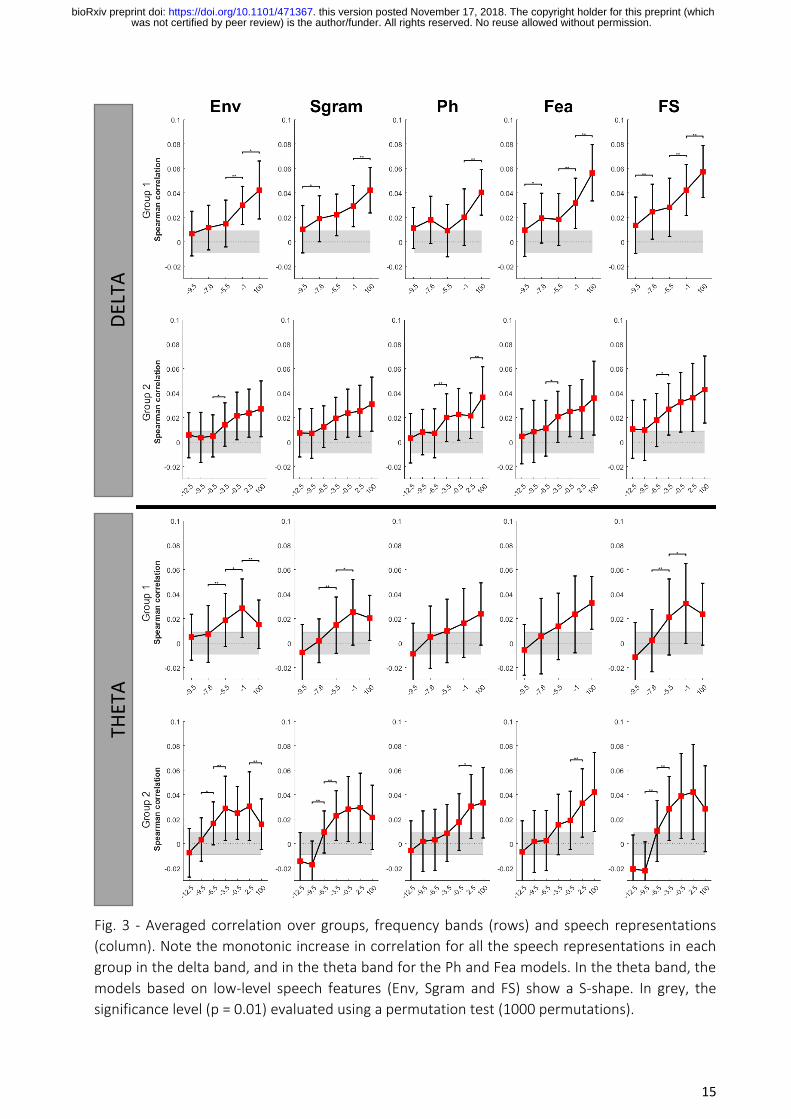
Group-level neural tracking over SNRs
Both for group 1 and for group 2, the averaged correlation over the delta ROI increased with the
SNR using each speech representation (see Fig. 3
, rows 1 and 2). The averaged correlations for SNR below -3.5 dB SNR (resp. below -6.5 dB SNR)
were at the significance level using either Env or Ph (resp. Fea). The Sgram and FS models
showed correlations above the significance level for all SNRs. The FS model showed similar
correlations at lowest SNRs as the Sgram model, but with a higher slope for both group 1 and
group 2. In the delta band, the correlation in quiet increased with model complexity/feature
level (Env->Sgram->...->FS), the highest correlation being reached using the FS model.
was not certified by peer review) is the author/funder. All rights reserved. No reuse allowed without permission. The copyright holder for this preprint (whichthis version posted November 17, 2018. . https://doi.org/10.1101/471367doi: bioRxiv preprint
8
Models based on low-level features (Env, Sgram and FS) showed a S-shape correlation over SNRs
in the theta band (i.e., flat, followed by an increase, followed by a drop in quiet; see Fig. 3
, rows 3 and 4), while the higher-level feature-based models presented a strictly monotonic
increase in correlation over the SNR. The Ph and Fea models showed correlations above
significance-level for SNRs above respectively -5.5 and -7.6 dB SNR for group 1 and above
respectively -3.5 and -6.5 dB SNR for group 2. Interestingly, the Sgram and FS models showed a
binary correlation trend, switching from significant negative correlation for the lowest SNRs (i.e.,
≤ -9.5 dB SNR) to significant positive correlation for SNR above -6.5 dB SNR.
# Insert figure 3 here
Monotonicity of the neural tracking over SNRs
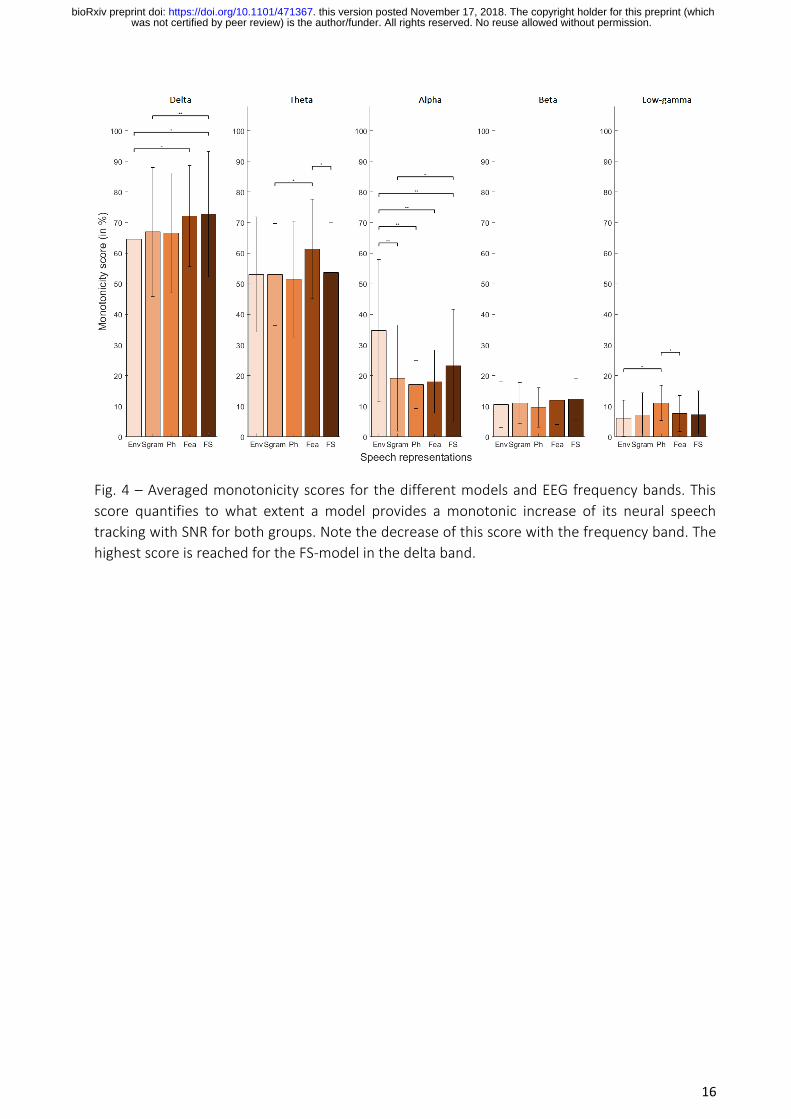
The highest averaged monotonicity score (i.e., mean ± std, 73 ± 20%) is obtained in the delta EEG
frequency band with the FS-model (see Fig. 4). This model outperformed the Env (64.5 ± 20 %;
WSRT, W(19) = 30.5, p < 0.05, two-tailed test) and Sgram (67 ± 21 %; WSRT, W(19) = 11, p < 0.01,
two-tailed test) models. The monotonicity score decreased with increasing EEG frequency bands.
# Insert figure 4 here
Individual neural speech tracking over SNRs
In the appendix (see Fig. Ap5 and Ap6), we presented the neural speech tracking averaged over
presentations for each individual separately, using the delta-Env and delta-FS model or the theta-
FS model respectively. Comparing the delta-Env model (Vanthornhout et al. 2018) with the delta-
FS model at single-subject level, we observed that the FS-model provides higher monotonicity for
14 out of the 19 participants and no difference between the two models for two participants.
At single-subject level, in the theta band, we observed an increase in neural speech tracking with
SNR (see Fig. Ap6), reaching a maximum around 0 dB SNR, then decreasing again. Sixteen out of
the 19 participants showed a negative correlation for lower SNRs. The averaged SNR at which the
neural speech tracking switched from a negative to a positive value is -7.2 ± 1.8 dB SNR
(hereinafter named FS*-zeroCrossing).
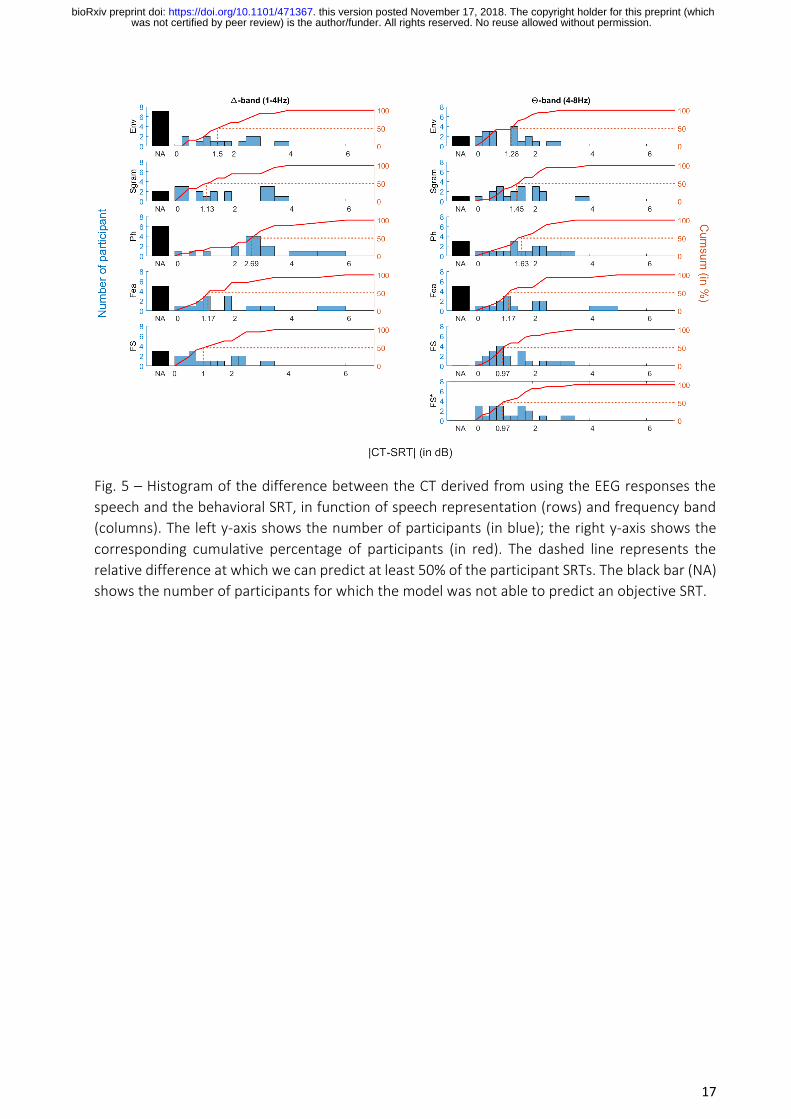
Predicting the SRT using the neural tracking over SNRs We finally evaluated the ability of each model to objectively predict the SRT using the neural
responses to each speech representation. In Fig. 5, we present the histogram of the absolute
difference between the SRT and the CT predicted using each model. On the left y-axis, we showed
the number of participant showing an absolute difference between the SRT and the CT presented
on the x-axis. On the right y-axis, we showed the cumulative percentage of participants showing
an absolute difference between the SRT and the CT presented on the x-axis. In the following, we
will compare each model by calculating (1) the number of participant whom a CT can be predicted
from the EEG (see NA in Fig. 5) and (2) the percentage of them presenting an absolute difference
between the SRT and the CT below 1dB SNR and 2dB SNR (see Table 1). The delta-Env model
illustrated the highest rate of participants whom a CT score could not be predicted. The theta
models showed the lowest number of participants whom a CT score could not be predicted. In
particular, a CT score could be predicted for each participant using the theta-FS model. With the
delta Env-model, 3/19 participants showed a difference between CT and SRT scores of less than 1
dB, while 8/19 participants showed a difference of less than 2dB (see Fig. 5, row 1, first column).
was not certified by peer review) is the author/funder. All rights reserved. No reuse allowed without permission. The copyright holder for this preprint (whichthis version posted November 17, 2018. . https://doi.org/10.1101/471367doi: bioRxiv preprint
9
Using the theta-FS model, 10/19 participants had a difference of less than 1 dB, and 16/19
participants presented a relative difference of less than 2 dB (see Fig. 5, row 4, second column).
Interestingly, 11/19 participants presented a difference of less than 1dB between the FS*-
zeroCrossing and the behavioral SRT, and 18/19 with a relative difference of less than 2dB (see
Fig. 5, last row).
# Insert table 1 here
# Insert figure 5 here
DISCUSSION
We showed that the combination of both low- and higher-level speech features within a model
could improve the prediction of speech intelligibility from the EEG, compared to the standard
speech envelope. For the delta band, the FS-model, which combines the spectrogram and
phoneme representations, yielded higher correlations between actual and predicted EEG in the
no-noise condition than the Env-model, while the correlation at the lowest SNRs was the same,
suggesting a better sensitivity of this model to the level of speech understanding (i.e., a higher
slope of the neural speech tracking over SNR). Moreover, when comparing the behavioural SRT
with its objective counterpart (the CT), for the theta FS-model, the difference between SRT and
CT was under 2 dB for more than 80% of the participants. Part of the remaining difference can be
explained by the test-retest difference of the behavioral measure, which is around 2 dB (Francart
et al. 2011; Decruy et al. 2018). Comparing the FS and Env models at single-subject level, we here
showed that the FS model outperformed the Env-model in 14/19 participants, and two of the
remaining showing no difference in monotonicity score between the two models. Future research
should evaluate the inclusion of higher-level speech features such as words or semantic
information in the FS-model (Brodbeck et al. 2018; Broderick et al. 2018).
The spatial distribution of the EEG predictability over the scalp showed a lateralized fronto-
temporal and occipital dominance using the delta EEG band, and a central centro-frontal
dominance for the theta EEG band. Studying the evolution of the activation in these areas of
interest, we showed that in the delta band each model presented a monotonic increase of the
neural speech tracking with SNR. In the theta band this could also be observed using the Ph or Fea
model, but the models based on low-level speech features (Env and Sgram) showed an S-shape
with a maximum correlation around 0dB SNR. We here hypothesized that these two frequency
bands track different features of the speech signal in the brain, as suggested by Ding & Simon
(2014). The drop in correlation between a condition with limited noise (0 dB SNR) and no noise
might be due to a drop in listening effort or attention (Das et al. 2018). Future studies should be
conducted to better understand and characterize this difference.
As suggested by Vanthornhout et al. (2018) using a backward model to predict speech intelligibility
using the speech envelope, we here fitted a sigmoid to the neural speech tracking as s function of
SNR in order to predict the CT. It is however important to stress that fitting a sigmoid is not an
easy step (i.e., it is difficult to fit a four-parameters-curve using a limited set of measures) and
could lead to a wrong predicted SRT. A way to decrease this risk would be to increase the number
of repetitions for each SNR (i.e., 4 repetitions for the group 1 and 3 for the group 2 in the present
was not certified by peer review) is the author/funder. All rights reserved. No reuse allowed without permission. The copyright holder for this preprint (whichthis version posted November 17, 2018. . https://doi.org/10.1101/471367doi: bioRxiv preprint
10
study) at the cost of session time. To overcome this issue, we here suggested a FS*-zeroCrossing
score that provides similar results that the FS-theta model (i.e., 53% and 89% of the participants
with an absolute difference between the CT and SRT of less than 1dB and 2dB respectively) without
the cost of a sigmoid fitting.
Integrating low and higher-level speech features, the novel measures proposed in this study
provide an objective measure of speech intelligibility and open the doors to automatic hearing aid
and cochlear implant (Somers et al. 2018) parameter adaptation relying on auditory brain
responses and requiring minimum intervention of a clinical expert. Future research should
evaluate the potential of this new measure in an extended cohort in clinical conditions and study
the impact of parameters like the semantic context, participant’s age, hearing loss, test-duration
and number of electrodes included in the recording.
ACKNOWLEDGEMENT
The authors would like to thank Prof. Hugo Van hamme for providing the phoneme segmentation.
Financial support was provided by the KU Leuven Special Research Fund under grant OT/14/119
to Tom Francart. This project has received funding from the European Research Council (ERC)
under the European Union’s Horizon 2020 research and innovation program (grant agreement No
637424, ERC starting Grant to Tom Francart). Research funded by a PhD grant of the Research
Foundation Flanders (FWO) for Jonas Vanthornhout (1S10416N) and Eline Verschueren
(1S86118N). The authors declare no conflict of interest
was not certified by peer review) is the author/funder. All rights reserved. No reuse allowed without permission. The copyright holder for this preprint (whichthis version posted November 17, 2018. . https://doi.org/10.1101/471367doi: bioRxiv preprint
11
REFERENCES
Aiken, S.J. & Picton, T.W., 2008. Human Cortical Responses to the Speech Envelope. Ear and Hearing, 29(2), pp.139–157.
Anderson, S. et al., 2013. Auditory Brainstem Response to Complex Sounds Predicts Self-Reported Speech. Journal of Speech, Language, and Hearing Research, 56(February 2013), pp.31–43.
Anon, 2013. MULTI-COUNTRY ASSESSMENT OF NATIONAL CAPACITY TO PROVIDE HEARING CARE, Available at: www.who.int.
Biesmans, W. et al., 2017. Auditory-inspired speech envelope extraction methods for improved EEG-based auditory attention detection in a cocktail party scenario. IEEE Transactions on Neural Systems and Rehabilitation Engineering, 25(5), pp.402–412.
Brodbeck, C., Hong, L.E. & Simon, J.Z., 2018. Transformation from auditory to linguistic representations across auditory cortex is rapid and attention dependent for continuous speech. bioRxiv, p.326785.
Broderick, M.P. et al., 2018. Electrophysiological Correlates of Semantic Dissimilarity Reflect the Comprehension of Natural, Narrative Speech. Current Biology, 28(5), p.803–809.e3.
Crosse, M.J. et al., 2016. The Multivariate Temporal Response Function (mTRF) Toolbox: A MATLAB Toolbox for Relating Neural Signals to Continuous Stimuli. Frontiers in Human Neuroscience, 10.
Das, N., Bertrand, A. & Francart, T., 2018. EEG-based auditory attention detection: boundary conditions for background noise and speaker positions. Journal of neural engineering, 15(6), p.066017.
Decruy, L. et al., 2018. The Self-Assessed Békesy Procedure: Validation of a Method to Measure Intelligibility of Connected Discourse. Trends in Hearing, 22, p.233121651880270.
Ding, N. & Simon, J.Z., 2013. Adaptive Temporal Encoding Leads to a Background-Insensitive Cortical Representation of Speech. Journal of Neuroscience, 33(13), pp.5728–5735.
Ding, N. & Simon, J.Z., 2014. Cortical entrainment to continuous speech: functional roles and interpretations. Frontiers in Human Neuroscience, 8, p.311.
Drullman, R., Festen, J.M. & Plomp, R., 1994a. Effect of reducing slow temporal modulations on speech reception. The Journal of the Acoustical Society of America, 95(5 Pt 1), pp.2670–80.
Drullman, R., Festen, J.M. & Plomp, R., 1994b. Effect of temporal envelope smearing on speech reception. The Journal of the Acoustical Society of America, 95(2), pp.1053–64.
Duchateau, J. et al., 2009. Developing a reading tutor: Design and evaluation of dedicated speech recognition and synthesis modules. Speech Communication, 51(10), pp.985–994.
Francart, T., van Wieringen, A. & Wouters, J., 2008. APEX 3: a multi-purpose test platform for auditory psychophysical experiments. Journal of Neuroscience Methods, 172(2), pp.283–293.
Francart, T., van Wieringen, A. & Wouters, J., 2011. Comparison of fluctuating maskers for speech recognition tests. International Journal of Audiology, 50(1), pp.2–13.
Galambos, R., Makeig, S. & Talmachoff, P.J., 1981. A 40-Hz auditory potential recorded from the human scalp. Proceedings of the National Academy of Sciences of the United States of America, 78(4), pp.2643–7.
Gonçalves, N.R. et al., 2014. Towards obtaining spatiotemporally precise responses to continuous sensory stimuli in humans: A general linear modeling approach to EEG. NeuroImage, 97, pp.196–205.
was not certified by peer review) is the author/funder. All rights reserved. No reuse allowed without permission. The copyright holder for this preprint (whichthis version posted November 17, 2018. . https://doi.org/10.1101/471367doi: bioRxiv preprint
12
Gransier, R. et al., 2016. Auditory steady-state responses in cochlear implant users: Effect of modulation frequency and stimulation artifacts. Hearing Research, 335, pp.149–160.
Greenwood, D.D., 1961. Auditory Masking and the Critical Band. The Journal of the Acoustical Society of America, 33(4), pp.484–502.
Jewett, D.L., Romano, M.N. & Williston, J.S., 1970. Human auditory evoked potentials: possible brain stem components detected on the scalp. Science, 167(3924), pp.1517–8.
Lesenfants, D. et al., 2016. Electromyographic decoding of response to command in disorders of consciousness. Neurology, 87(20).
Li, C.-M. et al., 2014. Hearing impairment associated with depression in US adults, National Health and Nutrition Examination Survey 2005-2010. JAMA otolaryngology-- head & neck surgery, 140(4), pp.293–302.
Di Liberto, G.M. & Lalor, E.C., 2017. Indexing cortical entrainment to natural speech at the phonemic level: Methodological considerations for applied research. Hearing Research, 348, pp.70–77.
Di Liberto, G.M. & Lalor, E.C., 2016. Isolating neural indices of continuous speech processing at the phonetic level. Advances in Experimental Medicine and Biology, 894, pp.337–345.
Di Liberto, G.M., O’Sullivan, J.A. & Lalor, E.C., 2015. Low-frequency cortical entrainment to speech reflects phoneme-level processing. Current Biology, 25(19), pp.2457–2465.
Luts, H., Desloovere, C. & Wouters, J., 2006. Clinical application of dichotic multiple-stimulus auditory steady-state responses in high-risk newborns and young children. Audiology and Neurotology, 11(1), pp.24–37.
Luts H et al., 2014. Development and normative data for the Flemish/Dutch Matrix test. KU Leuven.
Nichols, T.E. & Holmes, A.P., 2002. Nonparametric permutation tests for functional neuroimaging: A primer with examples. Human Brain Mapping, 15(1), pp.1–25.
Noirhomme, Q. et al., 2017. “Look at my classifier’s result”: Disentangling unresponsive from (minimally) conscious patients. NeuroImage, 145.
Picton, T.W. et al., 2005. Estimating audiometric thresholds using auditory steady-state responses. Journal of the American Academy of Audiology, 16(3), pp.140–156.
Shannon, R. V. et al., 1995. Speech recognition with primarily temporal cues. Science, 270(5234), pp.303–304.
Somers, B., Francart, T. & Bertrand, A., 2018. A generic EEG artifact removal algorithm based on the multi-channel Wiener filter. Journal of Neural Engineering, 15(3), p.36007.
Stapells, D.R. et al., 1984. Human Auditory Steady State Potentials. Ear and Hearing, 5(2), pp.105–113.
Vanthornhout, J. et al., 2018. Speech Intelligibility Predicted from Neural Entrainment of the Speech Envelope. JARO - Journal of the Association for Research in Otolaryngology, pp.1–11.
Verhaert, N. et al., 2008. Impact of early hearing screening and treatment on language development and education level: Evaluation of 6 years of universal newborn hearing screening (ALGO®) in Flanders, Belgium. International Journal of Pediatric Otorhinolaryngology, 72(5), pp.599–608.
was not certified by peer review) is the author/funder. All rights reserved. No reuse allowed without permission. The copyright holder for this preprint (whichthis version posted November 17, 2018. . https://doi.org/10.1101/471367doi: bioRxiv preprint
13
Fig. 1 - Spatial distribution of the neural speech tracking at different levels of SNR over the scalp
(64 electrodes) using a FS-model and either the delta (1-4 Hz), theta (4-8 Hz), alpha (8-15 Hz), beta
(15-30 Hz) or low-gamma (30-45 Hz) EEG frequency band. For each frequency band, the first row
represents the topographic map averaged over the participants of the first group (SNRs between
-9.5 dB SNR and quiet); the second row represents the EEG prediction for the second group (SNRs
between -12.5 dB SNR and quiet) using the same EEG frequency band.
SNR (dB)
Spea
rman
Co
rrel
atio
n
Spea
rman
Co
rrel
atio
n
Spea
rman
Co
rrel
atio
n
Spea
rman
Co
rrel
atio
n
Spea
rman
Co
rrel
atio
n
was not certified by peer review) is the author/funder. All rights reserved. No reuse allowed without permission. The copyright holder for this preprint (whichthis version posted November 17, 2018. . https://doi.org/10.1101/471367doi: bioRxiv preprint
14
Fig. 2 – Electrode selection for the delta (in red) and theta (in blue) frequency bands. Note the
fronto-temporal and occipital dominance of the delta band over the scalp while the theta
activation is centralized in the frontal area.
was not certified by peer review) is the author/funder. All rights reserved. No reuse allowed without permission. The copyright holder for this preprint (whichthis version posted November 17, 2018. . https://doi.org/10.1101/471367doi: bioRxiv preprint
15
Fig. 3 - Averaged correlation over groups, frequency bands (rows) and speech representations
(column). Note the monotonic increase in correlation for all the speech representations in each
group in the delta band, and in the theta band for the Ph and Fea models. In the theta band, the
models based on low-level speech features (Env, Sgram and FS) show a S-shape. In grey, the
significance level (p = 0.01) evaluated using a permutation test (1000 permutations).
DEL
TA
THET
A
was not certified by peer review) is the author/funder. All rights reserved. No reuse allowed without permission. The copyright holder for this preprint (whichthis version posted November 17, 2018. . https://doi.org/10.1101/471367doi: bioRxiv preprint
16
Fig. 4 – Averaged monotonicity scores for the different models and EEG frequency bands. This
score quantifies to what extent a model provides a monotonic increase of its neural speech
tracking with SNR for both groups. Note the decrease of this score with the frequency band. The
highest score is reached for the FS-model in the delta band.
was not certified by peer review) is the author/funder. All rights reserved. No reuse allowed without permission. The copyright holder for this preprint (whichthis version posted November 17, 2018. . https://doi.org/10.1101/471367doi: bioRxiv preprint
17
Fig. 5 – Histogram of the difference between the CT derived from using the EEG responses the
speech and the behavioral SRT, in function of speech representation (rows) and frequency band
(columns). The left y-axis shows the number of participants (in blue); the right y-axis shows the
corresponding cumulative percentage of participants (in red). The dashed line represents the
relative difference at which we can predict at least 50% of the participant SRTs. The black bar (NA)
shows the number of participants for which the model was not able to predict an objective SRT.
was not certified by peer review) is the author/funder. All rights reserved. No reuse allowed without permission. The copyright holder for this preprint (whichthis version posted November 17, 2018. . https://doi.org/10.1101/471367doi: bioRxiv preprint
18
EEG band
Feature |CT - SRT |
NA (%) < 1dB (%) < 2dB (%)
δ
Env 37 25 67
Sgram 11 47 76
Ph 32 15 23
Fea 26 36 79
FS 16 50 69
θ
Env 11 47 88
Sgram 5 33 67
Ph 16 25 63
Fea 26 36 64
FS 0 53 84
FS* 0 53 89
Table 1 - The percentage of participants for whom the CT score could not be measured is shown in the column titled NA. For the participants for whom the CT score could be measured, we computed the number of participants presenting an absolute difference (in dB) between the objective CT and the behavioral SRT of less than 1dB (see the fourth column) and 2dB (see the fifth column). Note that only 16% ²of the participants (i.e., 25% of the 63%) present an absolute difference of less than 1 dB with the Env-delta model, while 53% for the FS-theta model.
was not certified by peer review) is the author/funder. All rights reserved. No reuse allowed without permission. The copyright holder for this preprint (whichthis version posted November 17, 2018. . https://doi.org/10.1101/471367doi: bioRxiv preprint
![Predicting binaural speech intelligibility using the ... · (SSN), speech-modulated SSN, babble, and reversed speech], the masker(s) azimuths, reverberation on the target and masker,](https://img.dokumen.tips/doc/110x75/6064968bcb76d432e17b0ec0/predicting-binaural-speech-intelligibility-using-the-ssn-speech-modulated.jpg)