Embed Size (px)
Citation preview

Università degli Studi di Genova
DISEFIN – Series of Economic Working Papers
16126 Genova – via vivaldi 5 – Fax +39 010 209 5223
Predicting Hospital’s Costs to Treat Emergency Pa-tient
Rosella Levaggi
Marcello Montefiori
wp n. 5
August 2012

2
“DISEFIN Working Papers on line” series of economic working papers
published online by
Research Doctorate in
Public Economics
Ph.D School in New technologies and Social Sciences
University of Genoa
Founder:
Amedeo Fossati
Editor-in-Chief:
Marcello Montefiori
Editorial Board:
Paul De Grawe
Francesco Figari
Amedeo Fossati
Luca Gandullia
Eric Gaspérini
Andrea Monticini
Carlo Perroni
Web site: http://www.disefin.unige.it/

Predicting Hospital’s Costs to Treat Emergency Patient
Rosella Levaggi
University of Brescia, Italy
Marcello Montefiori
University of Genova, Italy
Abstract
The Accident and Emergency Departments (A&EDs) are responsible for a large share of overall hospitalization, diagnostic activity, and ultimately health care expenditure. Most health care systems use retrospective reimbursement systems to finance A&E departments, but this system may not be efficient. Prospective pay-ments systems would have the advantage to reduce uncertainty both for the purchas-er and the provider. In Italy some Regions are starting to use prospective payments systems using triage codes to define the output. In this article we use a unique da-taset that allows determining the cost of each patient going through an A&ED to determine whether triage codes can be used for this purpose
Keywords: emergency department, quality, efficiency
Jel Classification: I110, I120, C000

4
1. Introduction The Accident and Emergency Departments (A&EDs) are
responsible for a large share of overall hospitalization, diagnostic
activity, and ultimately health care expenditure.
In spite of their crucial role, very little is known about their
efficiency in treating patients and in the use of the resources. Most
health care systems use retrospective reimbursement systems, but
they may not be efficient. The reimbursement of their activity is
however still an open issue. Cost reimbursement has several
drawbacks: it does not allow predicting or controlling the cost of
A&E departments and it may allow hospitals to pay strategically.
In a context where hospitals are paid using prospective payments
based on DRG’s it is possible to shift some costs from the provider
to the purchaser by strategically timing the admission of the patient
from A&E to the ward. Patients may be kept longer in A&ED in
order to do diagnostic tests that should be routinely done after the
admission to a ward and in this case they would be reimbursed
through the DRG code. For this reason, some authors have
proposed to use DRG based payment systems also for Emergency
Departments. The high level of uncertainty and volatility in the
level of resources that are needed to treat each patients is however a
serious hurdle to the use of Prospective Payment System (PPS) to
reimburse A&E Departments.
The use of triage codes as any other indicators is not
supported by any empirical evidence on which indicators can be
considered good predictors of the cost per patient treated. These
codes are in fact designed to determine priorities in the treatment of
patients and they might not be a good indicator of the cost incurred
by the hospital. The issue is very important since the difference in
the weight given to each triage code is quite different.
The aim of this study is to provide a first effort in
determining the actual cost the hospital will incur when treating

5
patients in the A&ED and to propose a reimbursement system for
this important part of hospital activity
The main component is the salary of medical and no
medical staff (which represents the 70% of total costs) whereas
other variable costs account for just 6% of the total (Cremonesi et
al. 2010).
Given the importance of this component it is necessary to
allocate this cost across patients using some verifiable indicators.
The information, available in the patient file is not sufficient; for
this reason a collaboration between the University of Genova and
the E.O. Ospedali Galliera of Genoa has made it possible to collect
for a sample week data on the time devoted by the medical staff to
each patient, on the diagnostic tests that have been prescribed to
treat each case, and on their cost. This additional information has
been matched up with patients’ files and other relevant accounting
and economic information to estimate the cost incurred by the A&E
department to treat each patient.
This information can be used to determine the variance in
the cost observed for each patient and to try to answer to the
question of which is the best system to reimburse emergency care.
In our analysis we will focus on the predictive power of triage
codes for the cost of treating patients.
Triage codes are a system of priority setting in the A&E
department and should be related to patients’ severity. They are
quite easy to be observed and cannot be manipulated. However,
their use for pricing A&E care is an open issue. These codes are in
fact related to the critical condition of the patient rather than to its
need for care. Red codes must be attended immediately, for yellow
and green codes some waiting is possible while white codes should
indicate inappropriate use of the Department .
The aim of our analysis is to answer this question:
• can triage codes be used to define a DRG-based
prospective payment system?

6
• which alternative indicators can be used to define a
prospective payment system if triage codes cannot be used?
To answer these questions we will first determine the cost
for each patient and we will show the relationship between costs
and triage codes.
We will then use cluster analysis and multinomial logit
regressions methods to determine the relationship between codes
and costs.
This preliminary analysis shows that crude triage codes
cannot be used to reimburse A&EDs. Red and yellow codes are not
distinguishable from a cost point of view, hence they can be
merged together. This merged group is certainly different from
white codes, but the tails of the distribution of green codes do not
allow discriminating between white and green and green and
yellow/red.
2. Material and methods Reimbursing A&E departments is a very important topic in health
care. Most systems use cost reimbursement, but it would be more
efficient to move towards prospective payments systems. This
would allow purchasers and providers to be more efficient. In order
to set up a payment system is it necessary to determine the cost for
each patient. As noted above a considerable portion of the cost of
the Department relates to fixed cost that needs to be distributed
among patients using a robust criterion. The second important as-
pect is related to the variance in the need for patients in A&E
which may make prospective payment systems quite unreliable un-
less an observable index related to the patient or the use of the re-
source exists that allows to reduce this variance.
The first important consideration is that the data on the patients
file are not sufficient to allow defining a set of indicators to define
the cost for each patient treated. The information retrieved for each

7
patient is a set of records, provided by the electronic data pro-
cessing centre of the A&ED, pertaining both to the patient himself
and his clinical pathway. In particular data refers to:
(i) Date and time of arrival; (ii) Medical attendant (that is the
identification code of the accepting medical staff); (iii) Triage en-
trance code; (iv) Patient’s personal information (in particular: gen-
der and date of birth); (v) Date and hour of first visit; (vi) Number
of Laboratory and non-laboratory prescriptions; (vii) Patient out-
come; (viii) Attending Physician; (ix) Date and hour of discharging
(it refers to the patient report closing time).
This information is however not adequate to allocate all kind of
costs. For instance the medical and staff cost, which represent a
large component of total cost, should be distributed according to
actual time devoted to each patients by physicians (Cremonesi et al.
2010, 2012), but this latter variable is unavailable.
The time elapsing between the arrival at A&ED and discharge is
not a good indicator of the time required to treat the patient because
of the two-level system to access and treatment. At the first level
the patient is seen by the nursing staff which assigns each patient a
specific triage code from white (inappropriate access) to red (emer-
gency). The triage code determines the priority in being attended
by the medical staff. For this reason, white and green codes may be
left waiting for a long time, especially when the medical staff has
to treat very severe cases. On the other hand, given that the cases
are not severe, most white and green codes are discharged after a
visit by the medical staff. The time between the first visit and dis-
charge may be a better indicator of the use of resources, provided it
is strictly correlated with the actual time the staff devotes to each
patient, which is usually unknown.
To overcome these problem, during the week Thursday 9th De-
cember 2010, 8:00 pm until Thursday 16th December 2010, 8:00
pm 6 researchers joined the A&E team. During this week medical
doctors were asked to report the actual time they devoted to each

8
patient and to detail all the tests and other treatments they prescribe
to patient. This information is essential to estimate the actual cost
of laboratory, non laboratory and x-ray tests. Patients’ file in fact
simply record the number of laboratory and non-laboratory pre-
scriptions for each patients which are not good proxies for the level
of care of each patients.
For non laboratory prescriptions a one to one correspondence ex-
ists between prescriptions and test (one prescription for each diag-
nostic test). For laboratory prescriptions (cfr. Table 1) this corre-
spondence does not exist: a prescription may be used for a variable
number of tests whose costs may vary significantly. The data col-
lected during this week made it possible to match patients with di-
agnostic tests and to determine their cost.
3. Results During the week of observation 1011 patients went through the
Department. About 65% of them had a green triage code and the
most important characteristics of the dataset are presented in table
1.
The age of the patients increases with the triage code and there
seems to be a small prevalence of women in the white code. The
time between the visit and discharge is increasing as expected for
the first three codes: red codes do not seem to require more time
than green codes. This result may be explained in several ways: red
codes are usually very critical patients that may be hospitalized
more quickly to other Departments within the hospitals; yellow
codes may contain patients that need to be monitored for a longer
period than red codes. This intuition seems to be confirmed by the
last part of the table where the time that the medical staff has de-
voted to each patient is recorded. Time is increasing with patients’
severity as one might expect, and the same reasoning applies also
for laboratory and non-laboratory examinations and for the time
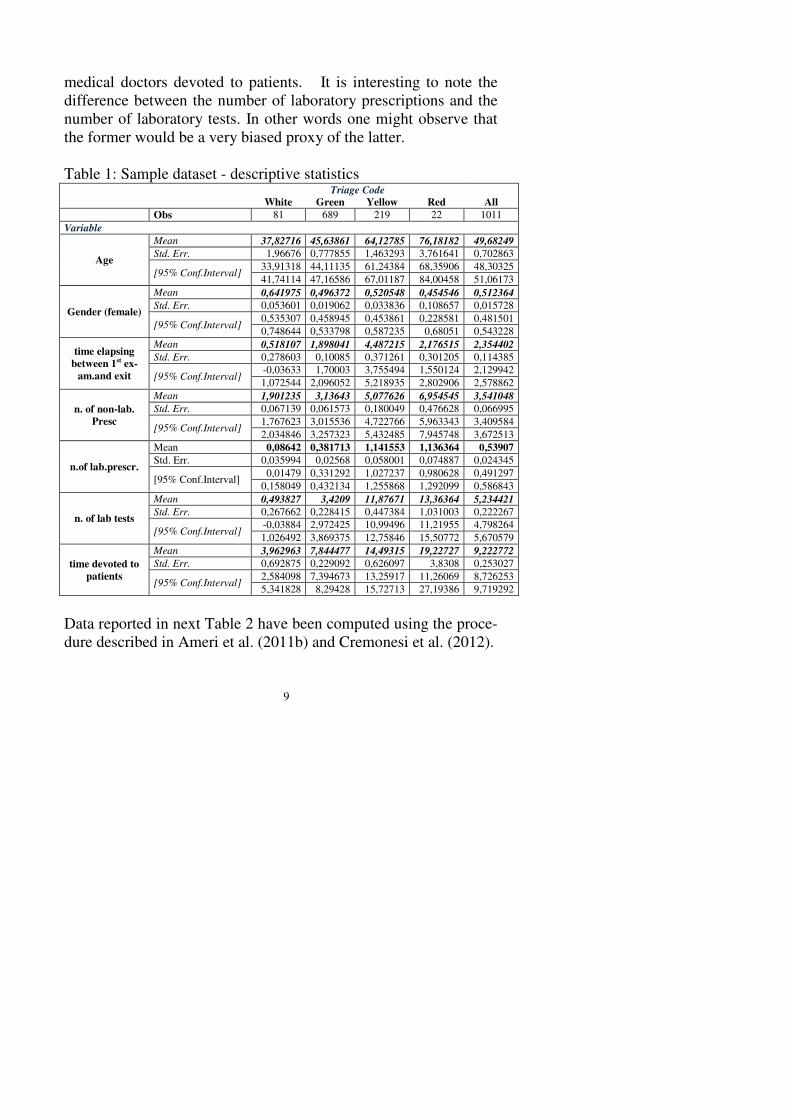
9
medical doctors devoted to patients. It is interesting to note the
difference between the number of laboratory prescriptions and the
number of laboratory tests. In other words one might observe that
the former would be a very biased proxy of the latter.
Table 1: Sample dataset - descriptive statistics Triage Code White Green Yellow Red All
Obs 81 689 219 22 1011
Variable
Age
Mean 37,82716 45,63861 64,12785 76,18182 49,68249
Std. Err. 1,96676 0,777855 1,463293 3,761641 0,702863
[95% Conf.Interval] 33,91318 44,11135 61,24384 68,35906 48,30325
41,74114 47,16586 67,01187 84,00458 51,06173
Gender (female)
Mean 0,641975 0,496372 0,520548 0,454546 0,512364
Std. Err. 0,053601 0,019062 0,033836 0,108657 0,015728
[95% Conf.Interval] 0,535307 0,458945 0,453861 0,228581 0,481501
0,748644 0,533798 0,587235 0,68051 0,543228
time elapsing
between 1st ex-
am.and exit
Mean 0,518107 1,898041 4,487215 2,176515 2,354402
Std. Err. 0,278603 0,10085 0,371261 0,301205 0,114385
[95% Conf.Interval] -0,03633 1,70003 3,755494 1,550124 2,129942
1,072544 2,096052 5,218935 2,802906 2,578862
n. of non-lab.
Presc
Mean 1,901235 3,13643 5,077626 6,954545 3,541048
Std. Err. 0,067139 0,061573 0,180049 0,476628 0,066995
[95% Conf.Interval] 1,767623 3,015536 4,722766 5,963343 3,409584
2,034846 3,257323 5,432485 7,945748 3,672513
n.of lab.prescr.
Mean 0,08642 0,381713 1,141553 1,136364 0,53907
Std. Err. 0,035994 0,02568 0,058001 0,074887 0,024345
[95% Conf.Interval] 0,01479 0,331292 1,027237 0,980628 0,491297
0,158049 0,432134 1,255868 1,292099 0,586843
n. of lab tests
Mean 0,493827 3,4209 11,87671 13,36364 5,234421
Std. Err. 0,267662 0,228415 0,447384 1,031003 0,222267
[95% Conf.Interval] -0,03884 2,972425 10,99496 11,21955 4,798264
1,026492 3,869375 12,75846 15,50772 5,670579
time devoted to
patients
Mean 3,962963 7,844477 14,49315 19,22727 9,222772
Std. Err. 0,692875 0,229092 0,626097 3,8308 0,253027
[95% Conf.Interval] 2,584098 7,394673 13,25917 11,26069 8,726253
5,341828 8,29428 15,72713 27,19386 9,719292
Data reported in next Table 2 have been computed using the proce-
dure described in Ameri et al. (2011b) and Cremonesi et al. (2012).

Table 2: Cost per triage code
Total cost
Medical Doctors
Nurses- Other Per-
sonnel- Adm Staff.
Mortgages, Kitchen &
Laundry, Clean-ing and other
expenses
Health Ser-vices, Surg. & Med. de-vices, Drugs
X-ray Non-Lab
tests Lab tests
White
Mean 87,83 21.02 19.16699 1.45 .42 8.26 33.61 1.14
Min 53,38 9.05 8.176112 0 0 0 15.49 0
Max 409.59 36.97 34.35328 57.15 7.92 238.41 77.47 35.2
std.dev. 48.61 5.76 5.356368 6.64 1.34 35.94 12.45 5.35
Interq.range (75-25) 20.88 9.45 8.539142 .04 .03 0 0 0
Gre
en
Mean 189,38 35.00 32.89114 5.66 3.07 50.77 34.41 8.02
Min 42,94 14.19 12.82174 0 0 0 15.49 0
Max 673,51 71.00 66.82436 57.35 16.51 369.12 139.95 65.27
std.dev. 98.84 10.22 9.80417 7.26 2.66 62.98 18.09 13.92
Interq.range (75-25) 127.48 11.69 11.2017 4.97 3.06 73.97 20.66 15.06
Yel
low
Mean 340,54 59.14 55.4617 12.86 4.93 97.90 50.60 28.27
Min 71,79 29.41 26.5799 .04 .03 0 15.49 0
Max 1074.72 99.920 93.44545 63.13 47.48 696.18 154.16 83.66
std.dev. 147.922 11.94 11.22563 14.55 3.67 110.90 26.17 16.38
Interq.range (75-25) 164.74 13.82 13.10275 6.45 2.85 101.13 39.25 15.88
Red
Mean 407,39 68.80 63.95808 6.69 4.38 4.38 99.01 32.85
Min 184,86 47.70 45.17806 1.23 .81 0 15.49 0
Max 680,05 89.43 83.25746 21.43 14.03 369.13 258.23 73.23
std.dev. 128.50 9.17 8.620408 4.34 2.84 108.81 53.42 12.30
Interq.range (75-25) 215.5 8.62 7.115616 3.94 2.57 80.9 46.22 7.07
All
Mean 218,73 39.84 37.35679 6.91 3.29 58.72 39.26 12.40
Min 42,94 9.05 8.176112 0 0 0 15.49 0
Max 1074.72 99.92 93.44545 63.13 47.48 696.18 258.23 83.66
std.dev. 133.65 15.80 14.93725 6.24 3.06 79.56 23.80 16.80
Interq.range (75-25) 173.33 22.48 21.3552 9.83 3.56 78.59 30.21 27.62

Costs are increasing with the triage code, as one might expect, but
the variance for each triage code is quite important. Furthermore, if
we observe the minimum value for each subsequent triage code and
we compare it with the maximum value for the previous triage code
we note that there is a considerable overlapping. Red and yellow
codes do not appear to be significantly different, especially when
the personnel cost are considered. The first column of Table 3 can
be used to compute the “DRG equivalent” weights; in table five we
compare them with what proposed by Region Lazio and Region
Liguria
Table 3: triage cost's weight Triage Code Weights1
Sample week Liguria2 Lazio3
White 1,0 1,0 1,0
Green 2,2 3,0 3,8
Yellow 3,9 8,0 7,6
Red 4,6 10,0 25,1
Both Regions overestimate the weights of the triage codes; this is
especially true for Lazio and for yellow and red codes. An incorrect
cost reimbursement might cause dramatic results both in terms of
health care level and efficiency, and it may also induce hospitals to
strategically assign patients to triage codes that are more generous
from the point of view of the reimbursement. This well known
problem that the literature on DRG payment system refers to “up-
coding” is potentially more important for A&ED.
1 Weights have been obtained by a normalization procedure
2 DGR 5 agosto 2005, n. 935 “Quadro delle risorse finanziarie del Fondo sani-
tario regionale e finanziamento delle Aziende Sanitarie - anno 2005” 3 Regione Lazio DGR 22 marzo 2006, n. 143 “Ripartizione nei livelli di assi-
stenza del fondo sanitario regionale 2006”

12
To design a prospective payment system two set of instruments are
essential: an observable variable, possible outside the provider’s
control that may allow to define homogeneous groups of patients
from the point of view of the cost and a set of variables on which
the purchaser may refrain providers’ strategic behaviour.
Let us now examine if the triage code satisfies the first require-
ment. If it was a good indicator, costs per triage code should have a
relative small variance within each group while the mean of the
cost of each triage code should be significantly different. Several
tests can be performed to check for these characteristics, but they
usually imply that the distribution of the observations is not signifi-
cantly different from a normal distribution. Figure 1 below pro-
vides the cost density distribution by triage code.
Figure 1: total cost (triage)
Total costs present a large variability “within” each triage colour
which means that the triage code may not be a good proxy of the
cost of each patient, especially if the purchaser wants to use it as

13
the main indicator for a prospective payment system. The second
interesting result is that the most expensive patients are not red
codes as one might expect, but they are the yellow ones. Therefore
it is possible to state that triage code classification is not suitable in
representing the patient cost variability. In other words the triage
code classification is a biased proxy of cost: costs are not naturally
clustered by triage code and that yellow and red codes are indistin-
guishable from a cost perspective.
4. Cluster analysis
The distribution of costs by triage code shows that, although
the average cost per each triage code is increasing, the variance
within each code is too high; furthermore some triage codes may be
similar from a cost point of view and could well be merged into a
single category. In order to get more insights in the relationship be-
tween costs and triage code we have clustered patients by k-means
procedure identifying 20 different classes of total cost. This tech-
nique allows identifying 20 cost classes that are quite homogeneous
from the point of view of the cost. We expect triage codes to be
good cost predictors if their presence in each class is clustered
around a rather small number of contiguous classes and there is a
one to one correspondence between higher triage code and higher
class.
Table 4 provides per each class the mean, the number of ob-
servation, the minimum and the maximum value (in Euro) while
Figure 2: class frequency shows the composition of each cluster by
triage code.

14
Figure 2: class frequency
Class Mean of total cost N.of Obs Min Max
1 58,51 31 42,94 62,7
2 67,72 77 63,16 74,7
3 83,01 66 75,89 88,77
4 94,97 52 89,15 103,32
5 113,58 43 105,08 121,31
6 130,64 41 122,44 137,98
7 146,57 50 138,62 152,55
8 160,10 54 153,56 166,28
9 173,03 42 166,61 179,26
10 186,85 60 180,14 193,98
11 201,81 54 194,34 209,56
12 218,30 51 210,4 229,11
13 241,20 61 230,21 255,39
14 270,25 71 256,3 286,31
15 303,18 71 286,78 322,59
16 345,99 58 325,4 370,4
17 400,76 68 374,62 436,03
18 483,02 35 442,96 543,93
19 610,50 21 546,98 720,8
20 898,89 5 794,83 1074,7 Table 1: classes for total cost

15
Figure 1: Triage code composition by class
This picture shows that green and yellow codes span among
almost of all cost classes, thus making almost impossible to design
a prospective payment based on triage codes. The intuition that red
codes may not be significantly different from yellow codes con-
firmed that red codes are enveloped by yellow one and from a cost
point of view they do not seem to have any distinguishing charac-
teristic from yellow one. White codes are clustered in the first cost
classes while green and yellow overlap for most of the diagram.
We have performed the same analysis by investigating the
cost composition inside each cost class in order to understand
whether some cost components could be identified as cost drivers.
Also in this case, the composition through classes does not seem to
be so different. In general, lower cost classes (whose composition
shows a prevalence of white and green codes) require a visit and
some tests. This result may be intepreted in terms of appropriate-
ness and upcoding.
White codes (inappropriate use of A&ED department) do
not need care from this Department. A visit and some reassurance

16
about their health status is sufficient to treat them. It is interesting
to note that quite a few of them do not even require any additional
test to confirm the diagnosis. Upcoding may exists for the green
codes that have received the same form of care (visit followed by
discharge). Several may be the reasons for such upcoding, for in-
stance the fact that white codes need to pay a copayment for the use
of A&ED.
Also in this case no evidence of it could be find as Figure 4
below shows.
Figure 4: cost composition by class
The large variability observed within classes means that the
triage classification using the four codes is not a good indicator of
the cost of the treatment; however it may be possible that other
classifications still based on triage code may be used. The data pre-
sented in Figure 3 seems to show that red and yellow code are not
so different from each other; in the other cases it is very difficult to
infer conclusions from visual inspection because the tails of the dis-
tributions are quite long. To test for statistical differences between
the four groups. we have run multinomial logit regression where
the dependent variable is the triage code:

17
where TCì=0 if the triage code is white; TCì=1 if the triage
code is green TCì=2 if the triage code is yellow and TCì=3 if the
triage code is red. Ci is a set of variables relating to the intensity in
the use of resource; Pi are patients characteristics and Ei are char-
acteristics related to the admission.
Intensity of treatment is captured by: the time between the
first visit and discharge; the time the medical staff has devoted to
the patients, the number of diagnostic tests run for each patient and
total cost. Patients characteristics are summarised by their age and
the dummy TFP which takes the value 1 if the patient is a Tempo-
rarily Present Foreigner and 0 otherwise. Finally the environment
in which the admission has taken place is captured by the dummy
ROAD which takes the value of 1 if the patient has been victim of a
road accident and OWN which takes the value of 1 if the patient
has reached A&E with a private car (or driving himself)
Table 5: Results of the multinomial logit codtri-
age White Green Yellow Red
White
1st exam-exit
(base out-
come)
-0.233777** -0.242207*** -0.778413***
N.NonLabPresc.
-0.3181792 -0.234962 -0.024538
N.LabTests -0.0919004 0.0130243 0.053205
Age -0.0028568 0.0116622 0.0179279
TotalCost 0.0350031***
0.0399173***
0.0397894***
VisitingTime 0.0722656* 0.1051073** 0.1201726***
TPF -0.3877211 -0.6291428 0-.9048742
ROAD 13.49617 12.91392 0-.8191885
OWN -1.355939** -1.444655** -3.313348***
Constant 0.0084987 -4.514643*** -7.271592***
Number of obs 1010 Log likelihood -585.35041 LR chi2(27) 604.25 Prob > chi2 0.0000 Pseudo R2 = 0.3404

18
*Significant at 10% level of significance
**Significant at 5% level of significance
***Significant at 1% level of significance
With multinomial logit we have to test for independence of
irrelevant alternatives (IIA). Under the IIA assumption no system-
atic change should occur in the coefficients if we exclude one of
the outcome from the model. For this purpose we have performed
the Hausman test which shows no evidence that the IIA assumption
has been violated, regardless the outcome is excluded from the re-
gression.
The Likelihood-ratio test and the Wald test (see appendix 1
for details) suggests that the variables number of non laboratory
prescriptions (N.NonLabPresc) and Temporarily Present Foreigner
(TFP)
do not affect the values of the dependent variable. On the
other hand the two tests provide a conflicting result with reference
to the ROAD variable. The LR test reject, at 10% level of signifi-
cance, the hypothesis that being victim of a road accident does not
affect the dependent variable whereas the Wald accepts it.
Table 6: Wald test for independent variables Variable: TotalCost Wald
Group 1 vs Group 2 tests for independent variables
df chi2 P>chi2
White Green 1 26.775 0.000
White Yellow 1 8.683 0.003
White Red 1 na na
Green Yellow 1 6.632 0.010
Green Red 1 1.028 0.311
Yellow Red 1 0.396 0.529
The Wald tests for independent variables comparing, by
two, the different “groups” of the dependent focusing on the ex-
planatory variable “TotalCost” is reported in Table 6.

19
According to it we can accept the hypothesis that the varia-
ble “TotalCost” do not affect the values of the dependent variable
when comparing Green with Red codes and Yellow with Red
codes.
Therefore we note that the coefficient of the variable which
represent the total cost per patient is between white and green and
between green and yellow is significant at 5% level of significance,
whereas it is not between green and red codes.
Finally we have run a multinomial logit where the yellow
and red codes have been merged together
Table 7: Multinomial logit merging yellow and red codes
White Green Yellow+Red 1st exam-exit 0.232 **
Base outcome
-0.0147 N.NonLabPresc. 0.318 0.104 N.LabTests 0.091 0.107 *** Age 0.002 0.015 ** TotalCost -0.035 *** 0.004 ** VisitingTime -0.072 0.034 ** TPF 0.387 -0.247 ROAD -13.904 -0.658 OWN 1.35 ** -0.179 Constant -0.094 4.48 **
Number of obs 1010 Log likelihood -529.43 LR chi2(27) 568.82 Prob > chi2 0.00
**Significant at 5% level of significance; *** Significant at 1% level of significance
In this second case, the results are more homogeneous, but
the variability of the green codes is still an issue.
5. Discussion

20
The analysis presented in this paper represents one of the
first attempts to study the relationship between triage codes and the
cost of treating patients in A&E. The data usually available through
patients files are not sufficient for the analysis, but we could use a
unique dataset that has matched patients information with data spe-
cifically collected on several aspects relating to the intensity and
the cost of care.
The tentative conclusion of our analysis is that crude triage
codes cannot be used as a proxy for the cost incurred by the hospi-
tal to treat patients. The variance within the same code is too big to
make triage codes a suitable candidate.
However, some other interesting results are emerging from
our analysis. First of all, yellow and red codes are not statistically
different and from a reimbursement point of view they can then be
treated in the same way. This would restrict the classes of patients
to three instead of one. White codes are different in their cost from
yellow+red, while green over-run both categories.
The main message coming from this analysis is that we
would need another observable variable to split the green in two
categories or to allocate them either to the white code or to the yel-
low+red code.
6. Conclusions The Accident and Emergency Departments (A&EDs) are
responsible for a large share of overall hospitalization, diagnostic
activity, and ultimately health care expenditure.
Most health care systems use retrospective reimbursement
systems for A&E, but the system may not be efficient because it
may induce hospital to increase the number of tests and it does not
allow predicting or controlling the cost of A&E departments. For
this reason, finding an alternative way to reimburse this strategic
activity is very important from a policy point of view. Ideally, us-

21
ing a PPS system would possible solve some of the problem, but
the high level of uncertainty and volatility in the level of resources
that are needed to treat each patients is however a serious hurdle to
the use of such a payment scheme.
The aim of this study was to provide an accurate estimate of
the actual cost the hospital will incur when treating patients in the
A&ED and to propose a reimbursement system for this important
part of hospital activity We show that crude triage codes cannot be
used to reimburse A&E. Red and yellow codes are not different
from a cost point of view, hence they can be merged together. This
merged group is certainly different from white codes, but the tails
of the distribution of the green codes do not allow discriminating
between white and green and green and yellow/red.
The next step in our analysis will be to separate patients
admitted because of an accident from the others. This should be a
more homogeneous group as concerns the use of resources it may
help in reducing the variance of the cost of the other patients.
Acknowledgements The authors would like to thank E.O. Ospedali Galliera and
in particular Adriano Lagostena, general manager of the
E.O.Ospedali Galliera, Marco Esposto, manager responsible for
management control and Paolo Cremonesi, head of the Ospedali
Galliera Emergency Department, for the precious cooperation in
providing the data

22
References Ameri M., Cremonesi P., Montefiori M. (2011a). Pronto soccorso e
spesa sanitaria regionale, Politiche Sanitarie vol.12 n.4;
Ameri M., Cremonesi P., Montefiori M. (2011b). The Effects of
Inappropriate Emergency Department Use, Studi Economici,
vol.105 n.3;
Bamezai A., Melnick G., Nawathe A. (2005). The cost of an emer-
gency department visit and its relationship to emergency de-
partment volume, Annals of Emergency Medicine 45(5):483-
490
Cao P., Toyabe S.I., Akazawa K. (2006). Development of a Pratical
Costing Method for Hospital, Tohoku Journal of Experi-
mental Medicine 208:213-224
Cremonesi P, di Bella E., Montefiori M. (2010). Cost analysis of
emergency department, Journal of Preventive Medicine and
Hygiene, vol.51 n.4;
Cremonesi P., di Bella E., Montefiori M. (2011).Tempi d'attesa e
sovraffollamento delle strutture di primo soccorso: un'analisi
empirica, SIMEU Journal, vol.4 n.3;
Cremonesi P., Montefiori M., Resta M. (2012). Hospital Emergen-
cy Department: an Insight by Means of Quantitative Meth-
ods, The Open Pharmacoeconomics & Health Economics
Journal, vol.4;
Hoot N., Aronsky D. (2006). An Early System for Overcrowding in
the Emergency Department, AMIA 2006 Symposium Pro-
ceedings p:339
Hoot N., Zhou C., Jones I., Aronsky D. (2007). Measuring and
Forecasting Emergency Department Crowding in Real Time,
Annals of Emergency Medicine 49(6):747-755

23
Horwitz L.I., Green J., Bradley E.H. (2010). US Emergency De-
partment Performance on Wait Time and Length of Visit,
Annals of Emergency Medicine 55(2):133-141
Kulstad E.B., Sikka R., Sweis R.T., Kelley K.M., Rzechula K.H.
(2010). ED overcrowding is associated with an increased fre-
quency of medication errors, American Journal of Emergency
Medicine 28:304-309
Levaggi R. M. Montefiori (2012). Considerazioni economiche nel-
la gestione sanitaria del migrante In:C. Scarcella. Medicina
delle migrazioni: stato di salute del migrante e fattori di ri-
schio associati. Società italiana di Igiene e Medicina Preven-
tiva e Sanita' Pubblica, Sezione Lombardia, Milano: 217-
225,
McCarthy M.L., Aronsky D., Jones I.D., et al. (2008) The Emer-
gency Department Occupancy Rate: A simple Measure of
Emergency Department Crowding?, Annals of Emergency
Medicine 51(1):15-24
McCarthy M.L., Zeger S.L., Ding R., et al. (2009) Crowding De-
lays Treatment and Lengthens Emergency, Annals of Emer-
gency Medicine 54(4):492-503
Montefiori M., Resta M. (2009). A computational approach for the
health care market, Health Care Management Science, (pub-
lished online: 11 June 2008), vol.12 n.4;
Pines J.M., Yealy D.M. (2009). Advancing the Science of Emer-
gency Department Crowding: Measurement and Solutions
54(4): 511-513
Rossille D., Cuggia M., Arnault A., Bouget J., Le Beux P. (2008).
Managing an emergency department by analysis HIS medical
data: a focus on elderly patient clinical pathways, Health
Care Management Science 11:139-146

24
Sartini, M., Cremonesi, P., Tamagno, R., Cristina, M.L., Orlando, P
and Simeu Group (2007). Quality in emergency departments:
a study on 3,285,440 admissions. Journal of Preventing Med-
icine and Hygiene; 48: 17-23
Tyrance, P.H., Himmelstein, D.U. and Woolhandler, S. (1996). US
Emergency Department Costs: No Emergency, American
Journal of Public Health; 86(11): 1527-1531
Williams R.M. (1996). The costs of visits to emergency depart-
ments, The New England Journal of Medicine 334:642-646

25
Working Papers recently published (The complete list of working papers can be found at
http.//www.disefin.unige.it)
n.4/2012 Enrico di Bella, Lucia Leporatti, Luca Persico, "The Sta-
tistical Analysis of Crime Data at Street Level: Models Com-
parison", May 2012
n.3/2012 Rosella Levaggi, Francesco Menoncin, "Paternalistic
Goods to Improve Income Distribution: a Political Economy
Approach", April 2012
n.2/2012 Gabriele Cardullo, "Public Sector Wage Bargaining, Un-
employment, and Inequality ", February 2012
n.1/2012 Amedeo Fossati, "The Italian Tradition in Public Finance:
an Annotated Bibliografy of Mauro Fasiani", January 2012
n.7/2011 Amedeo Fossati, Marcello Montefiori, "Adverse Selection
in Elderly Care", November 2011
n.6/2011 Paolo Cremonesi, Enrico di Bella, Marcello Montefiori,
Luca Persico, "A self-reported work sampling to assess the
Emergency Department’s costs", October 2011
n.5/2011 Enrico di Bella, Luca Persico, Matteo Corsi, "A Multi-
vari-ate Analysis Of The Space Syntax Output For The Defi-
nition Of Strata In Street Security Surveys", September
2011n.4/2011 E. Briata, "Marginal tax rates, tax revenues and
inequality. Reagan's fiscal policy", July 2011
n.4/2011 Elena Briata, "Marginal tax rates, tax revenues and ine-
qual-ity. Reagan's fiscal policy", July 2011n.3/2011 France-
sco Copello, Cristiana Pellicanò, "Esemplificazione della Da-
ta Envelopment Analysis per la valutazione di efficienza in
una grande azienda ospedaliera universitaria"
n.2/2011 Stefano Capri, Rosella Levaggi, "Shifting the risk in pric-
ing and reimbursement schemes? A model of risk-sharing
agreements for innovative drugs"

26
n.1/2011 Cinzia Di Novi, "The Indirect Effect of Fine Particulate
Matter on Health through Individuals' Life-style"
n.4/2010 Angelo Baglioni, Andrea Monticini, "Why does the Inter-
est Rate Decline Over the Day? Evidence from the Liquidity
Crisis"
n.3/2010 Amedeo Fossati: "The double taxation of savings: the
Italian debate revisited"
n.2/2010 Andrea Monticini, David Peel, Giacomo Vaciago: "The
impact of ECB and FED announcements on the Euro Interest
Rates"
n.1/2010 Amedeo Fossati: "Vilfredo Pareto and the methodology of
the Italian tradition in public finance"