Embed Size (px)
Citation preview
RIJSS Volume 3, Issue 5 (May. 2014) ISSN: 2250 – 3994
Journal of Radix International Educational and Research Consortium
1 | P a g e www.rierc.org
FACTOR DETERMINANTS OF FDI INFLOWS INTO INDIA
BIPIN NAMDEV BANDEKAR
Assistant Professor (Research Scholar)
Narayan Zantye College of Commerce
Post Industrial Estate
Vathadev, Sarvan
Bicholim-Goa
DR. K. G. SANKARANARAYANAN
Associate Professor and Hod, Department Of Commerce
Director, Research Centre
Narayan Zantye College of Commerce
(Affiliated To Goa University)
Post Industrial Estate
Vathadev, Sarvan, Bicholim – Goa
One of the economic problems of developing nations is that they do not have sufficient national savings to
finance their investment. They are in continuous need of foreign capital either direct or indirect
investment. Initially, they took loans from international commercial banks. But in 1980’s bank debt crisis
forced many economies to reform their investment policies to attract more stable form of foreign capital
and FDI appeared to be one of the easiest way to get foreign capital without undertaking any risks linked to
the debt. Thus, it became an attractive alternative as a source of capital inflows. Foreign Direct Investment
(FDI) is a process whereby the residents of the home source country attain ownership of assets with the
intention to control the production, distribution and other activities of a firm in the host country.
In the era of globalization, Foreign Direct Investment flows have been expanding at a faster rate. The
statistical data clearly indicates the fact that world’s FDI inflows are increasing at a rapid rate. FDI have
become an integral and dominant part of every expanding global economy. For developing economies FDI
is a source and opportunity for higher and faster economic growth. FDI is also considered as an additional
source of capital from developed to developing and least developed countries.
A Journal of Radix International Educational and
Research Consortium
RIJSS
RADIX INTERNATIONAL JOURNAL OF
RESEARCH IN SOCIAL SCIENCE
RIJSS Volume 3, Issue 5 (May. 2014) ISSN: 2250 – 3994
Journal of Radix International Educational and Research Consortium
2 | P a g e www.rierc.org
India, being a developing economy, has also emerged as one of the leading FDI destinations in Asia, in the
recent years. Actually, the need for import of foreign capital was defined in the Industrial Policy Resolution
of 1948. It was followed by Foreign Exchange Crisis of 1948, allowing Foreign Companies to proceed with
their capital project in 1963-64, Tax exemption to NRI’s in 1965, New Industrial Licensing Policy of 1970,
Govt. policy towards Foreign Investment 1972-73, FERA amended in 1973 to attract foreign investment in
India. The actual flow of foreign investment started in India in 1980 when the Govt. of India (GOI)released
the Foreign Investment policy, in respect of Oil Exporting Developing Countries with a good package of
exemption to tap their resources. Looking at the importance of FDI, the GOI introduces Liberalization,
Privatization and Globalization (LPG) Policy and opened Indian Economy for foreign players in 1991 as
FEMA, with a baseline of less than USD 1 Billion in 1990. Thus, in India, the foreign investment climate
drastically changed as a result of major reforms introduced by LPG policy of 1991.
During the last 22 years, there was a remarkable increase in foreign capital inflows into India. FDI inflows
were meagre in 1970’s and 1980’s. But the trends and progress since 1991 seem to be increasing. The year
2008 has seen the highest amount of FDI Inflow i.e. USD 47 Billion. Out of total FDI Inflow of developing
economies, India’s share was 7 % in the year 2008,but it reduced to USD 31.55 Billion in 2011and USD
35.12 Billion in the year 2012(Source: UNCTAD’s World Investment Report).
The share of Mauritius in India’s FDI inflow is highest followed by Singapore, USA, UK and Netherlands over
the period 2000-2011.The sector wise distribution of FDI Equity inflows in India shows that more than half
of incoming FDI has moved into Six Sectors i.e. Service sector, Construction, Telecommunication, Computer
Software and hardware, Drugs and Pharmaceuticals and Chemicals for the period 2000 to 2013. The
statistical data on state wise FDI equity inflows in India also confirms the wide differences among various
states. There has been FDI showering in the states of Delhi, Maharashtra, Karnataka, Tamilnadu and
Gujarat over the last 12 years. (Source: Department of Industrial Policy and Promotion, GOI)
There are various socio-economic factors which may influence the FDI inflows into India. In this context,
this paper tries to explore the various factors that determine the FDI inflows in India. This may help to
address some of the issues arose towards the goal of increasing India’s FDI inflows.
LITERATURE REVIEW
Till now, various empirical studies have been conducted by researchers to identify the factors that
influence the inflow of FDI. Nevertheless, the variables which were identified as a determinant of FDI vary
from study to study and from country to country. Therefore, it is difficult to derive one list of determinants
as some determinants have gained and some have lost the importance over a period of time. This review
focuses on empirical studies conducted by various researchers on determinants of FDI in developing
countries.
Tsai (1994) in his empirical study of two spans 1975-78 and 1983-86 used economic variables like market
size and growth factors, trade balance and hourly wage rate in manufacturing and proved that Market Size
and growth have positive impact on FDI inflows. Singh & Jun (1995) inferred that export orientation is the

RIJSS Volume 3, Issue 5 (May. 2014) ISSN: 2250 – 3994
Journal of Radix International Educational and Research Consortium
3 | P a g e www.rierc.org
strongest variable and political risk and business operation conditions are also significant determinations of
FDI In flows. Bala subramanyam, Salisu & Sapsford (1996) arrived at that FDI is a major element of
economic growth in developing countries, and that relatively open, export-promoting macroeconomic
policy encourages FDI inflows. While Yang, Groenewold & Tcha (2000)found that if a host country is
relatively closed on the current account, incentives are created for FDI as a means of circumventing the
barriers to trade. On the other hand, a relatively closed capital account may discourage FDI.
Kerr & Monsingh (2001) concluded in their study that the wage level, exchange rate, level of interest rates,
taxation regime and the degree of openness are the determinants of the level of FDI flows to China over
the period 1980 to 1998. Charkraborty & Basu (2002) explored the co-integration relationship with the
method developed by Johansen (1990) and found two long-run equilibrium relationships. The first
relationship is between net inflow of FDI, real GDP and the proportion of import duties in tax revenue and
the second is between real GDP and unit cost of labour and found unidirectional Granger Causality from
real GDP to net inflow of FDI. Asiedu (2002) inferred that openness of economy, return on investment and
market size are statistically significant variables for fostering FDI whereas infrastructure and political risk
are statistically insignificant variables.
Addison & Heshmati (2003) investigated the determinants of FDI inflows to developing countries over a
period 1970 to 1999 using Panel data Regression Analysis. Economic Growth and Openness to trade has
positive impact on FDI inflows whereas Level of risk affects FDI negatively. It is added democratization and
spread of ICT are likely to affect FDI since both Democracy and ICT have significant positive effects.
“Economic freedom, openness, prosperity, human capital and size of FDI in previous years positively
influence the growth of FDI whereas political instability negatively influences it,” added Quazi & Mahmud
(2004).Naeem, Ijaz, and Azam (2005)also supplemented that the economic factors like market size,
domestic investment, trade openness, indirect taxes, inflation, and external debt are significant in Pakistan.
Moreira (2009) in the literature based study in Africa concludes that along with the availability of natural
and mineral resources, Africa has managed to lure foreign investment because of its trade openness
policies, cost-effective labour, size of market etc. but factors like corruption, lengthy administrative
procedures in setting up business have acted as obstacle in attracting more FDI in the region. The study of
Bende-Nabende (2002) and (Krugell, 2005) from same country found market size and growth as one of the
most important and long-run determinants of FDI and adds that economy with a large market size attracts
more FDI and countries that have high and sustained growth rates receive more FDI flows compared to
unstable economies.
Krugellalong with Pigato (2001), Lemi & Asefa (2003) Yasin (2005) and Odenthal (2001), Fedderke & Romm
(2006), Asiedu (2006), Schneider & Frey (1985), Culem (1988), Moore (1993), Love &Lage-Hidalgo (2000)
explains that availability of cheap labour positively influence FDI inflows, but also adds that along with cost
of labour, productivity of labour also matters. Even an availability of skilled human capital is crucial.
Bhati (2006)analysed the factors influencing FDI inflows, in 62 developing countries of the world and
summarised that per capita GDP stood as a significant influencer of FDI inflows during each period 1989 –
RIJSS Volume 3, Issue 5 (May. 2014) ISSN: 2250 – 3994
Journal of Radix International Educational and Research Consortium
4 | P a g e www.rierc.org
1994, 1995-99, and 2000-2003. Another significant determinant of FDI for the period 1989-94 and 1995-
1999 is exports as a percentage of GDP. The other socio-economic determinants such as adult literacy,
external debt, inflation rate and power consumption had insignificant affect in this study. Wang (2009)
examined the impact of FDI inflows on 12 Asian Economies i.e. Bangladesh, China, Hong Kong, India,
Indonesia, Korea, Malaysia, Pakistan, Philippines, Singapore, Thailand and Taiwan during the period 1987-
97 and found that FDI in manufacturing sector has a significant and positive impact on economic growth in
the host economies. Mottaleb & Kalirajan (2010) in their study of 68 developing countries i.e. Low income
and Lower middle income countries from Asia, Africa and Latin America with data set 2005 to 2007
concluded that GDP Growth rate, Abundant Labour force, improved infrastructure and communication
system, Business environments, Foreign Aid are significantly and positively affect FDI inflows. They added
that FDI inflows are based towards Asian and Lower middle income countries. Kok & Ersoy (2011)
investigated the best determinants of FDI in developing countries and found that some determinants have
strong positive effects on economic progress while Total Debt Service/ GDP and inflation have a negative
impact.
Shumaila, Nadia & Sami (2012) in their study on Pakistan made a case for positive relation between capital
inflows (FDI, Export revenue, Remittances) and inflation. Saleem, Zahid, Shoaib, Mahmood, & Nayab
(2013) conducted a study for a time period of 1990 to 2011 with the help of regression analysis and
identified that there exists a positive relationship between foreign direct investment (FDI) and inflation and
whereas FDI inflows are negatively influenced by growth of GDP in Pakistan.
The impact of FDI on economic growth of Indian economy was examined by Hooda (2011) for the period
1991-92 to 2008-09. The results indicate that FDI is an essential and significant factor influencing the level
of growth in Indian economy. She also found that trade GDP, Research and Development GDP, Financial
position, exchange rate, Reserves GDP are the important macroeconomic determinants of FDI Inflows in
India. Singhania & Gupta (2011) concluded that only GDP, inflation rate and scientific research are
statistically significant and that FDI Policy changes during years 1995-1997 have had a significant impact on
FDI inflows into India. The authors recommend that the Government of India should open more sectors to
FDI investments. A study by Shylajan (2011), reviewed the major factors of FDI inflow in India for the
period 1993 to 2006 using multiple regression analysis. The study inferred that FDI is related positively with
real GDP and previous period FDI inflow but inversely related with inflation. Sahni (2012) arrived at that
GDP, inflation (WPI) and Trade Openness are important factors in attracting FDI inflows in India during
post-reform period and have positive relationship whereas Foreign Exchange Reserve was found to be
statistically insignificant variable. While Sisili. & Elango. (2013) found that FDI inflows are positively
influenced by growth of marker and ratio of domestic investment to GDP but are negatively influenced by
fluctuations in exchange rate and size of market. Karmali (2013) also found that there exist a long term
relationship between FDI inflows, GDP growth, Exchange Rate, External Debt, Domestic Inflation and Trade
Openness.
RIJSS Volume 3, Issue 5 (May. 2014) ISSN: 2250 – 3994
Journal of Radix International Educational and Research Consortium
5 | P a g e www.rierc.org
OBJECTIVES AND METHODOLOGY
The main aim of this study is to analyse the trends of FDI inflows in India and to identify the factors that
influence the FDI Inflows to India. The data set consists of yearly observations for the period 1991-2012 i.e.
22 years for the developing country, India. The required data has been obtained from UNCTAD- World
Investment Report, World Development Report, IMF, World Bank’s World Development Indicators., RBI
Bulletins, etc. The definition of variables is explained in the Glossary.
In this study, FDI inflow is the dependent variable and Gross Domestic Product (GDP), GDP per capita, GDP
growth, Power consumption per capita, Exchange Rate, Exports as percentage of GDP, Inflation rate, Trade
openness, (Import & Export as % of GDP), External debt, Employment growth, Total reserves and Real
Interest Rate are the 12 independent variables. Statistical tools like Correlation, ANOVA and Regression
Analysis (Ordinary Least Square) and Time Series Analysis have been used to analyse the data.
HYPOTHESIS OF THE STUDY
Ho: There is no significant relation between FDI inflows and GDP, Exchange Rate, External Debt, Inflation
Rate, Trade openness, GDP per capita, GDP Growth, Electric Power Consumption, Employment Growth,
Total Reserve, Exports, Real Interest Rate.
ANALYSIS AND DISCUSSION
A) Trends of FDI Inflows in India
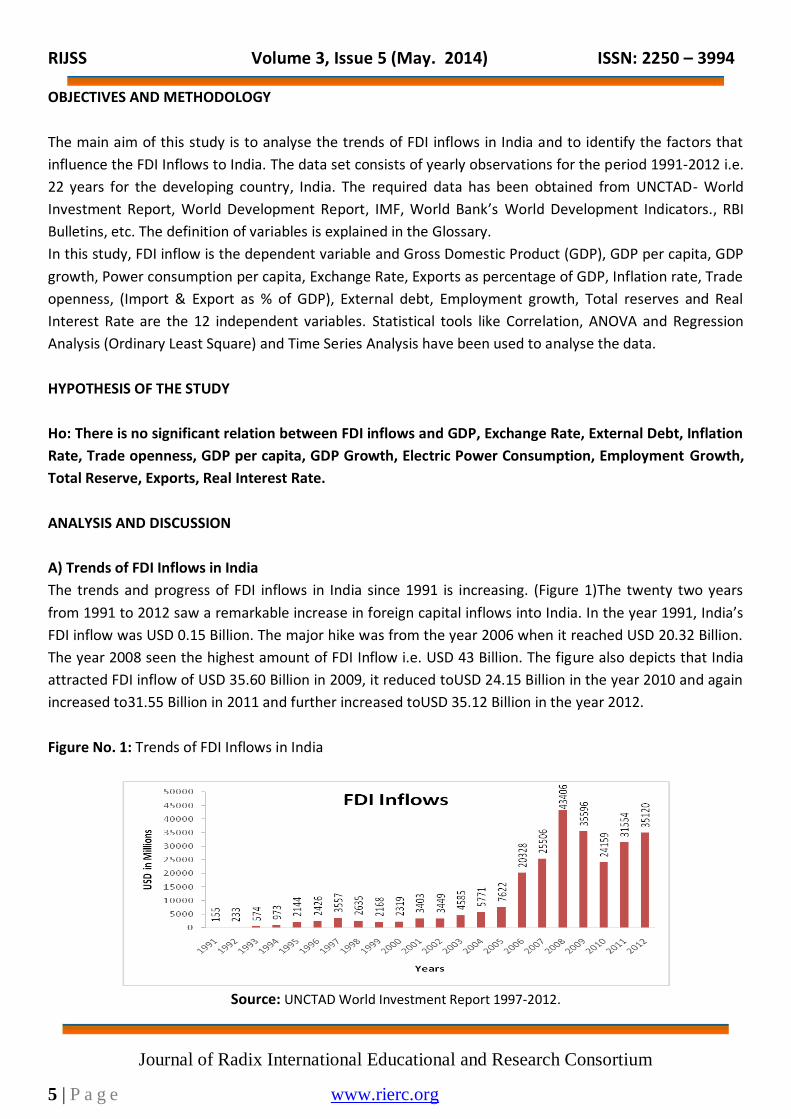
The trends and progress of FDI inflows in India since 1991 is increasing. (Figure 1)The twenty two years
from 1991 to 2012 saw a remarkable increase in foreign capital inflows into India. In the year 1991, India’s
FDI inflow was USD 0.15 Billion. The major hike was from the year 2006 when it reached USD 20.32 Billion.
The year 2008 seen the highest amount of FDI Inflow i.e. USD 43 Billion. The figure also depicts that India
attracted FDI inflow of USD 35.60 Billion in 2009, it reduced toUSD 24.15 Billion in the year 2010 and again
increased to31.55 Billion in 2011 and further increased toUSD 35.12 Billion in the year 2012.
Figure No. 1: Trends of FDI Inflows in India
Source: UNCTAD World Investment Report 1997-2012.
RIJSS Volume 3, Issue 5 (May. 2014) ISSN: 2250 – 3994
Journal of Radix International Educational and Research Consortium
6 | P a g e www.rierc.org
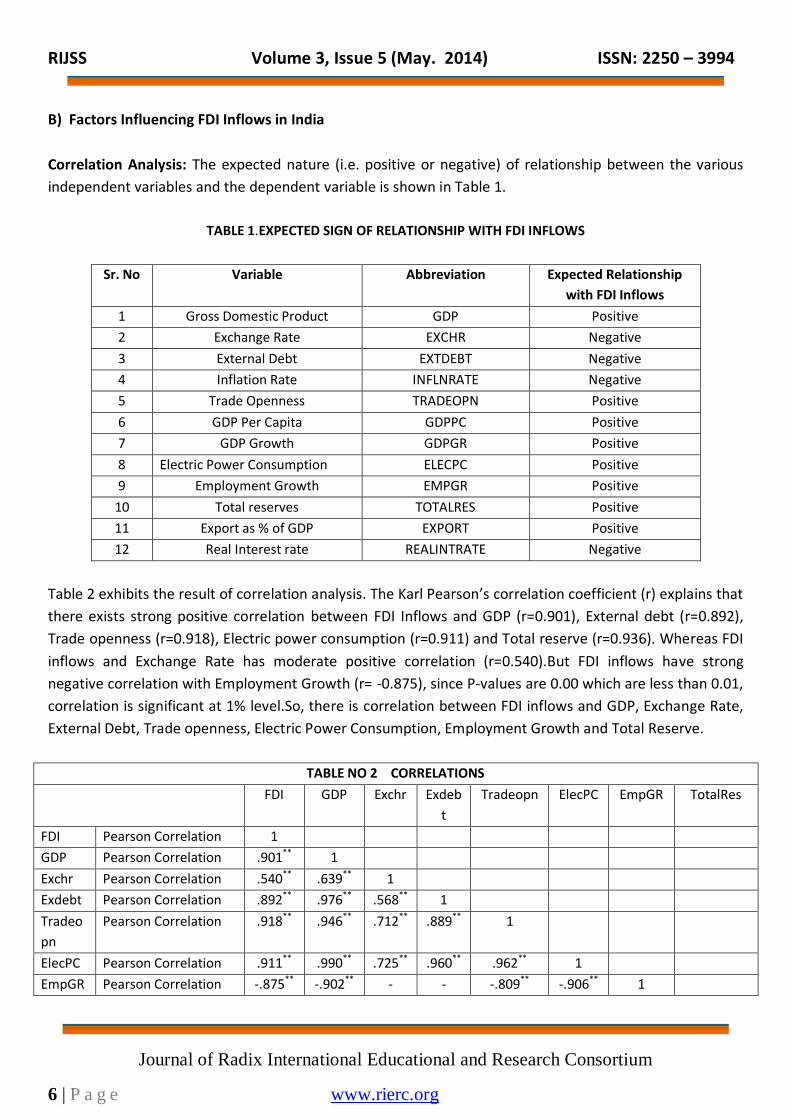
B) Factors Influencing FDI Inflows in India
Correlation Analysis: The expected nature (i.e. positive or negative) of relationship between the various
independent variables and the dependent variable is shown in Table 1.
TABLE 1.EXPECTED SIGN OF RELATIONSHIP WITH FDI INFLOWS
Sr. No Variable Abbreviation Expected Relationship
with FDI Inflows
1 Gross Domestic Product GDP Positive
2 Exchange Rate EXCHR Negative
3 External Debt EXTDEBT Negative
4 Inflation Rate INFLNRATE Negative
5 Trade Openness TRADEOPN Positive
6 GDP Per Capita GDPPC Positive
7 GDP Growth GDPGR Positive
8 Electric Power Consumption ELECPC Positive
9 Employment Growth EMPGR Positive
10 Total reserves TOTALRES Positive
11 Export as % of GDP EXPORT Positive
12 Real Interest rate REALINTRATE Negative
Table 2 exhibits the result of correlation analysis. The Karl Pearson’s correlation coefficient (r) explains that
there exists strong positive correlation between FDI Inflows and GDP (r=0.901), External debt (r=0.892),
Trade openness (r=0.918), Electric power consumption (r=0.911) and Total reserve (r=0.936). Whereas FDI
inflows and Exchange Rate has moderate positive correlation (r=0.540).But FDI inflows have strong
negative correlation with Employment Growth (r= -0.875), since P-values are 0.00 which are less than 0.01,
correlation is significant at 1% level.So, there is correlation between FDI inflows and GDP, Exchange Rate,
External Debt, Trade openness, Electric Power Consumption, Employment Growth and Total Reserve.
TABLE NO 2 CORRELATIONS
FDI GDP Exchr Exdeb
t
Tradeopn ElecPC EmpGR TotalRes
FDI Pearson Correlation 1
GDP Pearson Correlation .901** 1
Exchr Pearson Correlation .540** .639** 1
Exdebt Pearson Correlation .892** .976** .568** 1
Tradeo
pn
Pearson Correlation .918** .946** .712** .889** 1
ElecPC Pearson Correlation .911** .990** .725** .960** .962** 1
EmpGR Pearson Correlation -.875** -.902** - - -.809** -.906** 1
RIJSS Volume 3, Issue 5 (May. 2014) ISSN: 2250 – 3994
Journal of Radix International Educational and Research Consortium
7 | P a g e www.rierc.org
.607** .911**
TotalRe
s
Pearson Correlation .936** .972** .636** .924** .963** .971** -.863** 1
**. Correlation is significant at the 0.01 level (2-tailed).
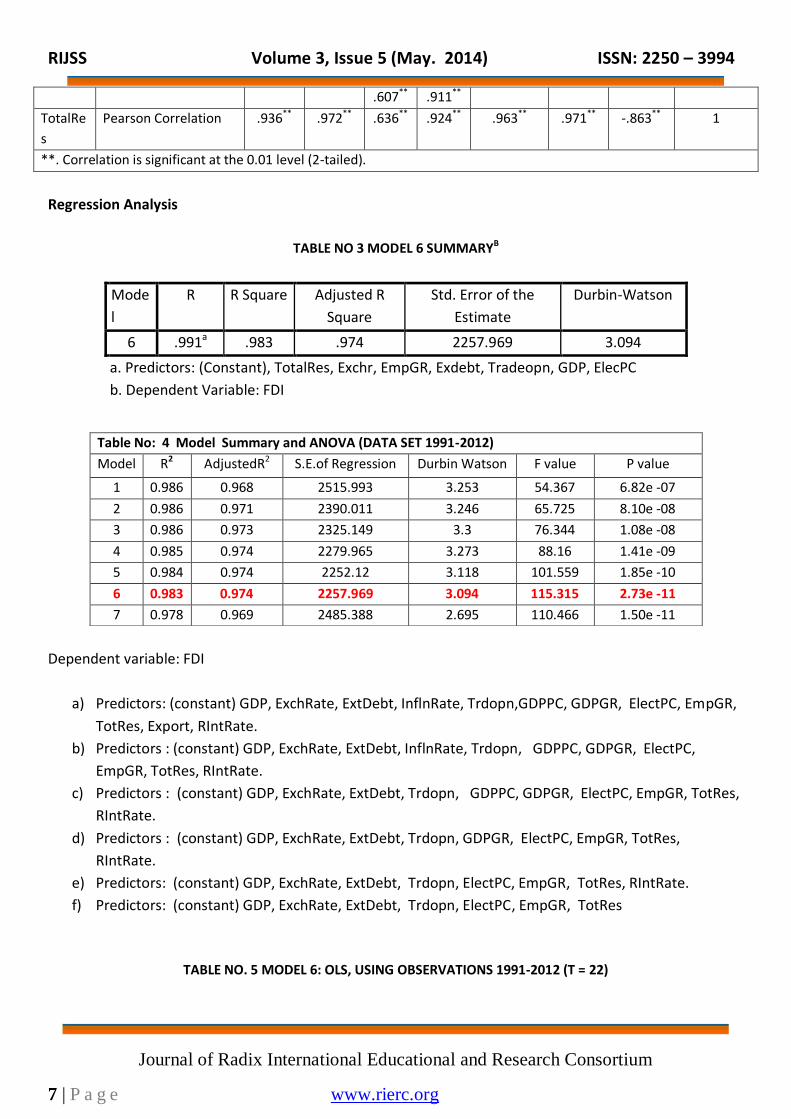
Regression Analysis
TABLE NO 3 MODEL 6 SUMMARYB
Mode
l
R R Square Adjusted R
Square
Std. Error of the
Estimate
Durbin-Watson
6 .991a .983 .974 2257.969 3.094
a. Predictors: (Constant), TotalRes, Exchr, EmpGR, Exdebt, Tradeopn, GDP, ElecPC
b. Dependent Variable: FDI
Dependent variable: FDI
a) Predictors: (constant) GDP, ExchRate, ExtDebt, InflnRate, Trdopn,GDPPC, GDPGR, ElectPC, EmpGR,
TotRes, Export, RIntRate.
b) Predictors : (constant) GDP, ExchRate, ExtDebt, InflnRate, Trdopn, GDPPC, GDPGR, ElectPC,
EmpGR, TotRes, RIntRate.
c) Predictors : (constant) GDP, ExchRate, ExtDebt, Trdopn, GDPPC, GDPGR, ElectPC, EmpGR, TotRes,
RIntRate.
d) Predictors : (constant) GDP, ExchRate, ExtDebt, Trdopn, GDPGR, ElectPC, EmpGR, TotRes,
RIntRate.
e) Predictors: (constant) GDP, ExchRate, ExtDebt, Trdopn, ElectPC, EmpGR, TotRes, RIntRate.
f) Predictors: (constant) GDP, ExchRate, ExtDebt, Trdopn, ElectPC, EmpGR, TotRes
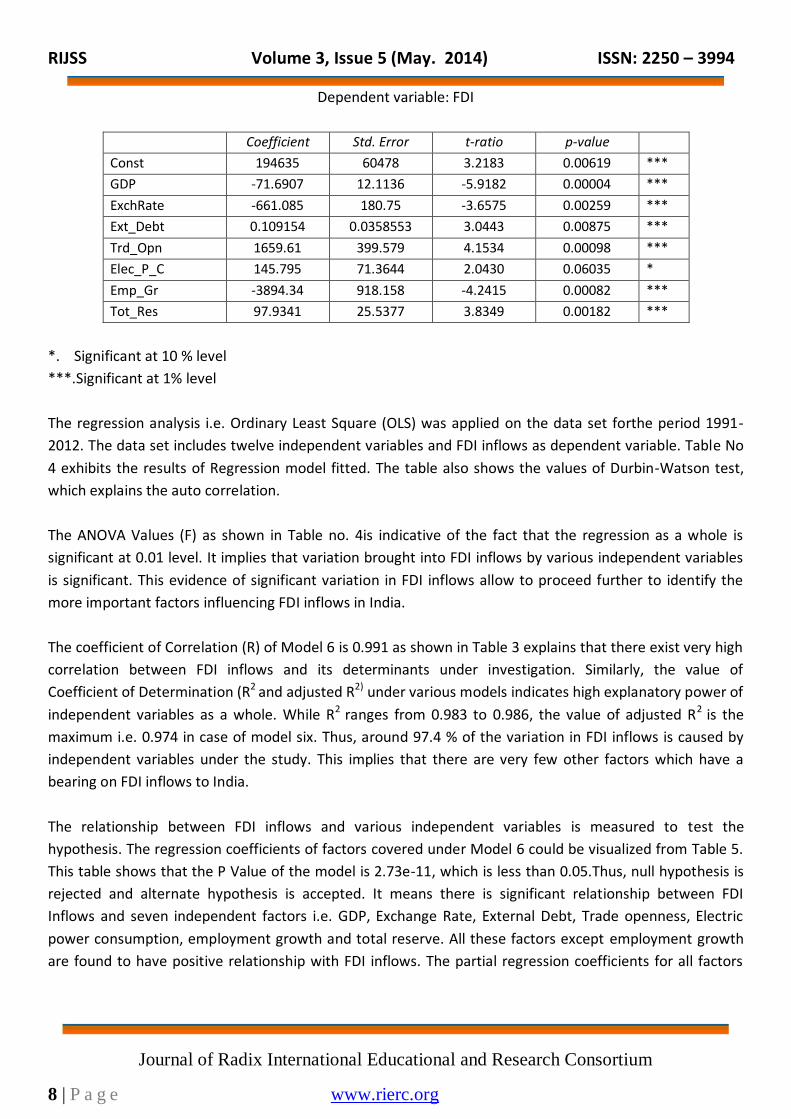
TABLE NO. 5 MODEL 6: OLS, USING OBSERVATIONS 1991-2012 (T = 22)
Table No: 4 Model Summary and ANOVA (DATA SET 1991-2012)
Model R2 AdjustedR2 S.E.of Regression Durbin Watson F value P value
1 0.986 0.968 2515.993 3.253 54.367 6.82e -07
2 0.986 0.971 2390.011 3.246 65.725 8.10e -08
3 0.986 0.973 2325.149 3.3 76.344 1.08e -08
4 0.985 0.974 2279.965 3.273 88.16 1.41e -09
5 0.984 0.974 2252.12 3.118 101.559 1.85e -10
6 0.983 0.974 2257.969 3.094 115.315 2.73e -11
7 0.978 0.969 2485.388 2.695 110.466 1.50e -11
RIJSS Volume 3, Issue 5 (May. 2014) ISSN: 2250 – 3994
Journal of Radix International Educational and Research Consortium
8 | P a g e www.rierc.org
Dependent variable: FDI
Coefficient Std. Error t-ratio p-value
Const 194635 60478 3.2183 0.00619 ***
GDP -71.6907 12.1136 -5.9182 0.00004 ***
ExchRate -661.085 180.75 -3.6575 0.00259 ***
Ext_Debt 0.109154 0.0358553 3.0443 0.00875 ***
Trd_Opn 1659.61 399.579 4.1534 0.00098 ***
Elec_P_C 145.795 71.3644 2.0430 0.06035 *
Emp_Gr -3894.34 918.158 -4.2415 0.00082 ***
Tot_Res 97.9341 25.5377 3.8349 0.00182 ***
*. Significant at 10 % level
***.Significant at 1% level
The regression analysis i.e. Ordinary Least Square (OLS) was applied on the data set forthe period 1991-
2012. The data set includes twelve independent variables and FDI inflows as dependent variable. Table No
4 exhibits the results of Regression model fitted. The table also shows the values of Durbin-Watson test,
which explains the auto correlation.
The ANOVA Values (F) as shown in Table no. 4is indicative of the fact that the regression as a whole is
significant at 0.01 level. It implies that variation brought into FDI inflows by various independent variables
is significant. This evidence of significant variation in FDI inflows allow to proceed further to identify the
more important factors influencing FDI inflows in India.
The coefficient of Correlation (R) of Model 6 is 0.991 as shown in Table 3 explains that there exist very high
correlation between FDI inflows and its determinants under investigation. Similarly, the value of
Coefficient of Determination (R2 and adjusted R2) under various models indicates high explanatory power of
independent variables as a whole. While R2 ranges from 0.983 to 0.986, the value of adjusted R2 is the
maximum i.e. 0.974 in case of model six. Thus, around 97.4 % of the variation in FDI inflows is caused by
independent variables under the study. This implies that there are very few other factors which have a
bearing on FDI inflows to India.
The relationship between FDI inflows and various independent variables is measured to test the
hypothesis. The regression coefficients of factors covered under Model 6 could be visualized from Table 5.
This table shows that the P Value of the model is 2.73e-11, which is less than 0.05.Thus, null hypothesis is
rejected and alternate hypothesis is accepted. It means there is significant relationship between FDI
Inflows and seven independent factors i.e. GDP, Exchange Rate, External Debt, Trade openness, Electric
power consumption, employment growth and total reserve. All these factors except employment growth
are found to have positive relationship with FDI inflows. The partial regression coefficients for all factors

RIJSS Volume 3, Issue 5 (May. 2014) ISSN: 2250 – 3994
Journal of Radix International Educational and Research Consortium
9 | P a g e www.rierc.org
are significant at 1%level of significance where as only one factor i.e. electric power consumption is
significant at 10% level.
CONCLUSION
FDI has been emerged as an important resource for the economic development of developing nations.
Increase in FDI inflows of these countries has grabbed the attention of the world. Though many
researchers have identified the factors influencing the FDI inflows, but these determinants of inward FDI
vary from study to study, period to period and from country to country. This study on the factor
determinants of FDI flows in India has brought out the findings that the relationship between FDI inflows
and factors such as GDP, Trade openness, Total Reserves and Electric Power Consumption is positive as
expected, but the relationship between FDI inflows and Exchange Rate, External Debt is inverse and
positive and the relationship between FDI inflows and Employment Growth is inverse and negative. The
explanatory power of the model as a whole is of very high level and seven independent factors i.e. GDP,
Exchange rate, External debt, Trade openness (i.e. Import and Export as % of GDP) Electric Power
Consumption per capita, Employment Growth and Total Reserves stood as significant determinants of FDI
inflows in India.
REFERENCES
Addison, T. & Heshmati, A. (2003). The New Global Determinants of FDI inflows to Developing
Countries: The Importance of ICT and Democratization. WIDER, Working Paper No 2003/45.
Asiedu, E. (2002), On the Determinants of Foreign Direct Investment to Developing Countries: Is Africa
Different? World Development, 30 (1), 107-119.
Asiedu, E. (2006), Foreign Direct Investment in Africa: The Role of Natural Resources, Market Size,
Government Policy, Institutions and Political Stability. World Economy, 29 (1), 63-77.
Bala subramanyam, V.N., Salisu, M. & Sapsford, D., (1996) Foreign Direct Investment and Growth
in EP and IS countries. Economic Journal, 92-105.
Basakaran, K,(2012), The FDI permit for multi brand retail trading in India-green signal or red signal.
Business Intelligence Journal, 5(1), 176-186.
Bende-Nabende, A.(2002), Foreign Direct Investment Determinants in Sub-Saharan Africa: A Co-
Integration Analysis. Economics Bulletin, 6 (4), 1-19.
Bhati,U. (2006), Foreign Direct Investment - Contemporary Issues. Deep and Deep Publications Pvt.
Ltd, New Delhi.
Chakraborty, C., & Basu, P., (2002), Foreign Direct Investment and Economic Growth in India- A Co-
integration approach. Applied Economics, 34, 1061-1073.
Culem, C.G. (1998), The Locational Determinants of Direct Foreign Investment Among Industrialised
Countries. European Economic Review, 885-890
Dunning, J.H. (1988), The Eclectic Paradigm of International Production: A Restatement andSome
Possible Extentions”, Journal of International Business Studies, 19,1-52.
Fedderke, J. W.,& Romm, A. T., (2006), Growth Impact of Foreign Direct Investment into South Africa,
RIJSS Volume 3, Issue 5 (May. 2014) ISSN: 2250 – 3994
Journal of Radix International Educational and Research Consortium
10 | P a g e www.rierc.org
1956-2003. Economic Modelling, 23 (5), 738-60.
Gopalan, S. & Rajan R, S., (2010), India's FDI flows: Trying to make sense of The numbers. Alerts on
Emerging Policy Challenges, 5, 1-8.
Head, K., Mayer, T., & Ries, J, (2002), Revisiting Oligopolistic Reaction: Are FDI Decisions Strategic
Complements? 1-24.
Hooda, S., (2011), A study of FDI and Indian Economy. Ph.D. Thesis, National Institute of Technology,
Kurukshetra.
Johansen, S. & Juselius, K. (1990), Maximum Likelihood Estimation and Inference On Co integration
With Application to The Demand for Money. Oxford Bulletin of Economics and Statistics, 52, 169-210.
Karmali, D. (2013), Long Term Linkages between FDI Inflows and Macro Economic Variables – A Case
for India, Golden Research Thoughts, 3(4), 1-5.
Khachoo, A.Q., & Khan, M. I., (2012), Determinants of FDI inflows to Developing Countries: A Panel
Data Analysis. MPRA, No 37278.
Kok, R, &Ersoy, B. A. (2011), Analysis of FDI Determinants in developing countries. Emerald, Emerging
Market Case Studies.
Krugell, W., (2005), The Determinants of Foreign Direct Investment in Africa, in: Gilroy, B., Gries, T. and
Naude, W., Multinational Enterprises, Foreign Direct Investment and Growth in Africa: South African
Perspectives, Physica Verlag GmbH & Co, Berlin.
Lemi, A., &Asefa. S. (2003), Foreign Direct Investment and Uncertainty: Empirical Evidence from
Africa. African Finance Journal, 5 (1), 36-67.
Love, J. H. &Lage-Hidalgo, F. (2000), Analysing the Determinants of US Direct Investment in Mexico.
Applied Economics, 32, 1259-1267.
Moore, M.O. (1993), Determinants of German Manufacturing Direct Investment: 1980-1988",
Weltwirtschaftsliches Archiv, 129, 120-137.
Moreira, S.B. (2009), Determinants of Foreign Direct Investment: what is evidence For Africa?,
UNISUL, Tubarão, 2,(1), 83 – 104.
Mottleb, K.A. & Kalirajan, K., (2010), Determinants of Foreign Direct Investment in Developing
Countries: A comparative Analysis. Journal of Applied Economic Research,4(4), 369-404.
Naeem, K., Ijaz, & Azam M., (2005), Determinants of Foreign Direct Investment in Pakistan (1970-
2000): An Econometrics Approach. Sarhad Journal of Agriculture, 21(4), 761-764.
Odenthal, I., (2001), Foreign Direct Investment in Sub-Saharan Africa. OECD Development Centre,
Working Paper No 173.
Pigato, M., (2001), The Foreign Direct Investment Environment in Africa. Africa Region Working Paper
Series No. 15, The World Bank.
Quazi, R.,& Mahmud, M. (2004), Determinants of Foreign Direct Investment in South Asia. College of
Business Prarie View, A & M University Prarie View, Texas.
Sahni, P., (2012), Trends and Determinants of Foreign Direct Investment in India: An Empirical
Investigation. International Journal of Marketing and Technology,2(8).
Saleem, F., Zahid, A., Shoaib B., Mahmood M., & Nayab S., (2013), Impact of Inflation and Economic
Growth on Foreign Direct Investment: Evidence from Pakistan. Paper downloaded.
RIJSS Volume 3, Issue 5 (May. 2014) ISSN: 2250 – 3994
Journal of Radix International Educational and Research Consortium
11 | P a g e www.rierc.org
Shumaila, N., Nadia, S.,& Sami U., (2012), Impact of Capital Inflows on Domestic Inflation: A Case
Study of Pakistan. Journal of Asian Development Studies, 1(1).
Shylajan, C. S., (2011), FDI and its determinants in India, Paper downloaded.
Sing hania, M., & Gupta, A., (2011), Determinants of foreign direct investment in India. Journal of
International Trade Law and Policy, 10(1), 64 – 82.
Sisili,T.& Elango., (2013), FDI and its Determinants of India. International Journal of Scientific &
Engineering Research, 4(1).
Tsai, P. (1994), Determinants of Foreign Direct Investment and Its Impact on Economic Growth.
Journal of Economic Development, 19, 137-161.
Wang, G. M., (2009), Manufacturing, FDI and Economic Growth - Evidence from Asian Economies.
Applied Economics, 41(8), e- Publications Marquette, Marquette University.
Yang, J.Y., Groenewold, N., & Tcha, M. (2000), The Determinants of Foreign Direct Investment in
Australia. The Economic Record, 76(232), 45-54.
Yasin, M., (2005), Official Development Assistance and Foreign Direct Investment Flows to Sub-Sahara
Africa. African Development Review, 17 (1), 23-40.
GLOSSARY
Foreign Direct Investment (FDI): FDI have been taken as inflows of foreign capital. It is the sum of
Equity capital, reinvested earnings, and other long-term and short term capital. The figure of the FDI
are in current US $ and collected from various issues of World Investment Report.
Gross Domestic Product (GDP): GDP is the measure of all final goods and Services produced
domestically in a given year. Data are in current U.S. dollars and collected from World Bank’s World
Development Indicators (WDI).
Inflation Rate: Inflation as measured by the consumer price index. The data is in form of annual
percentage and data are collected from World Bank’s World Development Indicators.
External debt: Total external debt is debt owed to non residents repayable in currency, goods, or
services. Data are in current U.S. dollars and collected from World Bank’s WDI.
Exchange rate: Official exchange rate refers to the exchange rate determined by national authorities. It
is calculated as an annual average and data is collected from World Bank’s WDI.
Trade Openness: Trade openness is computed as ratio of Imports and Exports of goods and service to
GDP. The data is in form of percentage and is taken from World Bank’s WDI.
Exports of goods and services (% of GDP) :Exports of goods and services represent the value of all
goods and other market services provided to the rest of the world. The data are in form of percentage
and is taken from World Bank’s World Development Indicators.
GDP per capita (current US$) : GDP per capita is gross domestic product divided by midyear
population. Data are in current U.S. dollars and is taken from World Bank’s WDI.
GDP growth (annual): The data is in form of percentage and taken from World Bank’s WDI.
RIJSS Volume 3, Issue 5 (May. 2014) ISSN: 2250 – 3994
Journal of Radix International Educational and Research Consortium
12 | P a g e www.rierc.org
Electric power consumption: It measures the production of power plants and combined heat and
power plants less transmission, distribution, and transformation losses and own use by heat and power
plants. The data is in form of KWH per capita and taken from World Bank’s WDI.
Total reserves: It comprise of holdings of monetary gold, special drawing rights, reserves of IMF
members held by the IMF and holdings of foreign exchange under the control of monetary authorities.
Data are in current U.S. dollars and is taken from World Bank’s WDI.
Employment Growth: Employment to population ratio is the proportion of a country's population that
is employed. Ages 15 and older are generally considered the working-age population. The data are in
form of percentage and is taken from World Bank’s WDI.
Real interest rate (%): Real interest rate is the lending interest rate adjusted for inflation as measured
by GDP deflator. The data is in form of percentage and taken from World Bank’s WDI.