Embed Size (px)
Citation preview

Practical Considerations on Simulations for
Adaptive Dose- Escalation and Dose-
Ranging Trials
Alun Bedding, Roche
in collaboration with: Inna Perevozskaya, GSK, Vladimir Dragalin, Janssen, Parvin Fardipour, ICON

Members (in alphabetical order):
• Alun Bedding, Roche
• Vladimir Dragalin, Janssen R&D
• Parvin Fardipour, ICON
• Alan Hartford, AbbVie
• Sergei Leonov, ICON
• Cristiana Mayer (Co-lead), Janssen R&D
• Inna Perevozskaya (Co-lead), GSK
• Yili Pritchett, MedImmune
• Annie Lin, (FDA CBER)
• Jessica Hu, (FDA CBER)
• Jingjing Ye, FDA CDER
DIA Scientific Working Group on Adaptive Designs, Simulation Report work-stream
Acknowledgement: Based on work of

Overview of dose-escalation and dose-ranging trials
General framework of the simulation report
Dose escalation
Dose ranging
Summary and discussion

Dose-escalation and dose-ranging studies
• Typically done in exploratory development phase (i.e. Phase 1, Phase 2)
• Primary objective: to study multiple doses and find “optimal” dose
– Specific meaning of “optimal” depends on study objectives:
• with respect to safety: maximum tolerated dose (MTD)
• with respect to efficacy:
– dose delivering maximum or close to max. effect (e.g. ED75, ED90)
– minimally effective dose (MED)
• with respect to both: “safe” and “effective” dose
– Specific requirements for ”safe” and “effective” can be quantified
based on clinical /commercial objectives
• Additional objectives may include characterizing entire dose-response,
dose-toxicity, exposure-response curves
Overview

Dose-escalation (D-E) and dose-ranging (D-R)
studies
Similarity
– Multiple doses studied within one trial
– “Learn” phase of development
– Attempt to characterize relationship between endpoint of interest and dose
Difference:
• D-E studies :
– focused on tolerability or PK/PD endpoints
– First-in-Humans (FIH) trials
– Typically sequential, movement within dose range restricted
• D-R studies:
– focused on efficacy
– done in patients, FIH info usually available to guide design
– multiple doses can be studied in-parallel
– movement within dose-range not restricted
Both DE and DR study designs rely on modeling and simulation heavily, but methodology is different
=> simulation reports differ as well
Similarities and Difference

Overview of dose-escalation and dose-ranging trials
General framework of the simulation report
Dose escalation
Dose ranging
Summary and discussion

Key elements of simulation report for an
adaptive study General template (abbreviated)
• Introduction
• Simulation Inputs:
– benchmark (standard) design
– proposed adaptive design(s) and their variants (if any)
– clinical response scenarios
– performance metrics to include in operating characteristics
• Simulation Results
• Summary and recommendations
• References
• Appendix

Overview of dose-escalation and dose-ranging trials
General framework of the simulation report
Dose escalation
Dose ranging
Summary and discussion

Content of simulation report for dose-escalation
trial
• These studies are typically First-in-Human ( FIH) studies of the new treatment
• Because of FIH nature, the core objectives of dose escalation studies are centered around safety and
tolerability
– If early signal of efficacy is assessed, it usually plays a secondary role
• Learning about dose-toxicity relationship inevitably leads to some toxicity being observed
• Core objective of a dose-escalation trial is to protect safety of the subjects while accomplishing this learning
in most efficient way possible
• The balance between learning and protection is implemented via restrictions on how aggressive the dose-
escalation scheme can be:
• This depends on:
– Patient population (patients vs. healthy volunteers)
– Severity of disease (oncology vs. other diseases)
– How much we want to learn: MTD only or entire curve (e.g. dose exposure)
Objectives of the trial are not varied through simulation, but its important to discuss it in simulation report with
sufficient detail so that the rationale for methodology approach and selected design is clear
Introduction: focused on trial objectives and rationale for selected design candidates

Simulation Input for DE studies Description of “standard” and adaptive designs
– All D-E are adaptive, by definition
– “Standard” design, to be used as benchmark for performance
• 3+3 design (oncology)
• Similar “algorithmic” or cross-over or balanced incomplete block designs
(in other TA)
– Proposed adaptive design(s) and their variants (if any)
• Rule-based methods
– mTPI (Ji and Wang , 2013)
– Up-n-Down design (Gezmu and Flournoy, 2006)
• Model–fitting methods
– mCRM (Braun et al 2002)
– BNLRM Neuenschwander et al. (2008)
• Non-oncology: Bayesian design for PK/PD models (Whitehead et al. 2001)
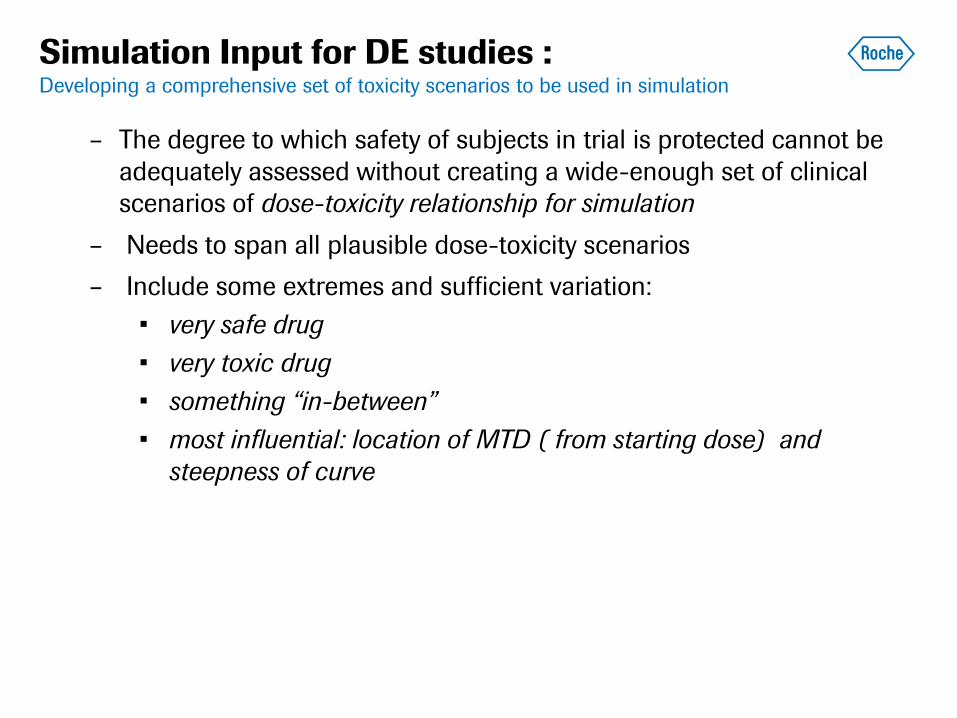
Simulation Input for DE studies : Developing a comprehensive set of toxicity scenarios to be used in simulation
– The degree to which safety of subjects in trial is protected cannot be
adequately assessed without creating a wide-enough set of clinical
scenarios of dose-toxicity relationship for simulation
– Needs to span all plausible dose-toxicity scenarios
– Include some extremes and sufficient variation:
• very safe drug
• very toxic drug
• something “in-between”
• most influential: location of MTD ( from starting dose) and
steepness of curve

Courtesy: R. Bugarini ; EI is equivalence Interval i.e. target toxicity range which was chosen to be [20-30] in this study
Example1 : set of clinical scenarios for dose-
toxicity Non-parametric (explicit) curves specification

Tox./Shape SLOW ascending curve
(Scenarios 1,2,3)
SHARPLY ascending curve
( Scenarios 4,5,6)
Early toxicity onset
(Sc. 1 &4)
Mid toxicity onset
(Sc. 2 & 5)
Late toxicity onset
(Sc. 3 & 6)
Ref: Perevozskaya, Han, Pierce (2014)
Example 2: set of clinical scenarios for dose-
toxicity Parametric (model-based) specification; check against design working model

Simulation Output for DE studies Operating characteristics to report
• Competing designs tested across multiple clinical scenarios
• Two types of metrics are commonly reported:
– dose-based characteristics
– scalar characteristics (arrange in a ”matrix”: design*scenario)
Metric Comment:
Probability of each dose being picked as MTD dose-based, best reported as histogram
Interval Probability of choosing MTD:
● Correctly
● Underestimating
● Overestimating
● Not able (all doses too toxic)
Characterizes whether the trial meets its primary
objective of determining MTD accurately to be
further tested in Ph2 trials. The target range of DLT is
typically 18-33% but this can vary
Mean (SD) of toxicity response at each dose Assess the accuracy of the dose-toxicity estimation
(and model fit, if model is used).
Sample Size Scalar
Duration of the study Scalar
Overall toxicities (number/proportion) Scalar
Number of overdosed patients Scalar; to track number of overdoses even if no DLT
has occurred

Overview of dose-escalation and dose-ranging trials
General framework of the simulation report
Dose escalation
Dose ranging
Summary and discussion

*Dragalin et al. (2010)
Content of simulation report for dose-ranging
trials Introduction: trial objectives
• Generally, these studies follow after FIH in exploratory development
• any dose below MTD (from FIH) can be studied
• Consequently, focus shifts from tolerability to evaluation of effect of dose on efficacy
• Sometimes safety is also added as a formal objective driving the design, but more
commonly, it’s just monitored
• Key objectives of D-R study can be*:
1. Detecting DR (Proof-of-Concept)
2. Identifying clinical relevance of effect
3. Selecting a target dose for Ph3
4. Estimating the dose response

Content of simulation report for dose-ranging
trials Description of “standard” and adaptive designs
• Traditionally, fixed allocation design is used in this space
– Patients allocated to a few selected doses and control in fixed proportions
– decisions about the best doses are made at the end of the study
• pair-wise comparisons to a control (usually placebo)
• model-based decisions can be added to fixed design
• Adaptive designs (key elements) :
– type of adaptation decisions (drop/add doses; change allocation; early stopping)
– what “ drives” decisions: model (e.g. Emax) or pairwise-comparisons or both (e.g.
MCPMod)
– For Bayesian designs, specify prior and provide rationale:
• Informative prior to incorporate external data, e.g. historical control
• Non-informative prior: to provide a starting point for continuous learning
framework
– Longitudinal model (if used) to impute long-term endpoints for interim analysis
*Discussed in more detail in context of type 1 error control
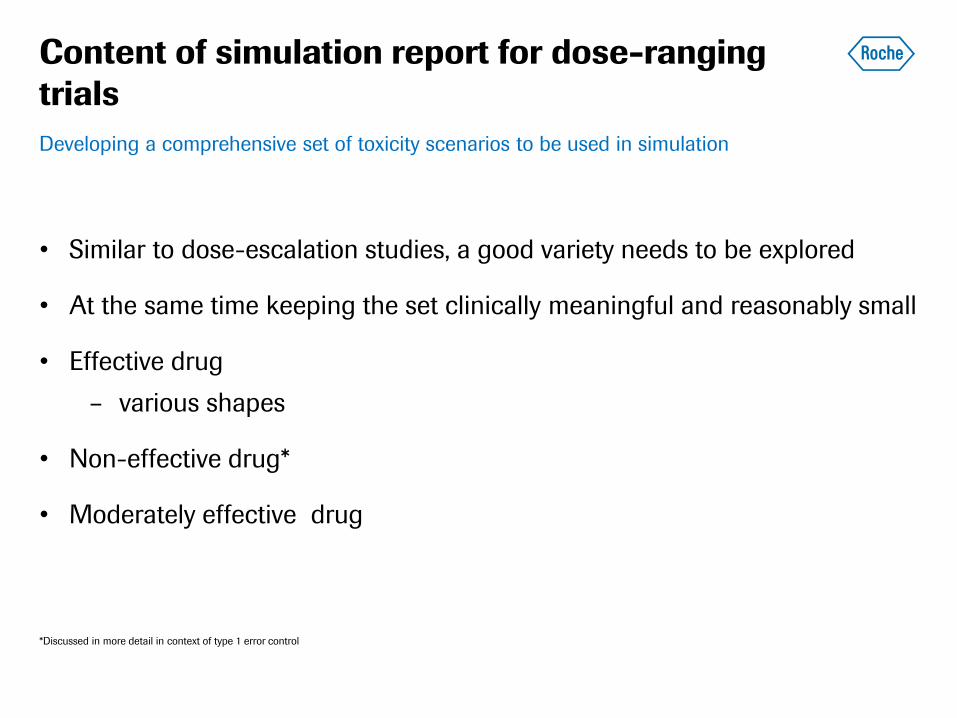
Content of simulation report for dose-ranging
trials
Developing a comprehensive set of toxicity scenarios to be used in simulation
• Similar to dose-escalation studies, a good variety needs to be explored
• At the same time keeping the set clinically meaningful and reasonably small
• Effective drug
– various shapes
• Non-effective drug*
• Moderately effective drug

Example 3: set of dose-response clinical
scenarios Ref: Dragalin et al (2010)
. Dragalin et al. “A simulation study to compare new adaptive dose ranging designs “ Statistics in Biopharmaceutical Research Vol. 2 , Iss. 4,2010

Simulation Output for DR studies
• Two different groups of charts/graphs are useful:
1. Particular metric across design×scenario combinations:
• allows different design’s performance to be compared across scenarios
• helps in design elimination process
2. Several metrics combined for a particular design×scenario combination:
• allows in-depth look into design performance
• more useful at the final design selection stage to verify desired properties
• Trial-level and subject-level charts:
– very useful during design discussion phases or to answer questions
– rarely used in simulation reports due to high level of detail
Key metrics to report
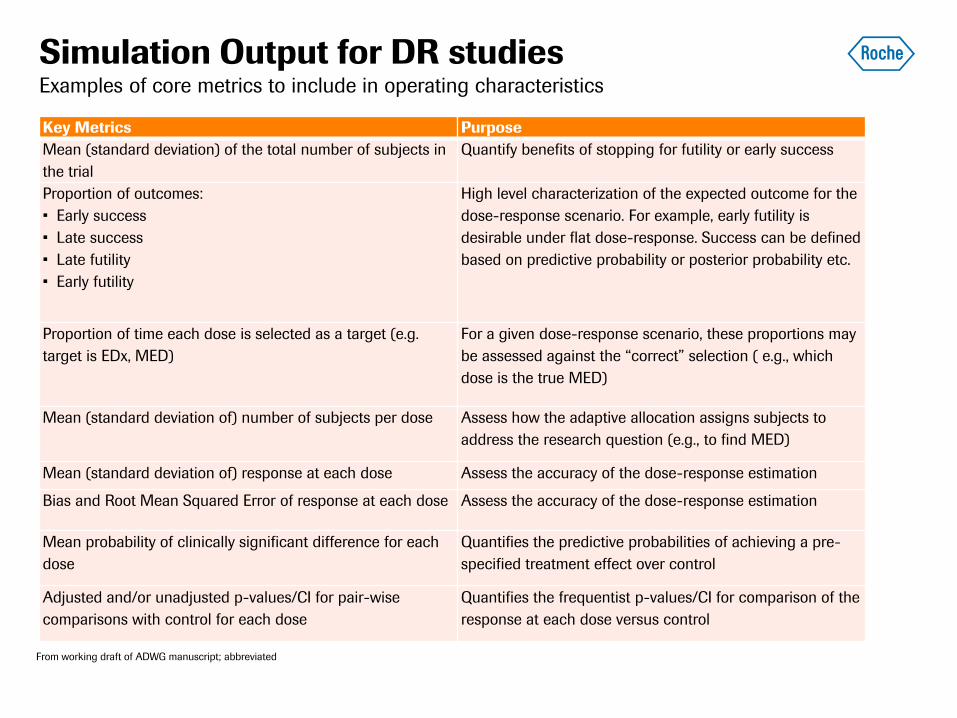
Simulation Output for DR studies
Key Metrics Purpose
Mean (standard deviation) of the total number of subjects in
the trial
Quantify benefits of stopping for futility or early success
Proportion of outcomes:
• Early success
• Late success
• Late futility
• Early futility
High level characterization of the expected outcome for the
dose-response scenario. For example, early futility is
desirable under flat dose-response. Success can be defined
based on predictive probability or posterior probability etc.
Proportion of time each dose is selected as a target (e.g.
target is EDx, MED)
For a given dose-response scenario, these proportions may
be assessed against the “correct” selection ( e.g., which
dose is the true MED)
Mean (standard deviation of) number of subjects per dose Assess how the adaptive allocation assigns subjects to
address the research question (e.g., to find MED)
Mean (standard deviation of) response at each dose Assess the accuracy of the dose-response estimation
Bias and Root Mean Squared Error of response at each dose Assess the accuracy of the dose-response estimation
Mean probability of clinically significant difference for each
dose
Quantifies the predictive probabilities of achieving a pre-
specified treatment effect over control
Adjusted and/or unadjusted p-values/CI for pair-wise
comparisons with control for each dose
Quantifies the frequentist p-values/CI for comparison of the
response at each dose versus control
Examples of core metrics to include in operating characteristics
From working draft of ADWG manuscript; abbreviated

Overview of dose-escalation and dose-ranging trials
General framework of the simulation report
Dose escalation
Dose ranging
Summary and discussion

Summary
• Adaptive Design (AD) simulation plays increasingly important role in modern drug development
– As a result, simulation report becomes a key design justification document and as such, a regulatory
document
• The work presented today is based on joint effort of several industry experts attempting to come up with best
practices in planning an AD simulation and documenting it via simulation report
• We have focused on 2 types of AD:
– AD for dose-escalation studies
– AD for dose-ranging studies
• Both have multiple doses and frequently include modeling
• The key objectives of DE and DR designs are focused on tolerability and efficacy, respectively
• Consequently, the key metrics reported in sim. report for these 2 designs are different:
– Percentage of studies identifying MTD correctly is the focus of dose-escalation
– Percentage of studies making “correct” efficacy decision (POC, dose-selection, DR estimation) is the
focus of the dose-ranging studies
• In addition to key metrics, both types of design require examination of allocation pattern, overall sample size
and protecting trial subject’s safety
– In dose-escalation studies, the latter is quantified more formally by summarizing percentages of
overdosed subjects/toxicities occurring in process of learning about MTD

References
• Ji Y, Wang SJ; Modified Toxicity Probability Interval Design: A Safer and More Reliable Method Than the 3 + 3 Design for Practical Phase I Trials. Journal of Clinical Oncology May 10, 2013 Vol. 31 no 14 1785-1791
• M. Gezmu, N. Flournoy. Group up-and-down designs for dose-finding. Journal of Statistical Planning and Inference 136 (2006) 1749 – 1764
• Braun TM. The bivariate continual reassessment method: extending the CRM to phase I trials of two competing outcomes. Controlled Clinical Trials 2002; 23:240 – 256.
• Neuenschwander B, Branson M, Gsponer T. Critical aspects of the Bayesian approach to phase I cancer trials. Statistics in Medicine 2008; 27: 2420-2439)
• Whitehead J. Y. Zhou S. Patterson. Easy-to-implement Bayesian methods for dose-escalation studies in healthy subjects. Biostatistics. 2001; 2:47-61.
• Whitehead J. Y. Zhou S. Patterson. Easy-to-implement Bayesian methods for dose-escalation studies in healthy subjects. Biostatistics. 2001; 2:47-61.
• Whitehead J. Y. Zhou S. Patterson. Easy-to-implement Bayesian methods for dose-escalation studies in healthy subjects. Biostatistics. 2001; 2:47-61.
• Dragalin et al. “A simulation study to compare new adaptive dose ranging designs “ Statistics in Biopharmaceutical Research Vol. 2 , Iss. 4,2010
• I. Perevozskaya, L. Han, K. Pierce (2014). “Continual Reassessment Method for a First-In-Human Trial: From Design to Trial Implementation”, Chapter 19 In: Practical Considerations for Adaptive Trial Design and Implementation, Springer, New York 2014

Doing now what patients need next