Embed Size (px)
Citation preview

PPL Corporation 2009 Annual Report

About the CompanyPPL Corporation, headquartered in Allentown, Pa., owns or controls nearly 12,000 megawatts of generating capacity in the United States, sells energy in key U.S. markets and delivers electricity to about 4 million customers in Pennsylvania and the United Kingdom. More information is available at www.pplweb.com.
On the coverThe Holtwood hydroelectric plant has been part of the fabric of life in southern Lancaster County, Pa., since the facility began producing clean, renewable energy in 1910. A century later, PPL has begun construction on two state-of-the-art hydroelectric turbines that will more than double the plant’s output, providing enough renewable electricity for about 100,000 homes.
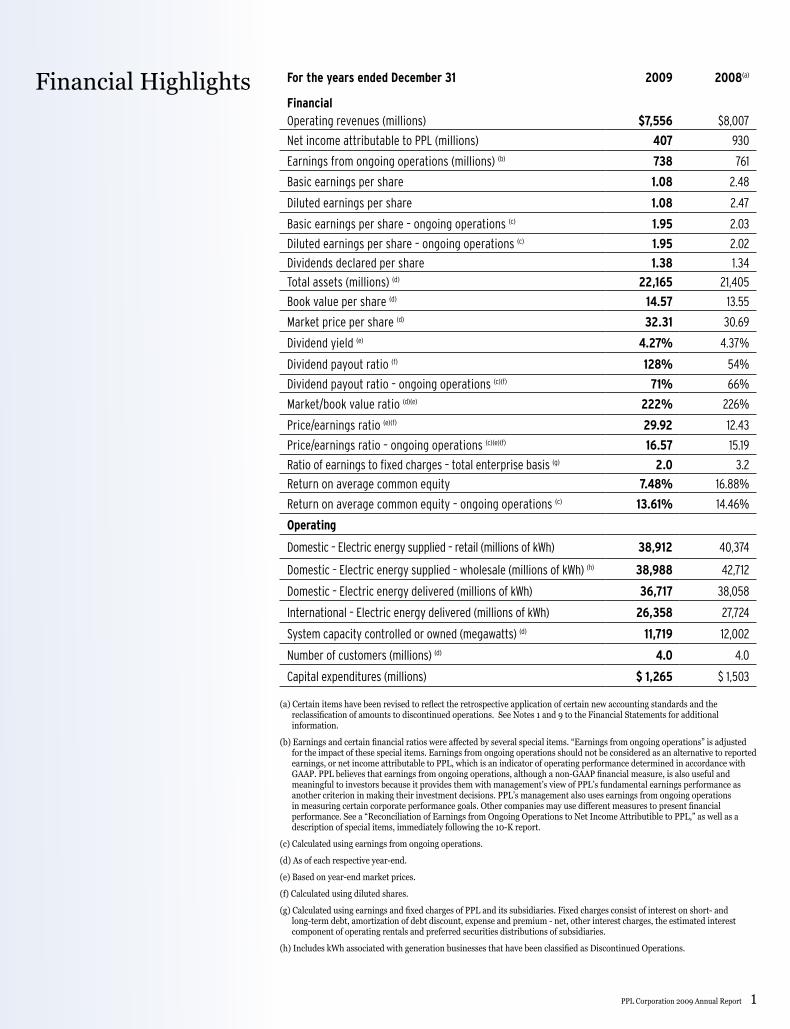
Financial Highlights For the years ended December 31 2009 2008(a)
FinancialOperating revenues (millions) $7,556 $8,007
Net income attributable to PPL (millions) 407 930
Earnings from ongoing operations (millions) (b) 738 761
Basic earnings per share 1.08 2.48
Diluted earnings per share 1.08 2.47
Basic earnings per share – ongoing operations (c) 1.95 2.03
Diluted earnings per share – ongoing operations (c) 1.95 2.02
Dividends declared per share 1.38 1.34
Total assets (millions) (d) 22,165 21,405
Book value per share (d) 14.57 13.55
Market price per share (d) 32.31 30.69
Dividend yield (e) 4.27% 4.37%
Dividend payout ratio (f) 128% 54%
Dividend payout ratio – ongoing operations (c)(f) 71% 66%
Market/book value ratio (d)(e) 222% 226%
Price/earnings ratio (e)(f) 29.92 12.43
Price/earnings ratio – ongoing operations (c)(e)(f) 16.57 15.19
Ratio of earnings to fixed charges – total enterprise basis (g) 2.0 3.2
Return on average common equity 7.48% 16.88%
Return on average common equity – ongoing operations (c) 13.61% 14.46%
Operating
Domestic – Electric energy supplied – retail (millions of kWh) 38,912 40,374
Domestic – Electric energy supplied – wholesale (millions of kWh) (h) 38,988 42,712
Domestic – Electric energy delivered (millions of kWh) 36,717 38,058
International – Electric energy delivered (millions of kWh) 26,358 27,724
System capacity controlled or owned (megawatts) (d) 11,719 12,002
Number of customers (millions) (d) 4.0 4.0
Capital expenditures (millions) $ 1,265 $ 1,503
(a) Certain items have been revised to reflect the retrospective application of certain new accounting standards and the reclassification of amounts to discontinued operations. See Notes 1 and 9 to the Financial Statements for additional information.
(b) Earnings and certain financial ratios were affected by several special items. “Earnings from ongoing operations” is adjusted for the impact of these special items. Earnings from ongoing operations should not be considered as an alternative to reported earnings, or net income attributable to PPL, which is an indicator of operating performance determined in accordance with GAAP. PPL believes that earnings from ongoing operations, although a non-GAAP financial measure, is also useful and meaningful to investors because it provides them with management’s view of PPL’s fundamental earnings performance as another criterion in making their investment decisions. PPL’s management also uses earnings from ongoing operations in measuring certain corporate performance goals. Other companies may use different measures to present financial performance. See a “Reconciliation of Earnings from Ongoing Operations to Net Income Attributible to PPL,” as well as a description of special items, immediately following the 10-K report.
(c) Calculated using earnings from ongoing operations.
(d) As of each respective year-end.
(e) Based on year-end market prices.
(f) Calculated using diluted shares.
(g) Calculated using earnings and fixed charges of PPL and its subsidiaries. Fixed charges consist of interest on short- and long-term debt, amortization of debt discount, expense and premium - net, other interest charges, the estimated interest component of operating rentals and preferred securities distributions of subsidiaries.
(h) Includes kWh associated with generation businesses that have been classified as Discontinued Operations.
PPL Corporation 2009 Annual Report 1

Chairman’s Letter Dear Shareowners,
When my structural engineering colleagues are designing a facility, they concentrate on essential forces to ensure that it will be stable and sound for an extended period of time. They intensely examine factors such as tension, compression and shear. As a result, the best-designed structures are able to withstand hurricanes, fires and even earthquakes.
Similarly, a company’s business model must be designed to deliver value for shareowners whether it is being stressed by financial, macro-economic and market uncertainty or it is humming along in relatively predictable, prosperous times.
I know I don’t have to tell you that our business model, along with those of all companies in our sector, has
been subjected to unprecedented stresses over the past couple of years.
What did we find out?We found that our business
model – a mix of high-performing electricity generating, marketing and delivery companies built on a strong foundation of excellent assets and extraordinary people – was able to withstand the ravages of what may have been the worst market and financial conditions in the history of our industry.
Based on the experience and hard work of PPL employees in the U.S. and the U.K., we delivered 2009 earnings from ongoing operations of $1.95 per share, exceeding our forecast for the year. While this is slightly lower than our ongoing earnings in 2008, it is 11 percent
2 PPL Corporation 2009 Annual Report
James H. MillerChairman, Presidentand Chief Executive Officer
Susquehanna and Brunner Island power plants as well as at our Montana hydroelectric dams.
• A transition to a competitive electricity market in Pennsylvania, ending more than a decade of generation price caps. As part of the transition, we are providing customers with extensive information on wise energy use and on their generation supply options.
• A decision to move ahead with major hydroelectric expansions in Pennsylvania and Montana.
• Continued progress on our construction and operating license application to preserve an option to build a new nuclear unit in Pennsylvania.
• Successful completion of a rate
higher than the midpoint of our challenging business plan for 2009.
This result was made possible by our aggressive actions early in the year to lock in wholesale energy prices and to rein in costs across the company, while maintaining safe and efficient operations in all of our businesses and delivering customer service that ranks among the best in the utility sector on two continents.
In 2009, the people of PPL continued to concentrate on the day-to-day basics of safety, productivity and execution excellence while not losing sight of the objective of building long-term value for shareowners.
There were significant highlights on both fronts:
• Generation records at our Colstrip,
PPL Corporation 2009 Annual Report
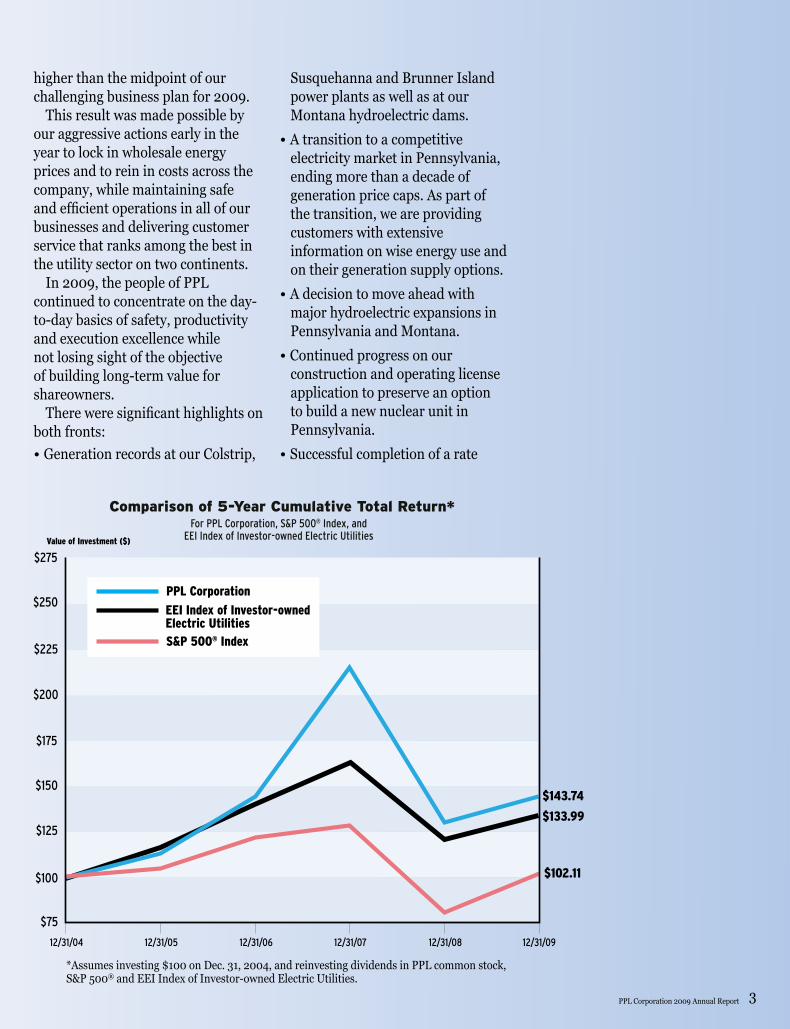
*Assumes investing $100 on Dec. 31, 2004, and reinvesting dividends in PPL common stock, S&P 500® and EEI Index of Investor-owned Electric Utilities.
3

review process in the United Kingdom for the next five years.
• Completion of the second-largest construction project in the company’s history — the installation of scrubbers and other environmental controls at our coal-fired power plants in Pennsylvania — on time and within budget.
I’m also pleased to report that we had one of the safest years in company history.
Looking ahead to 2010, we’re forecasting earnings of $3.10 to $3.50 per share. Achieving the midpoint of this range would result in a nearly 70 percent increase over our 2009 earnings from ongoing operations.
I can assure you that all of us at PPL remain highly focused on delivering total shareowner returns that exceed comparable investment options available to you. As you can see on the chart on the previous page, a $100 investment in PPL at the end of 2004 would have grown, assuming reinvestment of dividends, to nearly $144 by the end of last year, outperforming both the S&P 500® Index and the Edison Electric Institute Index of Investor-owned Electric Utilities.
We also are committed to a strong dividend, which we know is very important to you. Recently, for the eighth year in a row, we announced a dividend increase, bringing our annualized level to $1.40 per share. It’s also important to note that we
now have paid a dividend for 257 consecutive quarters.
Uncertainty, of course, remains our constant companion. We don’t know, for instance, when the economy will turn around. We don’t know when, or if, we’ll see new environmental and renewable energy policies that will totally change the game in our industry. We don’t know when wholesale electricity prices will move higher. We can’t predict the pace of technological developments that may make alternative energy more economical or carbon dioxide capture and sequestration feasible for large power plants.
There is one thing we do know, however. We know that our business model is built to deliver in a wide range of business conditions and that we will never lose our focus on growing the value of your investment.
On behalf of all the employees of PPL, thank you for your continued investment in our company.
Sincerely,
James H. MillerChairman, President and Chief Executive OfficerApril 5, 2010
Chairman’s Letter
PPL Corporation 2009 Annual Report 4
Reconciliation of Financial Measures (Unaudited)“Earnings from ongoing operations” should not be considered as an alternative to reported earnings, or net income attributable to PPL, which is an indicator of operating performance determined in accordance with generally accepted accounting principles (GAAP). PPL believes that earnings from ongoing operations, although a non-GAAP financial measure, is also useful and meaningful to investors because it provides them with management’s view of PPL’s fundamental earnings performance as another criterion in making their investment decisions. PPL’s management also uses earnings from ongoing operations in measuring certain corporate performance goals. Other companies may use different measures to present financial performance.
Earnings from ongoing operations is adjusted for the impact of special items. Special items include: • The impact of energy-related
economic activity (as dis-cussed below).
• Foreign currency-related economic hedges.
• The impact of sales of assets not in the ordinary course of business.
• Impairment charges (including impairments of securities in the company’s nuclear decom-missioning trust).
• Workforce reduction and other restructuring impacts.
• Other charges or credits that are, in manage-ment’s view, not reflective of the company’s ongoing operations.
Energy-related economic activity includes the changes in fair value of positions used to hedge a portion of the economic value of PPL’s genera-tion assets, load-following and retail activities. This economic value is subject to changes in fair value due to market price volatility of the input and output commodities (e.g., fuel and power). Also included in this special item are the ineffec-tive portion of qualifying cash flow hedges and the premium amortization associated with op-tions classified as economic activity. These items are included in earnings from ongoing operations over the delivery period that was
hedged. Management believes that adjusting for such amounts provides a better matching of earnings from ongoing operations to the actual amounts settled for PPL’s underlying hedged assets.
Key 2010 Earnings Forecast Assumptions by Business Segment
Supply Segment
PPL projects higher earnings from its supply business segment in 2010 compared with 2009 due to growth in energy margins. The forecast for growth in energy margins is based on hedged power and fuel prices as well as established ca-pacity prices in the PJM Interconnection. These positive factors are expected to be partially offset by higher depreciation, higher financing costs, and higher operation and maintenance expenses.
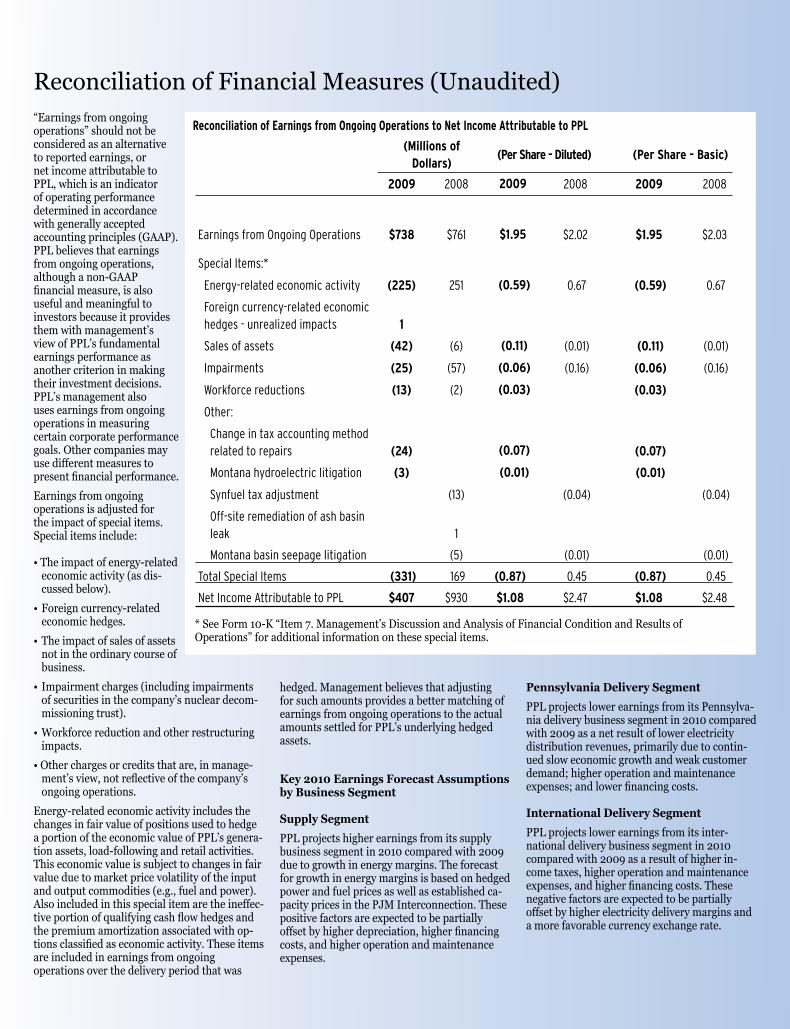
Reconciliation of Earnings from Ongoing Operations to Net Income Attributable to PPL
(Millions of Dollars)
(Per Share - Diluted) (Per Share - Basic)
2009 2008 2009 2008 2009 2008
Earnings from Ongoing Operations $738 $761 $1.95 $2.02 $1.95 $2.03
Special Items:*
Energy-related economic activity (225) 251 (0.59) 0.67 (0.59) 0.67
Foreign currency-related economic hedges - unrealized impacts 1
Sales of assets (42) (6) (0.11) (0.01) (0.11) (0.01)
Impairments (25) (57) (0.06) (0.16) (0.06) (0.16)
Workforce reductions (13) (2) (0.03) (0.03)
Other:
Change in tax accounting method related to repairs (24) (0.07) (0.07)
Montana hydroelectric litigation (3) (0.01) (0.01)
Synfuel tax adjustment (13) (0.04) (0.04)
Off-site remediation of ash basin leak 1
Montana basin seepage litigation (5) (0.01) (0.01)
Total Special Items (331) 169 (0.87) 0.45 (0.87) 0.45
Net Income Attributable to PPL $407 $930 $1.08 $2.47 $1.08 $2.48
* See Form 10-K “Item 7. Management’s Discussion and Analysis of Financial Condition and Results of Operations” for additional information on these special items.
Pennsylvania Delivery Segment
PPL projects lower earnings from its Pennsylva-nia delivery business segment in 2010 compared with 2009 as a net result of lower electricity distribution revenues, primarily due to contin-ued slow economic growth and weak customer demand; higher operation and maintenance expenses; and lower financing costs.
International Delivery Segment
PPL projects lower earnings from its inter-national delivery business segment in 2010 compared with 2009 as a result of higher in-come taxes, higher operation and maintenance expenses, and higher financing costs. These negative factors are expected to be partially offset by higher electricity delivery margins and a more favorable currency exchange rate.

Directors
Frederick M. Bernthal, 67, is president of Universities Research Association, a consortium of 87 research universities engaged in the construction and operation of major research facilities.
John W. Conway, 64, is chairman of the board, president and chief executive officer of Crown Holdings, Inc., an international manufacturer of packaging products for consumer goods.
E. Allen Deaver, 74, is former executive vice president and director of Armstrong World Industries, Inc., a manufacturer of interior furnishings and specialty products.
Louise K. Goeser, 56, is president and chief executive officer of Grupo Siemens S.A. de C.V. and is responsible for Siemens Mesoamérica, the Mexican, Central American and Caribbean unit of multinational Siemens AG, a global engineering company operating in the industry, energy and healthcare sectors.
Stuart E. Graham, 64, is former president and chief executive officer of Skanska AB, an international project development and construction company.
Stuart Heydt, 70, is former chief executive officer of Geisinger Health System, a nonprofit healthcare provider.
James H. Miller, 61, is chairman, president and chief executive officer of PPL Corporation.
Craig A. Rogerson, 53, is chairman, president and chief executive officer of Chemtura Corporation, a global manufacturer and marketer of specialty chemicals, crop protection and pool, spa and home care products.
W. Keith Smith, 75, is former chief executive officer of West Penn Allegheny Health System, former vice chairman of Mellon Financial Corporation and former senior vice chairman of Mellon Bank, N.A.
Natica von Althann, 59, is former senior credit risk management executive of Bank of America, and former chief credit officer of U.S. Trust, an investment management company.
Keith H. Williamson, 57, is senior vice president, secretary and general counsel of Centene Corporation, a provider of Medicaid-managed care and specialty services.
Executive Committee
James H. Miller, ChairFrederick M. BernthalE. Allen DeaverStuart Heydt
Audit Committee
Stuart Heydt, ChairFrederick M. BernthalNatica von AlthannW. Keith Smith
Compensation, Governance and Nominating Committee
E. Allen Deaver, ChairJohn W. ConwayLouise K. GoeserStuart E. GrahamStuart Heydt
Finance Committee
W. Keith Smith, ChairJohn W. ConwayE. Allen DeaverNatica von AlthannKeith H. Williamson
Nuclear Oversight Committee
Frederick M. Bernthal, ChairE. Allen DeaverStuart E. GrahamStuart HeydtCraig A. Rogerson
Board Committees
Directors and Officers
Officers Corporate Leadership Council
James H. Miller, Chairman, President and CEO, PPL Corporation
Paul A. Farr, Executive VP and CFO, PPL Corporation
William H. Spence, Executive VP and COO, PPL Corporation
Robert J. Grey, Senior VP, General Counsel and Secretary, PPL Corporation
Major Subsidiary Presidents
David G. DeCampli, PPL Electric Utilities
Robert D. Gabbard, PPL EnergyPlus
Rick L. Klingensmith, PPL Global
William H. Spence, PPL Generation
Other Officers
James E. Abel, VP-Finance and Treasurer, PPL Corporation
L. Gene Alessandrini, Senior VP-Marketing, PPL EnergyPlus
Gregory N. Dudkin, Senior VP-Operations, PPL Electric Utilities
Robert M. Geneczko, VP-Customer Services, PPL Electric Utilities
Jeffrey M. Helsel, VP-Nuclear Operations, PPL Susquehanna
Michael E. Kroboth, VP-Energy Services, PPL Energy Services Group, LLC
Victor N. Lopiano, Senior VP-Fossil and Hydro Generation, PPL Generation, and President, PPL Nuclear Development, LLC
Dennis J. Murphy, VP and COO-Eastern Fossil and Hydro, PPL Generation
Joanne H. Raphael, VP-External Affairs, PPL Services
Timothy S. Rausch, Senior VP and Chief Nuclear Officer, PPL Susquehanna
William E. Riebling, VP-Engineering and Construction, PPL Generation
Stephen R. Russo, VP-Human Resources and Services, PPL Services
James E. Schinski, VP-Chief Information Officer, PPL Services
J. Matt Simmons, Jr., VP and Controller, PPL Corporation, and VP-Risk Management and Chief Risk Officer, PPL Services
Peter J. Simonich, VP and COO-Western Fossil and Hydro, PPL Generation
Robert A. Symons, Chief Executive, Western Power Distribution, and VP-United Kingdom, PPL Global

Duplicate MailingsIf you have more than one account, or if there is more than one investor in your household, you may call the PPL Shareowner Information Line to request that only one annual report be delivered to your address. Please provide account numbers for all duplicate mailings.
PPL Shareowner Information Line (1-800-345-3085)Shareowners can get detailed corporate and financial information 24 hours a day using the PPL Shareowner Information Line. They can hear timely recorded messages about earnings, dividends and other company news releases; request information by fax; and request printed materials in the mail. Other PPL publications, such as the annual and quarterly reports to the Securities and Exchange Commission (Forms 10-K and 10-Q) will be mailed upon request, or write to:
Manager-PPL Investor ServicesTwo North Ninth Street (GENTW13)Allentown, PA 18101Fax: 610-774-5106Via e-mail: [email protected]
PPL’s Web Site (www.pplweb.com)Shareowners can access PPL Securities and Exchange Commission filings, corporate governance materials, news releases, stock quotes and historical performance. Visitors to our Web site can provide their e-mail address and indicate their desire to receive future earnings or news releases automatically.
Lost Dividend ChecksDividend checks lost by investors, or those that may be lost in the mail, will be replaced if the check has not been located by the 10th business day following the payment date.
Direct Deposit of DividendsShareowners may choose to have their dividends deposited directly into their checking or savings account. Please consider registering for direct deposit, which expedites your receipt of dividends and saves the cost of postage, paper, handling and transportation.
Dividend Reinvestment PlanShareowners may choose to have dividends on their PPL Corporation common stock or PPL Electric Utilities preferred and preference stock reinvested in PPL Corporation common stock instead of receiving the dividend by direct deposit or check. Participants in PPL’s Dividend Reinvestment Plan may choose to deposit their common stock into their plan account.
Direct Registration SystemPPL Corporation and PPL Electric Utilities Corporation participate in the Direct Registration System (DRS). Shareowners may choose to have their common or preferred stock certificates converted to book entry form within the DRS.
Online Account AccessRegistered shareowners can access account information by visiting www.shareowneronline.com.
Shareowner Inquiries and Registrar, Transfer and Dividend Reinvestment Plan Agent
PPL Shareowner ServicesWells Fargo Bank, N.A.161 North Concord ExchangeSouth St. Paul, MN 55075-1139
Toll-free: 1-800-345-3085Outside U.S.: 651-453-2129FAX: 651-450-4085www.wellsfargo.com/shareownerservices/
Corporate OfficesPPL CorporationTwo North Ninth Street Allentown, PA 18101610-774-5151
PPL and the PPL logo are trademarks of PPL Corporation or an affiliate.
S&P 500 is a registered trademark of McGraw-Hill, Inc.
©PPL Corporation. All Rights Reserved
Shareowner InformationAnnual MeetingShareowners are invited to attend the annual meeting to be held Wednesday, May 19, 2010, at the Holiday Inn in Fogelsville, Pennsylvania, in Lehigh County. The meeting will begin at 10 a.m. EDT.
Stock Exchange ListingPPL Corporation common stock is listed on the New York Stock Exchange (NYSE). The symbol is PPL.
2009
High LowDividendsDeclared
1st quarter $33.54 $24.25 $.345
2nd quarter
34.42 27.40 .345
3rd quarter
34.21 28.27 .345
4th quarter
33.05 28.82 .345
2008
High LowDividendsDeclared
1st quarter $55.23 $44.72 $.335
2nd quarter
54.00 46.04 .335
3rd quarter
53.78 34.95 .335
4th quarter
37.88 26.84 .335
The company has paid quarterly cash dividends on its common stock in every year since 1946. The dividends declared per share in 2009 and 2008 were $1.38 and $1.34, respectively. On Feb. 26, 2010, the company increased its quarterly dividend to $0.35 per share (equivalent to $1.40 per share per year), effective with the quarterly dividend paid April 1, 2010, to shareowners of record on March 10, 2010.
DividendsThe planned dates for consideration of the declaration of dividends by the Board of Directors or its Executive Committee for the balance of 2010 are May 19, Aug. 27 and Nov. 19. Subject to the declaration, dividends are paid on the first business day of April, July, October and January. The record dates for dividends for the balance of 2010 are expected to be June 10, Sept. 10 and Dec. 10.

PPL CorporationTwo North Ninth StreetAllentown, PA 18101-1179
www.pplweb.com
Printed on recycled and recyclable paper
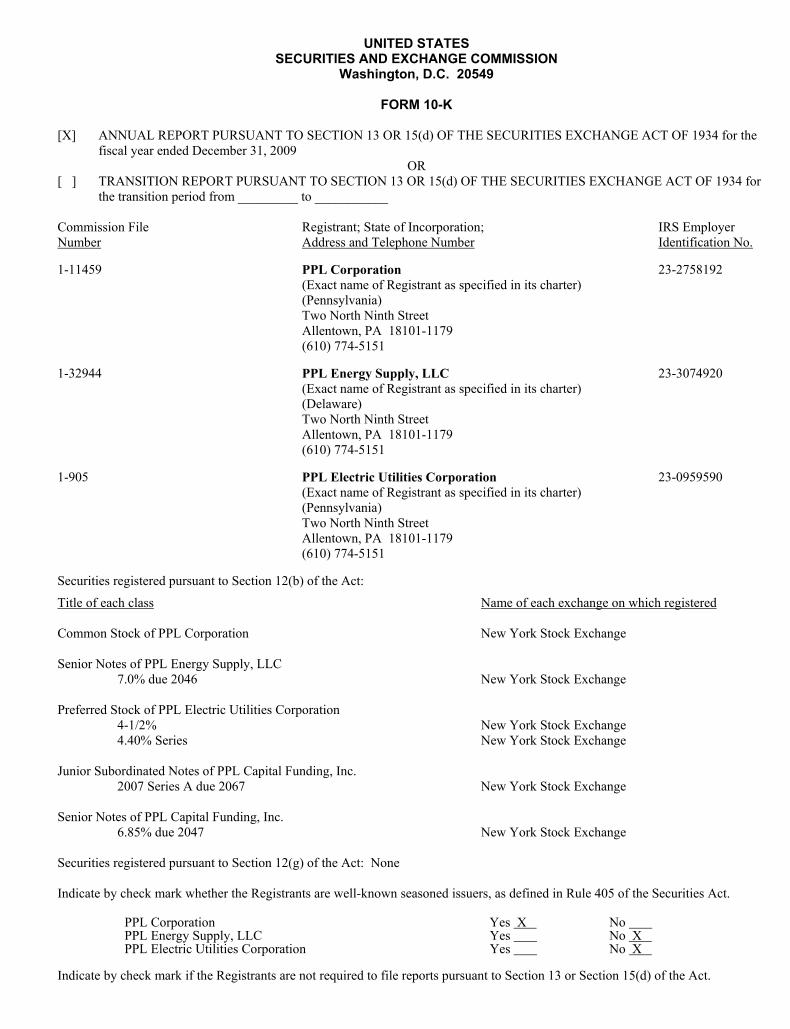
UNITED STATES SECURITIES AND EXCHANGE COMMISSION
Washington, D.C. 20549
FORM 10-K [X] ANNUAL REPORT PURSUANT TO SECTION 13 OR 15(d) OF THE SECURITIES EXCHANGE ACT OF 1934 for the
fiscal year ended December 31, 2009 OR
[ ] TRANSITION REPORT PURSUANT TO SECTION 13 OR 15(d) OF THE SECURITIES EXCHANGE ACT OF 1934 for the transition period from _________ to ___________
Commission File Number
Registrant; State of Incorporation; Address and Telephone Number
IRS Employer Identification No.
1-11459 PPL Corporation (Exact name of Registrant as specified in its charter) (Pennsylvania) Two North Ninth Street Allentown, PA 18101-1179 (610) 774-5151
23-2758192
1-32944 PPL Energy Supply, LLC (Exact name of Registrant as specified in its charter) (Delaware) Two North Ninth Street Allentown, PA 18101-1179 (610) 774-5151
23-3074920
1-905 PPL Electric Utilities Corporation (Exact name of Registrant as specified in its charter) (Pennsylvania) Two North Ninth Street Allentown, PA 18101-1179 (610) 774-5151
23-0959590
Securities registered pursuant to Section 12(b) of the Act:
Title of each class Name of each exchange on which registered Common Stock of PPL Corporation New York Stock Exchange Senior Notes of PPL Energy Supply, LLC 7.0% due 2046 New York Stock Exchange Preferred Stock of PPL Electric Utilities Corporation
4-1/2% 4.40% Series
New York Stock Exchange New York Stock Exchange
Junior Subordinated Notes of PPL Capital Funding, Inc. 2007 Series A due 2067 New York Stock Exchange Senior Notes of PPL Capital Funding, Inc. 6.85% due 2047 New York Stock Exchange Securities registered pursuant to Section 12(g) of the Act: None Indicate by check mark whether the Registrants are well-known seasoned issuers, as defined in Rule 405 of the Securities Act.
PPL Corporation Yes X No PPL Energy Supply, LLC Yes No X PPL Electric Utilities Corporation Yes No X
Indicate by check mark if the Registrants are not required to file reports pursuant to Section 13 or Section 15(d) of the Act.
PPL Corporation Yes No X PPL Energy Supply, LLC Yes No X PPL Electric Utilities Corporation Yes No X
Indicate by check mark whether the Registrants (1) have filed all reports required to be filed by Section 13 or 15(d) of the Securities Exchange Act of 1934 during the preceding 12 months (or for such shorter period that the Registrants were required to file such reports), and (2) have been subject to such filing requirements for the past 90 days.
PPL Corporation Yes X No PPL Energy Supply, LLC Yes X No PPL Electric Utilities Corporation Yes X No
Indicate by check mark whether the Registrants have submitted electronically and posted on their corporate Web site, if any, every Interactive Data File required to be submitted and posted pursuant to Rule 405 of Regulation S-T (§232.405 of this chapter) during the preceding 12 months (or for such shorter period that the Registrants were required to submit and post such files).
PPL Corporation Yes X No PPL Energy Supply, LLC Yes No PPL Electric Utilities Corporation Yes No
Indicate by check mark if disclosure of delinquent filers pursuant to Item 405 of Regulation S-K is not contained herein, and will not be contained, to the best of Registrants' knowledge, in definitive proxy or information statements incorporated by reference in Part III of this Form 10-K or any amendment to this Form 10-K.
PPL Corporation [ X ] PPL Energy Supply, LLC [ X ] PPL Electric Utilities Corporation [ X ]
Indicate by check mark whether the Registrants are large accelerated filers, accelerated filers, non-accelerated filers, or a smaller reporting company. See definition of "large accelerated filer," "accelerated filer" and "smaller reporting company" in Rule 12b-2 of the Exchange Act. (Check one):
Large accelerated filer
Accelerated filer
Non-accelerated filer
Smaller reporting company
PPL Corporation [ X ] [ ] [ ] [ ] PPL Energy Supply, LLC [ ] [ ] [ X ] [ ] PPL Electric Utilities Corporation [ ] [ ] [ X ] [ ]
Indicate by check mark whether the Registrants are shell companies (as defined in Rule 12b-2 of the Act).
PPL Corporation Yes No X PPL Energy Supply, LLC Yes No X PPL Electric Utilities Corporation Yes No X
As of June 30, 2009, PPL Corporation had 376,144,172 shares of its $.01 par value Common Stock outstanding. The aggregate market value of these common shares (based upon the closing price of these shares on the New York Stock Exchange on that date) held by non-affiliates was $12,397,711,909. As of January 29, 2010, PPL Corporation had 377,900,179 shares of its $.01 par value Common Stock outstanding. As of January 29, 2010, PPL Corporation held all 66,368,056 outstanding common shares, no par value, of PPL Electric Utilities Corporation. PPL Corporation indirectly holds all of the membership interests in PPL Energy Supply, LLC. PPL Energy Supply, LLC meets the conditions set forth in General Instructions (I)(1)(a) and (b) of Form 10-K and is therefore filing this form with the reduced disclosure format. Documents incorporated by reference: PPL Corporation and PPL Electric Utilities Corporation have incorporated herein by reference certain sections of PPL Corporation's 2010 Notice of Annual Meeting and Proxy Statement, and PPL Electric Utilities Corporation's 2010 Notice of Annual Meeting and Information Statement, which will be filed with the Securities and Exchange Commission not later than 120 days after December 31, 2009. Such Statements will provide the information required by Part III of this Report.

PPL CORPORATION PPL ENERGY SUPPLY, LLC
PPL ELECTRIC UTILITIES CORPORATION
FORM 10-K ANNUAL REPORT TO THE SECURITIES AND EXCHANGE COMMISSION
FOR THE YEAR ENDED DECEMBER 31, 2009
TABLE OF CONTENTS This combined Form 10-K is separately filed by PPL Corporation, PPL Energy Supply, LLC and PPL Electric Utilities Corporation. Information contained herein relating to PPL Energy Supply, LLC and PPL Electric Utilities Corporation is filed by PPL Corporation and separately by PPL Energy Supply, LLC and PPL Electric Utilities Corporation on their own behalf. No registrant makes any representation as to information relating to any other registrant, except that information relating to the two PPL Corporation subsidiaries is also attributed to PPL Corporation. Item Page
PART I Glossary of Terms and Abbreviations ............................................................................................................................... iForward-Looking Information........................................................................................................................................... v
1. Business............................................................................................................................................................................. 11A. Risk Factors....................................................................................................................................................................... 91B. Unresolved Staff Comments.............................................................................................................................................. 16
2. Properties........................................................................................................................................................................... 173. Legal Proceedings ............................................................................................................................................................. 184. Submission of Matters to a Vote of Security Holders ....................................................................................................... 18
Executive Officers of the Registrants................................................................................................................................ 19
PART II 5. Market for the Registrant's Common Equity, Related Stockholder Matters and Issuer Purchases of Equity Securities ... 216. Selected Financial and Operating Data ............................................................................................................................. 217. Management's Discussion and Analysis of Financial Condition and Results of Operations
PPL Corporation and Subsidiaries ............................................................................................................................... 24PPL Energy Supply, LLC and Subsidiaries ................................................................................................................. 51PPL Electric Utilities Corporation and Subsidiaries .................................................................................................... 75
7A. Quantitative and Qualitative Disclosures About Market Risk........................................................................................... 87Reports of Independent Registered Public Accounting Firm ............................................................................................ 89
8. Financial Statements and Supplementary Data ................................................................................................................. 939. Changes in and Disagreements with Accountants on Accounting and Financial Disclosure ............................................ 195
9A. Controls and Procedures.................................................................................................................................................... 1959A(T). Controls and Procedures.................................................................................................................................................... 195
9B. Other Information.............................................................................................................................................................. 196
PART III 10. Directors, Executive Officers and Corporate Governance ................................................................................................ 19611. Executive Compensation ................................................................................................................................................... 19712. Security Ownership of Certain Beneficial Owners and Management and Related Stockholder Matters .......................... 19713. Certain Relationships and Related Transactions, and Director Independence .................................................................. 19814. Principal Accounting Fees and Services ........................................................................................................................... 198
PART IV 15. Exhibits, Financial Statement Schedules........................................................................................................................... 199
Shareowner and Investor Information ............................................................................................................................... 200 Signatures .......................................................................................................................................................................... 202 Exhibit Index ..................................................................................................................................................................... 205 Computation of Ratio of Earnings to Fixed Charges......................................................................................................... 215
Certifications of Principal Executive Officer and Principal Financial Officer Pursuant to Section 302 of the Sarbanes-Oxley Act of 2002...................................................................................................................................... 218
Certificates of Principal Executive Officer and Principal Financial Officer Pursuant to Section 906 of the Sarbanes-Oxley Act of 2002...................................................................................................................................... 224Examples of Wholesale Energy, Fuel and Emission Allowance Price Fluctuations - 2005 through 2009........................ 230

(THIS PAGE LEFT BLANK INTENTIONALLY.)

i
GLOSSARY OF TERMS AND ABBREVIATIONS
PPL Corporation and its current and former subsidiaries Emel - Empresas Emel S.A., a Chilean electric distribution holding company in which PPL Global had a majority ownership interest until its sale in November 2007. Hyder - Hyder Limited, a subsidiary of WPDL that was the previous owner of South Wales Electricity plc. In March 2001, South Wales Electricity plc was acquired by WPDH Limited and renamed WPD (South Wales). PPL - PPL Corporation, the parent holding company of PPL Electric, PPL Energy Funding and other subsidiaries. PPL Capital Funding - PPL Capital Funding, Inc., a financing subsidiary of PPL. PPL Electric - PPL Electric Utilities Corporation, a regulated utility subsidiary of PPL that transmits and distributes electricity in its service territory and provides electric supply to retail customers in this territory as a PLR. PPL Energy Funding - PPL Energy Funding Corporation, a subsidiary of PPL and the parent company of PPL Energy Supply. PPL EnergyPlus - PPL EnergyPlus, LLC, a subsidiary of PPL Energy Supply that markets and trades wholesale and retail electricity and gas, and supplies energy and energy services in deregulated markets. PPL Energy Supply - PPL Energy Supply, LLC, a subsidiary of PPL Energy Funding and the parent company of PPL Generation, PPL EnergyPlus, PPL Global and other subsidiaries. PPL Gas Utilities - PPL Gas Utilities Corporation, a regulated utility that provided natural gas distribution, transmission and storage services, and the competitive sale of propane, which was a subsidiary of PPL until its sale in October 2008. PPL Generation - PPL Generation, LLC, a subsidiary of PPL Energy Supply that owns and operates U.S. generating facilities through various subsidiaries. PPL Global - PPL Global, LLC, a subsidiary of PPL Energy Supply that primarily owns and operates a business in the U.K., WPD, that is focused on the regulated distribution of electricity. PPL Holtwood - PPL Holtwood, LLC, a subsidiary of PPL Generation that owns hydroelectric generating operations in Pennsylvania.
PPL Investment Corp. - PPL Investment Corporation, a subsidiary of PPL Energy Supply. PPL Maine - PPL Maine, LLC, a subsidiary of PPL Generation that owns generating operations in Maine. PPL Martins Creek - PPL Martins Creek, LLC, a subsidiary of PPL Generation that owns generating operations in Pennsylvania. PPL Montana - PPL Montana, LLC, an indirect subsidiary of PPL Generation that generates electricity for wholesale sales in Montana and the Pacific Northwest. PPL Services - PPL Services Corporation, a subsidiary of PPL that provides shared services for PPL and its subsidiaries. PPL Susquehanna - PPL Susquehanna, LLC, the nuclear generating subsidiary of PPL Generation. PPL Transition Bond Company - PPL Transition Bond Company, LLC, a subsidiary of PPL Electric that was formed to issue transition bonds under the Customer Choice Act. This subsidiary was dissolved in June 2009. SIUK Capital Trust I - a business trust created to issue preferred securities, the common equity of which was held by WPD LLP. The preferred securities were redeemed in February 2007. WPD - refers collectively to WPDH Limited and WPDL. WPD LLP - Western Power Distribution LLP, a wholly owned subsidiary of WPDH Limited, which owns WPD (South West) and WPD (South Wales). WPD (South Wales) - Western Power Distribution (South Wales) plc, a British regional electric utility company. WPD (South West) - Western Power Distribution (South West) plc, a British regional electric utility company. WPDH Limited - Western Power Distribution Holdings Limited, an indirect, wholly owned subsidiary of PPL Global. WPDH Limited owns WPD LLP. WPDL - WPD Investment Holdings Limited, an indirect wholly owned subsidiary of PPL Global. WPDL owns 100% of the common shares of Hyder.
ii
Other terms and abbreviations
401(h) account - A sub-account established within a qualified pension trust to provide for the payment of retiree medical costs. £ - British pounds sterling. 1945 First Mortgage Bond Indenture - PPL Electric's Mortgage and Deed of Trust, dated as of October 1, 1945, to Deutsche Bank Trust Company Americas, as trustee, as supplemented. 2001 Senior Secured Bond Indenture - PPL Electric's Indenture, dated as of August 1, 2001, to The Bank of New York Mellon (as successor to JPMorgan Chase Bank), as trustee, as supplemented. AFUDC (Allowance for Funds Used During Construction) - the cost of equity and debt funds used to finance construction projects of regulated businesses, which is capitalized as part of construction cost. A.M. Best - A.M. Best Company, a company that reports on the condition of insurance companies. AMT - alternative minimum tax. AOCI - accumulated other comprehensive income or loss. ARO - asset retirement obligation. Baseload generation - includes the output provided by PPL's nuclear, coal, hydroelectric and qualifying facilities. Basis - when used in the context of derivatives and commodity trading, the commodity price differential between two locations, products or time periods. Bcf - billion cubic feet. Black Lung Trust - a trust account maintained under federal and state Black Lung legislation for the payment of claims related to disability or death due to pneumoconiosis. CAIR - the EPA's Clean Air Interstate Rule. Clean Air Act - federal legislation enacted to address certain environmental issues related to air emissions, including acid rain, ozone and toxic air emissions. COLA - license application for a combined construction permit and operating license from the NRC. CTC - competitive transition charge on customer bills to recover allowable transition costs under the Customer Choice Act.
Customer Choice Act - the Pennsylvania Electricity Generation Customer Choice and Competition Act, legislation enacted to restructure the state's electric utility industry to create retail access to a competitive market for generation of electricity. DDCP - Directors Deferred Compensation Plan. DEP - Department of Environmental Protection, a state government agency. DOE - Department of Energy, a U.S. government agency. DRIP - Dividend Reinvestment Plan. Economic Stimulus Package - The American Recovery and Reinvestment Act of 2009, generally referred to as the federal economic stimulus package, which was signed into law in February 2009. EMF - electric and magnetic fields. EPA - Environmental Protection Agency, a U.S. government agency. EPS - earnings per share. ESOP - Employee Stock Ownership Plan. EWG - exempt wholesale generator. FASB - Financial Accounting Standards Board, a rulemaking organization that establishes financial accounting and reporting standards. FERC - Federal Energy Regulatory Commission, the federal agency that regulates, among other things, interstate transmission and wholesale sales of electricity, hydroelectric power projects and related matters. Fitch - Fitch, Inc. FTR - financial transmission rights, which are financial instruments established to manage price risk related to electricity transmission congestion. They entitle the holder to receive compensation or require the holder to remit payment for certain congestion-related transmission charges that arise when the transmission grid is congested. GAAP - generally accepted accounting principles in the U.S. GWh - gigawatt-hour, one million kilowatt-hours. HMRC - HM Revenue & Customs. The tax authority in the U.K., formerly known as Inland Revenue.

iii
IBEW - International Brotherhood of Electrical Workers. ICP - Incentive Compensation Plan. ICPKE - Incentive Compensation Plan for Key Employees. Intermediate and peaking generation - includes the output provided by PPL Energy Supply's oil- and natural gas-fired units. Ironwood - a natural gas-fired power plant in Lebanon, Pennsylvania with a winter rating of 759 MW. IRS - Internal Revenue Service, a U.S. government agency. IRC Sec. 481 - the Internal Revenue Code Section that prescribes the tax year in which adjustments to taxable income resulting from a change in a tax accounting method must be recognized. ISO - Independent System Operator. ITC - intangible transition charge on customer bills to recover intangible transition costs associated with securitizing stranded costs under the Customer Choice Act. kVA - kilovolt-ampere. kWh - kilowatt-hour, basic unit of electrical energy. LCIDA - Lehigh County Industrial Development Authority. LIBOR - London Interbank Offered Rate. Long Island generation business - includes a 79.9 MW gas-fired plant in the Edgewood section of Brentwood, New York and a 79.9 MW oil-fired plant in Shoreham, New York. MACT - maximum achievable control technology. Montana Power - The Montana Power Company, a Montana-based company that sold its generating assets to PPL Montana in December 1999. Through a series of transactions consummated during the first quarter of 2002, Montana Power sold its electricity delivery business to NorthWestern. Moody's - Moody's Investors Service, Inc. MW - megawatt, one thousand kilowatts. MWh - megawatt-hour, one thousand kilowatt-hours. NDT - nuclear plant decommissioning trust. NERC - North American Electric Reliability Corporation. NorthWestern - NorthWestern Corporation, a Delaware corporation, and successor in interest to Montana Power's electricity delivery business, including Montana Power's rights and obligations under contracts with PPL Montana.
NPDES - National Pollutant Discharge Elimination System. NPNS - the normal purchases and normal sales exception as permitted by derivative accounting rules. NRC - Nuclear Regulatory Commission, the federal agency that regulates nuclear power facilities. NUGs (Non-Utility Generators) - generating plants not owned by public utilities, whose electrical output must be purchased by utilities under the PURPA if the plant meets certain criteria. NYMEX - New York Mercantile Exchange. OCI - other comprehensive income or loss. Ofgem - Office of Gas and Electricity Markets, the British agency that regulates transmission, distribution and wholesale sales of electricity and related matters. PEDFA - Pennsylvania Economic Development Financing Authority. PJM (PJM Interconnection, L.L.C.) - operator of the electric transmission network and electric energy market in all or parts of Delaware, Illinois, Indiana, Kentucky, Maryland, Michigan, New Jersey, North Carolina, Ohio, Pennsylvania, Tennessee, Virginia, West Virginia and the District of Columbia. PLR (Provider of Last Resort) - the role of PPL Electric in providing default electricity supply to retail customers within its delivery territory who have not chosen to select an alternative electricity supplier under the Customer Choice Act. PP&E - property, plant and equipment. PUC - Pennsylvania Public Utility Commission, the state agency that regulates certain ratemaking, services, accounting and operations of Pennsylvania utilities. PUC Final Order - final order issued by the PUC on August 27, 1998, approving the settlement of PPL Electric's restructuring proceeding. PUHCA - Public Utility Holding Company Act of 1935, legislation passed by the U.S. Congress. Repealed effective February 2006 by the Energy Policy Act of 2005. PURPA - Public Utility Regulatory Policies Act of 1978, legislation passed by the U.S. Congress to encourage energy conservation, efficient use of resources and equitable rates. PURTA - The Pennsylvania Public Utility Realty Tax Act. RAB - regulatory asset base. This term is also commonly known as RAV. RECs - renewable energy credits.

iv
Regulation S-K - SEC regulation governing the content of reports and other documents required to be filed pursuant to the federal securities laws. RFC - ReliabilityFirst Corporation (the regional reliability entity that replaced the Mid-Atlantic Area Coordination Council). RMC - Risk Management Committee. RMR - reliability must run. Describes a generation facility that is operated at the request of an ISO to ensure system reliability, generally in a transmission constrained area of the electricity system. RTO - Regional Transmission Organization. Sarbanes-Oxley - Sarbanes-Oxley Act of 2002, which sets requirements for management's assessment of internal controls for financial reporting. It also requires an independent auditor to make its own assessment. SCR - selective catalytic reduction, a pollution control process. Scrubber - an air pollution control device that can remove particulates and/or gases (such as sulfur dioxide) from exhaust gases. SEC - Securities and Exchange Commission, a U.S. government agency whose primary mission is to protect investors and maintain the integrity of the securities markets. S&P - Standard & Poor's Ratings Services. Smart meter - an electric meter that utilizes smart metering technology.
Smart metering technology - technology that can measure, among other things, time of electricity consumption to permit offering rate incentives for usage during lower cost or demand intervals. Superfund - federal environmental legislation that addresses remediation of contaminated sites; states also have similar statutes. Synfuel projects - production facilities that manufactured synthetic fuel from coal or coal byproducts. Favorable federal tax credits, which expired effective December 31, 2007, were available on qualified synthetic fuel products. Tolling agreement - agreement whereby the owner of an electric generating facility agrees to use that facility to convert fuel provided by a third party into electric energy for delivery back to the third party. Total shareowner return - increase in market value of a share of the Company's common stock plus the value of all dividends paid on a share of the common stock during the applicable performance period, divided by the price of the common stock as of the beginning of the performance period. VaR - value-at-risk, a statistical model that attempts to estimate the value of potential loss over a given holding period under normal market conditions at a given confidence level. VEBA - Voluntary Employee Benefit Association Trust, trust accounts for health and welfare plans for future benefit payments for employees, retirees or their beneficiaries.

v
FORWARD-LOOKING INFORMATION
Statements contained in this Form 10-K concerning expectations, beliefs, plans, objectives, goals, strategies, future events or performance and underlying assumptions and other statements which are other than statements of historical fact are "forward-looking statements" within the meaning of the federal securities laws. Although PPL, PPL Energy Supply and PPL Electric believe that the expectations and assumptions reflected in these statements are reasonable, there can be no assurance that these expectations will prove to be correct. Forward-looking statements are subject to many risks and uncertainties, and actual results may differ materially from the results discussed in forward-looking statements. In addition to the specific factors discussed in "Item 1A. Risk Factors" and in "Item 7. Management's Discussion and Analysis of Financial Condition and Results of Operations" in this Form 10-K report, the following are among the important factors that could cause actual results to differ materially from the forward-looking statements. • fuel supply cost and availability; • weather conditions affecting generation, customer energy use
and operating costs; • operation, availability and operating costs of existing
generation facilities; • transmission and distribution system conditions and operating
costs; • potential expansion of alternative sources of electricity
generation; • potential laws or regulations to reduce emissions of
"greenhouse" gases; • collective labor bargaining negotiations; • the outcome of litigation against PPL and its subsidiaries; • potential effects of threatened or actual terrorism, war or other
hostilities, or natural disasters; • the commitments and liabilities of PPL and its subsidiaries; • market demand and prices for energy, capacity, emission
allowances and delivered fuel; • competition in retail and wholesale power markets; • liquidity of wholesale power markets; • defaults by counterparties under energy, fuel or other power
product contracts; • market prices of commodity inputs for ongoing capital
expenditures; • capital market conditions, including the availability of capital
or credit, changes in interest rates, and decisions regarding capital structure;
• stock price performance of PPL;
• the fair value of debt and equity securities and the impact on
defined benefit costs and resultant cash funding requirements for defined benefit plans;
• interest rates and their effect on pension, retiree medical and nuclear decommissioning liabilities;
• the impact of the current financial and economic downturn; • the effect of electricity price deregulation beginning in 2010 in
PPL Electric's service territory; • the profitability and liquidity, including access to capital
markets and credit facilities, of PPL and its subsidiaries; • new accounting requirements or new interpretations or
applications of existing requirements; • changes in securities and credit ratings; • foreign currency exchange rates; • current and future environmental conditions, regulations and
other requirements and the related costs of compliance, including environmental capital expenditures, emission allowance costs and other expenses;
• political, regulatory or economic conditions in states, regions or countries where PPL or its subsidiaries conduct business;
• receipt of necessary governmental permits, approvals and rate relief;
• new state, federal or foreign legislation, including new tax legislation;
• state, federal and foreign regulatory developments; • the outcome of any rate cases by PPL Electric at the PUC; • the impact of any state, federal or foreign investigations
applicable to PPL and its subsidiaries and the energy industry;• the effect of any business or industry restructuring; • development of new projects, markets and technologies; • performance of new ventures; and • business or asset acquisitions and dispositions. Any such forward-looking statements should be considered in light of such important factors and in conjunction with other documents of PPL, PPL Energy Supply and PPL Electric on file with the SEC. New factors that could cause actual results to differ materially from those described in forward-looking statements emerge from time to time, and it is not possible for PPL, PPL Energy Supply or PPL Electric to predict all such factors, or the extent to which any such factor or combination of factors may cause actual results to differ from those contained in any forward-looking statement. Any forward-looking statement speaks only as of the date on which such statement is made, and PPL, PPL Energy Supply and PPL Electric undertake no obligation to update the information contained in such statement to reflect subsequent developments or information.

(THIS PAGE LEFT BLANK INTENTIONALLY.)
1
PART I
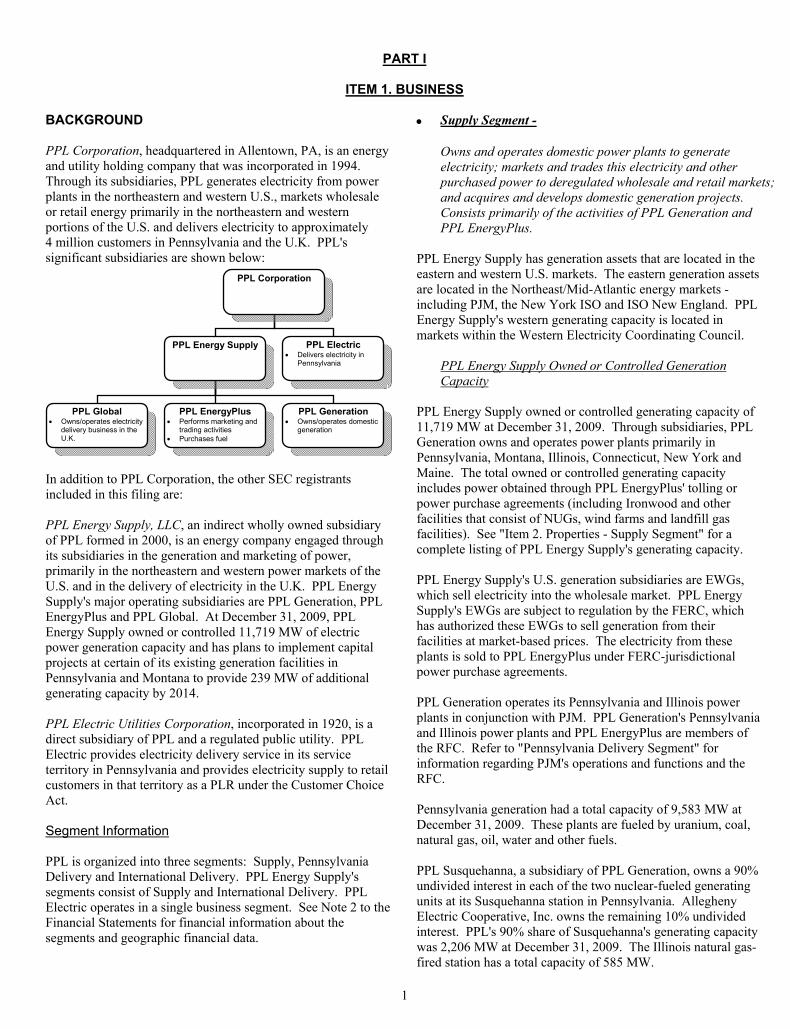
ITEM 1. BUSINESS BACKGROUND PPL Corporation, headquartered in Allentown, PA, is an energy and utility holding company that was incorporated in 1994. Through its subsidiaries, PPL generates electricity from power plants in the northeastern and western U.S., markets wholesale or retail energy primarily in the northeastern and western portions of the U.S. and delivers electricity to approximately 4 million customers in Pennsylvania and the U.K. PPL's significant subsidiaries are shown below:
In addition to PPL Corporation, the other SEC registrants included in this filing are: PPL Energy Supply, LLC, an indirect wholly owned subsidiary of PPL formed in 2000, is an energy company engaged through its subsidiaries in the generation and marketing of power, primarily in the northeastern and western power markets of the U.S. and in the delivery of electricity in the U.K. PPL Energy Supply's major operating subsidiaries are PPL Generation, PPL EnergyPlus and PPL Global. At December 31, 2009, PPL Energy Supply owned or controlled 11,719 MW of electric power generation capacity and has plans to implement capital projects at certain of its existing generation facilities in Pennsylvania and Montana to provide 239 MW of additional generating capacity by 2014. PPL Electric Utilities Corporation, incorporated in 1920, is a direct subsidiary of PPL and a regulated public utility. PPL Electric provides electricity delivery service in its service territory in Pennsylvania and provides electricity supply to retail customers in that territory as a PLR under the Customer Choice Act. Segment Information PPL is organized into three segments: Supply, Pennsylvania Delivery and International Delivery. PPL Energy Supply's segments consist of Supply and International Delivery. PPL Electric operates in a single business segment. See Note 2 to the Financial Statements for financial information about the segments and geographic financial data.
• Supply Segment - Owns and operates domestic power plants to generate
electricity; markets and trades this electricity and other purchased power to deregulated wholesale and retail markets; and acquires and develops domestic generation projects. Consists primarily of the activities of PPL Generation and PPL EnergyPlus.
PPL Energy Supply has generation assets that are located in the eastern and western U.S. markets. The eastern generation assets are located in the Northeast/Mid-Atlantic energy markets - including PJM, the New York ISO and ISO New England. PPL Energy Supply's western generating capacity is located in markets within the Western Electricity Coordinating Council. PPL Energy Supply Owned or Controlled Generation
Capacity PPL Energy Supply owned or controlled generating capacity of 11,719 MW at December 31, 2009. Through subsidiaries, PPL Generation owns and operates power plants primarily in Pennsylvania, Montana, Illinois, Connecticut, New York and Maine. The total owned or controlled generating capacity includes power obtained through PPL EnergyPlus' tolling or power purchase agreements (including Ironwood and other facilities that consist of NUGs, wind farms and landfill gas facilities). See "Item 2. Properties - Supply Segment" for a complete listing of PPL Energy Supply's generating capacity. PPL Energy Supply's U.S. generation subsidiaries are EWGs, which sell electricity into the wholesale market. PPL Energy Supply's EWGs are subject to regulation by the FERC, which has authorized these EWGs to sell generation from their facilities at market-based prices. The electricity from these plants is sold to PPL EnergyPlus under FERC-jurisdictional power purchase agreements. PPL Generation operates its Pennsylvania and Illinois power plants in conjunction with PJM. PPL Generation's Pennsylvania and Illinois power plants and PPL EnergyPlus are members of the RFC. Refer to "Pennsylvania Delivery Segment" for information regarding PJM's operations and functions and the RFC. Pennsylvania generation had a total capacity of 9,583 MW at December 31, 2009. These plants are fueled by uranium, coal, natural gas, oil, water and other fuels. PPL Susquehanna, a subsidiary of PPL Generation, owns a 90% undivided interest in each of the two nuclear-fueled generating units at its Susquehanna station in Pennsylvania. Allegheny Electric Cooperative, Inc. owns the remaining 10% undivided interest. PPL's 90% share of Susquehanna's generating capacity was 2,206 MW at December 31, 2009. The Illinois natural gas-fired station has a total capacity of 585 MW.
PPL Corporation
PPL Energy Supply PPL Electric • Delivers electricity in
Pennsylvania
PPL Global • Owns/operates electricity
delivery business in the U.K.
PPL EnergyPlus • Performs marketing and
trading activities • Purchases fuel
PPL Generation • Owns/operates domestic
generation

2
The Montana coal-fired and hydroelectric-powered stations have a capacity of 1,286 MW. PPL Montana's power plants are operated in conjunction with the Western Electricity Coordinating Council. The Connecticut natural gas-fired station has a total capacity of 244 MW, is operated in conjunction with ISO New England and the Northeast Power Coordinating Council. The New York oil/gas-fired stations have a capacity of 159 MW. These generating assets are operated in conjunction with the New York ISO and the Northeast Power Coordinating Council. Tolling agreements are in place for 100% of the capacity and output of this business. See Note 9 to the Financial Statements for additional information on the anticipated sale of the Long Island generation business. The Maine hydroelectric-powered stations have a total capacity of 12 MW. The Maine generating assets are operated in conjunction with ISO New England and the Northeast Power Coordinating Council. See Note 9 to the Financial Statements for information on the November 2009 sale of the majority of the Maine hydroelectric business, the sale of PPL's interest in an oil-fired unit in Maine and the conditional agreement of sale for the remaining three hydroelectric facilities. PPL Generation has current plans for capital projects at certain of its generation facilities in Pennsylvania and Montana to provide 239 MW of additional generation capacity for its use by 2014. See "Item 2. Properties - Supply Segment" for additional information regarding these capital projects. Refer to the "Power Supply" section for additional information regarding electricity generated by the power plants operated by PPL Generation and to the "Fuel Supply" section for a discussion of fuel requirements and contractual arrangements for fuel. A subsidiary of PPL Energy Supply develops renewable energy plants on various sites using technologies such as turbines, reciprocating engines and photovoltaic solar panels. Included in PPL Energy Supply's owned or controlled generating capacity reported in "Item 2. Properties - Supply Segment" is approximately 28 MW of installed capacity from these projects that serve commercial and industrial customers. Certain PPL Energy Supply subsidiaries are subject to the jurisdiction of certain federal, regional, state and local regulatory agencies with respect to air and water quality, land use and other environmental matters. PPL Susquehanna is subject to the jurisdiction of the NRC in connection with the operation of the Susquehanna units. Certain of PPL Energy Supply's other subsidiaries are subject to the jurisdiction of the NRC in connection with the operation of their fossil plants with respect to certain level and density monitoring devices. Certain operations of PPL Generation's subsidiaries are subject to the Occupational Safety and Health Act of 1970 and comparable state statutes.
Energy Marketing PPL EnergyPlus sells the electricity produced by PPL Generation subsidiaries, along with purchased power, FTRs, natural gas, oil, uranium, emission allowances and RECs in competitive wholesale and deregulated retail markets in order to take advantage of opportunities in the competitive energy marketplace. PPL EnergyPlus purchases and sells electric capacity and energy at the wholesale level at competitive prices under FERC market-based prices. PPL EnergyPlus enters into these agreements to market available energy and capacity from PPL Generation's assets and to profit from market price fluctuations. Within the constraints of its hedging policy, PPL EnergyPlus actively manages its portfolios to optimize the value of PPL's generating assets and to limit exposure to price fluctuations. PPL EnergyPlus also enters into over-the-counter and futures contracts to purchase and sell energy and other commodity-based financial instruments in accordance with PPL's risk management policies, objectives and strategies. PPL EnergyPlus had contracted to provide electricity to PPL Electric sufficient for it to meet its PLR obligation through 2009 at the predetermined capped rates PPL Electric was entitled to charge its customers. These contracts accounted for 29% of PPL Energy Supply's operating revenues in 2009 and expired December 31, 2009. See Note 15 to the Financial Statements for more information concerning these contracts. PPL EnergyPlus is licensed to provide retail electric supply to customers in Delaware, Maine, Massachusetts, Maryland, Montana, New Jersey and Pennsylvania and provides electricity to industrial and commercial customers in Montana and Pennsylvania. PPL EnergyPlus provides natural gas to customers in Pennsylvania, New Jersey, Delaware and Maryland. Competition The unregulated businesses and markets in which PPL and its subsidiaries participate are highly competitive. Since the early 1990s, there has been increased competition in U.S. energy markets because of federal and state deregulation initiatives. For example, in 1992 the Energy Act amended the Federal Power Act to provide open access to electric transmission systems for wholesale transactions. In 1996, the Customer Choice Act was enacted in Pennsylvania to restructure the state's electric utility industry to create a competitive market for electricity generation. Certain other states in which PPL's subsidiaries operate have also adopted "customer choice" plans to allow customers to choose their electricity supplier. PPL and its subsidiaries believe that competition in deregulated energy markets will continue to be intense. The Supply segment faces competition in wholesale markets for available energy, capacity and ancillary services. Competition is impacted by electricity and fuel prices, new market entrants, construction by others of generating assets, technological advances in power generation, the actions of environmental and other regulatory authorities and other factors. The Supply
3
segment primarily competes with other electricity suppliers based on its ability to aggregate generation supply at competitive prices from different sources and to efficiently utilize transportation from third-party pipelines and transmission from electric utilities and ISOs. Competitors in wholesale power markets include regulated utilities, industrial companies, non-utility generators, unregulated subsidiaries of regulated utilities and other energy marketers. See "Item 1A. Risk Factors - Risks Related to Supply Segment" and PPL's and PPL Energy Supply's "Item 7. Management's Discussion and Analysis of Financial Condition and Results of Operations - Overview" for more information concerning the risks faced with respect to competition in deregulated energy markets. Power Supply PPL Energy Supply's owned or controlled system capacity (winter rating) at December 31, 2009 was 11,719 MW. The capacity of generating units is based upon a number of factors, including the operating experience and physical condition of the units, and may be revised periodically to reflect changes in circumstances. See "Item 2. Properties - Supply Segment" for a description of PPL Energy Supply's plants at December 31, 2009. During 2009, PPL Energy Supply's plants, excluding renewable facilities that are discussed separately below, generated the following amounts of electricity. State Millions of kWh Pennsylvania 46,019 Montana 8,120 Maine 261 Connecticut 108 New York (a) Illinois 64
Total 54,572 (a) 72 million kWhs were excluded as tolling agreements were in place for
100% of the output. Of this generation, 49% of the energy was from coal-fired stations, 32% from nuclear operations at the Susquehanna station, 11% from oil/gas-fired stations and 8% from hydroelectric stations. PPL Energy Supply estimates that, on average, approximately 94% of its total expected annual generation output for 2010 will be used to meet EnergyPlus' committed contractual sales. PPL Energy Supply has also entered into commitments of varying quantities and terms for the years 2011 and beyond. These commitments are consistent with, and integral to, PPL Energy Supply's business strategy to capture profits while managing exposure to adverse movements in energy and fuel prices. See "Commodity Volumetric Activity" in Note 18 to the Financial Statements for the strategies PPL Energy Supply employs to optimize the value of its wholesale and retail energy portfolio. Subsidiaries of PPL Energy Supply controlled existing renewable energy projects located in Pennsylvania, New Jersey, Vermont and New Hampshire with capacity of 28 MW. PPL EnergyPlus sells the energy and RECs produced by these plants to commercial, industrial and institutional customers. During
2009, these projects generated 145 million kWhs. In addition, a PPL Energy Supply subsidiary owns renewable energy facilities with capacity of 6 MW that have power purchase agreements in place. During 2009, these projects generated 23 million kWhs. PPL EnergyPlus also purchases the full output from two wind farms in Pennsylvania with a combined capacity of 50 MW. Fuel Supply Coal Pennsylvania PPL Generation, by and through its agent PPL EnergyPlus, actively manages PPL's coal requirements by purchasing coal principally from mines located in central and northern Appalachia. During 2009, PPL Generation, by and through its agent PPL EnergyPlus, purchased 100% of the coal delivered to PPL Generation's wholly owned Pennsylvania stations under short-term and long-term contracts. These contracts provided PPL Generation 7.3 million tons of coal. Contracts currently in place are expected to provide 7.8 million tons in 2010. The amount of coal in inventory varies from time to time depending on market conditions and plant operations. PPL Generation, by and through its agent PPL EnergyPlus, entered into a long-term coal purchase agreement with CONSOL Energy Inc. The contract will provide more than one-third of PPL Generation's projected annual coal needs for the Pennsylvania power plants from 2010 through 2018. PPL Generation has other contracts that, in total, will provide additional coal supply for PPL's projected annual needs from 2010 through 2013. A PPL Generation subsidiary owns a 12.34% interest in the Keystone station and a 16.25% interest in the Conemaugh station. The Keystone station contracts with Keystone Fuels, LLC for its coal requirements. In 2009, Keystone Fuels, LLC provided 4.8 million tons of coal to the Keystone station. The Conemaugh station requirements are purchased under contract from Conemaugh Fuels, LLC. In 2009, Conemaugh Fuels, LLC provided 4.8 million tons of coal to the Conemaugh station. A PPL Generation subsidiary also owns a 12.34% equity interest in Keystone Fuels, LLC and a 16.25% equity interest in Conemaugh Fuels, LLC. Scrubbers were placed in service at Montour in 2008 and at Brunner Island in 2009. At December 31, 2009, scrubbers were in place at all of PPL Generation's Pennsylvania coal stations. Contracts are in place for all the limestone requirements for all the scrubbers at PPL Generation's wholly owned Pennsylvania coal stations through 2010. It is projected that annual limestone requirements will be approximately 600,000 tons. During 2009, approximately 325,000 tons of limestone were delivered to PPL Generation's wholly owned Pennsylvania stations under long-term contracts.
4
Montana PPL Montana has a 50% leasehold interest in Colstrip Units 1 and 2, and a 30% leasehold interest in Colstrip Unit 3. NorthWestern owns a 30% leasehold interest in Colstrip Unit 4. PPL Montana and NorthWestern have a sharing agreement to govern each party's responsibilities regarding the operation of Colstrip Units 3 and 4, and each party is responsible for 15% of the respective operating and construction costs, regardless of whether a particular cost is specified to Colstrip Unit 3 or 4. However, each party is responsible for its own fuel-related costs. PPL Montana, along with the other owners, is party to contracts to purchase 100% of its coal requirements with defined coal quality characteristics and specifications. In 2007, PPL Montana entered into a long-term purchase and supply agreement with the current supplier for Units 1 and 2 beginning January 1, 2010. The contract is to provide these units 100% of their coal requirements through December 2014, and at least 85% of such requirements from January 2015 through December 2019. The coal supply contract for Unit 3's requirements is in effect through December 2019. Scrubbers are in place at all of these units. Coal supply contracts are in place to purchase low-sulfur coal with defined quality characteristics and specifications for PPL Montana's Corette station. The contracts covered 100% of the station's coal requirements in 2009, and similar contracts are currently in place to supply 100% of the expected coal requirements through 2012. Oil and Natural Gas Pennsylvania PPL Generation's Martins Creek Units 3 and 4 burn both oil and natural gas. PPL EnergyPlus is responsible for procuring the oil and natural gas supply for all PPL Generation operations. During 2009, 100% of the physical gas and oil requirements for the Martins Creek units were purchased on the spot market. At December 31, 2009, PPL EnergyPlus had no long-term agreements for oil or gas. PPL EnergyPlus has a short-term and long-term gas transportation contract in place for approximately 30% of the maximum daily requirements of the Lower Mt. Bethel facility. In 2008, PPL EnergyPlus acquired the rights to an existing long-term tolling agreement associated with the capacity and energy of the Ironwood facility. PPL EnergyPlus has long-term transportation contracts to serve approximately 25% of Ironwood's maximum daily requirements, which begins in the fourth quarter of 2010. For the first three quarters of 2010, Ironwood will be served through a combination of transportation capacity release transactions and delivered supply to the plant. PPL EnergyPlus currently has no long-term physical supply agreements to purchase natural gas for Ironwood.
Illinois At December 31, 2009, there were no long-term delivery or supply agreements to purchase natural gas for the University Park facility. Connecticut PPL EnergyPlus has a long-term contract for approximately 40% of the expected pipeline transportation requirements of the Wallingford facility, but has no long-term physical supply agreement to purchase natural gas. Nuclear The nuclear fuel cycle consists of several material and service components: the mining and milling of uranium ore to produce uranium concentrates; the conversion of these concentrates into uranium hexafluoride, a gas component; the enrichment of the hexafluoride gas; the fabrication of fuel assemblies for insertion and use in the reactor core; and the temporary storage and final disposal of spent nuclear fuel. PPL Susquehanna has a portfolio of supply contracts, with varying expiration dates, for nuclear fuel materials and services. These contracts are expected to provide sufficient fuel to permit Unit 1 to operate into the first quarter of 2016 and Unit 2 to operate into the first quarter of 2015. PPL Susquehanna anticipates entering into additional contracts to ensure continued operation of the nuclear units. Federal law requires the federal government to provide for the permanent disposal of commercial spent nuclear fuel. Under the Federal Nuclear Waste Policy Act, the DOE carried out an analysis of a site in Nevada for a permanent nuclear waste repository. There is no definitive date by which a repository will be operational. As a result, it was necessary to expand Susquehanna's on-site spent fuel storage capacity. To support this expansion, PPL Susquehanna contracted for the design and construction of a spent fuel storage facility employing dry cask fuel storage technology. The facility is modular, so that additional storage capacity can be added as needed. The facility began receiving spent nuclear fuel in 1999. PPL Susquehanna estimates that there is sufficient storage capacity in the spent nuclear fuel pools and the on-site spent fuel storage facility at Susquehanna to accommodate spent fuel discharged through approximately 2017 under current operating conditions. If necessary, the on-site spent fuel storage facility can be expanded, assuming appropriate regulatory approvals are obtained. If additional on-site storage capacity is required, supplementary storage capacity will be pursued. Franchise and Licenses See "Background - Segment Information - Supply Segment - Energy Marketing" for a discussion of PPL EnergyPlus' licenses in various states. PPL EnergyPlus also has an export license from the DOE to sell capacity and/or energy to electric utilities in Canada.
5
PPL Susquehanna operates Units 1 and 2 pursuant to NRC operating licenses. In November 2009, the NRC approved PPL Susquehanna's application for 20-year license renewals for each of the Susquehanna units, extending the license expiration dates to 2042 for Unit 1 and to 2044 for Unit 2. See Note 8 to the Financial Statements for additional information. In 2008, PPL Susquehanna received NRC approval for its request to increase the generation capacity of the Susquehanna nuclear plant. The total expected capacity increase is 159 MW, of which PPL Susquehanna's 90% ownership share would be 143 MW. The first uprate for Unit 1 totaling 50 MW was completed in 2008 and the second uprate is scheduled to be completed in 2010. The first uprate for Unit 2 totaling 50 MW was completed in 2009, and the second uprate is scheduled to be completed in 2011. The remaining total capacity increase is 59 MW, of which PPL Susquehanna's share is 53 MW. PPL Susquehanna's share of the expected capital cost for the total uprate of 143 MW is $345 million. In October 2008, a PPL subsidiary submitted a COLA to the NRC for a new nuclear generating unit (Bell Bend) to be built adjacent to the Susquehanna plant. The COLA was accepted for review by the NRC in December 2008. In May 2009, the NRC published its official review schedule that culminates with the issuance of Bell Bend's final safety evaluation report in 2012. See Note 8 to Financial Statements for additional information. PPL Holtwood operates the Holtwood hydroelectric generating station pursuant to a license that was recently extended by the FERC to expire in 2030. PPL Holtwood operates the Wallenpaupack hydroelectric generating station pursuant to a license renewed by the FERC in 2005 and expiring in 2044. PPL Holtwood also owns one-third of the capital stock of Safe Harbor Water Power Corporation (Safe Harbor), which holds a project license that extends the operation of its hydroelectric generating station until 2030. The total capacity of the Safe Harbor generating station is 421 MW, and PPL Holtwood is entitled by contract to one-third of the total capacity. In 2007, PPL requested FERC approval to expand its Holtwood plant by 125 MW. In 2008, PPL withdrew the application in light of prevailing economic conditions, including the high cost of capital and projections of future energy prices. PPL reconsidered its Holtwood expansion project in view of the tax incentives and potential loan guarantees for renewable energy projects contained in the Economic Stimulus Package. In April 2009, PPL resubmitted the expansion application to FERC and in October 2009, the FERC approved the request to expand the plant and extended the operating license through August 2030. See Note 8 to the Financial Statements for additional information. The 11 hydroelectric facilities and one storage reservoir in Montana are licensed by the FERC. These licenses expire periodically and the generating facilities must be relicensed at such times. The FERC license for the Mystic facility expired in 2009 but has been extended, effective January 1, 2010, for an additional 40-year term. The Thompson Falls and Kerr licenses expire in 2025 and 2035, respectively; and the licenses for the nine Missouri-Madison facilities expire in 2040.
In connection with the relicensing of these generation facilities, the FERC may, under applicable law, relicense the original licensee or license a new licensee, or the U.S. government may take over the facility. If the original licensee is not relicensed, it is compensated for its net investment in the facility, not to exceed the fair value of the property taken, plus reasonable damages to other property affected by the lack of relicensing. • Pennsylvania Delivery Segment - Includes the regulated electric delivery operations of PPL
Electric. PPL Electric PPL Electric delivers electricity to approximately 1.4 million customers in a 10,000-square mile territory in 29 counties of eastern and central Pennsylvania. The largest cities in this territory are Allentown, Bethlehem, Harrisburg, Hazleton, Lancaster, Scranton, Wilkes-Barre and Williamsport. PPL Electric is the sole electricity distribution provider in its service territory, and also provides electricity supply in that territory as a PLR. As part of the PUC Final Order, PPL Electric agreed to supply this electricity at predetermined capped rates through 2009. PPL Electric entered into two contracts to purchase electricity from PPL EnergyPlus sufficient for PPL Electric to meet its PLR obligation through 2009 at the capped rates. As discussed below, PPL Electric's PLR obligation after 2009 is governed by the PUC pursuant to the Public Utility Code as amended by Act 129, PLR regulations and a policy statement regarding interpretation and implementation of those regulations. Both the regulations and the policy statement became effective in September 2007. The PUC has approved PPL Electric's procurement plans for 2010 and for the period from January 2011 through May 2013. Refer to Notes 14 and 15 to the Financial Statements for additional information. During 2009, about 98% of PPL Electric's operating revenues were derived from regulated electricity delivery and supply as a PLR. The remaining 2009 operating revenues were from wholesale revenues, primarily the sale to PPL EnergyPlus of power purchased from NUGs. During 2009, about 46% of electricity delivery and PLR revenues were from residential customers, 37% from commercial customers, 16% from industrial customers and 1% from other customer classes. PPL Electric's transmission facilities are operated as part of PJM, which operates the electric transmission network and electric energy market in the mid-Atlantic and Midwest regions of the U.S. Bulk electricity is transmitted to wholesale users throughout a geographic area including all or part of Delaware, Illinois, Indiana, Kentucky, Maryland, Michigan, New Jersey, North Carolina, Ohio, Pennsylvania, Tennessee, Virginia, West Virginia and the District of Columbia. As of January 1, 2006, PPL Electric became a member of the RFC. The purpose of the RFC is to preserve and enhance electric service reliability and security for the interconnected electric systems within its territory and to be a regional entity under the framework of the NERC. The RFC's key functions are the development of regional standards for reliable planning and operation of the bulk
6
electric system and non-discriminatory compliance monitoring and enforcement of both NERC and regional standards. PJM serves as a FERC-approved RTO in order to promote greater participation and competition in the region. An RTO, like an ISO, is a designation provided by the FERC to a FERC-approved independent entity that operates the transmission system and typically administers a competitive power market. PJM also administers regional markets for energy, capacity and ancillary services. A primary purpose of the RTO/ISO is to separate the operation of, and access to, the transmission grid from market participants that buy or sell electricity in the same markets. Electric utilities continue to own the transmission assets, but the RTO/ISO directs the control and operation of the transmission facilities. PPL Electric is entitled to fully recover from retail customers the charges that it pays to PJM for transmission-related services. PJM imposes these charges pursuant to its FERC-approved Open Access Transmission Tariff. PPL Electric is subject to regulation as a public utility by the PUC, and certain of its activities are subject to the jurisdiction of the FERC under the Federal Power Act. PPL Electric also is subject to the jurisdiction of certain federal, regional, state and local regulatory agencies with respect to land use and other environmental matters. Certain operations of PPL Electric are subject to the Occupational Safety and Health Act of 1970 and comparable state statutes. In November 2004, Pennsylvania enacted the Alternative Energy Portfolio Standard (the AEPS), which requires electric distribution companies, such as PPL Electric, and retail electric suppliers serving retail load to ultimately provide 18% of the electricity sold to retail customers in Pennsylvania from alternative energy sources by 2020. Under this state law, alternative energy sources include hydro, wind, solar, waste coal, landfill methane and fuel cells. An electric distribution company will pay an alternative compliance payment of $45 (or, in the case of solar, 200% of the average market value of solar credits) for each MWh that it is short of its required alternative energy supply percentage. PPL Electric became subject to the requirements of this legislation beginning in 2010. In 2010, PPL Electric is required to supply about 9% of the total amount of electricity it delivers to its PLR customers from alternative energy sources. PPL Electric has purchased all of the supply required to meet its 2010 default service obligations pursuant to a PUC-approved Competitive Bridge Plan (the Plan). Under the Plan, PPL Electric obtained full requirements service which includes the generation or credits that PPL Electric will need to comply with the AEPS in 2010. Act 129 became effective in October 2008. The law creates an energy efficiency and conservation program and smart metering technology requirements, adopts new PLR electricity supply procurement rules, provides remedies for market misconduct, and makes changes to the existing AEPS. See "Regulatory Issues - Pennsylvania Activities" in Note 14 to the Financial Statements for additional information regarding Act 129, other legislative and regulatory impacts and PPL
Electric's actions to provide default electricity supply for periods after 2009. Competition Pursuant to authorizations from the Commonwealth of Pennsylvania and the PUC, PPL Electric operates a regulated distribution monopoly in its service area. Accordingly, PPL Electric does not face competition in its electricity distribution business. Effective January 1, 2010, PPL Electric's rates for generation supply as a PLR are no longer capped and the cost of electric generation is based on a competitive solicitation process. Prior to the expiration of the generation rate caps, PPL Electric's customers' interest in purchasing generation supply from other providers was limited because, in recent years, the long-term supply agreement between PPL Electric and PPL EnergyPlus provided a below-market cost of generation supply for these customers. As a result, a limited amount of "shopping" occurred. In 2010, several alternative suppliers have offered to provide generation supply in PPL Electric's service territory. When its customers purchase supply from these alternative suppliers or from PPL Electric as PLR, the purchase of such supply has no significant impact on the operating results of PPL Electric. The cost to purchase PLR supply is passed directly by PPL Electric to its customers without markup. PPL Electric remains the distribution provider for all the customers in its service territory and charges a regulated rate for the service of delivering that electricity. Provider of Last Resort Supply The Customer Choice Act requires electric distribution companies, like PPL Electric, to act as a PLR of electricity supply and provides that electricity supply costs will be recovered by such companies pursuant to regulations established by the PUC. In May 2007, the PUC approved PPL Electric's plan to procure default electricity supply for 2010 - after its current supply agreements with PPL EnergyPlus expire - for retail customers who do not choose an alternative competitive supplier. Pursuant to this plan, PPL Electric completed six competitive supply solicitations and has contracted for all of the 2010 electricity supply it expects to need for residential, small commercial and small industrial customers. In October 2009, PPL Electric purchased supply for fixed-price default service to large commercial and large industrial customers who elect to take that service in 2010. In November 2009, PPL Electric purchased supply to provide hourly default service to large commercial and industrial customers in 2010. See "Energy Purchase Commitments" in Note 14 to the Financial Statements for additional information regarding PPL Electric's solicitations for 2010 and its actions to provide default electricity supply for periods after 2010. Franchise and Licenses PPL Electric is authorized to provide electric public utility service throughout its service area as a result of grants by the Commonwealth of Pennsylvania in corporate charters to PPL Electric and companies to which it has succeeded and as a result
7
of certification by the PUC. PPL Electric is granted the right to enter the streets and highways by the Commonwealth subject to certain conditions. In general, such conditions have been met by ordinance, resolution, permit, acquiescence or other action by an appropriate local political subdivision or agency of the Commonwealth. • International Delivery Segment - Includes WPD, a regulated electricity distribution company
in the U.K. WPD, through indirect wholly owned subsidiaries, operates two of the 15 distribution networks providing electricity service in the U.K. The WPD subsidiaries together serve approximately 2.6 million end-users in the U.K. WPD (South West) serves 1.5 million customers in a 5,560 square mile area of southwest England. WPD (South Wales) serves an area of Wales opposite the Bristol Channel from WPD (South West)'s territory. Its 1.1 million customers occupy 4,550 square miles within Wales. WPD is headquartered in Bristol, England. See "Franchise and Licenses" for additional information about WPD's regulator, Ofgem, which sets price controls and grants distribution licenses. Competition Although WPD operates in non-exclusive concession areas in the U.K., it currently faces little competition with respect to residential customers. See "Franchises and Licenses" for more information. Franchise and Licenses WPD is authorized by the U.K. government to provide electric distribution services within its concession areas and service territories, subject to certain conditions and obligations. For instance, WPD is subject to governmental regulation of the prices it can charge and the quality of service it must provide, and WPD can be fined or have its licenses revoked if it does not meet the mandated standard of service. WPD operates under distribution licenses granted, and price controls set, by Ofgem. The price control formula that governs WPD's allowed revenue is normally determined every five years. Ofgem completed a rate review in December 2009 for the five-year period from April 1, 2010 through March 31, 2015. See PPL's and PPL Energy Supply's "Results of Operations - Segment Results - International Delivery Segment" in "Item 7. Management's Discussion and Analysis of Financial Condition and Results of Operations" for additional information. SEASONALITY Demand for and market prices of electricity are affected by weather. As a result, PPL's overall operating results in the future may fluctuate substantially on a seasonal basis, especially when more severe weather conditions such as heat waves or winter storms make such fluctuations more pronounced. The pattern of this fluctuation may change depending on the type and location
of the facilities PPL owns and the terms of its contracts to purchase or sell electricity. FINANCIAL CONDITION See PPL's, PPL Energy Supply's and PPL Electric's "Item 7. Management's Discussion and Analysis of Financial Condition and Results of Operations" for this information. CAPITAL EXPENDITURE REQUIREMENTS See "Financial Condition - Liquidity and Capital Resources - Forecasted Uses of Cash - Capital Expenditures" in PPL's, PPL Energy Supply's and PPL Electric's "Item 7. Management's Discussion and Analysis of Financial Condition and Results of Operations" for information concerning projected capital expenditure requirements for the years 2010-2012. See Note 14 to the Financial Statements for additional information concerning the potential impact on capital expenditures from environmental matters. ENVIRONMENTAL MATTERS PPL and certain PPL subsidiaries, including PPL Electric and PPL Generation subsidiaries, are subject to certain existing and developing federal, regional, state and local laws and regulations with respect to air and water quality, land use and other environmental matters. See PPL's and PPL Energy Supply's "Financial Condition - Liquidity and Capital Resources" in "Item 7. Management's Discussion and Analysis of Financial Condition and Results of Operations - Forecasted Uses of Cash - Capital Expenditures" for information concerning environmental capital expenditures during 2009 and projected environmental capital expenditures for the years 2010-2012. See "Environmental Matters" in Note 14 to the Financial Statements for information regarding these laws and regulations and the status of PPL's and its subsidiaries' compliance and remediation activities, as well as legal and regulatory proceedings involving PPL and its subsidiaries. PPL and its subsidiaries are unable to predict the ultimate effect of evolving environmental laws and regulations upon their existing and proposed facilities and operations and competitive positions. In complying with statutes, regulations and actions by regulatory bodies involving environmental matters, including, among other things, air and water quality, greenhouse gas emissions, hazardous and solid waste management and disposal, and regulation of toxic substances, PPL's subsidiaries may be required to modify, replace or cease operating certain of their facilities. PPL's subsidiaries may also incur significant capital expenditures and operating expenses in amounts which are not now determinable, but could be significant. EMPLOYEE RELATIONS As of December 31, 2009, PPL and its subsidiaries had the following full-time employees.
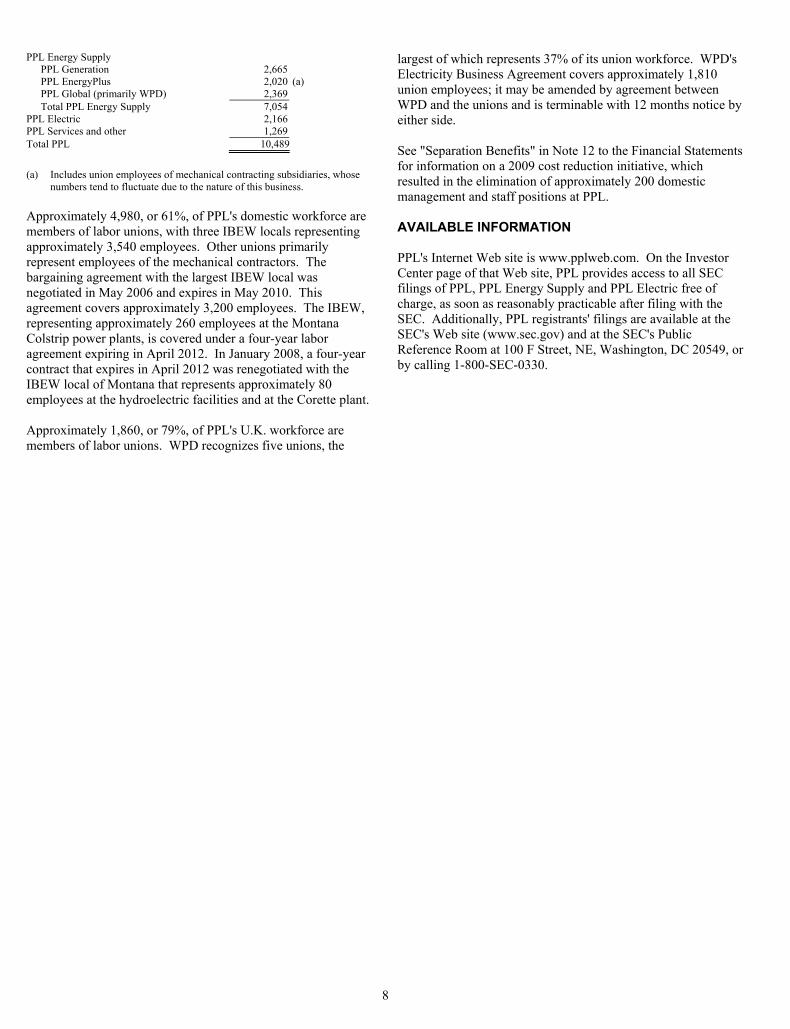
8
PPL Energy Supply PPL Generation 2,665 PPL EnergyPlus 2,020 (a) PPL Global (primarily WPD) 2,369 Total PPL Energy Supply 7,054
PPL Electric 2,166 PPL Services and other 1,269 Total PPL 10,489
(a) Includes union employees of mechanical contracting subsidiaries, whose
numbers tend to fluctuate due to the nature of this business. Approximately 4,980, or 61%, of PPL's domestic workforce are members of labor unions, with three IBEW locals representing approximately 3,540 employees. Other unions primarily represent employees of the mechanical contractors. The bargaining agreement with the largest IBEW local was negotiated in May 2006 and expires in May 2010. This agreement covers approximately 3,200 employees. The IBEW, representing approximately 260 employees at the Montana Colstrip power plants, is covered under a four-year labor agreement expiring in April 2012. In January 2008, a four-year contract that expires in April 2012 was renegotiated with the IBEW local of Montana that represents approximately 80 employees at the hydroelectric facilities and at the Corette plant. Approximately 1,860, or 79%, of PPL's U.K. workforce are members of labor unions. WPD recognizes five unions, the
largest of which represents 37% of its union workforce. WPD's Electricity Business Agreement covers approximately 1,810 union employees; it may be amended by agreement between WPD and the unions and is terminable with 12 months notice by either side. See "Separation Benefits" in Note 12 to the Financial Statements for information on a 2009 cost reduction initiative, which resulted in the elimination of approximately 200 domestic management and staff positions at PPL. AVAILABLE INFORMATION PPL's Internet Web site is www.pplweb.com. On the Investor Center page of that Web site, PPL provides access to all SEC filings of PPL, PPL Energy Supply and PPL Electric free of charge, as soon as reasonably practicable after filing with the SEC. Additionally, PPL registrants' filings are available at the SEC's Web site (www.sec.gov) and at the SEC's Public Reference Room at 100 F Street, NE, Washington, DC 20549, or by calling 1-800-SEC-0330.

9
ITEM 1A. RISK FACTORS
PPL, PPL Energy Supply and PPL Electric face various risks associated with their businesses. While we have identified below the risks we currently consider material, these risks are not the only risks that we face. Additional risks not presently known to us or that we currently deem immaterial may also impair our business operations. Our businesses, financial condition, cash flows or results of operations could be materially adversely affected by any of these risks. In addition, this report also contains forward-looking and other statements about our businesses that are subject to numerous risks and uncertainties. See "Forward-Looking Information," "Item 1. Business," "Item 7. Management's Discussion and Analysis of Financial Condition and Results of Operations" and Note 14 to the Financial Statements for more information concerning the risks described below and for other risks, uncertainties and factors that could impact our businesses and financial results. As used in this Item 1A., the terms "we," "our" and "us" generally refer to PPL and its consolidated subsidiaries taken as a whole, or to PPL Energy Supply and its consolidated subsidiaries taken as a whole within the Supply and International Delivery segment discussions, or PPL Electric and its consolidated subsidiaries taken as a whole within the Pennsylvania Delivery segment discussion. Risks Related to Supply Segment (PPL and PPL Energy Supply) We are exposed to operational, price and credit risks associated with selling and marketing products in the wholesale electricity markets. We purchase and sell electricity in wholesale markets under market-based tariffs authorized by the FERC throughout the U.S. and also enter into short-term agreements to market available electricity and capacity from our generation assets with the expectation of profiting from market price fluctuations. If we are unable to deliver firm capacity and electricity under these agreements, we could be required to pay damages. These damages would generally be based on the difference between the market price to acquire replacement capacity or electricity and the contract price of any undelivered capacity or electricity. Depending on price volatility in the wholesale electricity markets, such damages could be significant. Extreme weather conditions, unplanned generation facility outages, environmental compliance costs, transmission disruptions, and other factors could affect our ability to meet our obligations, or cause significant increases in the market price of replacement capacity and electricity. Our power agreements typically include provisions requiring us to post collateral for the benefit of our counterparties if the market price of energy varies from the contract prices in excess of certain pre-determined amounts. At December 31, 2009, we had posted $242 million of collateral, in the form of letters of credit, under these contracts. At December 31, 2009, we
maintained $4.1 billion of liquidity facilities to provide for potential additional collateral obligations. We currently believe that we have sufficient credit to fulfill our potential collateral obligations under these power contracts. Our obligation to post collateral could exceed the amount of our facilities or our ability to increase our facilities could be limited by financial market or other factors. We also face credit risk that parties with whom we contract will default in their performance, in which case we may have to sell our electricity into a lower-priced market or make purchases in a higher-priced market than existed at the time of contract. Whenever feasible, we attempt to mitigate these risks by various means, including agreements that require our counterparties to post collateral for our benefit if the market price of energy varies from the contract price in excess of certain pre-determined amounts. However, there can be no assurance that we will avoid counterparty nonperformance, which could adversely impact our ability to perform our obligations to other parties, which could in turn subject us to claims for damages. Adverse changes in commodity prices and related costs may decrease our future energy margins, which could adversely affect our earnings and cash flows. Our energy margins, or the amount by which our revenues from the sale of power exceed our costs to supply power, are impacted by changes in market prices for electricity, fuel, fuel transportation, emission allowances, RECs, electricity transmission and related congestion charges and other costs. Unlike most commodities, the limited ability to store electric power requires that it must be consumed at the time of production. As a result, wholesale market prices for electricity may fluctuate substantially over relatively short periods of time and can be unpredictable. Among the factors that influence such prices are: • demand for electricity and supplies of electricity available
from current or new generation resources; • variable production costs, primarily fuel (and the associated
fuel transportation costs) and emission allowance expense for the generation resources used to meet the demand for electricity;
• transmission capacity and service into, or out of, markets served;
• changes in the regulatory framework for wholesale power markets;
• liquidity in the wholesale electricity market, as well as general credit worthiness of key participants in the market; and
• weather and economic conditions impacting demand for electricity or the facilities necessary to deliver electricity.
See Exhibit 99(a) for more information concerning the market fluctuations in wholesale energy, fuel and emission allowance prices over the past five years. The volatility of these business factors has increased significantly with the current economic downturn.

10
Our risk management policy and programs relating to electricity and fuel prices, interest rates, foreign currency and counterparties may not work as planned, and we may suffer economic losses despite such programs. We actively manage the market risk inherent in our generation energy marketing activities, as well as our debt, foreign currency and counterparty credit positions. We have implemented procedures to monitor compliance with our risk management policy and programs, including independent validation of transaction and market prices, verification of risk and transaction limits, portfolio stress test, sensitivity analyses and daily portfolio reporting of various risk management metrics. Nonetheless, our risk management programs may not work as planned. For example, actual electricity and fuel prices may be significantly different or more volatile than the historical trends and assumptions upon which we based our risk management calculations. Additionally, unforeseen market disruptions could decrease market depth and liquidity, negatively impacting our ability to enter into new transactions. We enter into financial contracts to hedge commodity basis risk, and as a result are exposed to the risk that the correlation between delivery points could change with actual physical delivery. Similarly, interest rates or foreign currency exchange rates could change in significant ways that our risk management procedures were not designed to address. As a result, we cannot always predict the impact that our risk management decisions may have on us if actual events result in greater losses or costs than our risk models predict or greater volatility in our earnings and financial position. In addition, our trading, marketing and hedging activities are exposed to counterparty credit risk and market liquidity risk. We have adopted a credit risk management policy and program to evaluate counterparty credit risk. However, if counterparties fail to perform, the risk of which has increased due to the economic downturn, we may be forced to enter into alternative arrangements at then-current market prices. In that event, our financial results are likely to be adversely affected. We do not always hedge against risks associated with electricity and fuel price volatility. We attempt to mitigate risks associated with satisfying our contractual electricity sales obligations by either reserving generation capacity to deliver electricity or purchasing the necessary financial or physical products and services through competitive markets to satisfy our net firm sales contracts. We also routinely enter into contracts, such as fuel and electricity purchase and sale commitments, to hedge our exposure to fuel requirements and other electricity-related commodities. However, based on economic and other considerations, we may not hedge the entire exposure of our operations from commodity price volatility. To the extent we do not hedge against commodity price volatility, our results of operations and financial position may be adversely affected. We face intense competition in our energy supply business, which may adversely affect our ability to operate profitably.
Unlike our regulated delivery businesses, our energy supply business is dependent on our ability to operate in a competitive environment and is not assured of any rate of return on capital investments through a predetermined rate structure. Competition is impacted by electricity and fuel prices, new market entrants, construction by others of generating assets and transmission capacity, technological advances in power generation, the actions of environmental and other regulatory authorities and other factors. These competitive factors may negatively impact our ability to sell electricity and related products and services, as well as the prices that we may charge for such products and services, which could adversely affect our results of operations and our ability to grow our business. We sell our available energy and capacity into the competitive wholesale markets through contracts with various durations. Competition in the wholesale power markets occurs principally on the basis of the price of products and, to a lesser extent, on the basis of reliability and availability. We believe that the commencement of commercial operation of new electric facilities in the regional markets where we own or control generation capacity and the evolution of demand side management resources will continue to increase the competitiveness of the wholesale electricity market in those regions, which could have a material adverse effect on the prices we receive for electricity. We also face competition in the wholesale markets for electricity capacity and ancillary services. We primarily compete with other electricity suppliers based on our ability to aggregate supplies at competitive prices from different sources and to efficiently utilize transportation from third-party pipelines and transmission from electric utilities and ISOs. We also compete against other energy marketers on the basis of relative financial condition and access to credit sources, and our competitors may have greater financial resources than we have. Competitors in the wholesale power markets in which PPL Generation subsidiaries and PPL EnergyPlus operate include regulated utilities, industrial companies, non-utility generators and unregulated subsidiaries of regulated utilities. In the past, PUHCA significantly restricted mergers and acquisitions and other investments in the electric utility sector. Entirely new competitors, including financial institutions, have entered the energy markets as a result of the repeal of PUHCA. The repeal of PUHCA also may lead to consolidation in our industry, resulting in competitors with significantly greater financial resources than we have. Disruptions in our fuel supplies could occur, which could adversely affect our ability to operate our generation facilities. We purchase fuel from a number of suppliers. Disruption in the delivery of fuel and other products consumed during the production of electricity (such as lime, limestone and other chemicals), including disruptions as a result of weather, transportation difficulties, global demand and supply dynamics, labor relations, environmental regulations or the financial viability of our fuel suppliers, could adversely affect our ability to operate our facilities, which could result in lower sales and/or
11
higher costs and thereby adversely affect our results of operations. Despite federal and state deregulation initiatives, our supply business is still subject to extensive regulation, which may increase our costs, reduce our revenues, or prevent or delay operation of our facilities. Our generation subsidiaries sell electricity into the wholesale market. Generally, our generation subsidiaries and our marketing subsidiaries are subject to regulation by the FERC. The FERC has authorized us to sell generation from our facilities and power from our marketing subsidiaries at market-based prices. The FERC retains the authority to modify or withdraw our market-based rate authority and to impose "cost of service" rates if it determines that the market is not competitive, that we possess market power or that we are not charging just and reasonable rates. Any reduction by the FERC in the rates we may receive or any unfavorable regulation of our business by state regulators could materially adversely affect our results of operations. See "FERC Market-Based Rate Authority" in Note 14 to the Financial Statements for information regarding recent court decisions that could impact the FERC's market-based rate authority program, and "PJM RPM Litigation" in Note 14 to the Financial Statements for information regarding the FERC's proceedings that could impact PJM's capacity pricing model. In addition, the acquisition, construction, ownership and operation of electricity generation facilities require numerous permits, approvals, licenses and certificates from federal, state and local governmental agencies. We may not be able to obtain or maintain all required regulatory approvals. If there is a delay in obtaining any required regulatory approvals or if we fail to obtain or maintain any required approval or fail to comply with any applicable law or regulation, the operation of our assets and our sales of electricity could be prevented or delayed or become subject to additional costs. Our generation facilities may not operate as planned, which may increase our expenses or decrease our revenues and, thus, have an adverse effect on our financial performance. Our ability to manage operational risk with respect to our generation plants is critical to our financial performance. Operation of our power plants at expected capacity levels involves many risks, including the breakdown or failure of equipment or processes, accidents, labor disputes and fuel interruption. In addition, weather and natural disasters can disrupt our generation plants. Weather conditions also have a direct impact on the river flows required to operate our hydroelectric plants at expected capacity levels. Depending on the timing and duration of both planned and unplanned, complete or partial outages at our power plants (in particular, if such outages are during peak periods or during periods of, or caused by, severe weather), or if our planned uprates at power plants are not completed as scheduled, our revenues from expected energy sales could significantly decrease and our expenses significantly increase, and we could be required to purchase power at then-current market prices to satisfy our energy sales commitments or, in the alternative, pay penalties and damages for failure to satisfy them. Many of our generating
units are reaching mid-life, and we face the potential for more frequent unplanned outages and the possibility of planned outages of longer duration to accommodate significant investments in major component replacements at these facilities. Changes in technology may negatively impact the value of our power plants. A basic premise of our business is that generating electricity at central power plants achieves economies of scale and produces electricity at relatively low prices. There are alternate technologies to produce electricity, most notably fuel cells, microturbines, windmills and photovoltaic (solar) cells, the development of which has been expanded due to global climate change concerns. Research and development activities are ongoing to seek improvements in alternate technologies. It is possible that advances will reduce the cost of alternate methods of electricity production to a level that is equal to or below that of certain central station production. Also, as new technologies are developed and become available, the quantity and pattern of electricity usage (the "demand") by customers could decline, with a corresponding decline in revenues derived by generators. These alternative energy sources could result in a decline to the dispatch and capacity factors of our plants. As a result of all of these factors, the value of our generation facilities could be significantly reduced. The load following contracts that PPL EnergyPlus is awarded do not provide for specific levels of load and actual load significantly below or above our forecasts could adversely affect our energy margins. We generally hedge our load following obligations with energy purchases from third parties, and to a lesser extent with its owned generation. If the actual load is significantly lower than the expected load, we may be required to resell power at a lower price than was purchased to supply the load obligation, resulting in a financial loss. Alternatively, a significant increase in load could adversely affect our energy margins because we are required under the terms of the load following contracts to provide the energy necessary to fulfill increased demand at the contract price, which could be lower than the cost to procure additional energy on the open market. Therefore, any significant decrease or increase in load compared to our forecasts, could have a material adverse effect on our results of operations or financial position. Our earnings may be affected by whether we decide to, or are able to, continue to enter into or renew long-term power sale, fuel purchase and fuel transportation agreements to mitigate market price and supply risk. As a result of the PLR contracts and certain other agreements, a substantial portion of our generation production and capacity value was committed through 2009 under power sales agreements of various terms that included fixed prices for electric power. With the expiration of these agreements we have been actively selling our generation at fixed prices in the wholesale energy market and participating in load-following or full requirements auctions with utility companies in the PJM,
12
New England Power Pool and Midwest ISO regions. In connection with these activities, we have entered into longer-term fuel purchase and fuel transportation agreements that include fixed prices for a significant portion of our forecasted needs. Whether we decide to, or are able to, continue to enter into such agreements or renew existing agreements in the future, prevailing market conditions will affect our financial performance. For example, in the absence of long-term power sales agreements, we would sell the energy, capacity and other products from our facilities in the competitive wholesale power markets under contracts of shorter duration at then-current market prices. Current forward prices for electricity are lower than the prices under some of our existing power sales agreements. In addition, if we do not secure or maintain favorable fuel purchase and transportation agreements for our power generation facilities, our fuel costs (and associated fuel transportation costs) could exceed the revenues we derive from our energy sales. Given the volatility and potential for material differences between actual electricity prices and fuel and other costs, if we do not secure or maintain long-term electricity sales and fuel purchase and fuel transportation agreements, our margins will be subject to increased volatility and, depending on future electricity and fuel costs (and associated fuel transportation costs), our financial results may be materially adversely affected. If market deregulation is reversed or discontinued, our business prospects and financial condition could be materially adversely affected. In some markets, state legislators, government agencies and other interested parties have made proposals to change the use of market-based pricing, re-regulate areas of these markets that have previously been deregulated or permit electricity delivery companies to construct or acquire generating facilities. The ISOs that oversee the transmission systems in certain wholesale electricity markets have from time to time been authorized to impose price limitations and other mechanisms to address volatility in the power markets. These types of price limitations and other mechanisms may reduce profits that our wholesale power marketing and trading business would have realized under competitive market conditions absent such limitations and mechanisms. Although we generally expect electricity markets to continue to be competitive, other proposals to re-regulate our industry may be made, and legislative or other action affecting the electric power restructuring process may cause the process to be delayed, discontinued or reversed in states in which we currently, or may in the future, operate. We rely on transmission and distribution assets that we do not own or control to deliver our wholesale electricity. If transmission is disrupted, or not operated efficiently, or if capacity is inadequate, our ability to sell and deliver power may be hindered. We depend on transmission and distribution facilities owned and operated by utilities and other energy companies to deliver the electricity and natural gas we sell to the wholesale market, as well as the natural gas we purchase for use in our electric generation facilities. If transmission is disrupted (as a result of
weather, natural disasters or other reasons) or not operated efficiently by ISOs, in applicable markets, or if capacity is inadequate, our ability to sell and deliver products and satisfy our contractual obligations may be hindered, or we may be unable to sell products on the most favorable terms. The FERC has issued regulations that require wholesale electric transmission services to be offered on an open-access, non-discriminatory basis. Although these regulations are designed to encourage competition in wholesale market transactions for electricity, there is the potential that fair and equal access to transmission systems will not be available or that transmission capacity will not be available in the amounts we desire. We cannot predict the timing of industry changes as a result of these initiatives or the adequacy of transmission facilities in specific markets or whether ISOs in applicable markets will efficiently operate transmission networks and provide related services. Our costs to comply with existing and new environmental laws are expected to continue to be significant, and we plan to incur significant capital expenditures for pollution control improvements that, if delayed, would adversely affect our profitability and liquidity. Our business is subject to extensive federal, state and local statutes, rules and regulations relating to environmental protection. To comply with existing and future environmental requirements and as a result of voluntary pollution control measures we may take, we have spent and expect to spend substantial amounts in the future on environmental control and compliance. In order to comply with existing and recently enacted federal and state environmental laws and regulations primarily governing air emissions from coal-fired plants, in 2005 PPL began a program to install scrubbers and other pollution control equipment (primarily aimed at sulfur dioxide, particulate and nitrogen oxides with co-benefits for mercury emissions reduction). The cost to install this equipment was approximately $1.6 billion, of which $19 million remains to be spent. The remaining unspent balance is included in the 2010 through 2012 capital budget. The scrubbers at our Montour and Brunner Island plants are now in service. Many states and environmental groups have challenged certain federal laws and regulations relating to air emissions as not being sufficiently strict. As a result, it is possible that state and federal regulations will be adopted that impose more stringent restrictions than are currently in effect, which could require us to significantly increase capital expenditures for pollution control equipment. We may not be able to obtain or maintain all environmental regulatory approvals necessary for our planned capital projects or which are otherwise necessary to our business. If there is a delay in obtaining any required environmental regulatory approval or if we fail to obtain, maintain or comply with any such approval, operations at our affected facilities could be halted or subjected to additional costs. Furthermore, at some of our older generating facilities it may be uneconomic for us to install necessary equipment, which could cause us to close those units.
13
Additionally, the expanding national and international focus on climate change and the related desire to reduce carbon dioxide and other greenhouse gas emissions has lead to numerous federal legislative and regulatory proposals, and several states already have passed legislation capping carbon dioxide emissions. The continuation of this trend may heighten or make more likely the risks identified above. For more information regarding environmental matters, including existing and proposed federal, state and local statutes, rules and regulations to which we are subject, see "Environmental Matters - Domestic" in Note 14 to the Financial Statements. We are subject to the risks of nuclear generation, including the risk that our Susquehanna nuclear plant could become subject to revised security or safety requirements that would increase our capital and operating expenditures, and uncertainties associated with decommissioning our plant at the end of its licensed life. Nuclear generation accounted for about 32% of our 2009 generation output. The risks of nuclear generation generally include: • the potential harmful effects on the environment and human
health from the operation of nuclear facilities and the storage, handling and disposal of radioactive materials;
• limitations on the amounts and types of insurance commercially available to cover losses and liabilities that might arise in connection with nuclear operations; and
• uncertainties with respect to the technological and financial aspects of decommissioning nuclear plants at the end of their licensed lives. The licenses for our two nuclear units expire in 2042 and 2044. See Note 20 to the Financial Statements for additional information on the ARO related to the decommissioning.
The NRC has broad authority under federal law to impose licensing requirements, including security, safety and employee-related requirements for the operation of nuclear generation facilities. In the event of noncompliance, the NRC has authority to impose fines or shut down a unit, or both, depending upon its assessment of the severity of the situation, until compliance is achieved. In addition, revised security or safety requirements promulgated by the NRC could necessitate substantial capital or operating expenditures at our Susquehanna nuclear plant. In addition, although we have no reason to anticipate a serious nuclear incident at our Susquehanna plant, if an incident did occur, any resulting operational loss, damages and injuries could have a material adverse effect on our results of operations, cash flows or financial condition. Risks Related to International Delivery Segment (PPL and PPL Energy Supply) Our U.K. delivery business is subject to risks with respect to rate regulation and operational performance.
Our U.K. delivery business is rate regulated and operates under an incentive-based regulatory framework. In addition, its ability to manage operational risk is critical to its financial performance. Disruption to the distribution network could reduce profitability both directly through the higher costs for network restoration and also through the system of penalties and rewards that Ofgem has in place relating to customer service levels. In December 2009, Ofgem completed its rate review for the five-year period from April 1, 2010 through March 31, 2015, thus reducing regulatory rate risk in the International Delivery Segment until the next rate review which will be effective April 1, 2015. The results of the rate review are further discussed in "Item 7. Management's Discussion and Analysis of Financial Condition and Results of Operations - Results of Operations." The regulated income of the International Delivery Segment and also the RAB are to some extent linked to movements in the Retail Price Index (RPI). Reductions in the RPI would adversely impact revenues and the debt/RAB ratio. Our U.K. delivery business exposes us to risks related to U.K. laws and regulations, taxes, economic conditions, foreign currency exchange rate fluctuations, and political conditions and policies of the U.K. government. These risks may reduce the results of operations from our U.K. delivery business. The acquisition, financing, development and operation of projects in the U.K. entail significant financial risks including: • changes in laws or regulations relating to U.K. operations,
including tax laws and regulations; • changes in government policies, personnel or approval
requirements; • changes in general economic conditions affecting the U.K.; • regulatory reviews of tariffs for distribution companies; • severe weather and natural disaster impacts on the electric
sector and our assets; • changes in labor relations; • limitations on foreign investment or ownership of projects and
returns or distributions to foreign investors; • limitations on the ability of foreign companies to borrow
money from foreign lenders and lack of local capital or loans;• fluctuations in currency exchange rates and in converting U.K.
revenues to U.S. dollars, which can increase our expenses and/or impair our ability to meet such expenses, and difficulty moving funds out of the country in which the funds were earned; and
• compliance with U.S. foreign corrupt practices laws. Risks Related to Pennsylvania Delivery Segment (PPL and PPL Electric) Regulators may not approve the rates we request. Our Pennsylvania delivery business is rate-regulated. While such regulation is generally premised on the recovery of prudently incurred costs, including energy supply costs for customers, and a reasonable rate of return on invested capital,

14
the rates that we may charge our delivery customers are subject to authorization of the applicable regulatory authorities. Our Pennsylvania delivery business is subject to substantial capital expenditure requirements over the next several years, which will require rate increase requests to the regulators. There is no guarantee that the rates authorized by regulators will match our actual costs or provide a particular return on invested capital at any given time. Our transmission and distribution facilities may not operate as planned, which may increase our expenses or decrease our revenues and, thus, have an adverse effect on our financial performance. Our ability to manage operational risk with respect to our transmission and distribution systems is critical to the financial performance of our delivery business. Our delivery business also faces several risks, including the breakdown or failure of or damage to equipment or processes (especially due to severe weather or natural disasters), accidents and labor disputes and other factors. Operation of our delivery systems below our expectations may result in lost revenues or increased expenses, including higher maintenance costs. We may be subject to higher transmission costs and other risks as a result of PJM's regional transmission expansion plan (RTEP) process. PJM and the FERC have the authority to require upgrades or expansion of the regional transmission grid, which can result in substantial expenditures for transmission owners. As discussed in Note 8 to the Financial Statements, we expect to make substantial expenditures to construct the Susquehanna-Roseland transmission line that PJM has determined is necessary for the reliability of the regional transmission grid. Although the FERC has granted our request for incentive rate treatment of such facilities, we cannot predict the date when these facilities will be in service or whether delays may occur due to public opposition or other factors. Delays could result in significant cost increases for these facilities and decreased reliability of the regional transmission grid. As a result, we cannot predict the ultimate financial or operational impact of this project or other RTEP projects on PPL Electric. We could be subject to higher costs and/or penalties related to mandatory reliability standards. Under the Energy Policy Act, owners and operators of the bulk power transmission system are now subject to mandatory reliability standards promulgated by the NERC and enforced by the FERC. Compliance with reliability standards may subject us to higher operating costs and/or increased capital expenditures, and violations of these standards could result in substantial penalties. We could be subject to higher costs and/or penalties related to Pennsylvania Conservation and Energy Efficiency Programs. Act 129 became effective in October 2008. This law created requirements for energy efficiency and conservation programs and for the use of smart metering technology, imposed new PLR
electricity supply procurement rules, provided remedies for market misconduct, and made changes to the existing Alternative Energy Portfolio Standard. Utilities not meeting the requirements of Act 129 are subject to significant penalties that cannot be recovered in rates. The law also requires electric utilities to meet specified goals for reduction in customer electricity usage and peak demand by specified dates (2011 and 2013). Although we expect to meet these requirements, numerous factors outside of our control could prevent compliance with these requirements and result in penalties to us. See "Regulatory Issues - Energy Policy Act of 2005 - Reliability Standards" in Note 14 to the Financial Statements for additional information. Rate deregulation remains subject to political risks. Although prior initiatives have not resulted in the enactment of legislation, the possibility remains that certain Pennsylvania legislators could introduce legislation to extend generation rate caps or otherwise limit cost recovery through rates for Pennsylvania utilities after the end of applicable transition periods, which in PPL Electric's case was December 31, 2009. If such legislation were introduced and ultimately enacted, PPL Electric could face severe financial consequences including operating losses and significant cash flow shortfalls. In addition, continuing uncertainty regarding PPL Electric's ability to recover its market supply and other costs of operating its business could adversely affect its credit quality, financing costs and availability of credit facilities necessary to operate its business. Other Risks Related to All Segments (PPL, PPL Energy Supply and PPL Electric) We will selectively pursue growth of generation and transmission and distribution capacity, which involves a number of uncertainties and may not achieve the desired financial results. We will pursue expansion of our generation and transmission and distribution capacity over the next several years through power uprates at certain of our existing power plants, the potential construction of new power plants, the potential acquisition of existing plants, the potential construction or acquisition of transmission and distribution projects and capital investments to upgrade transmission and distribution infrastructure. We will rigorously scrutinize opportunities to expand our generating capability and may determine not to proceed with any expansion. These types of projects involve numerous risks. Any planned power uprates could result in cost overruns, reduced plant efficiency and higher operating and other costs. With respect to the construction of new plants, the acquisition of existing plants, or the construction or acquisition of transmission and distribution projects, we may be required to expend significant sums for preliminary engineering, permitting, resource exploration, legal and other expenses before it can be established whether a project is feasible, economically attractive or capable of being financed. The success of both a new or acquired project would likely be contingent, among other things, upon the negotiation of satisfactory operating contracts,

15
obtaining acceptable financing, maintaining acceptable credit ratings, as well as receipt of required and appropriate governmental approvals. If we were unable to complete construction or expansion of a facility, we would generally be unable to recover our investment in the project. Furthermore, we might be unable to run any new or acquired plants as efficiently as projected, which could result in higher than projected operating and other costs and reduced earnings. The economic and financial markets in which we operate could adversely affect our financial condition and results of operations. In 2008, conditions in the financial markets became disruptive to the processes of managing credit risk, responding to liquidity needs, measuring at fair value derivatives and other financial instruments and managing market risk. The contraction of liquidity in the wholesale energy markets and accompanying significant decline in wholesale energy prices significantly impacted our earnings during the second half of 2008 and the first half of 2009. The breadth and depth of these negative economic conditions had a wide-ranging impact on the U.S. and international business environment, including our businesses, and may continue to do so. As a result of the economic downturn, demand for energy commodities has declined significantly. This reduced demand will continue to impact the key domestic wholesale energy markets we serve (such as PJM) and our Pennsylvania delivery business, especially industrial customer demand. The combination of lower demand for power and natural gas and other fuels has put downward price pressure on the wholesale energy market in general, further impacting our energy marketing results. In general, current economic and commodity market conditions will continue to challenge the predictability regarding our unhedged future energy margins, liquidity and overall financial condition. Our businesses are heavily dependent on credit and capital, among other things, for providing collateral to support hedging in our energy marketing business. Global bank credit capacity was reduced and the cost of renewing or establishing new credit facilities increased significantly in 2008, primarily as a result of general credit concerns nationwide, thereby introducing uncertainties as to our businesses' ability to enter into long-term energy commitments or reliably estimate the longer-term cost and availability of credit. Although bank credit conditions have improved since mid-2009, and we currently expect to have adequate access to needed credit and capital based on current conditions, deterioration in the financial markets could adversely affect our financial condition and liquidity. The current condition of the economic and financial markets in which we operate is expected to continue to impact numerous other aspects of our business operations discussed elsewhere in this Risk Factor section. Our operating results could fluctuate on a seasonal basis, especially as a result of severe weather conditions. Our businesses are subject to seasonal demand cycles. For example, in some markets demand for, and market prices of, electricity peak during hot summer months, while in other
markets such peaks occur in cold winter months. As a result, our overall operating results in the future may fluctuate substantially on a seasonal basis if weather conditions such as heat waves, extreme cold weather or severe storms occur. The patterns of these fluctuations may change depending on the type and location of our facilities and the terms of our contracts to sell electricity. We cannot predict the outcome of the legal proceedings and investigations currently being conducted with respect to our current and past business activities. An adverse determination could have a material adverse effect on our financial condition, results of operations or cash flows. We are involved in legal proceedings, claims and litigation and subject to ongoing state and federal investigations arising out of our business operations, the most significant of which are summarized in "Legal Matters," "Regulatory Issues" and in "Environmental Matters - Domestic" in Note 14 to the Financial Statements. We cannot predict the ultimate outcome of these matters, nor can we reasonably estimate the costs or liability that could potentially result from a negative outcome in each case. We may need significant additional financing to pursue growth opportunities. We continually review potential acquisitions and development projects and may enter into significant acquisition agreements or development commitments in the future. An acquisition agreement or development commitment may require access to substantial capital from outside sources on acceptable terms. We also may need external financing to fund capital expenditures, including capital expenditures necessary to comply with environmental or other regulatory requirements. Our ability to arrange financing and our cost of capital are dependent on numerous factors, including general economic conditions, credit availability and our financial performance. The inability to obtain sufficient financing on terms that are acceptable to us could adversely affect our ability to pursue acquisition and development opportunities and fund capital expenditures. A downgrade in our credit ratings could negatively affect our ability to access capital and increase the cost of maintaining our credit facilities and any new debt. Our current credit ratings by Moody's, Fitch and S&P, including a January 2009 review by S&P that resulted in a negative outlook for us, are listed in "Item 7. Management's Discussion and Analysis of Financial Condition and Results of Operations - Financial Condition - Liquidity and Capital Resources - Credit Ratings." While we do not expect these ratings to limit our ability to fund short-term liquidity needs or access new long-term debt, any ratings downgrade could increase our short-term borrowing costs and negatively affect our ability to fund short-term liquidity needs and access new long-term debt. See "Item 7. Management's Discussion and Analysis of Financial Condition and Results of Operations - Financial Condition - Liquidity and Capital Resources - Ratings Triggers" for additional information on the impact of a downgrade in our credit rating.
16
Significant increases in our operation and maintenance expenses, including health care and pension costs, could adversely affect our future earnings and liquidity. We continually focus on limiting and reducing where possible our operation and maintenance expenses. However, we expect to continue to face increased cost pressures in our operations. Increased costs of materials and labor may result from general inflation, increased regulatory requirements, especially in respect of environmental protection, the need for higher cost expertise in the workforce or other factors. In addition, pursuant to collective bargaining agreements, we are contractually committed to provide specified levels of health care and pension benefits to certain current employees and retirees. We provide a similar level of benefits to our management employees. These benefits give rise to significant expenses. Due to general inflation with respect to such costs, the aging demographics of our workforce and other factors, we have experienced significant health care cost inflation in recent years, and we expect our health care costs, including prescription drug coverage, to continue to increase despite measures that we have taken and expect to take to require employees and retirees to bear a higher portion of the costs of their health care benefits. In addition, we expect to continue to incur significant costs with respect to the defined benefit pension plans for our employees and retirees. The measurement of our expected future health care and pension obligations, costs and liabilities is highly dependent on a variety of assumptions, most of which relate to factors beyond our control. These assumptions include investment returns, interest rates, health care cost trends, benefit improvements, salary increases and the demographics of plan participants. If our assumptions prove to be inaccurate, our future costs and cash
contribution requirements to fund these benefits could increase significantly. There is a risk that we may be required to record impairment charges in the future for certain of our investments, which could adversely affect our earnings. Under GAAP, we are required to test our recorded goodwill for impairment on an annual basis, or more frequently if events or circumstances indicate that these assets may be impaired. Although no goodwill impairments were recorded based on our annual review in the fourth quarter of 2009, we are unable to predict whether future impairment charges may be necessary. We also review our long-lived assets for impairment when events or circumstances indicate that the carrying value of these assets may not be recoverable. During 2009, PPL recorded impairment charges related to certain sulfur dioxide emission allowances and the Long Island generation business that is being sold. During 2008, PPL recorded impairment charges related to a cancelled hydroelectric expansion project, certain emission allowances and its natural gas distribution and propane businesses that were sold in 2008. During 2007, PPL impaired certain transmission rights, certain domestic telecommunications assets, certain assets of the natural gas distribution and propane businesses, and the net assets of our Bolivian businesses prior to their sale in 2007. See Notes 8, 9 and 17 to the Financial Statements for additional information on these charges. We are unable to predict whether impairment charges, or other losses on sales of other assets or businesses, may occur in future years.
ITEM 1B. UNRESOLVED STAFF COMMENTS
PPL Corporation, PPL Energy Supply, LLC and PPL Electric Utilities Corporation None.
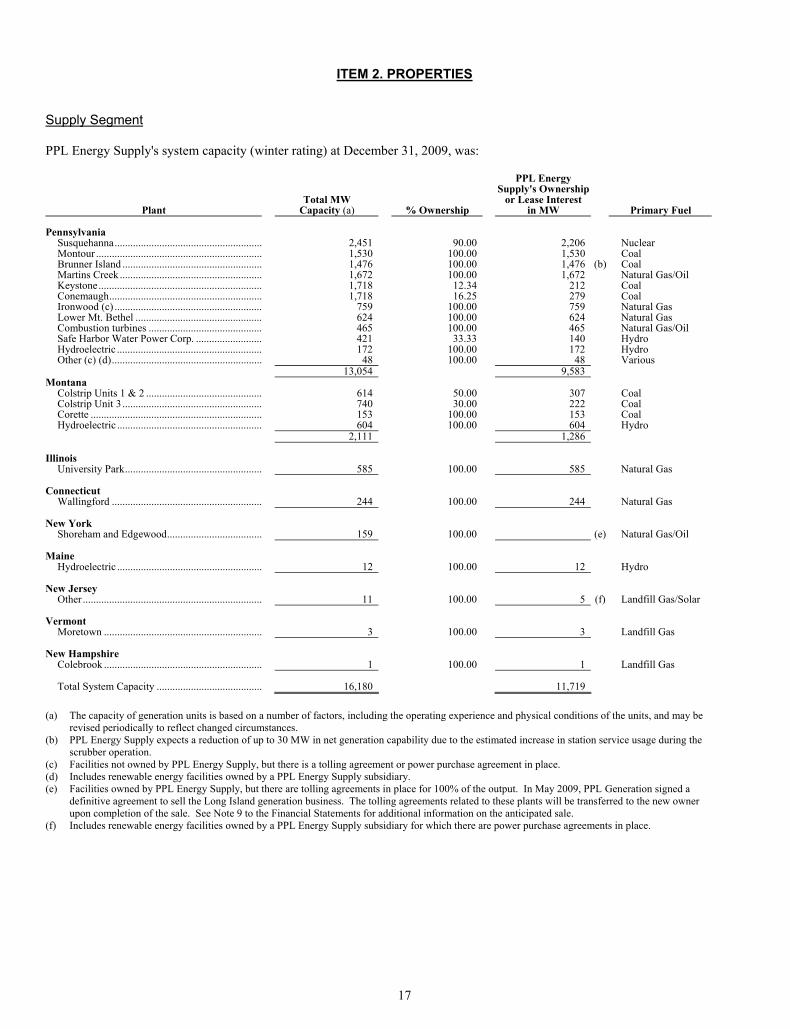
17
ITEM 2. PROPERTIES
Supply Segment PPL Energy Supply's system capacity (winter rating) at December 31, 2009, was:
Plant Total MW
Capacity (a) % Ownership
PPL Energy Supply's Ownership
or Lease Interest in MW Primary Fuel
Pennsylvania
Susquehanna........................................................ 2,451 90.00 2,206 Nuclear Montour ............................................................... 1,530 100.00 1,530 Coal Brunner Island ..................................................... 1,476 100.00 1,476 (b) Coal Martins Creek ...................................................... 1,672 100.00 1,672 Natural Gas/Oil Keystone.............................................................. 1,718 12.34 212 Coal Conemaugh.......................................................... 1,718 16.25 279 Coal Ironwood (c) ........................................................ 759 100.00 759 Natural Gas Lower Mt. Bethel ................................................ 624 100.00 624 Natural Gas Combustion turbines ........................................... 465 100.00 465 Natural Gas/Oil Safe Harbor Water Power Corp. ......................... 421 33.33 140 Hydro Hydroelectric ....................................................... 172 100.00 172 Hydro Other (c) (d)......................................................... 48 100.00 48 Various
13,054 9,583 Montana
Colstrip Units 1 & 2 ............................................ 614 50.00 307 Coal Colstrip Unit 3 ..................................................... 740 30.00 222 Coal Corette ................................................................. 153 100.00 153 Coal Hydroelectric ....................................................... 604 100.00 604 Hydro
2,111 1,286
Illinois University Park.................................................... 585 100.00 585 Natural Gas
Connecticut
Wallingford ......................................................... 244 100.00 244 Natural Gas
New York Shoreham and Edgewood.................................... 159 100.00 (e) Natural Gas/Oil
Maine Hydroelectric ....................................................... 12 100.00 12 Hydro
New Jersey Other .................................................................... 11 100.00 5 (f) Landfill Gas/Solar
Vermont Moretown ............................................................ 3 100.00 3 Landfill Gas
New Hampshire Colebrook ............................................................ 1 100.00 1 Landfill Gas Total System Capacity ........................................ 16,180 11,719
(a) The capacity of generation units is based on a number of factors, including the operating experience and physical conditions of the units, and may be
revised periodically to reflect changed circumstances. (b) PPL Energy Supply expects a reduction of up to 30 MW in net generation capability due to the estimated increase in station service usage during the
scrubber operation. (c) Facilities not owned by PPL Energy Supply, but there is a tolling agreement or power purchase agreement in place. (d) Includes renewable energy facilities owned by a PPL Energy Supply subsidiary. (e) Facilities owned by PPL Energy Supply, but there are tolling agreements in place for 100% of the output. In May 2009, PPL Generation signed a
definitive agreement to sell the Long Island generation business. The tolling agreements related to these plants will be transferred to the new owner upon completion of the sale. See Note 9 to the Financial Statements for additional information on the anticipated sale.
(f) Includes renewable energy facilities owned by a PPL Energy Supply subsidiary for which there are power purchase agreements in place.
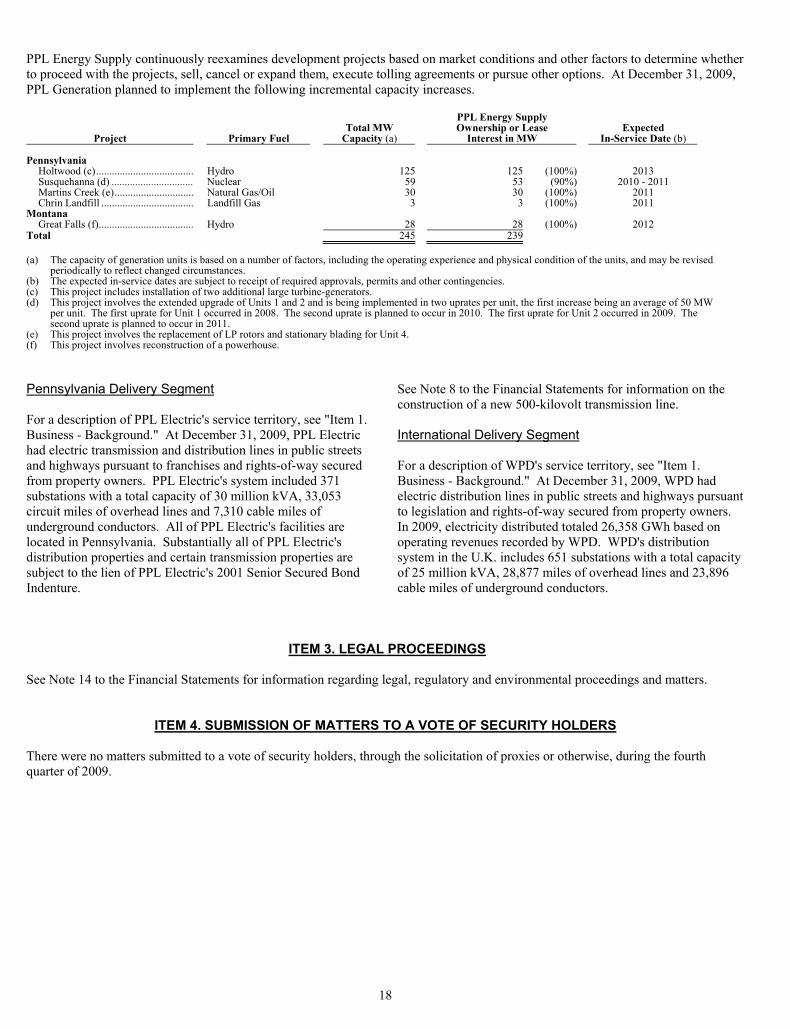
18
PPL Energy Supply continuously reexamines development projects based on market conditions and other factors to determine whether to proceed with the projects, sell, cancel or expand them, execute tolling agreements or pursue other options. At December 31, 2009, PPL Generation planned to implement the following incremental capacity increases.
Project Primary Fuel Total MW
Capacity (a)
PPL Energy Supply Ownership or Lease
Interest in MW Expected
In-Service Date (b) Pennsylvania
Holtwood (c)..................................... Hydro 125 125 (100%) 2013 Susquehanna (d) ............................... Nuclear 59 53 (90%) 2010 - 2011 Martins Creek (e).............................. Natural Gas/Oil 30 30 (100%) 2011 Chrin Landfill ................................... Landfill Gas 3 3 (100%) 2011
Montana Great Falls (f).................................... Hydro 28 28 (100%) 2012
Total 245 239 (a) The capacity of generation units is based on a number of factors, including the operating experience and physical condition of the units, and may be revised
periodically to reflect changed circumstances. (b) The expected in-service dates are subject to receipt of required approvals, permits and other contingencies. (c) This project includes installation of two additional large turbine-generators. (d) This project involves the extended upgrade of Units 1 and 2 and is being implemented in two uprates per unit, the first increase being an average of 50 MW
per unit. The first uprate for Unit 1 occurred in 2008. The second uprate is planned to occur in 2010. The first uprate for Unit 2 occurred in 2009. The second uprate is planned to occur in 2011.
(e) This project involves the replacement of LP rotors and stationary blading for Unit 4. (f) This project involves reconstruction of a powerhouse. Pennsylvania Delivery Segment For a description of PPL Electric's service territory, see "Item 1. Business - Background." At December 31, 2009, PPL Electric had electric transmission and distribution lines in public streets and highways pursuant to franchises and rights-of-way secured from property owners. PPL Electric's system included 371 substations with a total capacity of 30 million kVA, 33,053 circuit miles of overhead lines and 7,310 cable miles of underground conductors. All of PPL Electric's facilities are located in Pennsylvania. Substantially all of PPL Electric's distribution properties and certain transmission properties are subject to the lien of PPL Electric's 2001 Senior Secured Bond Indenture.
See Note 8 to the Financial Statements for information on the construction of a new 500-kilovolt transmission line. International Delivery Segment For a description of WPD's service territory, see "Item 1. Business - Background." At December 31, 2009, WPD had electric distribution lines in public streets and highways pursuant to legislation and rights-of-way secured from property owners. In 2009, electricity distributed totaled 26,358 GWh based on operating revenues recorded by WPD. WPD's distribution system in the U.K. includes 651 substations with a total capacity of 25 million kVA, 28,877 miles of overhead lines and 23,896 cable miles of underground conductors.
ITEM 3. LEGAL PROCEEDINGS See Note 14 to the Financial Statements for information regarding legal, regulatory and environmental proceedings and matters.
ITEM 4. SUBMISSION OF MATTERS TO A VOTE OF SECURITY HOLDERS
There were no matters submitted to a vote of security holders, through the solicitation of proxies or otherwise, during the fourth quarter of 2009.
19
EXECUTIVE OFFICERS OF THE REGISTRANTS Officers of PPL, PPL Energy Supply and PPL Electric are elected annually by their Boards of Directors (or Board of Managers for PPL Energy Supply) to serve at the pleasure of the respective Boards. There are no family relationships among any of the executive officers, nor is there any arrangement or understanding between any executive officer and any other person pursuant to which the officer was selected. There have been no events under any bankruptcy act, no criminal proceedings and no judgments or injunctions material to the evaluation of the ability and integrity of any executive officer during the past five years. Listed below are the executive officers at December 31, 2009. PPL Corporation
Name Age Positions Held During the Past Five Years Dates
James H. Miller 61 Chairman, President and Chief Executive Officer October 2006 - present President June 2006 - September 2006 President and Chief Operating Officer August 2005 - June 2006 Executive Vice President and Chief Operating Officer September 2004 - July 2005
William H. Spence 52 Executive Vice President and Chief Operating Officer June 2006 - present President-PPL Generation June 2008 - present Senior Vice President-Pepco Holdings, Inc. August 2002 - June 2006 Senior Vice President-Conectiv Holdings September 2000 - June 2006
Paul A. Farr 42 Executive Vice President and Chief Financial Officer April 2007 - present Senior Vice President-Financial January 2006 - March 2007 Senior Vice President-Financial and Controller August 2005 - January 2006 Vice President and Controller August 2004 - July 2005
Robert J. Grey 59 Senior Vice President, General Counsel and Secretary March 1996 - present
Robert D. Gabbard (a) 50 President-PPL EnergyPlus June 2008 - present Senior Vice President-Trading-PPL EnergyPlus June 2008 - June 2008
Senior Vice President Merchant Trading Operations-Conectiv Energy
June 2005 - May 2008
Vice President and General Manager Power Trading-Conectiv Energy
April 1998 - June 2005
Rick L. Klingensmith (a) 49 President-PPL Global August 2004 - present
David G. DeCampli (a) 52 President-PPL Electric April 2007 - present
Senior Vice President-Transmission and Distribution Engineering and Operations-PPL Electric
December 2006 - April 2007
Vice President-Asset Investment Strategy and Development-Exelon Energy Delivery-Exelon Corporation
April 2004 - December 2006
James E. Abel 58 Vice President-Finance and Treasurer June 1999 - present
J. Matt Simmons, Jr. 44 Vice President and Controller January 2006 - present Vice President-Finance and Controller-Duke Energy
Americas October 2003 - January 2006
(a) Designated an executive officer of PPL by virtue of their respective positions at a PPL subsidiary.
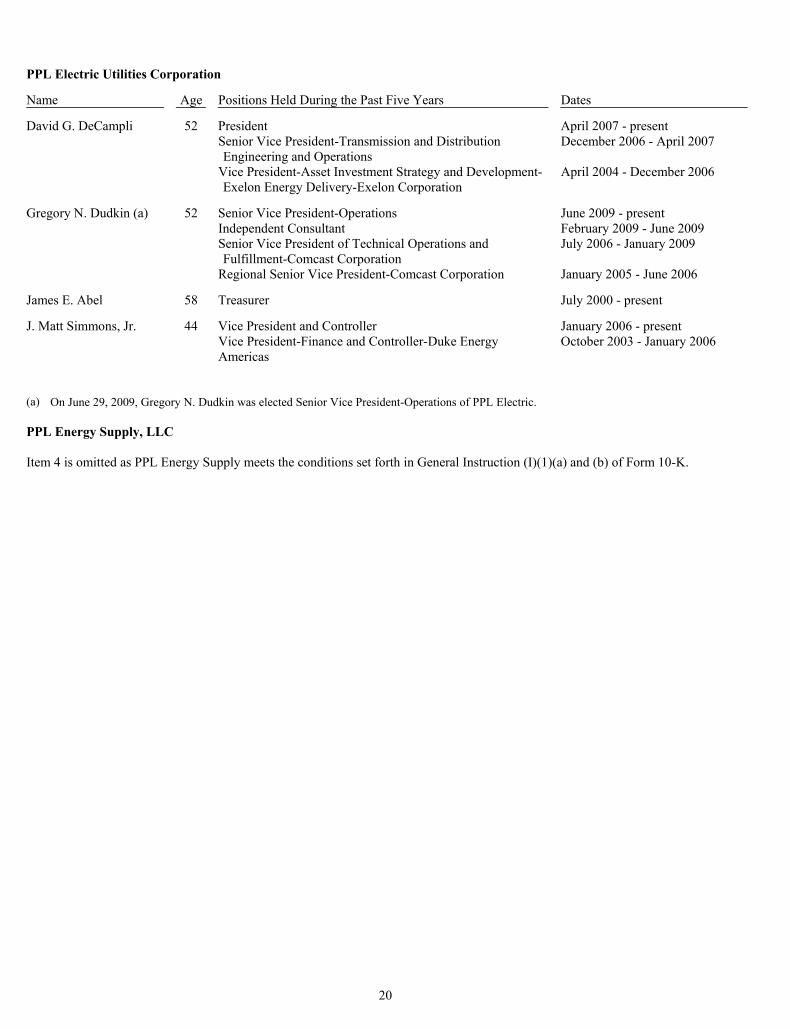
20
PPL Electric Utilities Corporation
Name Age Positions Held During the Past Five Years Dates
David G. DeCampli 52 President April 2007 - present
Senior Vice President-Transmission and Distribution Engineering and Operations
December 2006 - April 2007
Vice President-Asset Investment Strategy and Development-Exelon Energy Delivery-Exelon Corporation
April 2004 - December 2006
Gregory N. Dudkin (a) 52 Senior Vice President-Operations June 2009 - present Independent Consultant February 2009 - June 2009
Senior Vice President of Technical Operations and Fulfillment-Comcast Corporation
July 2006 - January 2009
Regional Senior Vice President-Comcast Corporation January 2005 - June 2006
James E. Abel 58 Treasurer July 2000 - present
J. Matt Simmons, Jr. 44 Vice President and Controller January 2006 - present
Vice President-Finance and Controller-Duke Energy Americas
October 2003 - January 2006
(a) On June 29, 2009, Gregory N. Dudkin was elected Senior Vice President-Operations of PPL Electric. PPL Energy Supply, LLC Item 4 is omitted as PPL Energy Supply meets the conditions set forth in General Instruction (I)(1)(a) and (b) of Form 10-K.
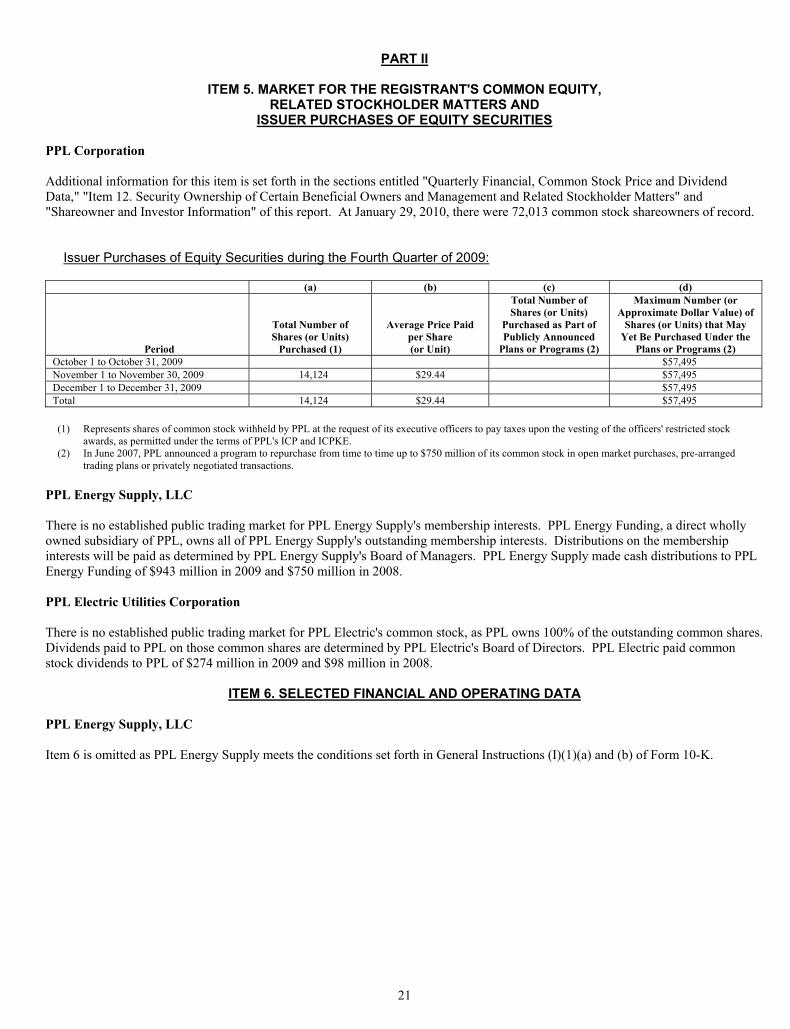
21
PART II
ITEM 5. MARKET FOR THE REGISTRANT'S COMMON EQUITY, RELATED STOCKHOLDER MATTERS AND
ISSUER PURCHASES OF EQUITY SECURITIES PPL Corporation Additional information for this item is set forth in the sections entitled "Quarterly Financial, Common Stock Price and Dividend Data," "Item 12. Security Ownership of Certain Beneficial Owners and Management and Related Stockholder Matters" and "Shareowner and Investor Information" of this report. At January 29, 2010, there were 72,013 common stock shareowners of record.
Issuer Purchases of Equity Securities during the Fourth Quarter of 2009:
(a) (b) (c) (d)
Period
Total Number of Shares (or Units)
Purchased (1)
Average Price Paid per Share (or Unit)
Total Number of Shares (or Units)
Purchased as Part of Publicly Announced
Plans or Programs (2)
Maximum Number (or Approximate Dollar Value) of
Shares (or Units) that May Yet Be Purchased Under the
Plans or Programs (2) October 1 to October 31, 2009 $57,495 November 1 to November 30, 2009 14,124 $29.44 $57,495 December 1 to December 31, 2009 $57,495 Total 14,124 $29.44 $57,495
(1) Represents shares of common stock withheld by PPL at the request of its executive officers to pay taxes upon the vesting of the officers' restricted stock
awards, as permitted under the terms of PPL's ICP and ICPKE. (2) In June 2007, PPL announced a program to repurchase from time to time up to $750 million of its common stock in open market purchases, pre-arranged
trading plans or privately negotiated transactions. PPL Energy Supply, LLC There is no established public trading market for PPL Energy Supply's membership interests. PPL Energy Funding, a direct wholly owned subsidiary of PPL, owns all of PPL Energy Supply's outstanding membership interests. Distributions on the membership interests will be paid as determined by PPL Energy Supply's Board of Managers. PPL Energy Supply made cash distributions to PPL Energy Funding of $943 million in 2009 and $750 million in 2008. PPL Electric Utilities Corporation There is no established public trading market for PPL Electric's common stock, as PPL owns 100% of the outstanding common shares. Dividends paid to PPL on those common shares are determined by PPL Electric's Board of Directors. PPL Electric paid common stock dividends to PPL of $274 million in 2009 and $98 million in 2008.
ITEM 6. SELECTED FINANCIAL AND OPERATING DATA PPL Energy Supply, LLC Item 6 is omitted as PPL Energy Supply meets the conditions set forth in General Instructions (I)(1)(a) and (b) of Form 10-K.
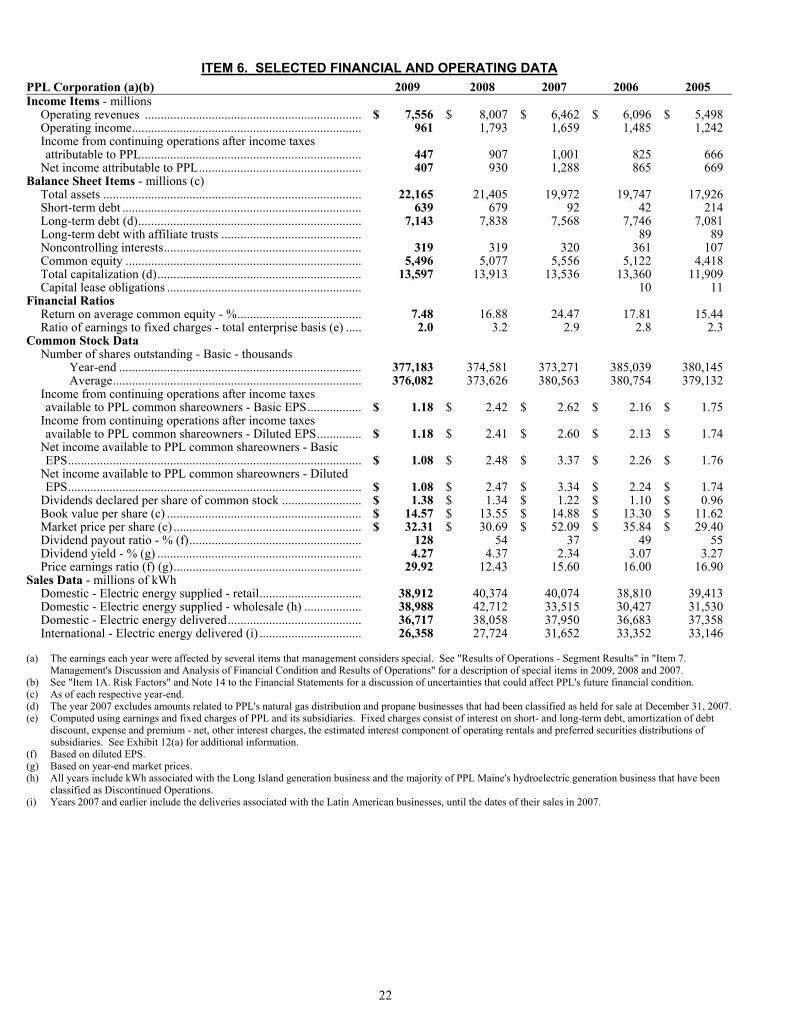
22
ITEM 6. SELECTED FINANCIAL AND OPERATING DATA PPL Corporation (a)(b) 2009 2008 2007 2006 2005 Income Items - millions
Operating revenues .................................................................... $ 7,556 $ 8,007 $ 6,462 $ 6,096 $ 5,498 Operating income........................................................................ 961 1,793 1,659 1,485 1,242 Income from continuing operations after income taxes attributable to PPL..................................................................... 447 907 1,001 825 666
Net income attributable to PPL................................................... 407 930 1,288 865 669 Balance Sheet Items - millions (c)
Total assets ................................................................................. 22,165 21,405 19,972 19,747 17,926 Short-term debt ........................................................................... 639 679 92 42 214 Long-term debt (d)...................................................................... 7,143 7,838 7,568 7,746 7,081 Long-term debt with affiliate trusts ............................................ 89 89Noncontrolling interests.............................................................. 319 319 320 361 107 Common equity .......................................................................... 5,496 5,077 5,556 5,122 4,418 Total capitalization (d)................................................................ 13,597 13,913 13,536 13,360 11,909 Capital lease obligations ............................................................. 10 11
Financial Ratios Return on average common equity - %....................................... 7.48 16.88 24.47 17.81 15.44 Ratio of earnings to fixed charges - total enterprise basis (e) ..... 2.0 3.2 2.9 2.8 2.3
Common Stock Data Number of shares outstanding - Basic - thousands
Year-end ............................................................................ 377,183 374,581 373,271 385,039 380,145 Average.............................................................................. 376,082 373,626 380,563 380,754 379,132
Income from continuing operations after income taxes available to PPL common shareowners - Basic EPS................. $ 1.18
$ 2.42
$ 2.62
$ 2.16 $ 1.75
Income from continuing operations after income taxes available to PPL common shareowners - Diluted EPS.............. $ 1.18
$ 2.41
$ 2.60
$ 2.13 $ 1.74
Net income available to PPL common shareowners - Basic EPS............................................................................................ $ 1.08
$ 2.48
$ 3.37
$ 2.26 $ 1.76
Net income available to PPL common shareowners - Diluted EPS............................................................................................ $ 1.08
$ 2.47
$ 3.34
$ 2.24 $ 1.74
Dividends declared per share of common stock ......................... $ 1.38 $ 1.34 $ 1.22 $ 1.10 $ 0.96 Book value per share (c) ............................................................. $ 14.57 $ 13.55 $ 14.88 $ 13.30 $ 11.62 Market price per share (c) ........................................................... $ 32.31 $ 30.69 $ 52.09 $ 35.84 $ 29.40 Dividend payout ratio - % (f)...................................................... 128 54 37 49 55 Dividend yield - % (g) ................................................................ 4.27 4.37 2.34 3.07 3.27 Price earnings ratio (f) (g)........................................................... 29.92 12.43 15.60 16.00 16.90
Sales Data - millions of kWh Domestic - Electric energy supplied - retail................................ 38,912 40,374 40,074 38,810 39,413 Domestic - Electric energy supplied - wholesale (h) .................. 38,988 42,712 33,515 30,427 31,530 Domestic - Electric energy delivered.......................................... 36,717 38,058 37,950 36,683 37,358 International - Electric energy delivered (i) ................................ 26,358 27,724 31,652 33,352 33,146
(a) The earnings each year were affected by several items that management considers special. See "Results of Operations - Segment Results" in "Item 7.
Management's Discussion and Analysis of Financial Condition and Results of Operations" for a description of special items in 2009, 2008 and 2007. (b) See "Item 1A. Risk Factors" and Note 14 to the Financial Statements for a discussion of uncertainties that could affect PPL's future financial condition. (c) As of each respective year-end. (d) The year 2007 excludes amounts related to PPL's natural gas distribution and propane businesses that had been classified as held for sale at December 31, 2007. (e) Computed using earnings and fixed charges of PPL and its subsidiaries. Fixed charges consist of interest on short- and long-term debt, amortization of debt
discount, expense and premium - net, other interest charges, the estimated interest component of operating rentals and preferred securities distributions of subsidiaries. See Exhibit 12(a) for additional information.
(f) Based on diluted EPS. (g) Based on year-end market prices. (h) All years include kWh associated with the Long Island generation business and the majority of PPL Maine's hydroelectric generation business that have been
classified as Discontinued Operations. (i) Years 2007 and earlier include the deliveries associated with the Latin American businesses, until the dates of their sales in 2007.
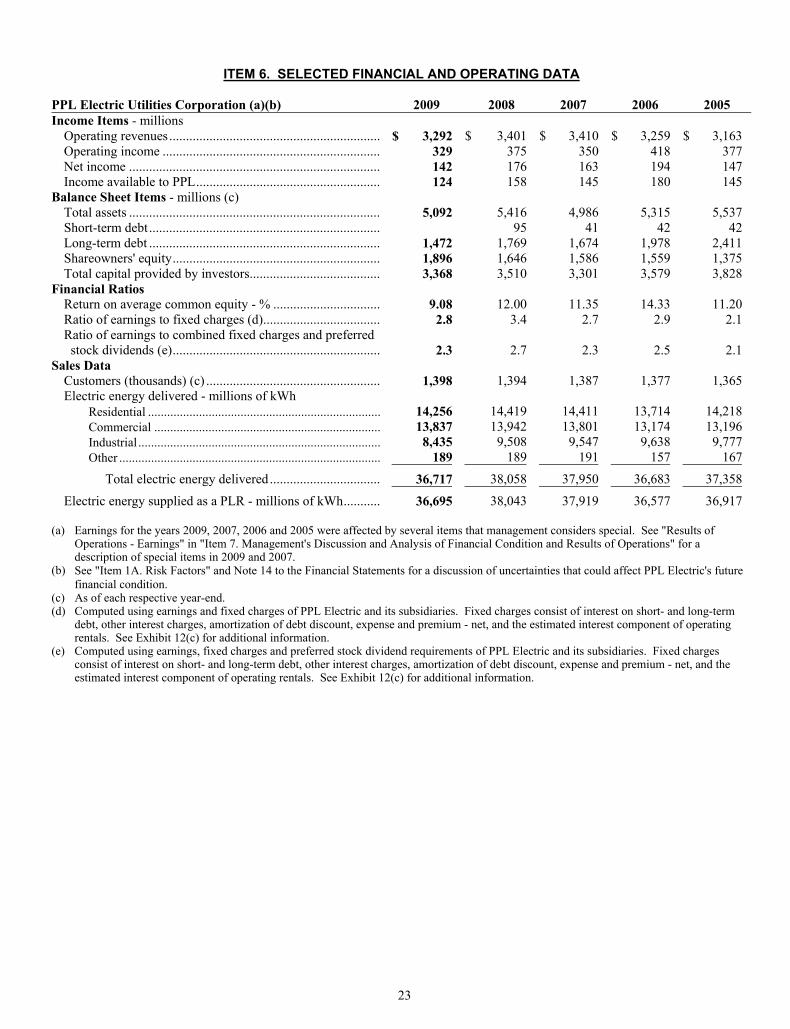
23
ITEM 6. SELECTED FINANCIAL AND OPERATING DATA
PPL Electric Utilities Corporation (a)(b) 2009 2008 2007 2006 2005 Income Items - millions
Operating revenues............................................................... $ 3,292 $ 3,401 $ 3,410 $ 3,259 $ 3,163 Operating income ................................................................. 329 375 350 418 377 Net income ........................................................................... 142 176 163 194 147 Income available to PPL....................................................... 124 158 145 180 145
Balance Sheet Items - millions (c) Total assets ........................................................................... 5,092 5,416 4,986 5,315 5,537 Short-term debt..................................................................... 95 41 42 42 Long-term debt ..................................................................... 1,472 1,769 1,674 1,978 2,411 Shareowners' equity.............................................................. 1,896 1,646 1,586 1,559 1,375 Total capital provided by investors....................................... 3,368 3,510 3,301 3,579 3,828
Financial Ratios Return on average common equity - % ................................ 9.08 12.00 11.35 14.33 11.20 Ratio of earnings to fixed charges (d)................................... 2.8 3.4 2.7 2.9 2.1Ratio of earnings to combined fixed charges and preferred
stock dividends (e).............................................................. 2.3 2.7 2.3 2.5 2.1Sales Data
Customers (thousands) (c) .................................................... 1,398 1,394 1,387 1,377 1,365 Electric energy delivered - millions of kWh
Residential ......................................................................... 14,256 14,419 14,411 13,714 14,218 Commercial ....................................................................... 13,837 13,942 13,801 13,174 13,196 Industrial ............................................................................ 8,435 9,508 9,547 9,638 9,777 Other .................................................................................. 189 189 191 157 167
Total electric energy delivered................................. 36,717 38,058 37,950 36,683 37,358
Electric energy supplied as a PLR - millions of kWh........... 36,695 38,043 37,919 36,577 36,917 (a) Earnings for the years 2009, 2007, 2006 and 2005 were affected by several items that management considers special. See "Results of
Operations - Earnings" in "Item 7. Management's Discussion and Analysis of Financial Condition and Results of Operations" for a description of special items in 2009 and 2007.
(b) See "Item 1A. Risk Factors" and Note 14 to the Financial Statements for a discussion of uncertainties that could affect PPL Electric's future financial condition.
(c) As of each respective year-end. (d) Computed using earnings and fixed charges of PPL Electric and its subsidiaries. Fixed charges consist of interest on short- and long-term
debt, other interest charges, amortization of debt discount, expense and premium - net, and the estimated interest component of operating rentals. See Exhibit 12(c) for additional information.
(e) Computed using earnings, fixed charges and preferred stock dividend requirements of PPL Electric and its subsidiaries. Fixed charges consist of interest on short- and long-term debt, other interest charges, amortization of debt discount, expense and premium - net, and the estimated interest component of operating rentals. See Exhibit 12(c) for additional information.
24
PPL CORPORATION AND SUBSIDIARIES
Item 7. Management's Discussion and Analysis of Financial Condition and Results of Operations
Overview
PPL is an energy and utility holding company with headquarters in Allentown, Pennsylvania. Refer to "Item 1. Business - Background" for descriptions of its reportable segments, which are Supply, International Delivery and Pennsylvania Delivery. Through its subsidiaries, PPL is primarily engaged in the generation and marketing of electricity in two key markets - the northeastern and western U.S. - and in the delivery of electricity in Pennsylvania and the U.K. PPL's overall strategy is to achieve disciplined growth in energy supply margins while limiting volatility in both cash flows and earnings and to achieve stable, long-term growth in its regulated electricity delivery businesses through efficient operations and strong customer and regulatory relations. More specifically, PPL's strategy for its electricity generation and marketing business is to match energy supply with load, or customer demand, under contracts of varying lengths with creditworthy counterparties to capture profits while effectively managing exposure to energy and fuel price volatility, counterparty credit risk and operational risk. PPL's strategy for its electricity delivery businesses is to own and operate these businesses at the most efficient cost while maintaining high quality customer service and reliability. PPL faces several risks in its supply business, principally electricity and capacity wholesale price risk, fuel supply and price risk, electricity and fuel basis risk, power plant performance, evolving regulatory frameworks and counterparty credit risk. PPL attempts to manage these risks through various means. For instance, PPL operates a portfolio of generation assets that is diversified as to geography, fuel source, cost structure and operating characteristics. PPL expects to expand its generation capacity over the next several years through power uprates at certain of its existing power plants, and is continually evaluating the potential construction of new plants and the potential acquisition of existing plants or businesses. PPL is and will continue to remain focused on the operating efficiency and availability of its existing and any newly constructed or acquired power plants. In addition, PPL has executed and continues to pursue contracts of varying lengths for energy sales and fuel supply, while using other means to mitigate risks associated with adverse changes in the difference, or margin, between the cost to produce electricity and the price at which PPL sells it. PPL's future profitability will be affected by prevailing market conditions and whether PPL decides to, or is able to, continue to enter into long-term or intermediate-term power sales and fuel purchase agreements or renew its existing agreements. Currently, PPL's commitments for energy sales are satisfied through its own generation assets and supply purchased from third parties. PPL markets and trades around its physical portfolio of generating assets through integrated generation, marketing and trading functions. PPL has adopted financial and operational risk management programs that, among other things, are designed to monitor and
manage its exposure to earnings and cash flow volatility related to changes in energy and fuel prices, interest rates, foreign currency exchange rates, counterparty credit quality and the operating performance of its generating units. The principal challenge that PPL faces in its electricity delivery businesses is to maintain high quality customer service and reliability in a cost-effective manner. PPL's electricity delivery businesses are rate-regulated. Accordingly, these businesses are subject to regulatory risk with respect to costs that may not be recovered and investment returns that may not be collected through customer rates. See "Customer Choice - End of Transition Period" below for information on additional risks PPL's domestic electricity business may face. PPL faces additional financial risks in conducting U.K. operations, such as fluctuations in foreign currency exchange rates and the effect these rates have on the conversion of U.K. earnings and cash flows to U.S. dollars. PPL attempts to manage these financial risks through its risk management programs. In order to manage financing costs and access to credit markets, a key objective for PPL's business as a whole is to maintain a strong credit profile. PPL continually focuses on maintaining an appropriate capital structure and liquidity position. See "Item 1A. Risk Factors" for more information concerning these and other material risks PPL faces in its businesses. In May 2009, PPL Generation signed a definitive agreement to sell its Long Island generation business and related tolling agreements, and expects the sale to close on or about February 26, 2010. In November 2009, PPL Maine completed the sale of the majority of its hydroelectric generation business. These businesses are included in the Supply segment. In 2008, PPL sold its natural gas distribution and propane businesses, which were included in the Pennsylvania Delivery segment. In 2007, PPL sold its regulated electricity delivery businesses in Latin America, which were included in the International Delivery segment. See Note 9 to the Financial Statements for additional information. The purpose of "Management's Discussion and Analysis of Financial Condition and Results of Operations" is to provide information concerning PPL's performance in implementing the strategies and managing the risks and challenges mentioned above. Specifically: • "Results of Operations" provides an overview of PPL's
operating results in 2009, 2008 and 2007, including a review of earnings, with details of results by reportable segment. It also provides a brief outlook for 2010.
• "Financial Condition - Liquidity and Capital Resources"
provides an analysis of PPL's liquidity position and credit
25
profile, including its sources of cash (including bank credit facilities and sources of operating cash flow) and uses of cash (including contractual obligations and capital expenditure requirements) and the key risks and uncertainties that impact PPL's past and future liquidity position and financial condition. This subsection also includes a listing and discussion of PPL's current credit ratings.
• "Financial Condition - Risk Management - Energy Marketing
& Trading and Other" provides an explanation of PPL's risk management programs relating to market risk and credit risk.
• "Application of Critical Accounting Policies" provides an
overview of the accounting policies that are particularly important to the results of operations and financial condition of PPL and that require its management to make significant estimates, assumptions and other judgments.
The information provided in this Item 7 should be read in conjunction with PPL's Consolidated Financial Statements and the accompanying Notes. Terms and abbreviations are explained in the glossary. Dollars are in millions unless otherwise noted. Customer Choice – End of Transition Period In 1996, the Customer Choice Act was enacted to restructure Pennsylvania's electric utility industry in order to create retail access to a competitive market for generation of electricity. The Customer Choice Act required each Pennsylvania electric utility, including PPL Electric, to file a restructuring plan to "unbundle" its rates into separate generation, transmission and distribution components and to permit its customers to directly access alternate suppliers of electricity. Under the Customer Choice Act, PPL Electric was required to act as a PLR. As part of a settlement approved by the PUC and in connection with the restructuring plan PPL Electric filed under the Customer Choice Act, PPL Electric agreed to provide electricity as a PLR at predetermined "capped" rates through 2009. In addition, the PUC authorized recovery of approximately $2.97 billion of competitive transition or "stranded" costs (generation-related costs that might not otherwise be recovered in a competitive market) from customers during an 11-year transition period. For PPL Electric, this transition period ended on December 31, 2009. As a result of the PUC settlement order and the PLR obligation, PPL Electric, through 2009, generally bore the risk that it would not be able to obtain adequate energy supply at the "capped" rates it could charge to its customers who did not select an alternate electricity supplier. To mitigate this risk, PPL Electric entered into full requirements energy supply agreements with PPL EnergyPlus. Under these agreements, through 2009, PPL EnergyPlus supplied PPL Electric's entire PLR load at predetermined prices equal to the capped generation rates that PPL Electric was authorized to charge its customers. Related to PPL Electric's transition period, the following has occurred or will occur:
• In August 1999, CTC of $2.4 billion were converted to intangible transition costs when they were securitized by the issuance of transition bonds. The intangible transition costs were amortized over the life of the transition bonds, through December 2008, in accordance with an amortization schedule filed with the PUC. These transition bonds matured in tranches, with the final tranche being repaid in December 2008.
• During the transition period, PPL Electric was authorized by
the PUC to bill its customers $130 million for a portion of the costs associated with decommissioning of the Susquehanna nuclear plant. Under the power supply agreements between PPL Electric and PPL EnergyPlus, these revenues were passed on to PPL EnergyPlus. Similarly, these revenues were passed on to PPL Susquehanna under a power supply agreement between PPL EnergyPlus and PPL Susquehanna and invested in the NDT funds. Effective January 1, 2010, these ratepayer billings have ceased.
• In December 2009, PPL Electric filed with the PUC a final
reconciliation of CTC and ITC recoveries during the transition period. At December 31, 2009, PPL Electric has recorded a net regulatory liability of $33 million related to these recoveries. The net overcollection will be reflected in customer rates in 2010.
• At December 31, 2009, PPL Electric's long-term power
purchase agreements with PPL EnergyPlus (effective since 2000 and 2002) expired.
• To mitigate 2010 rate increases, PPL Electric implemented
two programs in 2008 and 2009 that allowed customers to make prepayments toward their 2010 and 2011 electric bills or to defer any 2010 electric bill increases exceeding 25%. Any deferred amounts are to be repaid by 2012. At December 31, 2009, PPL Electric has recorded a liability of $36 million for these programs.
• Effective January 1, 2010, PPL Electric's rates for generation
supply as a PLR are no longer capped and the cost of electric generation is based on a competitive solicitation process. During 2007 through 2009, PPL Electric procured through PUC-approved solicitation procedures, the electric generation supply it will need in 2010 for customers who do not choose an alternative supplier. The prices in these contracts will result in an average residential customer paying approximately 30% higher rates, as compared to the previously-capped rates on delivered electricity. PPL Electric is currently procuring the PLR supply it will need for the January 2011 through May 2013 period. The results of all procurements continue to require the approval of the PUC.
• For those customers who choose to procure generation
supply from other providers, PPL Electric will provide services for these alternative generation suppliers to bill usage charges, among other duties. As required by a PUC-approved plan, PPL Electric will be purchasing certain receivables from alternative suppliers at a discount.
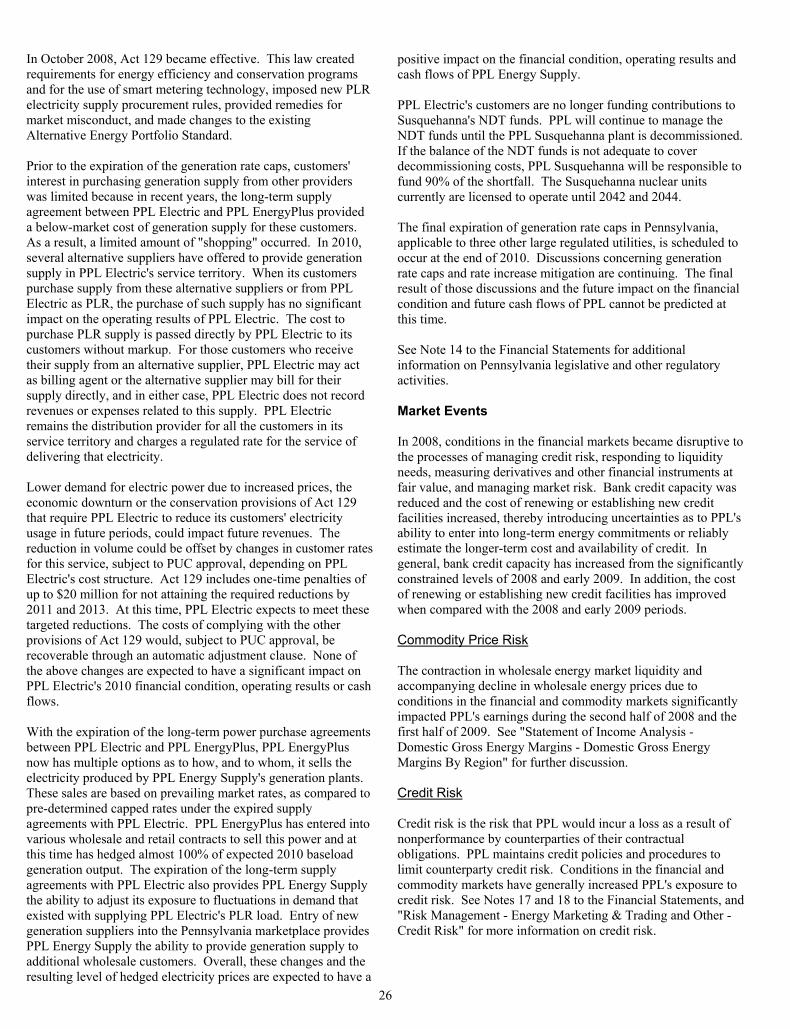
26
In October 2008, Act 129 became effective. This law created requirements for energy efficiency and conservation programs and for the use of smart metering technology, imposed new PLR electricity supply procurement rules, provided remedies for market misconduct, and made changes to the existing Alternative Energy Portfolio Standard. Prior to the expiration of the generation rate caps, customers' interest in purchasing generation supply from other providers was limited because in recent years, the long-term supply agreement between PPL Electric and PPL EnergyPlus provided a below-market cost of generation supply for these customers. As a result, a limited amount of "shopping" occurred. In 2010, several alternative suppliers have offered to provide generation supply in PPL Electric's service territory. When its customers purchase supply from these alternative suppliers or from PPL Electric as PLR, the purchase of such supply has no significant impact on the operating results of PPL Electric. The cost to purchase PLR supply is passed directly by PPL Electric to its customers without markup. For those customers who receive their supply from an alternative supplier, PPL Electric may act as billing agent or the alternative supplier may bill for their supply directly, and in either case, PPL Electric does not record revenues or expenses related to this supply. PPL Electric remains the distribution provider for all the customers in its service territory and charges a regulated rate for the service of delivering that electricity. Lower demand for electric power due to increased prices, the economic downturn or the conservation provisions of Act 129 that require PPL Electric to reduce its customers' electricity usage in future periods, could impact future revenues. The reduction in volume could be offset by changes in customer rates for this service, subject to PUC approval, depending on PPL Electric's cost structure. Act 129 includes one-time penalties of up to $20 million for not attaining the required reductions by 2011 and 2013. At this time, PPL Electric expects to meet these targeted reductions. The costs of complying with the other provisions of Act 129 would, subject to PUC approval, be recoverable through an automatic adjustment clause. None of the above changes are expected to have a significant impact on PPL Electric's 2010 financial condition, operating results or cash flows. With the expiration of the long-term power purchase agreements between PPL Electric and PPL EnergyPlus, PPL EnergyPlus now has multiple options as to how, and to whom, it sells the electricity produced by PPL Energy Supply's generation plants. These sales are based on prevailing market rates, as compared to pre-determined capped rates under the expired supply agreements with PPL Electric. PPL EnergyPlus has entered into various wholesale and retail contracts to sell this power and at this time has hedged almost 100% of expected 2010 baseload generation output. The expiration of the long-term supply agreements with PPL Electric also provides PPL Energy Supply the ability to adjust its exposure to fluctuations in demand that existed with supplying PPL Electric's PLR load. Entry of new generation suppliers into the Pennsylvania marketplace provides PPL Energy Supply the ability to provide generation supply to additional wholesale customers. Overall, these changes and the resulting level of hedged electricity prices are expected to have a
positive impact on the financial condition, operating results and cash flows of PPL Energy Supply. PPL Electric's customers are no longer funding contributions to Susquehanna's NDT funds. PPL will continue to manage the NDT funds until the PPL Susquehanna plant is decommissioned. If the balance of the NDT funds is not adequate to cover decommissioning costs, PPL Susquehanna will be responsible to fund 90% of the shortfall. The Susquehanna nuclear units currently are licensed to operate until 2042 and 2044. The final expiration of generation rate caps in Pennsylvania, applicable to three other large regulated utilities, is scheduled to occur at the end of 2010. Discussions concerning generation rate caps and rate increase mitigation are continuing. The final result of those discussions and the future impact on the financial condition and future cash flows of PPL cannot be predicted at this time. See Note 14 to the Financial Statements for additional information on Pennsylvania legislative and other regulatory activities. Market Events In 2008, conditions in the financial markets became disruptive to the processes of managing credit risk, responding to liquidity needs, measuring derivatives and other financial instruments at fair value, and managing market risk. Bank credit capacity was reduced and the cost of renewing or establishing new credit facilities increased, thereby introducing uncertainties as to PPL's ability to enter into long-term energy commitments or reliably estimate the longer-term cost and availability of credit. In general, bank credit capacity has increased from the significantly constrained levels of 2008 and early 2009. In addition, the cost of renewing or establishing new credit facilities has improved when compared with the 2008 and early 2009 periods. Commodity Price Risk The contraction in wholesale energy market liquidity and accompanying decline in wholesale energy prices due to conditions in the financial and commodity markets significantly impacted PPL's earnings during the second half of 2008 and the first half of 2009. See "Statement of Income Analysis - Domestic Gross Energy Margins - Domestic Gross Energy Margins By Region" for further discussion. Credit Risk Credit risk is the risk that PPL would incur a loss as a result of nonperformance by counterparties of their contractual obligations. PPL maintains credit policies and procedures to limit counterparty credit risk. Conditions in the financial and commodity markets have generally increased PPL's exposure to credit risk. See Notes 17 and 18 to the Financial Statements, and "Risk Management - Energy Marketing & Trading and Other - Credit Risk" for more information on credit risk.
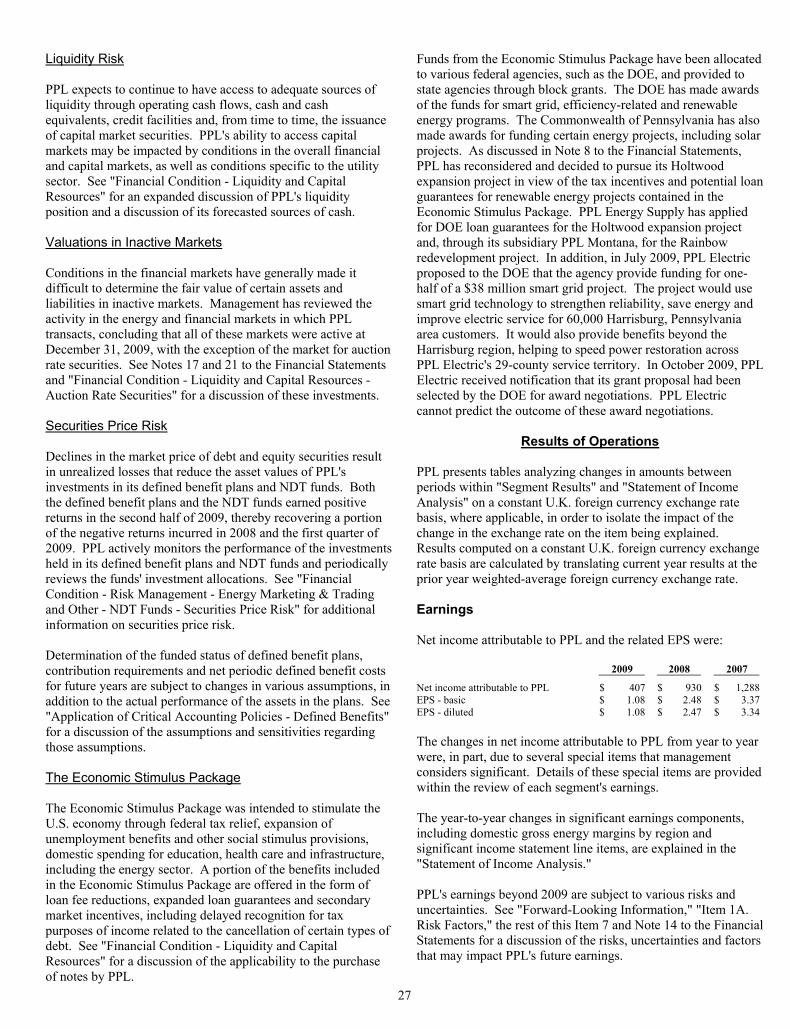
27
Liquidity Risk PPL expects to continue to have access to adequate sources of liquidity through operating cash flows, cash and cash equivalents, credit facilities and, from time to time, the issuance of capital market securities. PPL's ability to access capital markets may be impacted by conditions in the overall financial and capital markets, as well as conditions specific to the utility sector. See "Financial Condition - Liquidity and Capital Resources" for an expanded discussion of PPL's liquidity position and a discussion of its forecasted sources of cash. Valuations in Inactive Markets Conditions in the financial markets have generally made it difficult to determine the fair value of certain assets and liabilities in inactive markets. Management has reviewed the activity in the energy and financial markets in which PPL transacts, concluding that all of these markets were active at December 31, 2009, with the exception of the market for auction rate securities. See Notes 17 and 21 to the Financial Statements and "Financial Condition - Liquidity and Capital Resources - Auction Rate Securities" for a discussion of these investments. Securities Price Risk Declines in the market price of debt and equity securities result in unrealized losses that reduce the asset values of PPL's investments in its defined benefit plans and NDT funds. Both the defined benefit plans and the NDT funds earned positive returns in the second half of 2009, thereby recovering a portion of the negative returns incurred in 2008 and the first quarter of 2009. PPL actively monitors the performance of the investments held in its defined benefit plans and NDT funds and periodically reviews the funds' investment allocations. See "Financial Condition - Risk Management - Energy Marketing & Trading and Other - NDT Funds - Securities Price Risk" for additional information on securities price risk. Determination of the funded status of defined benefit plans, contribution requirements and net periodic defined benefit costs for future years are subject to changes in various assumptions, in addition to the actual performance of the assets in the plans. See "Application of Critical Accounting Policies - Defined Benefits" for a discussion of the assumptions and sensitivities regarding those assumptions. The Economic Stimulus Package The Economic Stimulus Package was intended to stimulate the U.S. economy through federal tax relief, expansion of unemployment benefits and other social stimulus provisions, domestic spending for education, health care and infrastructure, including the energy sector. A portion of the benefits included in the Economic Stimulus Package are offered in the form of loan fee reductions, expanded loan guarantees and secondary market incentives, including delayed recognition for tax purposes of income related to the cancellation of certain types of debt. See "Financial Condition - Liquidity and Capital Resources" for a discussion of the applicability to the purchase of notes by PPL.
Funds from the Economic Stimulus Package have been allocated to various federal agencies, such as the DOE, and provided to state agencies through block grants. The DOE has made awards of the funds for smart grid, efficiency-related and renewable energy programs. The Commonwealth of Pennsylvania has also made awards for funding certain energy projects, including solar projects. As discussed in Note 8 to the Financial Statements, PPL has reconsidered and decided to pursue its Holtwood expansion project in view of the tax incentives and potential loan guarantees for renewable energy projects contained in the Economic Stimulus Package. PPL Energy Supply has applied for DOE loan guarantees for the Holtwood expansion project and, through its subsidiary PPL Montana, for the Rainbow redevelopment project. In addition, in July 2009, PPL Electric proposed to the DOE that the agency provide funding for one-half of a $38 million smart grid project. The project would use smart grid technology to strengthen reliability, save energy and improve electric service for 60,000 Harrisburg, Pennsylvania area customers. It would also provide benefits beyond the Harrisburg region, helping to speed power restoration across PPL Electric's 29-county service territory. In October 2009, PPL Electric received notification that its grant proposal had been selected by the DOE for award negotiations. PPL Electric cannot predict the outcome of these award negotiations.
Results of Operations PPL presents tables analyzing changes in amounts between periods within "Segment Results" and "Statement of Income Analysis" on a constant U.K. foreign currency exchange rate basis, where applicable, in order to isolate the impact of the change in the exchange rate on the item being explained. Results computed on a constant U.K. foreign currency exchange rate basis are calculated by translating current year results at the prior year weighted-average foreign currency exchange rate. Earnings Net income attributable to PPL and the related EPS were: 2009 2008 2007
Net income attributable to PPL $ 407 $ 930 $ 1,288 EPS - basic $ 1.08 $ 2.48 $ 3.37 EPS - diluted $ 1.08 $ 2.47 $ 3.34 The changes in net income attributable to PPL from year to year were, in part, due to several special items that management considers significant. Details of these special items are provided within the review of each segment's earnings. The year-to-year changes in significant earnings components, including domestic gross energy margins by region and significant income statement line items, are explained in the "Statement of Income Analysis." PPL's earnings beyond 2009 are subject to various risks and uncertainties. See "Forward-Looking Information," "Item 1A. Risk Factors," the rest of this Item 7 and Note 14 to the Financial Statements for a discussion of the risks, uncertainties and factors that may impact PPL's future earnings.
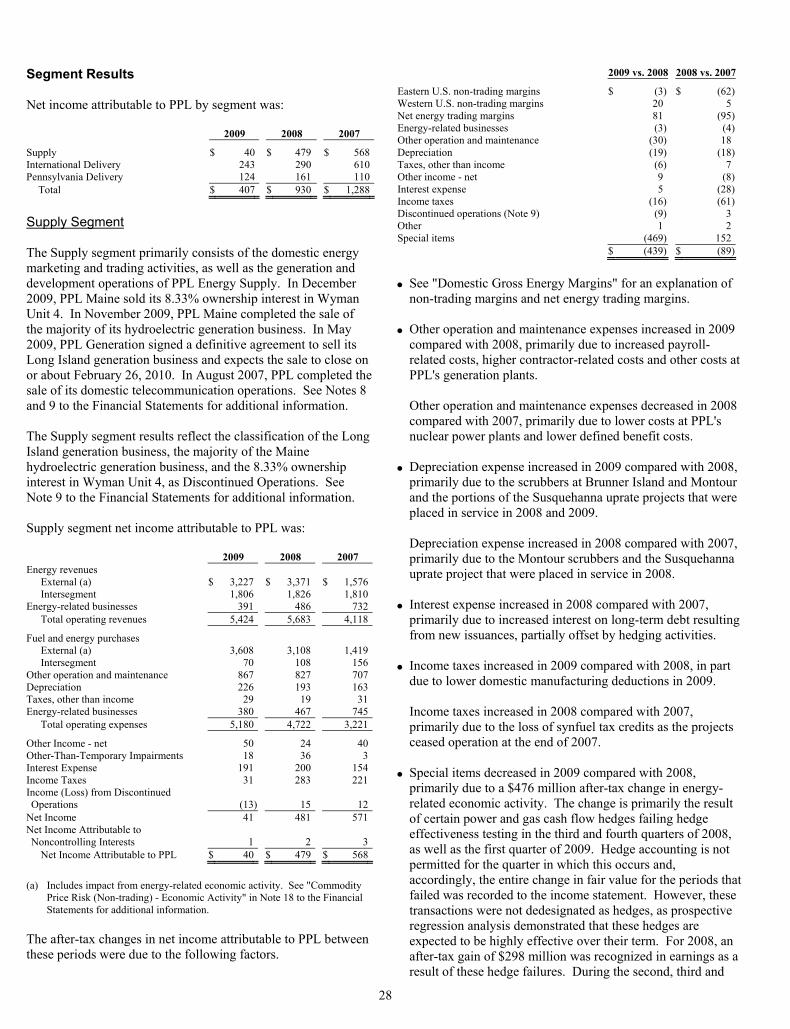
28
Segment Results Net income attributable to PPL by segment was: 2009 2008 2007
Supply $ 40 $ 479 $ 568International Delivery 243 290 610Pennsylvania Delivery 124 161 110
Total $ 407 $ 930 $ 1,288
Supply Segment The Supply segment primarily consists of the domestic energy marketing and trading activities, as well as the generation and development operations of PPL Energy Supply. In December 2009, PPL Maine sold its 8.33% ownership interest in Wyman Unit 4. In November 2009, PPL Maine completed the sale of the majority of its hydroelectric generation business. In May 2009, PPL Generation signed a definitive agreement to sell its Long Island generation business and expects the sale to close on or about February 26, 2010. In August 2007, PPL completed the sale of its domestic telecommunication operations. See Notes 8 and 9 to the Financial Statements for additional information. The Supply segment results reflect the classification of the Long Island generation business, the majority of the Maine hydroelectric generation business, and the 8.33% ownership interest in Wyman Unit 4, as Discontinued Operations. See Note 9 to the Financial Statements for additional information. Supply segment net income attributable to PPL was: 2009 2008 2007 Energy revenues
External (a) $ 3,227 $ 3,371 $ 1,576Intersegment 1,806 1,826 1,810
Energy-related businesses 391 486 732Total operating revenues 5,424 5,683 4,118
Fuel and energy purchases External (a) 3,608 3,108 1,419Intersegment 70 108 156
Other operation and maintenance 867 827 707Depreciation 226 193 163Taxes, other than income 29 19 31Energy-related businesses 380 467 745
Total operating expenses 5,180 4,722 3,221
Other Income - net 50 24 40Other-Than-Temporary Impairments 18 36 3Interest Expense 191 200 154Income Taxes 31 283 221Income (Loss) from Discontinued Operations (13) 15 12
Net Income 41 481 571Net Income Attributable to Noncontrolling Interests 1 2 3
Net Income Attributable to PPL $ 40 $ 479 $ 568
(a) Includes impact from energy-related economic activity. See "Commodity
Price Risk (Non-trading) - Economic Activity" in Note 18 to the Financial Statements for additional information.
The after-tax changes in net income attributable to PPL between these periods were due to the following factors.
2009 vs. 2008 2008 vs. 2007
Eastern U.S. non-trading margins $ (3) $ (62)Western U.S. non-trading margins 20 5Net energy trading margins 81 (95)Energy-related businesses (3) (4)Other operation and maintenance (30) 18Depreciation (19) (18)Taxes, other than income (6) 7Other income - net 9 (8)Interest expense 5 (28)Income taxes (16) (61)Discontinued operations (Note 9) (9) 3Other 1 2Special items (469) 152 $ (439) $ (89)
• See "Domestic Gross Energy Margins" for an explanation of
non-trading margins and net energy trading margins. • Other operation and maintenance expenses increased in 2009
compared with 2008, primarily due to increased payroll-related costs, higher contractor-related costs and other costs at PPL's generation plants. Other operation and maintenance expenses decreased in 2008 compared with 2007, primarily due to lower costs at PPL's nuclear power plants and lower defined benefit costs.
• Depreciation expense increased in 2009 compared with 2008,
primarily due to the scrubbers at Brunner Island and Montour and the portions of the Susquehanna uprate projects that were placed in service in 2008 and 2009. Depreciation expense increased in 2008 compared with 2007, primarily due to the Montour scrubbers and the Susquehanna uprate project that were placed in service in 2008.
• Interest expense increased in 2008 compared with 2007,
primarily due to increased interest on long-term debt resulting from new issuances, partially offset by hedging activities.
• Income taxes increased in 2009 compared with 2008, in part
due to lower domestic manufacturing deductions in 2009. Income taxes increased in 2008 compared with 2007, primarily due to the loss of synfuel tax credits as the projects ceased operation at the end of 2007.
• Special items decreased in 2009 compared with 2008,
primarily due to a $476 million after-tax change in energy-related economic activity. The change is primarily the result of certain power and gas cash flow hedges failing hedge effectiveness testing in the third and fourth quarters of 2008, as well as the first quarter of 2009. Hedge accounting is not permitted for the quarter in which this occurs and, accordingly, the entire change in fair value for the periods that failed was recorded to the income statement. However, these transactions were not dedesignated as hedges, as prospective regression analysis demonstrated that these hedges are expected to be highly effective over their term. For 2008, an after-tax gain of $298 million was recognized in earnings as a result of these hedge failures. During the second, third and
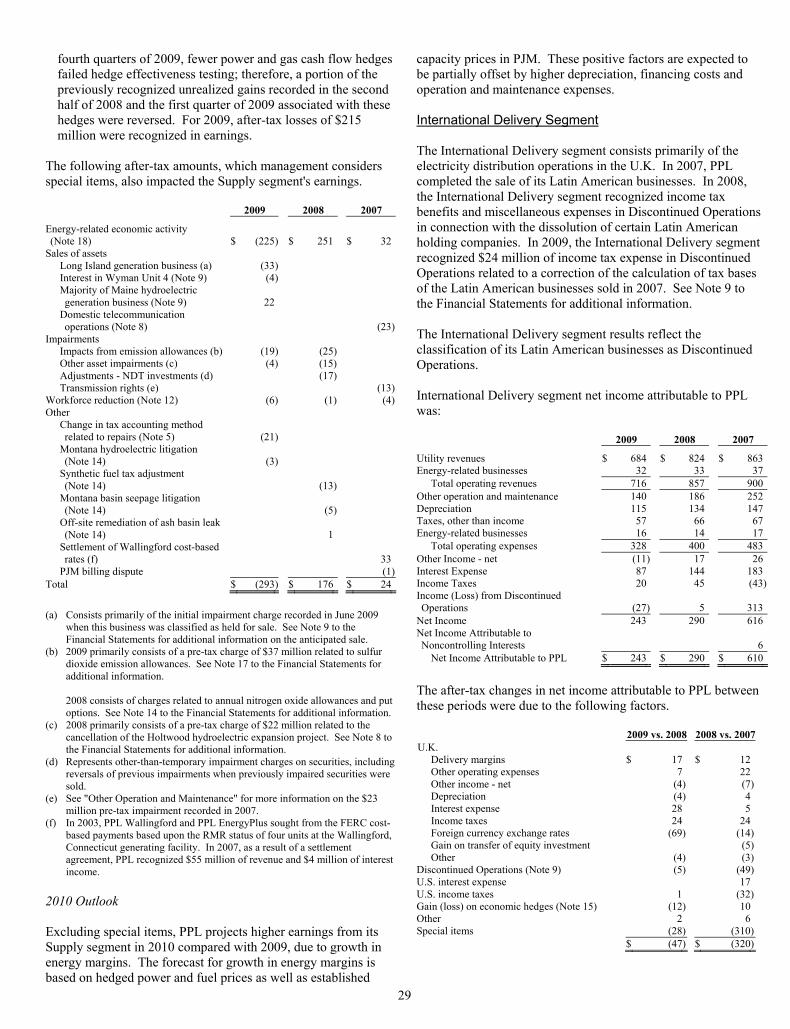
29
fourth quarters of 2009, fewer power and gas cash flow hedges failed hedge effectiveness testing; therefore, a portion of the previously recognized unrealized gains recorded in the second half of 2008 and the first quarter of 2009 associated with these hedges were reversed. For 2009, after-tax losses of $215 million were recognized in earnings.
The following after-tax amounts, which management considers special items, also impacted the Supply segment's earnings. 2009 2008 2007
Energy-related economic activity (Note 18) $ (225 ) $ 251 $ 32
Sales of assets Long Island generation business (a) (33 ) Interest in Wyman Unit 4 (Note 9) (4 ) Majority of Maine hydroelectric generation business (Note 9) 22
Domestic telecommunication operations (Note 8) (23)
Impairments Impacts from emission allowances (b) (19 ) (25) Other asset impairments (c) (4 ) (15) Adjustments - NDT investments (d) (17) Transmission rights (e) (13)
Workforce reduction (Note 12) (6 ) (1) (4)Other
Change in tax accounting method related to repairs (Note 5) (21 )
Montana hydroelectric litigation (Note 14) (3 )
Synthetic fuel tax adjustment (Note 14) (13)
Montana basin seepage litigation (Note 14) (5)
Off-site remediation of ash basin leak (Note 14) 1
Settlement of Wallingford cost-based rates (f) 33
PJM billing dispute (1)Total $ (293 ) $ 176 $ 24
(a) Consists primarily of the initial impairment charge recorded in June 2009
when this business was classified as held for sale. See Note 9 to the Financial Statements for additional information on the anticipated sale.
(b) 2009 primarily consists of a pre-tax charge of $37 million related to sulfur dioxide emission allowances. See Note 17 to the Financial Statements for additional information. 2008 consists of charges related to annual nitrogen oxide allowances and put options. See Note 14 to the Financial Statements for additional information.
(c) 2008 primarily consists of a pre-tax charge of $22 million related to the cancellation of the Holtwood hydroelectric expansion project. See Note 8 to the Financial Statements for additional information.
(d) Represents other-than-temporary impairment charges on securities, including reversals of previous impairments when previously impaired securities were sold.
(e) See "Other Operation and Maintenance" for more information on the $23 million pre-tax impairment recorded in 2007.
(f) In 2003, PPL Wallingford and PPL EnergyPlus sought from the FERC cost-based payments based upon the RMR status of four units at the Wallingford, Connecticut generating facility. In 2007, as a result of a settlement agreement, PPL recognized $55 million of revenue and $4 million of interest income.
2010 Outlook Excluding special items, PPL projects higher earnings from its Supply segment in 2010 compared with 2009, due to growth in energy margins. The forecast for growth in energy margins is based on hedged power and fuel prices as well as established
capacity prices in PJM. These positive factors are expected to be partially offset by higher depreciation, financing costs and operation and maintenance expenses. International Delivery Segment The International Delivery segment consists primarily of the electricity distribution operations in the U.K. In 2007, PPL completed the sale of its Latin American businesses. In 2008, the International Delivery segment recognized income tax benefits and miscellaneous expenses in Discontinued Operations in connection with the dissolution of certain Latin American holding companies. In 2009, the International Delivery segment recognized $24 million of income tax expense in Discontinued Operations related to a correction of the calculation of tax bases of the Latin American businesses sold in 2007. See Note 9 to the Financial Statements for additional information. The International Delivery segment results reflect the classification of its Latin American businesses as Discontinued Operations. International Delivery segment net income attributable to PPL was: 2009 2008 2007
Utility revenues $ 684 $ 824 $ 863Energy-related businesses 32 33 37
Total operating revenues 716 857 900Other operation and maintenance 140 186 252Depreciation 115 134 147Taxes, other than income 57 66 67Energy-related businesses 16 14 17
Total operating expenses 328 400 483Other Income - net (11) 17 26Interest Expense 87 144 183Income Taxes 20 45 (43)Income (Loss) from Discontinued Operations (27) 5 313
Net Income 243 290 616Net Income Attributable to Noncontrolling Interests 6
Net Income Attributable to PPL $ 243 $ 290 $ 610
The after-tax changes in net income attributable to PPL between these periods were due to the following factors. 2009 vs. 2008 2008 vs. 2007U.K.
Delivery margins $ 17 $ 12 Other operating expenses 7 22 Other income - net (4) (7)Depreciation (4) 4 Interest expense 28 5 Income taxes 24 24 Foreign currency exchange rates (69) (14)Gain on transfer of equity investment (5)Other (4) (3)
Discontinued Operations (Note 9) (5) (49)U.S. interest expense 17 U.S. income taxes 1 (32)Gain (loss) on economic hedges (Note 15) (12) 10 Other 2 6 Special items (28) (310) $ (47) $ (320)
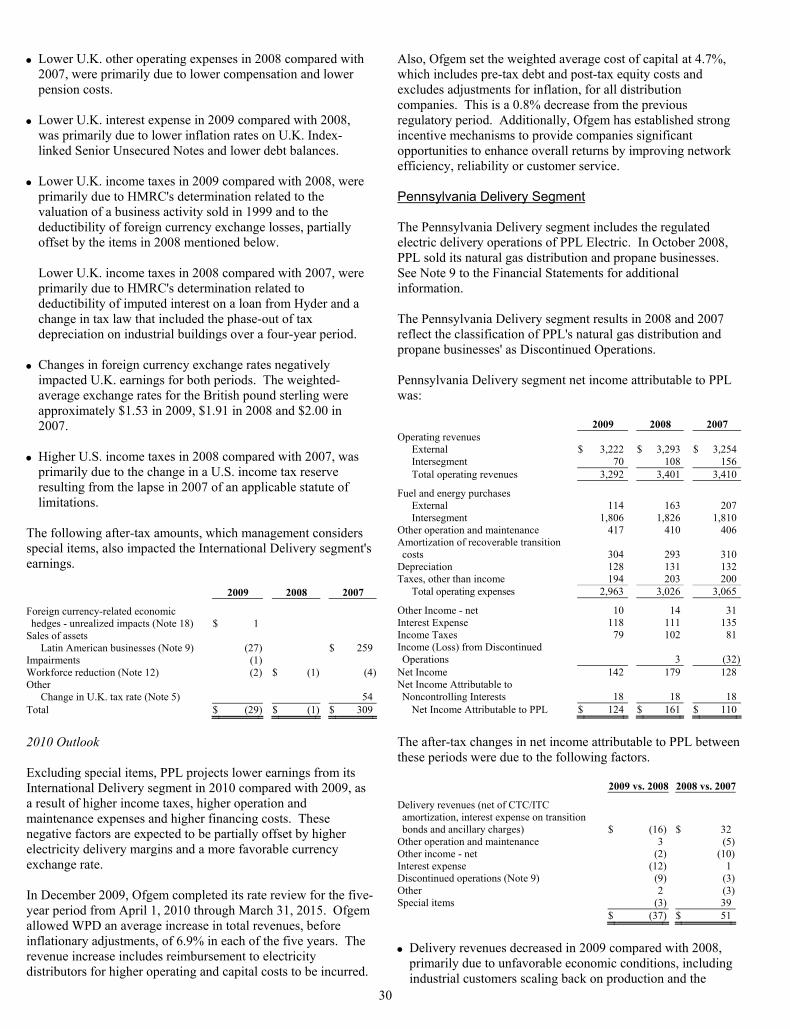
30
• Lower U.K. other operating expenses in 2008 compared with 2007, were primarily due to lower compensation and lower pension costs.
• Lower U.K. interest expense in 2009 compared with 2008,
was primarily due to lower inflation rates on U.K. Index-linked Senior Unsecured Notes and lower debt balances.
• Lower U.K. income taxes in 2009 compared with 2008, were
primarily due to HMRC's determination related to the valuation of a business activity sold in 1999 and to the deductibility of foreign currency exchange losses, partially offset by the items in 2008 mentioned below. Lower U.K. income taxes in 2008 compared with 2007, were primarily due to HMRC's determination related to deductibility of imputed interest on a loan from Hyder and a change in tax law that included the phase-out of tax depreciation on industrial buildings over a four-year period.
• Changes in foreign currency exchange rates negatively
impacted U.K. earnings for both periods. The weighted-average exchange rates for the British pound sterling were approximately $1.53 in 2009, $1.91 in 2008 and $2.00 in 2007.
• Higher U.S. income taxes in 2008 compared with 2007, was
primarily due to the change in a U.S. income tax reserve resulting from the lapse in 2007 of an applicable statute of limitations.
The following after-tax amounts, which management considers special items, also impacted the International Delivery segment's earnings. 2009 2008 2007
Foreign currency-related economic hedges - unrealized impacts (Note 18) $ 1
Sales of assets Latin American businesses (Note 9) (27 ) $ 259
Impairments (1 ) Workforce reduction (Note 12) (2 ) $ (1) (4)Other
Change in U.K. tax rate (Note 5) 54Total $ (29 ) $ (1) $ 309
2010 Outlook Excluding special items, PPL projects lower earnings from its International Delivery segment in 2010 compared with 2009, as a result of higher income taxes, higher operation and maintenance expenses and higher financing costs. These negative factors are expected to be partially offset by higher electricity delivery margins and a more favorable currency exchange rate. In December 2009, Ofgem completed its rate review for the five-year period from April 1, 2010 through March 31, 2015. Ofgem allowed WPD an average increase in total revenues, before inflationary adjustments, of 6.9% in each of the five years. The revenue increase includes reimbursement to electricity distributors for higher operating and capital costs to be incurred.
Also, Ofgem set the weighted average cost of capital at 4.7%, which includes pre-tax debt and post-tax equity costs and excludes adjustments for inflation, for all distribution companies. This is a 0.8% decrease from the previous regulatory period. Additionally, Ofgem has established strong incentive mechanisms to provide companies significant opportunities to enhance overall returns by improving network efficiency, reliability or customer service. Pennsylvania Delivery Segment The Pennsylvania Delivery segment includes the regulated electric delivery operations of PPL Electric. In October 2008, PPL sold its natural gas distribution and propane businesses. See Note 9 to the Financial Statements for additional information. The Pennsylvania Delivery segment results in 2008 and 2007 reflect the classification of PPL's natural gas distribution and propane businesses' as Discontinued Operations. Pennsylvania Delivery segment net income attributable to PPL was: 2009 2008 2007 Operating revenues
External $ 3,222 $ 3,293 $ 3,254Intersegment 70 108 156Total operating revenues 3,292 3,401 3,410
Fuel and energy purchases External 114 163 207Intersegment 1,806 1,826 1,810
Other operation and maintenance 417 410 406Amortization of recoverable transition costs 304 293 310
Depreciation 128 131 132Taxes, other than income 194 203 200
Total operating expenses 2,963 3,026 3,065
Other Income - net 10 14 31Interest Expense 118 111 135Income Taxes 79 102 81Income (Loss) from Discontinued Operations 3 (32)
Net Income 142 179 128Net Income Attributable to Noncontrolling Interests 18 18 18
Net Income Attributable to PPL $ 124 $ 161 $ 110
The after-tax changes in net income attributable to PPL between these periods were due to the following factors. 2009 vs. 2008 2008 vs. 2007
Delivery revenues (net of CTC/ITC amortization, interest expense on transition bonds and ancillary charges) $ (16) $ 32
Other operation and maintenance 3 (5)Other income - net (2) (10)Interest expense (12) 1Discontinued operations (Note 9) (9) (3)Other 2 (3)Special items (3) 39 $ (37) $ 51
• Delivery revenues decreased in 2009 compared with 2008,
primarily due to unfavorable economic conditions, including industrial customers scaling back on production and the
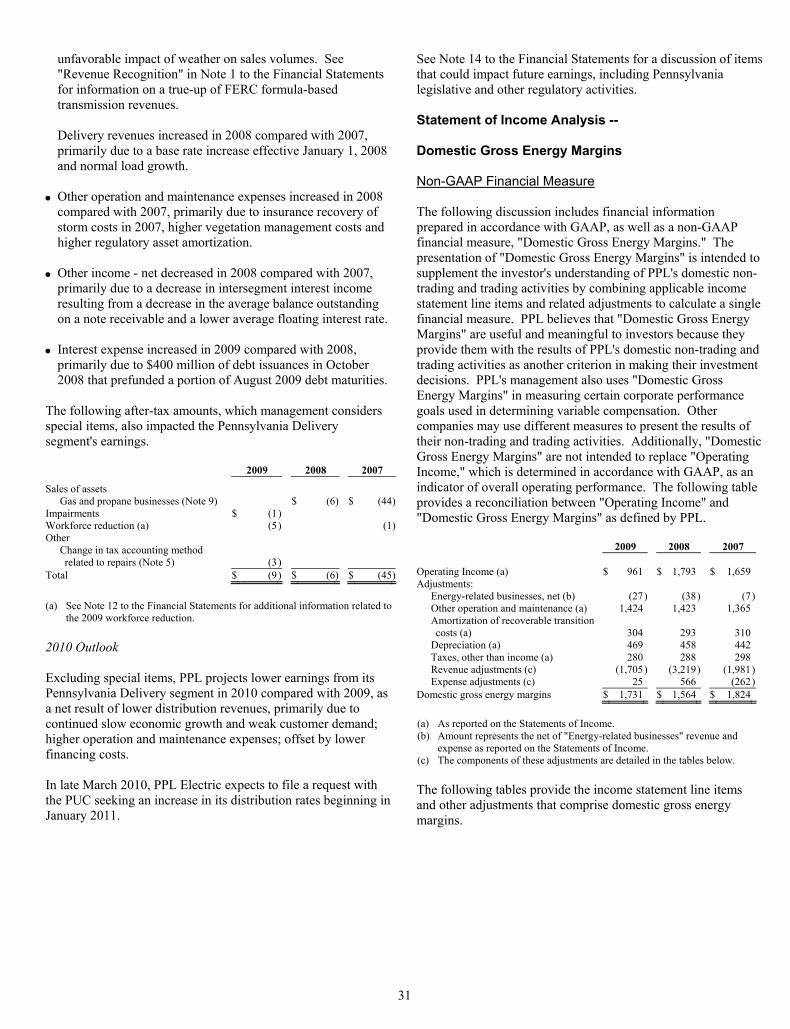
31
unfavorable impact of weather on sales volumes. See "Revenue Recognition" in Note 1 to the Financial Statements for information on a true-up of FERC formula-based transmission revenues. Delivery revenues increased in 2008 compared with 2007, primarily due to a base rate increase effective January 1, 2008 and normal load growth.
• Other operation and maintenance expenses increased in 2008
compared with 2007, primarily due to insurance recovery of storm costs in 2007, higher vegetation management costs and higher regulatory asset amortization.
• Other income - net decreased in 2008 compared with 2007,
primarily due to a decrease in intersegment interest income resulting from a decrease in the average balance outstanding on a note receivable and a lower average floating interest rate.
• Interest expense increased in 2009 compared with 2008,
primarily due to $400 million of debt issuances in October 2008 that prefunded a portion of August 2009 debt maturities.
The following after-tax amounts, which management considers special items, also impacted the Pennsylvania Delivery segment's earnings. 2009 2008 2007
Sales of assets Gas and propane businesses (Note 9) $ (6) $ (44)
Impairments $ (1 ) Workforce reduction (a) (5 ) (1)Other
Change in tax accounting method related to repairs (Note 5) (3 )
Total $ (9 ) $ (6) $ (45)
(a) See Note 12 to the Financial Statements for additional information related to
the 2009 workforce reduction. 2010 Outlook Excluding special items, PPL projects lower earnings from its Pennsylvania Delivery segment in 2010 compared with 2009, as a net result of lower distribution revenues, primarily due to continued slow economic growth and weak customer demand; higher operation and maintenance expenses; offset by lower financing costs. In late March 2010, PPL Electric expects to file a request with the PUC seeking an increase in its distribution rates beginning in January 2011.
See Note 14 to the Financial Statements for a discussion of items that could impact future earnings, including Pennsylvania legislative and other regulatory activities. Statement of Income Analysis -- Domestic Gross Energy Margins Non-GAAP Financial Measure The following discussion includes financial information prepared in accordance with GAAP, as well as a non-GAAP financial measure, "Domestic Gross Energy Margins." The presentation of "Domestic Gross Energy Margins" is intended to supplement the investor's understanding of PPL's domestic non-trading and trading activities by combining applicable income statement line items and related adjustments to calculate a single financial measure. PPL believes that "Domestic Gross Energy Margins" are useful and meaningful to investors because they provide them with the results of PPL's domestic non-trading and trading activities as another criterion in making their investment decisions. PPL's management also uses "Domestic Gross Energy Margins" in measuring certain corporate performance goals used in determining variable compensation. Other companies may use different measures to present the results of their non-trading and trading activities. Additionally, "Domestic Gross Energy Margins" are not intended to replace "Operating Income," which is determined in accordance with GAAP, as an indicator of overall operating performance. The following table provides a reconciliation between "Operating Income" and "Domestic Gross Energy Margins" as defined by PPL. 2009 2008 2007 Operating Income (a) $ 961 $ 1,793 $ 1,659Adjustments:
Energy-related businesses, net (b) (27) (38) (7)Other operation and maintenance (a) 1,424 1,423 1,365Amortization of recoverable transition costs (a) 304 293 310
Depreciation (a) 469 458 442Taxes, other than income (a) 280 288 298Revenue adjustments (c) (1,705) (3,219) (1,981)Expense adjustments (c) 25 566 (262)
Domestic gross energy margins $ 1,731 $ 1,564 $ 1,824 (a) As reported on the Statements of Income. (b) Amount represents the net of "Energy-related businesses" revenue and
expense as reported on the Statements of Income. (c) The components of these adjustments are detailed in the tables below. The following tables provide the income statement line items and other adjustments that comprise domestic gross energy margins.
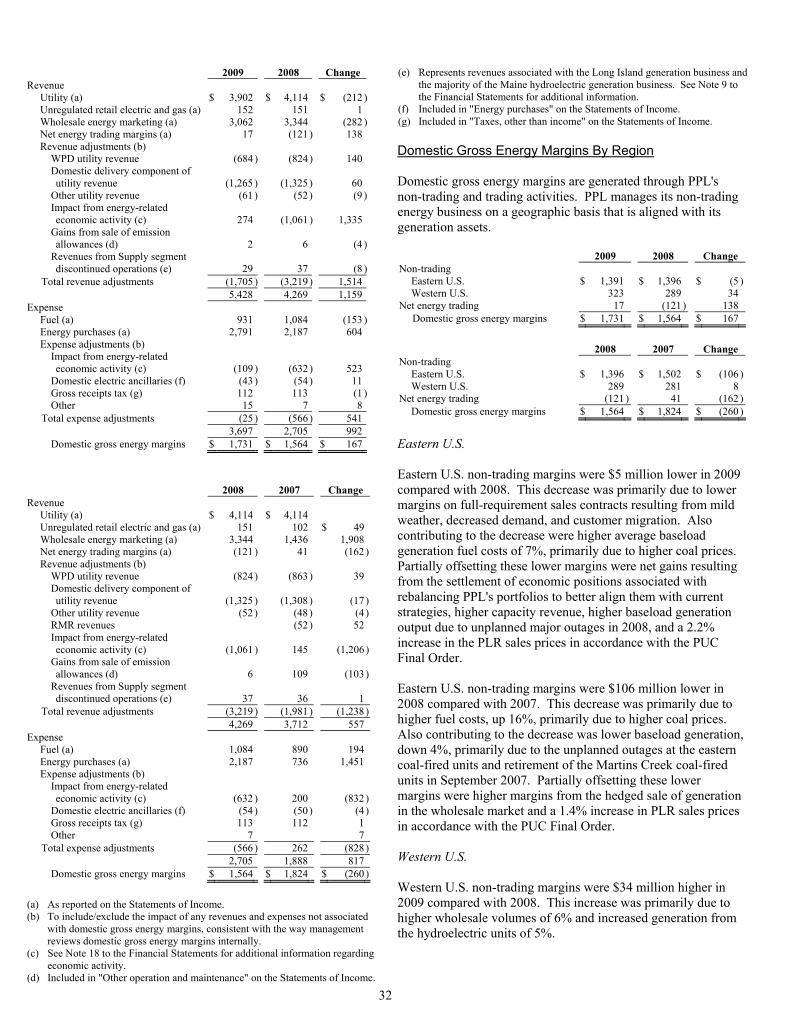
32
2009 2008 Change Revenue
Utility (a) $ 3,902 $ 4,114 $ (212 )Unregulated retail electric and gas (a) 152 151 1Wholesale energy marketing (a) 3,062 3,344 (282 )Net energy trading margins (a) 17 (121 ) 138Revenue adjustments (b)
WPD utility revenue (684 ) (824 ) 140Domestic delivery component of utility revenue (1,265 ) (1,325 ) 60
Other utility revenue (61 ) (52 ) (9 )Impact from energy-related economic activity (c) 274 (1,061 ) 1,335
Gains from sale of emission allowances (d) 2 6 (4 )
Revenues from Supply segment discontinued operations (e) 29 37 (8 )
Total revenue adjustments (1,705 ) (3,219 ) 1,514 5,428 4,269 1,159
Expense Fuel (a) 931 1,084 (153 )Energy purchases (a) 2,791 2,187 604Expense adjustments (b)
Impact from energy-related economic activity (c) (109 ) (632 ) 523
Domestic electric ancillaries (f) (43 ) (54 ) 11Gross receipts tax (g) 112 113 (1 )Other 15 7 8
Total expense adjustments (25 ) (566 ) 541 3,697 2,705 992Domestic gross energy margins $ 1,731 $ 1,564 $ 167
2008 2007 Change Revenue
Utility (a) $ 4,114 $ 4,114 Unregulated retail electric and gas (a) 151 102 $ 49Wholesale energy marketing (a) 3,344 1,436 1,908Net energy trading margins (a) (121 ) 41 (162 )Revenue adjustments (b)
WPD utility revenue (824 ) (863 ) 39Domestic delivery component of utility revenue (1,325 ) (1,308 ) (17 )
Other utility revenue (52 ) (48 ) (4 )RMR revenues (52 ) 52Impact from energy-related economic activity (c) (1,061 ) 145 (1,206 )
Gains from sale of emission allowances (d) 6 109 (103 )
Revenues from Supply segment discontinued operations (e) 37 36 1
Total revenue adjustments (3,219 ) (1,981 ) (1,238 ) 4,269 3,712 557
Expense Fuel (a) 1,084 890 194Energy purchases (a) 2,187 736 1,451Expense adjustments (b)
Impact from energy-related economic activity (c) (632 ) 200 (832 )
Domestic electric ancillaries (f) (54 ) (50 ) (4 )Gross receipts tax (g) 113 112 1Other 7 7
Total expense adjustments (566 ) 262 (828 ) 2,705 1,888 817Domestic gross energy margins $ 1,564 $ 1,824 $ (260 )
(a) As reported on the Statements of Income. (b) To include/exclude the impact of any revenues and expenses not associated
with domestic gross energy margins, consistent with the way management reviews domestic gross energy margins internally.
(c) See Note 18 to the Financial Statements for additional information regarding economic activity.
(d) Included in "Other operation and maintenance" on the Statements of Income.
(e) Represents revenues associated with the Long Island generation business and
the majority of the Maine hydroelectric generation business. See Note 9 to the Financial Statements for additional information.
(f) Included in "Energy purchases" on the Statements of Income. (g) Included in "Taxes, other than income" on the Statements of Income. Domestic Gross Energy Margins By Region Domestic gross energy margins are generated through PPL's non-trading and trading activities. PPL manages its non-trading energy business on a geographic basis that is aligned with its generation assets. 2009 2008 Change Non-trading
Eastern U.S. $ 1,391 $ 1,396 $ (5 )Western U.S. 323 289 34
Net energy trading 17 (121 ) 138 Domestic gross energy margins $ 1,731 $ 1,564 $ 167
2008 2007 Change Non-trading
Eastern U.S. $ 1,396 $ 1,502 $ (106 )Western U.S. 289 281 8
Net energy trading (121 ) 41 (162 )Domestic gross energy margins $ 1,564 $ 1,824 $ (260 )
Eastern U.S. Eastern U.S. non-trading margins were $5 million lower in 2009 compared with 2008. This decrease was primarily due to lower margins on full-requirement sales contracts resulting from mild weather, decreased demand, and customer migration. Also contributing to the decrease were higher average baseload generation fuel costs of 7%, primarily due to higher coal prices. Partially offsetting these lower margins were net gains resulting from the settlement of economic positions associated with rebalancing PPL's portfolios to better align them with current strategies, higher capacity revenue, higher baseload generation output due to unplanned major outages in 2008, and a 2.2% increase in the PLR sales prices in accordance with the PUC Final Order. Eastern U.S. non-trading margins were $106 million lower in 2008 compared with 2007. This decrease was primarily due to higher fuel costs, up 16%, primarily due to higher coal prices. Also contributing to the decrease was lower baseload generation, down 4%, primarily due to the unplanned outages at the eastern coal-fired units and retirement of the Martins Creek coal-fired units in September 2007. Partially offsetting these lower margins were higher margins from the hedged sale of generation in the wholesale market and a 1.4% increase in PLR sales prices in accordance with the PUC Final Order. Western U.S. Western U.S. non-trading margins were $34 million higher in 2009 compared with 2008. This increase was primarily due to higher wholesale volumes of 6% and increased generation from the hydroelectric units of 5%.
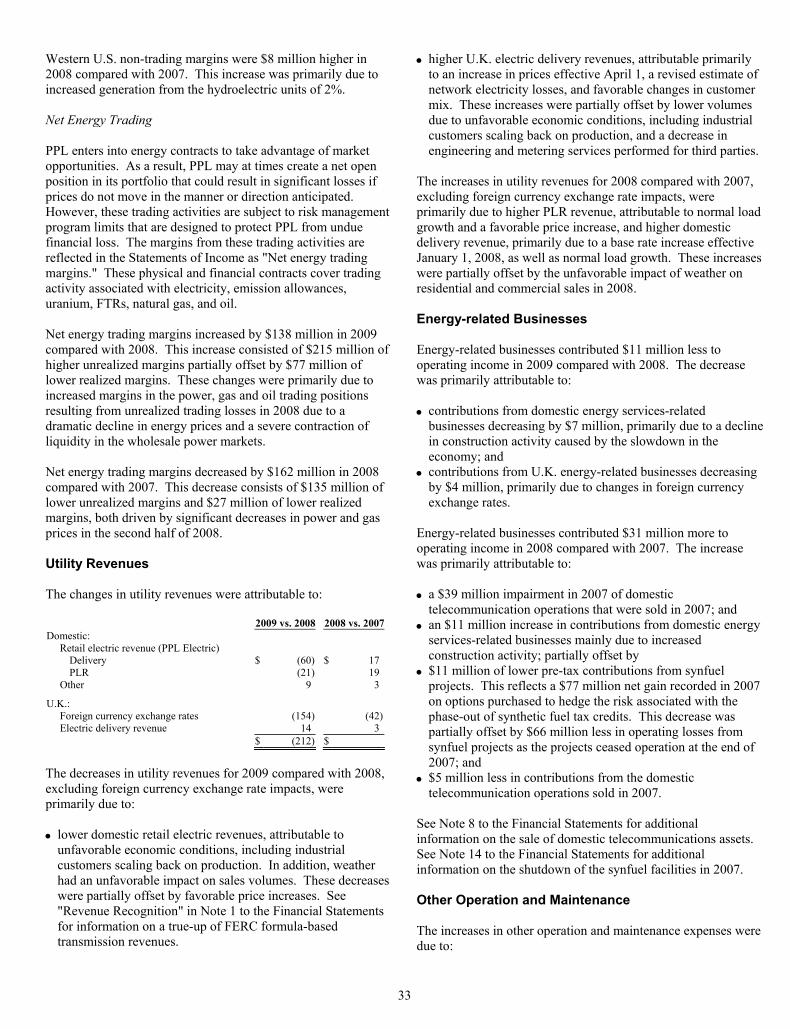
33
Western U.S. non-trading margins were $8 million higher in 2008 compared with 2007. This increase was primarily due to increased generation from the hydroelectric units of 2%. Net Energy Trading PPL enters into energy contracts to take advantage of market opportunities. As a result, PPL may at times create a net open position in its portfolio that could result in significant losses if prices do not move in the manner or direction anticipated. However, these trading activities are subject to risk management program limits that are designed to protect PPL from undue financial loss. The margins from these trading activities are reflected in the Statements of Income as "Net energy trading margins." These physical and financial contracts cover trading activity associated with electricity, emission allowances, uranium, FTRs, natural gas, and oil. Net energy trading margins increased by $138 million in 2009 compared with 2008. This increase consisted of $215 million of higher unrealized margins partially offset by $77 million of lower realized margins. These changes were primarily due to increased margins in the power, gas and oil trading positions resulting from unrealized trading losses in 2008 due to a dramatic decline in energy prices and a severe contraction of liquidity in the wholesale power markets. Net energy trading margins decreased by $162 million in 2008 compared with 2007. This decrease consists of $135 million of lower unrealized margins and $27 million of lower realized margins, both driven by significant decreases in power and gas prices in the second half of 2008. Utility Revenues The changes in utility revenues were attributable to: 2009 vs. 2008 2008 vs. 2007Domestic:
Retail electric revenue (PPL Electric) Delivery $ (60) $ 17 PLR (21) 19
Other 9 3
U.K.: Foreign currency exchange rates (154) (42)Electric delivery revenue 14 3
$ (212) $
The decreases in utility revenues for 2009 compared with 2008, excluding foreign currency exchange rate impacts, were primarily due to: • lower domestic retail electric revenues, attributable to
unfavorable economic conditions, including industrial customers scaling back on production. In addition, weather had an unfavorable impact on sales volumes. These decreases were partially offset by favorable price increases. See "Revenue Recognition" in Note 1 to the Financial Statements for information on a true-up of FERC formula-based transmission revenues.
• higher U.K. electric delivery revenues, attributable primarily to an increase in prices effective April 1, a revised estimate of network electricity losses, and favorable changes in customer mix. These increases were partially offset by lower volumes due to unfavorable economic conditions, including industrial customers scaling back on production, and a decrease in engineering and metering services performed for third parties.
The increases in utility revenues for 2008 compared with 2007, excluding foreign currency exchange rate impacts, were primarily due to higher PLR revenue, attributable to normal load growth and a favorable price increase, and higher domestic delivery revenue, primarily due to a base rate increase effective January 1, 2008, as well as normal load growth. These increases were partially offset by the unfavorable impact of weather on residential and commercial sales in 2008. Energy-related Businesses Energy-related businesses contributed $11 million less to operating income in 2009 compared with 2008. The decrease was primarily attributable to: • contributions from domestic energy services-related
businesses decreasing by $7 million, primarily due to a decline in construction activity caused by the slowdown in the economy; and
• contributions from U.K. energy-related businesses decreasing by $4 million, primarily due to changes in foreign currency exchange rates.
Energy-related businesses contributed $31 million more to operating income in 2008 compared with 2007. The increase was primarily attributable to: • a $39 million impairment in 2007 of domestic
telecommunication operations that were sold in 2007; and • an $11 million increase in contributions from domestic energy
services-related businesses mainly due to increased construction activity; partially offset by
• $11 million of lower pre-tax contributions from synfuel projects. This reflects a $77 million net gain recorded in 2007 on options purchased to hedge the risk associated with the phase-out of synthetic fuel tax credits. This decrease was partially offset by $66 million less in operating losses from synfuel projects as the projects ceased operation at the end of 2007; and
• $5 million less in contributions from the domestic telecommunication operations sold in 2007.
See Note 8 to the Financial Statements for additional information on the sale of domestic telecommunications assets. See Note 14 to the Financial Statements for additional information on the shutdown of the synfuel facilities in 2007. Other Operation and Maintenance The increases in other operation and maintenance expenses were due to:
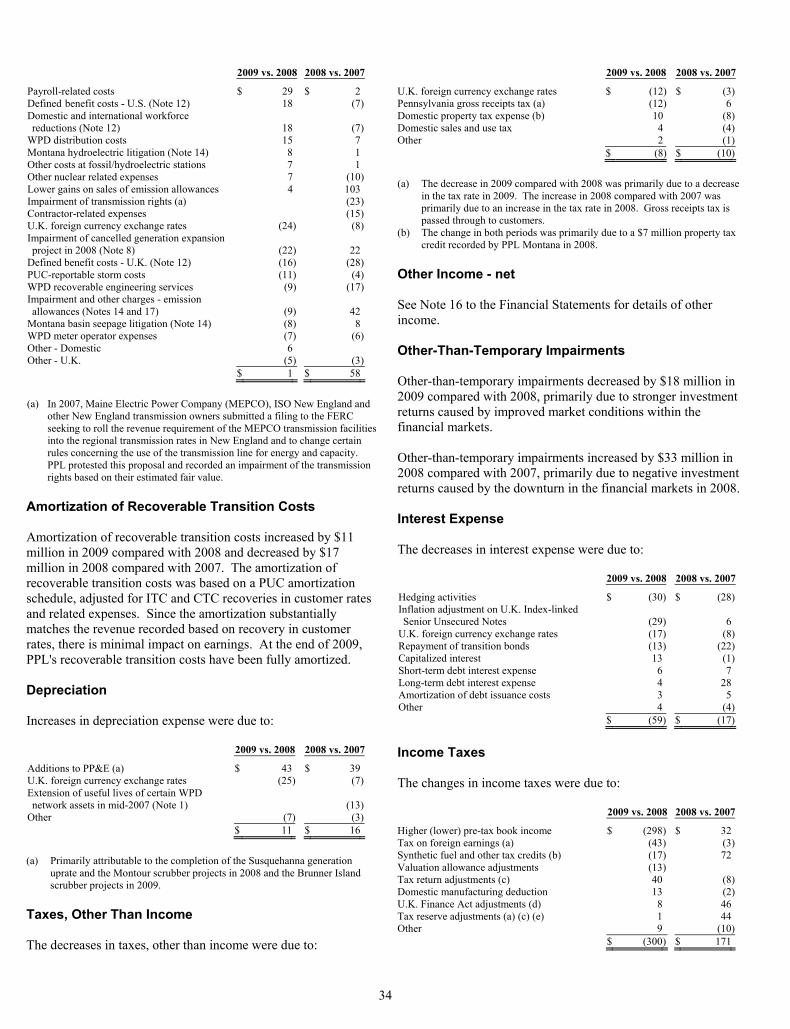
34
2009 vs. 2008 2008 vs. 2007
Payroll-related costs $ 29 $ 2Defined benefit costs - U.S. (Note 12) 18 (7)Domestic and international workforce reductions (Note 12) 18 (7)
WPD distribution costs 15 7Montana hydroelectric litigation (Note 14) 8 1Other costs at fossil/hydroelectric stations 7 1Other nuclear related expenses 7 (10)Lower gains on sales of emission allowances 4 103Impairment of transmission rights (a) (23)Contractor-related expenses (15)U.K. foreign currency exchange rates (24) (8)Impairment of cancelled generation expansion project in 2008 (Note 8) (22) 22
Defined benefit costs - U.K. (Note 12) (16) (28)PUC-reportable storm costs (11) (4)WPD recoverable engineering services (9) (17)Impairment and other charges - emission allowances (Notes 14 and 17) (9) 42
Montana basin seepage litigation (Note 14) (8) 8WPD meter operator expenses (7) (6)Other - Domestic 6 Other - U.K. (5) (3) $ 1 $ 58
(a) In 2007, Maine Electric Power Company (MEPCO), ISO New England and
other New England transmission owners submitted a filing to the FERC seeking to roll the revenue requirement of the MEPCO transmission facilities into the regional transmission rates in New England and to change certain rules concerning the use of the transmission line for energy and capacity. PPL protested this proposal and recorded an impairment of the transmission rights based on their estimated fair value.
Amortization of Recoverable Transition Costs Amortization of recoverable transition costs increased by $11 million in 2009 compared with 2008 and decreased by $17 million in 2008 compared with 2007. The amortization of recoverable transition costs was based on a PUC amortization schedule, adjusted for ITC and CTC recoveries in customer rates and related expenses. Since the amortization substantially matches the revenue recorded based on recovery in customer rates, there is minimal impact on earnings. At the end of 2009, PPL's recoverable transition costs have been fully amortized. Depreciation Increases in depreciation expense were due to: 2009 vs. 2008 2008 vs. 2007
Additions to PP&E (a) $ 43 $ 39U.K. foreign currency exchange rates (25) (7)Extension of useful lives of certain WPD network assets in mid-2007 (Note 1) (13)
Other (7) (3) $ 11 $ 16
(a) Primarily attributable to the completion of the Susquehanna generation
uprate and the Montour scrubber projects in 2008 and the Brunner Island scrubber projects in 2009.
Taxes, Other Than Income The decreases in taxes, other than income were due to:
2009 vs. 2008 2008 vs. 2007
U.K. foreign currency exchange rates $ (12) $ (3)Pennsylvania gross receipts tax (a) (12) 6Domestic property tax expense (b) 10 (8)Domestic sales and use tax 4 (4)Other 2 (1) $ (8) $ (10)
(a) The decrease in 2009 compared with 2008 was primarily due to a decrease
in the tax rate in 2009. The increase in 2008 compared with 2007 was primarily due to an increase in the tax rate in 2008. Gross receipts tax is passed through to customers.
(b) The change in both periods was primarily due to a $7 million property tax credit recorded by PPL Montana in 2008.
Other Income - net See Note 16 to the Financial Statements for details of other income. Other-Than-Temporary Impairments Other-than-temporary impairments decreased by $18 million in 2009 compared with 2008, primarily due to stronger investment returns caused by improved market conditions within the financial markets. Other-than-temporary impairments increased by $33 million in 2008 compared with 2007, primarily due to negative investment returns caused by the downturn in the financial markets in 2008. Interest Expense The decreases in interest expense were due to:
2009 vs. 2008 2008 vs. 2007
Hedging activities $ (30) $ (28)Inflation adjustment on U.K. Index-linked Senior Unsecured Notes (29) 6
U.K. foreign currency exchange rates (17) (8)Repayment of transition bonds (13) (22)Capitalized interest 13 (1)Short-term debt interest expense 6 7Long-term debt interest expense 4 28Amortization of debt issuance costs 3 5Other 4 (4) $ (59) $ (17)
Income Taxes The changes in income taxes were due to: 2009 vs. 2008 2008 vs. 2007
Higher (lower) pre-tax book income $ (298) $ 32Tax on foreign earnings (a) (43) (3)Synthetic fuel and other tax credits (b) (17) 72Valuation allowance adjustments (13) Tax return adjustments (c) 40 (8)Domestic manufacturing deduction 13 (2)U.K. Finance Act adjustments (d) 8 46Tax reserve adjustments (a) (c) (e) 1 44Other 9 (10) $ (300) $ 171
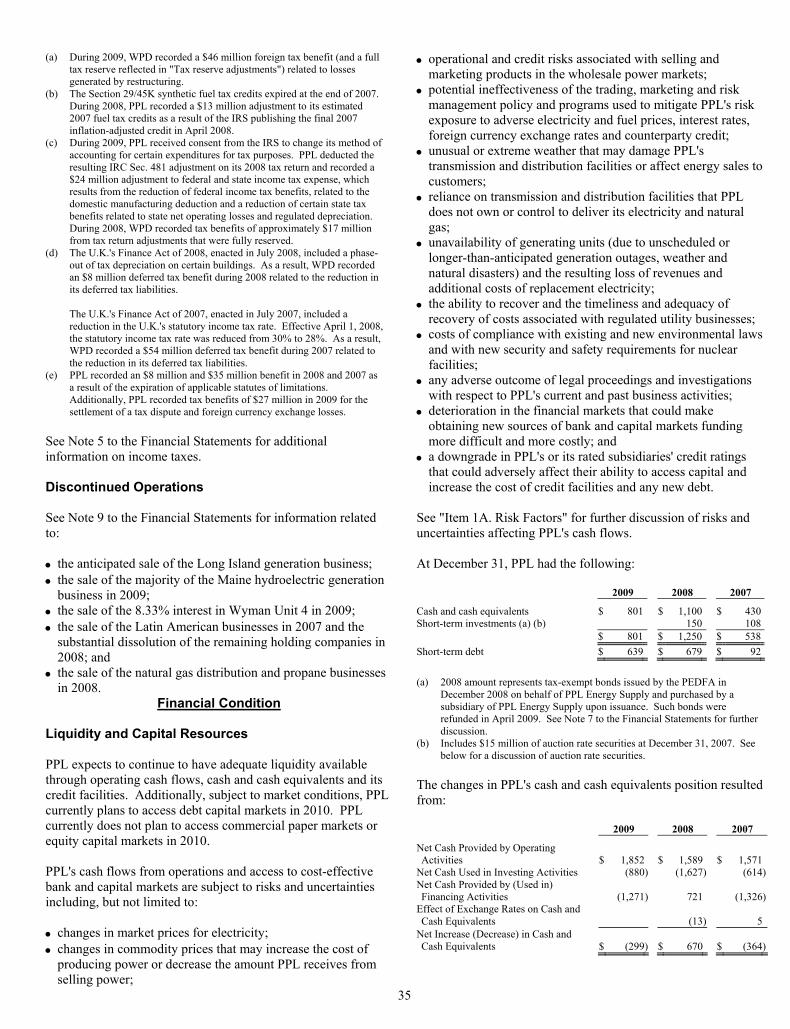
35
(a) During 2009, WPD recorded a $46 million foreign tax benefit (and a full tax reserve reflected in "Tax reserve adjustments") related to losses generated by restructuring.
(b) The Section 29/45K synthetic fuel tax credits expired at the end of 2007. During 2008, PPL recorded a $13 million adjustment to its estimated 2007 fuel tax credits as a result of the IRS publishing the final 2007 inflation-adjusted credit in April 2008.
(c) During 2009, PPL received consent from the IRS to change its method of accounting for certain expenditures for tax purposes. PPL deducted the resulting IRC Sec. 481 adjustment on its 2008 tax return and recorded a $24 million adjustment to federal and state income tax expense, which results from the reduction of federal income tax benefits, related to the domestic manufacturing deduction and a reduction of certain state tax benefits related to state net operating losses and regulated depreciation. During 2008, WPD recorded tax benefits of approximately $17 million from tax return adjustments that were fully reserved.
(d) The U.K.'s Finance Act of 2008, enacted in July 2008, included a phase-out of tax depreciation on certain buildings. As a result, WPD recorded an $8 million deferred tax benefit during 2008 related to the reduction in its deferred tax liabilities. The U.K.'s Finance Act of 2007, enacted in July 2007, included a reduction in the U.K.'s statutory income tax rate. Effective April 1, 2008, the statutory income tax rate was reduced from 30% to 28%. As a result, WPD recorded a $54 million deferred tax benefit during 2007 related to the reduction in its deferred tax liabilities.
(e) PPL recorded an $8 million and $35 million benefit in 2008 and 2007 as a result of the expiration of applicable statutes of limitations. Additionally, PPL recorded tax benefits of $27 million in 2009 for the settlement of a tax dispute and foreign currency exchange losses.
See Note 5 to the Financial Statements for additional information on income taxes. Discontinued Operations See Note 9 to the Financial Statements for information related to: • the anticipated sale of the Long Island generation business; • the sale of the majority of the Maine hydroelectric generation
business in 2009; • the sale of the 8.33% interest in Wyman Unit 4 in 2009; • the sale of the Latin American businesses in 2007 and the
substantial dissolution of the remaining holding companies in 2008; and
• the sale of the natural gas distribution and propane businesses in 2008.
Financial Condition Liquidity and Capital Resources PPL expects to continue to have adequate liquidity available through operating cash flows, cash and cash equivalents and its credit facilities. Additionally, subject to market conditions, PPL currently plans to access debt capital markets in 2010. PPL currently does not plan to access commercial paper markets or equity capital markets in 2010. PPL's cash flows from operations and access to cost-effective bank and capital markets are subject to risks and uncertainties including, but not limited to: • changes in market prices for electricity; • changes in commodity prices that may increase the cost of
producing power or decrease the amount PPL receives from selling power;
• operational and credit risks associated with selling and marketing products in the wholesale power markets;
• potential ineffectiveness of the trading, marketing and risk management policy and programs used to mitigate PPL's risk exposure to adverse electricity and fuel prices, interest rates, foreign currency exchange rates and counterparty credit;
• unusual or extreme weather that may damage PPL's transmission and distribution facilities or affect energy sales to customers;
• reliance on transmission and distribution facilities that PPL does not own or control to deliver its electricity and natural gas;
• unavailability of generating units (due to unscheduled or longer-than-anticipated generation outages, weather and natural disasters) and the resulting loss of revenues and additional costs of replacement electricity;
• the ability to recover and the timeliness and adequacy of recovery of costs associated with regulated utility businesses;
• costs of compliance with existing and new environmental laws and with new security and safety requirements for nuclear facilities;
• any adverse outcome of legal proceedings and investigations with respect to PPL's current and past business activities;
• deterioration in the financial markets that could make obtaining new sources of bank and capital markets funding more difficult and more costly; and
• a downgrade in PPL's or its rated subsidiaries' credit ratings that could adversely affect their ability to access capital and increase the cost of credit facilities and any new debt.
See "Item 1A. Risk Factors" for further discussion of risks and uncertainties affecting PPL's cash flows. At December 31, PPL had the following: 2009 2008 2007
Cash and cash equivalents $ 801 $ 1,100 $ 430Short-term investments (a) (b) 150 108 $ 801 $ 1,250 $ 538Short-term debt $ 639 $ 679 $ 92
(a) 2008 amount represents tax-exempt bonds issued by the PEDFA in
December 2008 on behalf of PPL Energy Supply and purchased by a subsidiary of PPL Energy Supply upon issuance. Such bonds were refunded in April 2009. See Note 7 to the Financial Statements for further discussion.
(b) Includes $15 million of auction rate securities at December 31, 2007. See below for a discussion of auction rate securities.
The changes in PPL's cash and cash equivalents position resulted from: 2009 2008 2007
Net Cash Provided by Operating Activities $ 1,852 $ 1,589 $ 1,571
Net Cash Used in Investing Activities (880) (1,627) (614)Net Cash Provided by (Used in) Financing Activities (1,271) 721 (1,326)
Effect of Exchange Rates on Cash and Cash Equivalents (13) 5
Net Increase (Decrease) in Cash and Cash Equivalents $ (299) $ 670 $ (364)
36
Auction Rate Securities PPL held auction rate securities with an aggregate par value of $25 million and $29 million at December 31, 2009 and 2008. Historically, an active market existed for such investments, and the auctions provided an opportunity for investors either to hold an investment at a periodically reset interest rate or to sell the investment at its par value for immediate liquidity. In early 2008, investor concerns about credit and liquidity in the financial markets, generally, as well as investor concerns over specific insurers that guarantee the credit of certain of the underlying securities, created uncertainty in the auction rate securities market and these securities generally failed to be remarketed through their established auction process. The auctions continue to fail and the resulting illiquidity continues to impact PPL's investment in auction rate securities. At December 31, 2008, PPL estimated that the fair value of its auction rate securities was $24 million, which is reflected in "Other investments" on the Balance Sheet and represented a temporary decline of $5 million from par value. In 2009, PPL liquidated $4 million of auction rate securities at par. At December 31, 2009, PPL estimated that the fair value of its auction rate securities was equal to par value, which was $25 million and is reflected in "Other investments" on the Balance Sheet. PPL reversed the previously recorded temporary impairment. Because PPL intends and has the ability to hold these auction rate securities until they can be liquidated at par value, PPL believes that it does not have significant exposure to realize losses on these securities. Based upon the evaluation of available information, PPL believes these investments continue to be of high credit quality. Additionally, PPL does not anticipate having to sell these securities to fund operations. See Notes 17 and 21 to the Financial Statements for further discussion of auction rate securities. Operating Activities Net cash provided by operating activities increased by 17%, or $263 million in 2009 compared with 2008, primarily as a result of cash collateral received from counterparties and the benefit of lower income tax payments due to the change in method of accounting for certain expenditures for tax purposes. These increases were partially offset by a decrease in accounts payable and the unfavorable impact of foreign currency exchange rates in 2009 compared with 2008. Net cash provided by operating activities increased by 1%, or $18 million, in 2008 compared with 2007, primarily as a result of higher revenues, primarily due to the hedged sale of generation in the wholesale market, increased retail electric sales volumes and a 1.4% increase in domestic delivery sales prices, as well as less U.S. income tax payments, primarily as a result of a refund received in 2008, and operating losses incurred in 2007 in connection with synfuel projects that ceased operation at the end of 2007. The increases to cash provided by operating activities resulting from these items were partially offset by increased expenditures for fuel, primarily due to higher coal
prices, lower realized net energy trading margins, driven by significant decreases in power and gas prices, higher interest paid, primarily due to higher debt levels in 2008, cash flows provided by Latin America's operations in 2007 but not 2008, due to the sale of the Latin American businesses in 2007, and an insurance recovery of storm costs in 2007. A significant portion of PPL's operating cash flows is derived from its Supply segment baseload generation business activities. PPL employs a formal hedging program for its baseload generation fleet, the primary objective of which is to provide a reasonable level of near-term cash flow and earnings certainty over the next three years, while preserving upside potential if power prices increase over the medium term. See Note 18 to the Financial Statements for further discussion. Based on its generation portfolio contracting practices (including related fuel purchases and commitments), PPL expects to achieve relatively stable cash flows related to baseload generation during the next three years, although, future cash flows from operating activities are expected to be influenced more by commodity prices than during the past nine years when long-term supply contracts were in place between PPL EnergyPlus and PPL Electric. As discussed in "Item 1. Business," PPL estimates that, on average, approximately 94% of its total expected annual generation output (which includes baseload and other generation) for 2010 is committed under power sales contracts. PPL has also entered into commitments of varying quantities and terms for the years 2011 and beyond. In addition, PPL expects to be able to achieve relatively stable cash flows related to PPL Electric's role as PLR due to contracts it has entered into to procure the 2010 and a portion of 2011 PLR electricity supply it expects to need for residential, small commercial and small industrial customers who do not choose an alternative supplier. See Note 14 to the Financial Statements for information on these energy purchase contracts. PPL's contracts for the sale and purchase of electricity and fuel often require cash collateral or other credit enhancements, or reductions or terminations of a portion of the entire contract through cash settlement, in the event of a downgrade of PPL's or its subsidiaries' credit ratings or adverse changes in market prices. For example, in addition to limiting its trading ability, if PPL's or its subsidiaries' ratings were lowered to below "investment grade" and there was a 10% adverse movement in energy prices, PPL estimates that, based on its December 31, 2009 positions, it would have had to post additional collateral of approximately $291 million, compared with $815 million at December 31, 2008. PPL has in place risk management programs that are designed to monitor and manage its exposure to volatility of cash flows related to changes in energy and fuel prices, interest rates, foreign currency exchange rates, counterparty credit quality and the operating performance of its generating units. Investing Activities The primary use of cash in investing activities is capital expenditures. See "Forecasted Uses of Cash" for detail regarding capital expenditures in 2009 and projected expenditures for the years 2010 through 2012.
37
Net cash used in investing activities decreased 46%, or $747 million in 2009 compared with 2008, primarily as a result of a change of $289 million from restricted cash and cash equivalents, a change of $249 million from purchases and sales of other investments, a change of $241 million from purchases and sales of intangible assets and a decrease of $193 million in capital expenditures. See Note 1 to the Financial Statements for a discussion of restricted cash and cash equivalents and Note 7 to the Financial Statements for a discussion of the purchase and sale by a subsidiary of PPL Energy Supply of Exempt Facilities Revenue Bonds issued by the PEDFA on behalf of PPL Energy Supply. The decrease in cash used in investing activities from the above items was partially offset by the change in proceeds received from the sale of businesses, which are discussed in Note 9 to the Financial Statements. PPL received $303 million from the sale of the gas and propane businesses in 2008 compared to proceeds of $81 million received from the sale of the majority of the Maine hydroelectric generation business in 2009. Net cash used in investing activities increased 165%, or $1.0 billion, in 2008 compared with 2007, as PPL received $303 million from the sale of the gas and propane businesses in 2008 compared to aggregate proceeds of $898 million received from the sale of the Latin American businesses and telecommunication operations in 2007. See Notes 8 and 9 to the Financial Statements for a discussion of these sales. Additionally, there was a change of $354 million from purchases and sales of other investments and a change of $359 million from purchases and sales of intangible assets. The increase in cash used in investing activities from the above items was partially offset by a decrease of $239 million in capital expenditures and a decrease of $54 million in the amount of cash and cash equivalents that became restricted. Financing Activities Net cash used in financing activities was $1.3 billion in 2009 compared with $721 million of cash provided by financing activities in 2008 and net cash used in financing activities of $1.3 billion in 2007. The change from 2008 to 2009 primarily reflects fewer issuances and increased retirements of long-term debt in 2009, as well as the net repayment of short-term borrowings in 2009. The change from 2007 to 2008 primarily reflects increased issuances and lower retirements of long-term debt, lower repurchases of common stock and increased short-term borrowings in 2008. In 2009, cash used in financing activities primarily consisted of net debt retirements of $770 million and common stock dividends paid of $517 million, partially offset by $60 million of common stock sale proceeds.
In 2008, cash provided by financing activities primarily consisted of net debt issuances of $1.3 billion and $19 million of common stock sale proceeds, partially offset by common stock dividends paid of $491 million and the repurchase of 802,816 shares of common stock for $38 million. In 2007, cash used in financing activities primarily consisted of net debt retirements of $170 million, the repurchase of 14,929,892 shares of common stock for $712 million and common stock dividends paid of $459 million, partially offset by $32 million of common stock sale proceeds. See Note 7 to the Financial Statements for a discussion of the common stock repurchase program. See "Forecasted Sources of Cash" for a discussion of PPL's plans to issue debt and equity securities, as well as a discussion of credit facility capacity available to PPL. Also see "Forecasted Uses of Cash" for a discussion of plans to pay dividends on common and preferred securities in the future, as well as maturities of long-term debt. PPL's debt financing activity in 2009 was: Issuances (a) Retirements
PPL Capital Funding Senior Unsecured Notes $ (201)PPL Energy Supply Senior Unsecured Notes (a) (220)PPL Electric Senior Secured Bonds (b) $ 298 (586)Variable Rate Pollution Control Facilities Note (9)PPL Electric short-term debt (95)WPD short-term debt (net change) 43
Total $ 341 $ (1,111)Net decrease $ (770) (a) In March 2009, PPL Energy Supply paid $220 million, plus accrued interest,
to complete tender offers to purchase up to $250 million aggregate principal amount of certain of its outstanding senior notes in order to reduce future interest expense. Under the Economic Stimulus Package, PPL will be permitted to defer recognition of income related to the extinguishment of these notes for tax purposes. No amounts will be included in taxable income for the first five years. Beginning in 2014, income related to the extinguishment of these notes will be included in taxable income ratably over five years.
(b) Issuance is net of pricing discount. Retirements exclude a $9 million premium paid in connection with the December 2009 redemption of PPL Electric's 4.30% Senior Secured Bonds due 2013.
See Note 7 to the Financial Statements for more detailed information regarding PPL's financing activities in 2009. Forecasted Sources of Cash PPL expects to continue to have significant sources of cash available in the near term, including various credit facilities, a commercial paper program and operating leases. PPL currently does not plan to access commercial paper markets in 2010 and plans to issue up to $300 million and £400 million in long-term debt securities in 2010, subject to market conditions. Credit Facilities At December 31, 2009, PPL's total committed borrowing capacity under credit facilities and the use of this borrowing capacity were:
38
Committed Capacity Borrowed
Letters of Credit
Issued (a) Unused
Capacity
PPL Energy Supply Domestic Credit Facilities (b) $ 4,125 $ 285 $ 662 $ 3,178
PPL Electric Credit Facilities (c) 340 6 334
Total Domestic Credit Facilities (d) $ 4,465 $ 285 $ 668 $ 3,512
WPDH Limited Credit Facility (e) ₤ 150 ₤ 132 n/a ₤ 18
WPD (South West) Credit Facilities (f) 214 60 ₤ 3 151
Total WPD Credit Facilities (g) ₤ 364 ₤ 192 ₤ 3 ₤ 169
(a) The borrower under each of these facilities has a reimbursement obligation to
the extent any letters of credit are drawn upon.
(b) PPL Energy Supply has the ability to borrow $3.6 billion under its credit facilities. Such borrowings generally bear interest at LIBOR-based rates plus a spread, depending upon the company's public debt rating. PPL Energy Supply also has the capability to cause the lenders to issue up to $3.9 billion of letters of credit under these facilities, which issuances reduce available borrowing capacity. Under certain conditions, PPL Energy Supply may request that the capacity of one of its facilities be increased by up to $500 million.
These credit facilities contain a financial covenant requiring debt to total capitalization to not exceed 65%. At December 31, 2009 and 2008, PPL Energy Supply's consolidated debt to total capitalization percentages, as calculated in accordance with its credit facilities, were 46% and 44%. The credit facilities also contain standard representations and warranties that must be made for PPL Energy Supply to borrow under them.
The committed capacity expires as follows: $600 million in 2010, $300 million in 2011 and $3.2 billion in 2012. PPL Energy Supply intends to renew or replace the two credit facilities that expire in 2010 in order to maintain its current total committed capacity level.
(c) Borrowings under PPL Electric's $190 million syndicated credit facility generally bear interest at LIBOR-based rates plus a spread, depending upon the company's public debt rating. PPL Electric also has the capability to request the lenders to issue up to $190 million of letters of credit under this facility, which issuances reduce available borrowing capacity. Under certain conditions, PPL Electric may request that the facility's capacity be increased by up to $100 million.
The syndicated credit facility contains a financial covenant requiring debt to total capitalization to not exceed 70%. At December 31, 2009 and 2008, PPL Electric's consolidated debt to total capitalization percentages, as calculated in accordance with its credit facility, were 44% and 53%. The syndicated credit facility also contains standard representations and warranties that must be made for PPL Electric to borrow under it.
Committed capacity includes a $150 million credit facility related to an asset-backed commercial paper program through which PPL Electric obtains financing by selling and contributing its eligible accounts receivable and unbilled revenues to a special purpose, wholly owned subsidiary on an ongoing basis. The subsidiary pledges these assets to secure loans of up to an aggregate of $150 million from a commercial paper conduit sponsored by a financial institution. At December 31, 2009, based on accounts receivable and unbilled revenue pledged, $150 million was available for borrowing.
The committed capacity expires as follows: $150 million in 2010 and $190 million in 2012. PPL Electric intends to renew its existing $150 million asset-backed credit facility in 2010 in order to maintain its current total committed capacity level.
(d) The commitments under PPL's domestic credit facilities are provided by a diverse bank group, with no one bank and its affiliates providing an aggregate commitment of more than 15% of the total committed capacity.
(e) Borrowings under WPDH Limited's credit facility bear interest at LIBOR-based rates plus a spread, depending upon the company's public debt rating.
This credit facility contains financial covenants that require WPDH Limited to maintain an interest coverage ratio of not less than 3.0 times consolidated earnings before income taxes, depreciation and amortization and a RAB that
exceeds total net debt by the higher of an amount equal to 15% of total net debt or £150 million, in each case as calculated in accordance with the credit facility. At December 31, 2009 and 2008, WPDH Limited's interest coverage ratios, as calculated in accordance with its credit facility, were 4.3 and 4.6. At December 31, 2009 and 2008, WPDH Limited's RAB, as calculated in accordance with the credit facility, exceeded its total net debt by £325 million, or 25%, and £385 million, or 31%.
(f) WPD (South West) has two credit facilities: one under which it can make cash borrowings and another under which it has the capability to cause the lender to issue up to approximately £4 million of letters of credit. Borrowings bear interest at LIBOR-based rates plus a margin.
The credit facility under which it can make cash borrowings contains financial covenants that require WPD (South West) to maintain an interest coverage ratio of not less than 3.0 times consolidated earnings before income taxes, depreciation and amortization and total net debt not in excess of 85% of RAB, in each case as calculated in accordance with the credit facility. At December 31, 2009, WPD (South West)'s interest coverage ratio, as calculated in accordance with its credit facility, was 5.3. At December 31, 2009, WPD (South West)'s total net debt, as calculated in accordance with the credit facility, was 67% of RAB.
(g) The commitments under WPD's credit facilities are provided by eight banks, with no one bank providing more than 25% of the total committed capacity.
The committed capacity of WPD's credit facilities expires as follows: £4 million in 2010, £210 million in 2012 and £150 million in 2013. WPD (South West) intends to renew its letter of credit facility that expires in 2010 in order for WPD to maintain its current total committed capacity level.
At December 31, 2009, the unused capacity of WPD's credit facilities was approximately $276 million.
In addition to the financial covenants noted in the table above, the credit agreements governing the credit facilities contain various other covenants. Failure to comply with the covenants after applicable grace periods could result in acceleration of repayment of borrowings and/or termination of the agreements. PPL monitors compliance with the covenants on a regular basis. At December 31, 2009, PPL was in material compliance with these covenants. At this time, PPL believes that these covenants and other borrowing conditions will not limit access to these funding sources. See Note 7 to the Financial Statements for further discussion of PPL's credit facilities. Commercial Paper PPL Energy Supply and PPL Electric usually maintain commercial paper programs, under which commercial paper issuances are supported by certain credit facilities of each company, to provide an additional financing source to fund their short-term liquidity needs, if and when necessary. As discussed below under "Credit Ratings," S&P lowered its rating on PPL Energy Supply's commercial paper to A-3 from A-2 in January 2009. Since PPL Energy Supply did not plan to issue any commercial paper during 2009 and there was essentially no liquidity in commercial paper markets for paper with an A-3 rating, PPL Energy Supply closed its $500 million commercial paper program in January 2009 and requested that Moody's, S&P and Fitch each withdraw their ratings on its commercial paper program, which each rating agency subsequently did. PPL Energy Supply may reopen its commercial paper program in the future, depending on market conditions and credit ratings,
39
to provide an additional financing source to fund its short-term liquidity needs, if and when necessary. Any future commercial paper issuances would be supported by PPL Energy Supply's credit facilities. PPL Electric has a $200 million commercial paper program in place. As noted below under "Credit Ratings," commercial paper for PPL Electric is rated P-2, A-2 and F2 by Moody's, S&P and Fitch. Market conditions to issue commercial paper with these ratings have strengthened significantly since 2008, when the downturn in the financial markets created extremely limited liquidity resulting in high borrowing rates. PPL Electric did not issue any commercial paper during 2009. Based on its current cash position and anticipated cash flows, PPL Electric currently does not plan to issue any commercial paper during 2010, but it may do so from time to time, subject to market conditions, to facilitate short-term cash flow needs. Operating Leases PPL and its subsidiaries also have available funding sources that are provided through operating leases. PPL's subsidiaries lease office space, land, buildings and certain equipment. These leasing structures provide PPL additional operating and financing flexibility. The operating leases contain covenants that are typical for these agreements, such as maintaining insurance, maintaining corporate existence and timely payment of rent and other fees. PPL, through its subsidiary PPL Montana, leases a 50% interest in Colstrip Units 1 and 2 and a 30% interest in Unit 3, under four 36-year, non-cancelable operating leases. These operating leases are not recorded on PPL's Balance Sheets. The leases place certain restrictions on PPL Montana's ability to incur additional debt, sell assets and declare dividends. At this time, PPL believes that these restrictions will not limit access to these funding sources or cause acceleration or termination of the leases. See Note 7 to the Financial Statements for a discussion of other dividend restrictions related to PPL subsidiaries. See Note 10 to the Financial Statements for further discussion of the operating leases. Long-Term Debt and Equity Securities Subject to market conditions, PPL and its subsidiaries currently plan to issue up to $300 million and £400 million in long-term debt securities in 2010. PPL expects to use the proceeds from these issuances for the repayment of short-term debt, to fund capital expenditures, and for general corporate purposes. PPL currently plans to issue new shares of common stock in 2010 in an aggregate amount of approximately $75 million under various employee stock-based compensation plans and its dividend reinvestment plan. Forecasted Uses of Cash In addition to expenditures required for normal operating activities, such as purchased power, payroll, fuel and taxes, PPL currently expects to incur future cash outflows for capital
expenditures, various contractual obligations, payment of dividends on its common and preferred securities and possibly the purchase or redemption of a portion of debt securities. Capital Expenditures The table below shows PPL's actual spending for the year 2009 and current capital expenditure projections for the years 2010 through 2012. Actual Projected 2009 2010 2011 2012 Construction expenditures (a) (b)
Generating facilities $ 361 $ 671 $ 673 $ 507 Transmission and distribution facilities 511 862 1,097 990
Environmental 178 63 19 99 Other 75 114 107 106 Total Construction Expenditures 1,125 1,710 1,896 1,702
Nuclear fuel 140 151 173 171 Total Capital Expenditures $ 1,265 $ 1,861 $ 2,069 $ 1,873
(a) Construction expenditures include capitalized interest and AFUDC, which
are expected to be approximately $190 million for the years 2010 through 2012.
(b) Includes expenditures for certain intangible assets. PPL's capital expenditure projections for the years 2010 through 2012 total approximately $5.8 billion. Capital expenditure plans are revised periodically to reflect changes in operational, market and regulatory conditions. This table includes projected costs related to the planned 239 MW of incremental capacity increases, PPL Electric's asset optimization program focused on the replacement of aging transmission and distribution assets, and the PJM-approved regional transmission line expansion project. See Note 8 to the Financial Statements for information on the PJM-approved regional transmission line expansion project and the other significant development projects. PPL plans to fund its capital expenditures in 2010 with cash on hand, cash from operations and proceeds from the issuance of debt securities. Contractual Obligations PPL has assumed various financial obligations and commitments in the ordinary course of conducting its business. At December 31, 2009, the estimated contractual cash obligations of PPL were:
Total
Less Than
1 Year 1-3
Years 4-5
Years After 5 Years
Long-term Debt (a) $ 7,066 $ 500 $ 1,447 $ 5,119Interest on Long-term Debt (b) 8,342 $ 421 812 705 6,404
Operating Leases 968 108 216 223 421Purchase Obligations (c) 8,123 3,153 2,212 868 1,890Other Long-term Liabilities Reflected on the Balance Sheet under GAAP (d) (e) 80 62 18
Total Contractual Cash Obligations $ 24,579 $ 3,744 $ 3,758 $ 3,243 $ 13,834
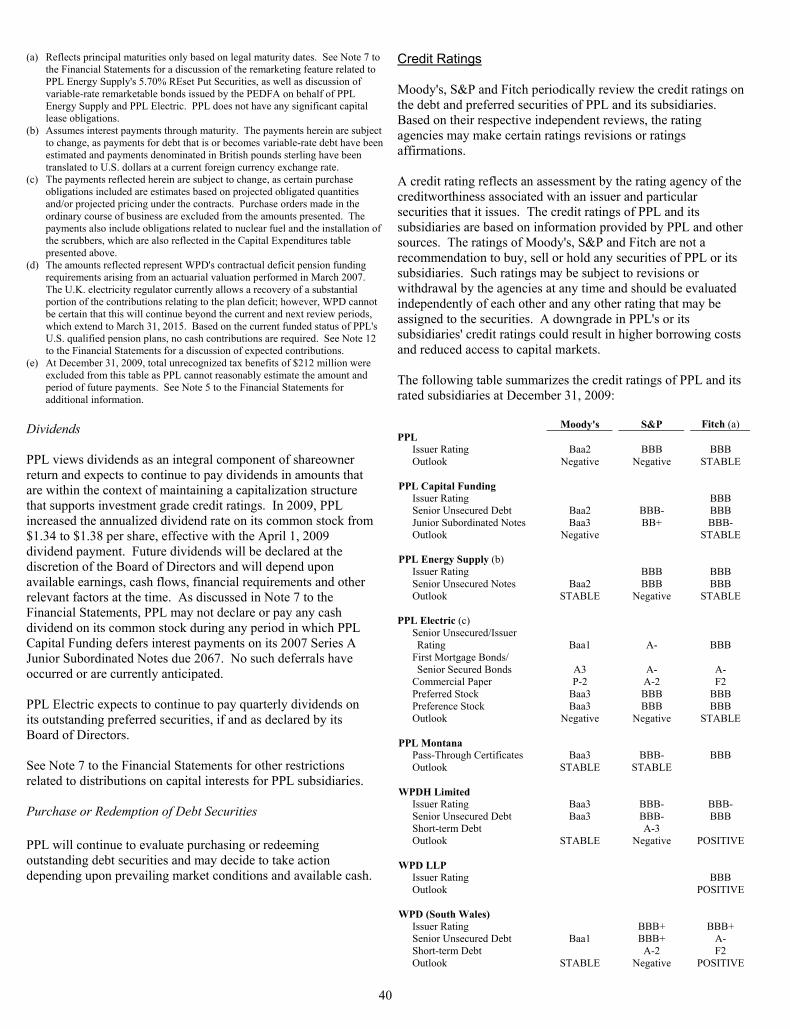
40
(a) Reflects principal maturities only based on legal maturity dates. See Note 7 to the Financial Statements for a discussion of the remarketing feature related to PPL Energy Supply's 5.70% REset Put Securities, as well as discussion of variable-rate remarketable bonds issued by the PEDFA on behalf of PPL Energy Supply and PPL Electric. PPL does not have any significant capital lease obligations.
(b) Assumes interest payments through maturity. The payments herein are subject to change, as payments for debt that is or becomes variable-rate debt have been estimated and payments denominated in British pounds sterling have been translated to U.S. dollars at a current foreign currency exchange rate.
(c) The payments reflected herein are subject to change, as certain purchase obligations included are estimates based on projected obligated quantities and/or projected pricing under the contracts. Purchase orders made in the ordinary course of business are excluded from the amounts presented. The payments also include obligations related to nuclear fuel and the installation of the scrubbers, which are also reflected in the Capital Expenditures table presented above.
(d) The amounts reflected represent WPD's contractual deficit pension funding requirements arising from an actuarial valuation performed in March 2007. The U.K. electricity regulator currently allows a recovery of a substantial portion of the contributions relating to the plan deficit; however, WPD cannot be certain that this will continue beyond the current and next review periods, which extend to March 31, 2015. Based on the current funded status of PPL's U.S. qualified pension plans, no cash contributions are required. See Note 12 to the Financial Statements for a discussion of expected contributions.
(e) At December 31, 2009, total unrecognized tax benefits of $212 million were excluded from this table as PPL cannot reasonably estimate the amount and period of future payments. See Note 5 to the Financial Statements for additional information.
Dividends PPL views dividends as an integral component of shareowner return and expects to continue to pay dividends in amounts that are within the context of maintaining a capitalization structure that supports investment grade credit ratings. In 2009, PPL increased the annualized dividend rate on its common stock from $1.34 to $1.38 per share, effective with the April 1, 2009 dividend payment. Future dividends will be declared at the discretion of the Board of Directors and will depend upon available earnings, cash flows, financial requirements and other relevant factors at the time. As discussed in Note 7 to the Financial Statements, PPL may not declare or pay any cash dividend on its common stock during any period in which PPL Capital Funding defers interest payments on its 2007 Series A Junior Subordinated Notes due 2067. No such deferrals have occurred or are currently anticipated. PPL Electric expects to continue to pay quarterly dividends on its outstanding preferred securities, if and as declared by its Board of Directors. See Note 7 to the Financial Statements for other restrictions related to distributions on capital interests for PPL subsidiaries. Purchase or Redemption of Debt Securities PPL will continue to evaluate purchasing or redeeming outstanding debt securities and may decide to take action depending upon prevailing market conditions and available cash.
Credit Ratings Moody's, S&P and Fitch periodically review the credit ratings on the debt and preferred securities of PPL and its subsidiaries. Based on their respective independent reviews, the rating agencies may make certain ratings revisions or ratings affirmations. A credit rating reflects an assessment by the rating agency of the creditworthiness associated with an issuer and particular securities that it issues. The credit ratings of PPL and its subsidiaries are based on information provided by PPL and other sources. The ratings of Moody's, S&P and Fitch are not a recommendation to buy, sell or hold any securities of PPL or its subsidiaries. Such ratings may be subject to revisions or withdrawal by the agencies at any time and should be evaluated independently of each other and any other rating that may be assigned to the securities. A downgrade in PPL's or its subsidiaries' credit ratings could result in higher borrowing costs and reduced access to capital markets. The following table summarizes the credit ratings of PPL and its rated subsidiaries at December 31, 2009:
Moody's S&P Fitch (a) PPL
Issuer Rating Baa2 BBB BBB Outlook Negative Negative STABLE
PPL Capital Funding
Issuer Rating BBB Senior Unsecured Debt Baa2 BBB- BBB Junior Subordinated Notes Baa3 BB+ BBB- Outlook Negative STABLE
PPL Energy Supply (b)
Issuer Rating BBB BBB Senior Unsecured Notes Baa2 BBB BBB Outlook STABLE Negative STABLE
PPL Electric (c)
Senior Unsecured/Issuer Rating Baa1
A- BBB
First Mortgage Bonds/ Senior Secured Bonds A3
A- A-
Commercial Paper P-2 A-2 F2 Preferred Stock Baa3 BBB BBB Preference Stock Baa3 BBB BBB Outlook Negative Negative STABLE
PPL Montana Pass-Through Certificates Baa3 BBB- BBB Outlook STABLE STABLE
WPDH Limited
Issuer Rating Baa3 BBB- BBB- Senior Unsecured Debt Baa3 BBB- BBB Short-term Debt A-3 Outlook STABLE Negative POSITIVE
WPD LLP
Issuer Rating BBB Outlook POSITIVE
WPD (South Wales)
Issuer Rating BBB+ BBB+ Senior Unsecured Debt Baa1 BBB+ A- Short-term Debt A-2 F2 Outlook STABLE Negative POSITIVE
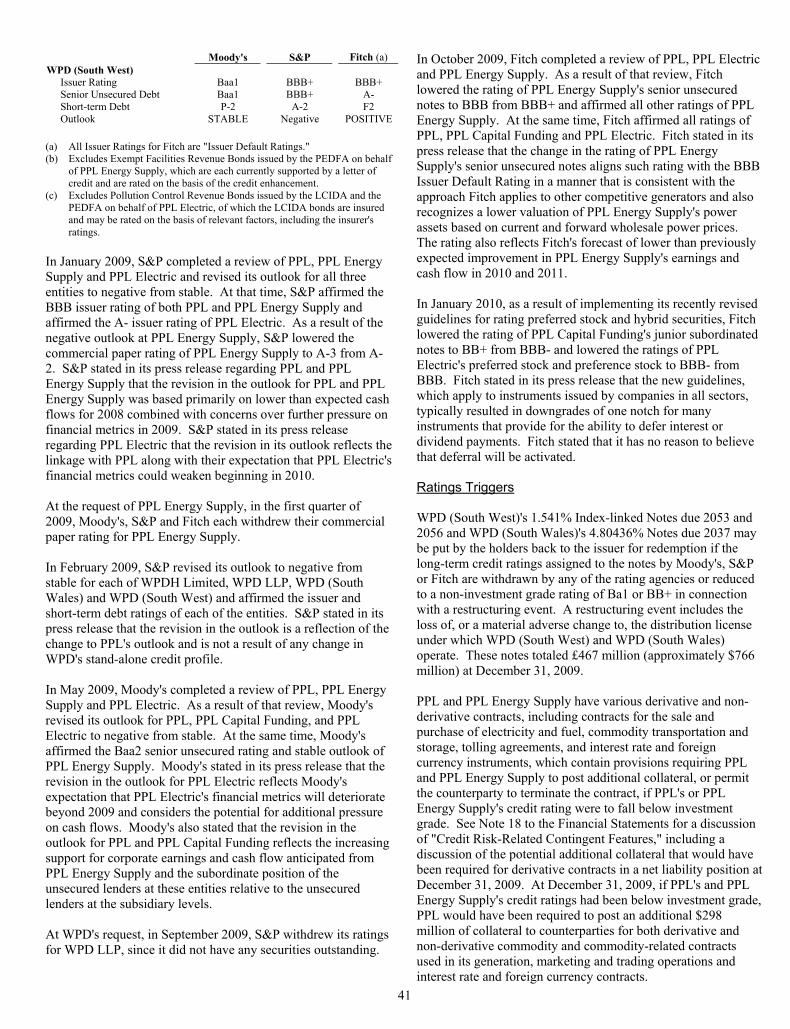
41
Moody's S&P Fitch (a) WPD (South West)
Issuer Rating Baa1 BBB+ BBB+ Senior Unsecured Debt Baa1 BBB+ A- Short-term Debt P-2 A-2 F2 Outlook STABLE Negative POSITIVE
(a) All Issuer Ratings for Fitch are "Issuer Default Ratings." (b) Excludes Exempt Facilities Revenue Bonds issued by the PEDFA on behalf
of PPL Energy Supply, which are each currently supported by a letter of credit and are rated on the basis of the credit enhancement.
(c) Excludes Pollution Control Revenue Bonds issued by the LCIDA and the PEDFA on behalf of PPL Electric, of which the LCIDA bonds are insured and may be rated on the basis of relevant factors, including the insurer's ratings.
In January 2009, S&P completed a review of PPL, PPL Energy Supply and PPL Electric and revised its outlook for all three entities to negative from stable. At that time, S&P affirmed the BBB issuer rating of both PPL and PPL Energy Supply and affirmed the A- issuer rating of PPL Electric. As a result of the negative outlook at PPL Energy Supply, S&P lowered the commercial paper rating of PPL Energy Supply to A-3 from A-2. S&P stated in its press release regarding PPL and PPL Energy Supply that the revision in the outlook for PPL and PPL Energy Supply was based primarily on lower than expected cash flows for 2008 combined with concerns over further pressure on financial metrics in 2009. S&P stated in its press release regarding PPL Electric that the revision in its outlook reflects the linkage with PPL along with their expectation that PPL Electric's financial metrics could weaken beginning in 2010. At the request of PPL Energy Supply, in the first quarter of 2009, Moody's, S&P and Fitch each withdrew their commercial paper rating for PPL Energy Supply. In February 2009, S&P revised its outlook to negative from stable for each of WPDH Limited, WPD LLP, WPD (South Wales) and WPD (South West) and affirmed the issuer and short-term debt ratings of each of the entities. S&P stated in its press release that the revision in the outlook is a reflection of the change to PPL's outlook and is not a result of any change in WPD's stand-alone credit profile. In May 2009, Moody's completed a review of PPL, PPL Energy Supply and PPL Electric. As a result of that review, Moody's revised its outlook for PPL, PPL Capital Funding, and PPL Electric to negative from stable. At the same time, Moody's affirmed the Baa2 senior unsecured rating and stable outlook of PPL Energy Supply. Moody's stated in its press release that the revision in the outlook for PPL Electric reflects Moody's expectation that PPL Electric's financial metrics will deteriorate beyond 2009 and considers the potential for additional pressure on cash flows. Moody's also stated that the revision in the outlook for PPL and PPL Capital Funding reflects the increasing support for corporate earnings and cash flow anticipated from PPL Energy Supply and the subordinate position of the unsecured lenders at these entities relative to the unsecured lenders at the subsidiary levels. At WPD's request, in September 2009, S&P withdrew its ratings for WPD LLP, since it did not have any securities outstanding.
In October 2009, Fitch completed a review of PPL, PPL Electric and PPL Energy Supply. As a result of that review, Fitch lowered the rating of PPL Energy Supply's senior unsecured notes to BBB from BBB+ and affirmed all other ratings of PPL Energy Supply. At the same time, Fitch affirmed all ratings of PPL, PPL Capital Funding and PPL Electric. Fitch stated in its press release that the change in the rating of PPL Energy Supply's senior unsecured notes aligns such rating with the BBB Issuer Default Rating in a manner that is consistent with the approach Fitch applies to other competitive generators and also recognizes a lower valuation of PPL Energy Supply's power assets based on current and forward wholesale power prices. The rating also reflects Fitch's forecast of lower than previously expected improvement in PPL Energy Supply's earnings and cash flow in 2010 and 2011. In January 2010, as a result of implementing its recently revised guidelines for rating preferred stock and hybrid securities, Fitch lowered the rating of PPL Capital Funding's junior subordinated notes to BB+ from BBB- and lowered the ratings of PPL Electric's preferred stock and preference stock to BBB- from BBB. Fitch stated in its press release that the new guidelines, which apply to instruments issued by companies in all sectors, typically resulted in downgrades of one notch for many instruments that provide for the ability to defer interest or dividend payments. Fitch stated that it has no reason to believe that deferral will be activated. Ratings Triggers WPD (South West)'s 1.541% Index-linked Notes due 2053 and 2056 and WPD (South Wales)'s 4.80436% Notes due 2037 may be put by the holders back to the issuer for redemption if the long-term credit ratings assigned to the notes by Moody's, S&P or Fitch are withdrawn by any of the rating agencies or reduced to a non-investment grade rating of Ba1 or BB+ in connection with a restructuring event. A restructuring event includes the loss of, or a material adverse change to, the distribution license under which WPD (South West) and WPD (South Wales) operate. These notes totaled £467 million (approximately $766 million) at December 31, 2009. PPL and PPL Energy Supply have various derivative and non-derivative contracts, including contracts for the sale and purchase of electricity and fuel, commodity transportation and storage, tolling agreements, and interest rate and foreign currency instruments, which contain provisions requiring PPL and PPL Energy Supply to post additional collateral, or permit the counterparty to terminate the contract, if PPL's or PPL Energy Supply's credit rating were to fall below investment grade. See Note 18 to the Financial Statements for a discussion of "Credit Risk-Related Contingent Features," including a discussion of the potential additional collateral that would have been required for derivative contracts in a net liability position at December 31, 2009. At December 31, 2009, if PPL's and PPL Energy Supply's credit ratings had been below investment grade, PPL would have been required to post an additional $298 million of collateral to counterparties for both derivative and non-derivative commodity and commodity-related contracts used in its generation, marketing and trading operations and interest rate and foreign currency contracts.
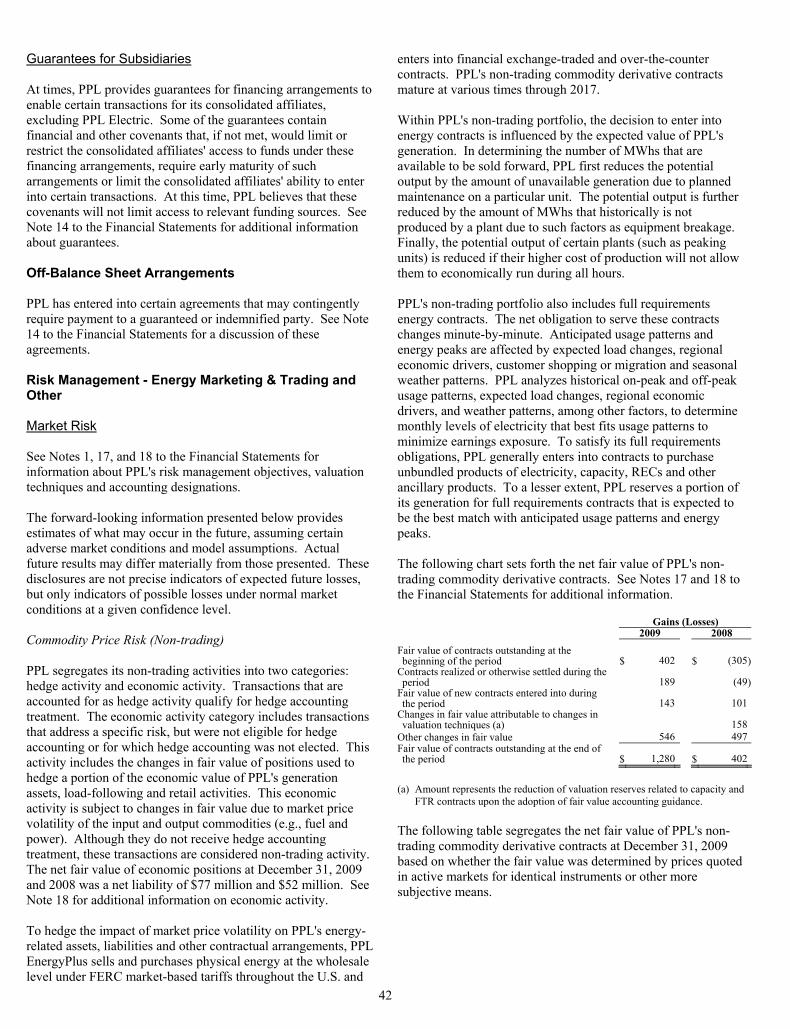
42
Guarantees for Subsidiaries At times, PPL provides guarantees for financing arrangements to enable certain transactions for its consolidated affiliates, excluding PPL Electric. Some of the guarantees contain financial and other covenants that, if not met, would limit or restrict the consolidated affiliates' access to funds under these financing arrangements, require early maturity of such arrangements or limit the consolidated affiliates' ability to enter into certain transactions. At this time, PPL believes that these covenants will not limit access to relevant funding sources. See Note 14 to the Financial Statements for additional information about guarantees. Off-Balance Sheet Arrangements PPL has entered into certain agreements that may contingently require payment to a guaranteed or indemnified party. See Note 14 to the Financial Statements for a discussion of these agreements. Risk Management - Energy Marketing & Trading and Other Market Risk See Notes 1, 17, and 18 to the Financial Statements for information about PPL's risk management objectives, valuation techniques and accounting designations. The forward-looking information presented below provides estimates of what may occur in the future, assuming certain adverse market conditions and model assumptions. Actual future results may differ materially from those presented. These disclosures are not precise indicators of expected future losses, but only indicators of possible losses under normal market conditions at a given confidence level. Commodity Price Risk (Non-trading) PPL segregates its non-trading activities into two categories: hedge activity and economic activity. Transactions that are accounted for as hedge activity qualify for hedge accounting treatment. The economic activity category includes transactions that address a specific risk, but were not eligible for hedge accounting or for which hedge accounting was not elected. This activity includes the changes in fair value of positions used to hedge a portion of the economic value of PPL's generation assets, load-following and retail activities. This economic activity is subject to changes in fair value due to market price volatility of the input and output commodities (e.g., fuel and power). Although they do not receive hedge accounting treatment, these transactions are considered non-trading activity. The net fair value of economic positions at December 31, 2009 and 2008 was a net liability of $77 million and $52 million. See Note 18 for additional information on economic activity. To hedge the impact of market price volatility on PPL's energy-related assets, liabilities and other contractual arrangements, PPL EnergyPlus sells and purchases physical energy at the wholesale level under FERC market-based tariffs throughout the U.S. and
enters into financial exchange-traded and over-the-counter contracts. PPL's non-trading commodity derivative contracts mature at various times through 2017. Within PPL's non-trading portfolio, the decision to enter into energy contracts is influenced by the expected value of PPL's generation. In determining the number of MWhs that are available to be sold forward, PPL first reduces the potential output by the amount of unavailable generation due to planned maintenance on a particular unit. The potential output is further reduced by the amount of MWhs that historically is not produced by a plant due to such factors as equipment breakage. Finally, the potential output of certain plants (such as peaking units) is reduced if their higher cost of production will not allow them to economically run during all hours. PPL's non-trading portfolio also includes full requirements energy contracts. The net obligation to serve these contracts changes minute-by-minute. Anticipated usage patterns and energy peaks are affected by expected load changes, regional economic drivers, customer shopping or migration and seasonal weather patterns. PPL analyzes historical on-peak and off-peak usage patterns, expected load changes, regional economic drivers, and weather patterns, among other factors, to determine monthly levels of electricity that best fits usage patterns to minimize earnings exposure. To satisfy its full requirements obligations, PPL generally enters into contracts to purchase unbundled products of electricity, capacity, RECs and other ancillary products. To a lesser extent, PPL reserves a portion of its generation for full requirements contracts that is expected to be the best match with anticipated usage patterns and energy peaks. The following chart sets forth the net fair value of PPL's non-trading commodity derivative contracts. See Notes 17 and 18 to the Financial Statements for additional information. Gains (Losses) 2009 2008 Fair value of contracts outstanding at the beginning of the period $ 402 $ (305)
Contracts realized or otherwise settled during the period 189 (49)
Fair value of new contracts entered into during the period 143 101
Changes in fair value attributable to changes in valuation techniques (a) 158
Other changes in fair value 546 497Fair value of contracts outstanding at the end of the period $ 1,280 $ 402
(a) Amount represents the reduction of valuation reserves related to capacity and
FTR contracts upon the adoption of fair value accounting guidance. The following table segregates the net fair value of PPL's non-trading commodity derivative contracts at December 31, 2009 based on whether the fair value was determined by prices quoted in active markets for identical instruments or other more subjective means.
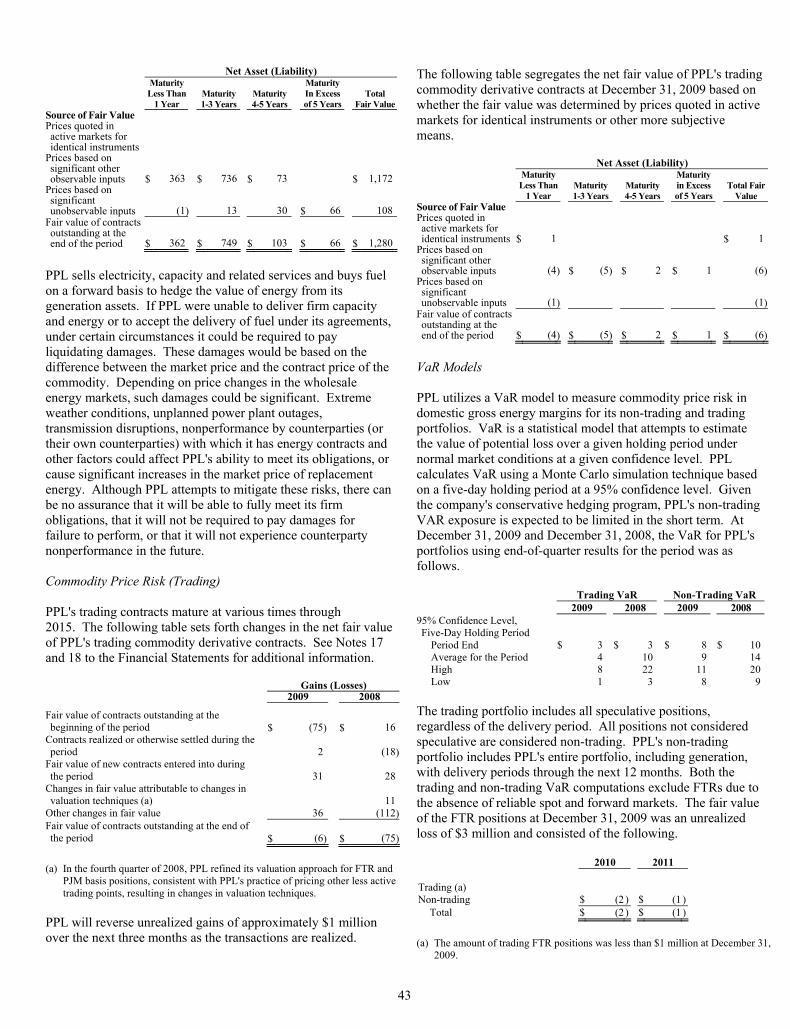
43
Net Asset (Liability)
Maturity Less Than
1 Year Maturity 1-3 Years
Maturity 4-5 Years
Maturity In Excessof 5 Years
Total Fair Value
Source of Fair Value Prices quoted in active markets for identical instruments
Prices based on significant other observable inputs $ 363 $ 736 $ 73 $ 1,172
Prices based on significant unobservable inputs (1) 13 30 $ 66 108
Fair value of contracts outstanding at the end of the period $ 362 $ 749 $ 103 $ 66 $ 1,280
PPL sells electricity, capacity and related services and buys fuel on a forward basis to hedge the value of energy from its generation assets. If PPL were unable to deliver firm capacity and energy or to accept the delivery of fuel under its agreements, under certain circumstances it could be required to pay liquidating damages. These damages would be based on the difference between the market price and the contract price of the commodity. Depending on price changes in the wholesale energy markets, such damages could be significant. Extreme weather conditions, unplanned power plant outages, transmission disruptions, nonperformance by counterparties (or their own counterparties) with which it has energy contracts and other factors could affect PPL's ability to meet its obligations, or cause significant increases in the market price of replacement energy. Although PPL attempts to mitigate these risks, there can be no assurance that it will be able to fully meet its firm obligations, that it will not be required to pay damages for failure to perform, or that it will not experience counterparty nonperformance in the future. Commodity Price Risk (Trading) PPL's trading contracts mature at various times through 2015. The following table sets forth changes in the net fair value of PPL's trading commodity derivative contracts. See Notes 17 and 18 to the Financial Statements for additional information. Gains (Losses) 2009 2008
Fair value of contracts outstanding at the beginning of the period $ (75) $ 16
Contracts realized or otherwise settled during the period 2 (18)
Fair value of new contracts entered into during the period 31 28
Changes in fair value attributable to changes in valuation techniques (a) 11
Other changes in fair value 36 (112)Fair value of contracts outstanding at the end of the period $ (6) $ (75)
(a) In the fourth quarter of 2008, PPL refined its valuation approach for FTR and
PJM basis positions, consistent with PPL's practice of pricing other less active trading points, resulting in changes in valuation techniques.
PPL will reverse unrealized gains of approximately $1 million over the next three months as the transactions are realized.
The following table segregates the net fair value of PPL's trading commodity derivative contracts at December 31, 2009 based on whether the fair value was determined by prices quoted in active markets for identical instruments or other more subjective means. Net Asset (Liability)
Maturity Less Than
1 Year Maturity 1-3 Years
Maturity 4-5 Years
Maturity in Excess of 5 Years
Total FairValue
Source of Fair Value Prices quoted in active markets for identical instruments $ 1 $ 1
Prices based on significant other observable inputs (4) $ (5) $ 2 $ 1 (6)
Prices based on significant unobservable inputs (1) (1)
Fair value of contracts outstanding at the end of the period $ (4) $ (5) $ 2 $ 1 $ (6)
VaR Models PPL utilizes a VaR model to measure commodity price risk in domestic gross energy margins for its non-trading and trading portfolios. VaR is a statistical model that attempts to estimate the value of potential loss over a given holding period under normal market conditions at a given confidence level. PPL calculates VaR using a Monte Carlo simulation technique based on a five-day holding period at a 95% confidence level. Given the company's conservative hedging program, PPL's non-trading VAR exposure is expected to be limited in the short term. At December 31, 2009 and December 31, 2008, the VaR for PPL's portfolios using end-of-quarter results for the period was as follows.
Trading VaR Non-Trading VaR 2009 2008 2009 2008
95% Confidence Level, Five-Day Holding Period
Period End $ 3 $ 3 $ 8 $ 10Average for the Period 4 10 9 14High 8 22 11 20Low 1 3 8 9
The trading portfolio includes all speculative positions, regardless of the delivery period. All positions not considered speculative are considered non-trading. PPL's non-trading portfolio includes PPL's entire portfolio, including generation, with delivery periods through the next 12 months. Both the trading and non-trading VaR computations exclude FTRs due to the absence of reliable spot and forward markets. The fair value of the FTR positions at December 31, 2009 was an unrealized loss of $3 million and consisted of the following. 2010 2011 Trading (a) Non-trading $ (2 ) $ (1 )
Total $ (2 ) $ (1 )
(a) The amount of trading FTR positions was less than $1 million at December 31,
2009.
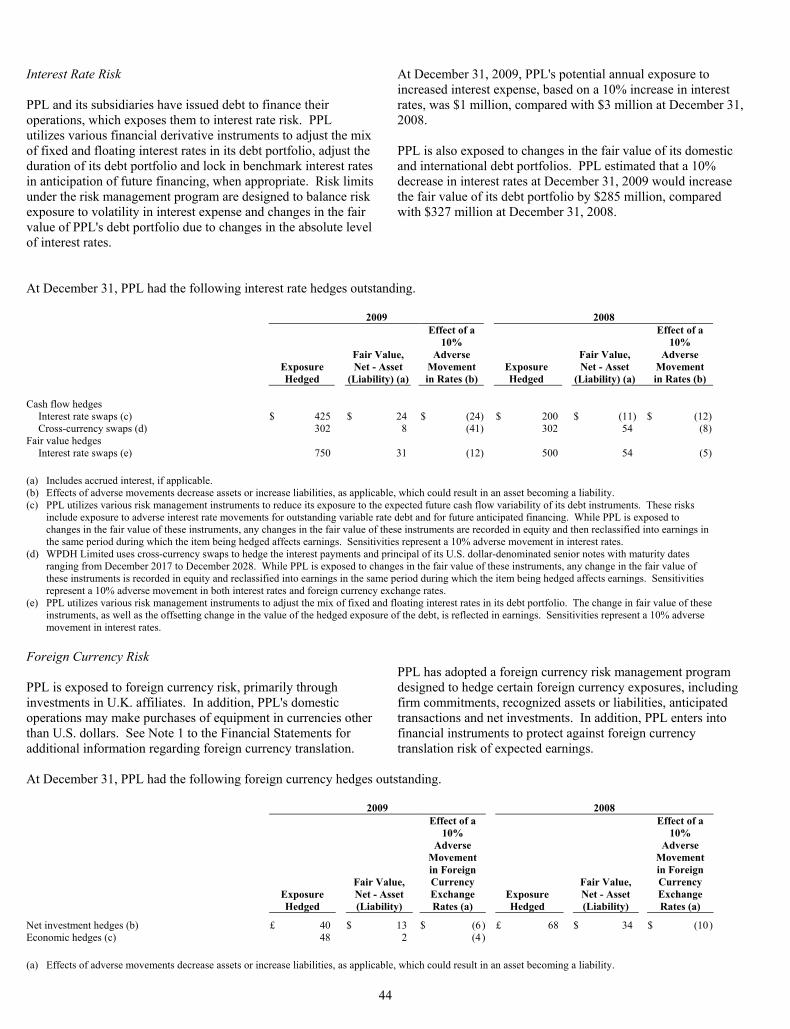
44
Interest Rate Risk PPL and its subsidiaries have issued debt to finance their operations, which exposes them to interest rate risk. PPL utilizes various financial derivative instruments to adjust the mix of fixed and floating interest rates in its debt portfolio, adjust the duration of its debt portfolio and lock in benchmark interest rates in anticipation of future financing, when appropriate. Risk limits under the risk management program are designed to balance risk exposure to volatility in interest expense and changes in the fair value of PPL's debt portfolio due to changes in the absolute level of interest rates.
At December 31, 2009, PPL's potential annual exposure to increased interest expense, based on a 10% increase in interest rates, was $1 million, compared with $3 million at December 31, 2008. PPL is also exposed to changes in the fair value of its domestic and international debt portfolios. PPL estimated that a 10% decrease in interest rates at December 31, 2009 would increase the fair value of its debt portfolio by $285 million, compared with $327 million at December 31, 2008.
At December 31, PPL had the following interest rate hedges outstanding. 2009 2008
Exposure Hedged
Fair Value, Net - Asset
(Liability) (a)
Effect of a 10%
Adverse Movement in Rates (b)
Exposure Hedged
Fair Value, Net - Asset
(Liability) (a)
Effect of a 10%
Adverse Movement in Rates (b)
Cash flow hedges
Interest rate swaps (c) $ 425 $ 24 $ (24) $ 200 $ (11) $ (12)Cross-currency swaps (d) 302 8 (41) 302 54 (8)
Fair value hedges Interest rate swaps (e) 750 31 (12) 500 54 (5)
(a) Includes accrued interest, if applicable. (b) Effects of adverse movements decrease assets or increase liabilities, as applicable, which could result in an asset becoming a liability. (c) PPL utilizes various risk management instruments to reduce its exposure to the expected future cash flow variability of its debt instruments. These risks
include exposure to adverse interest rate movements for outstanding variable rate debt and for future anticipated financing. While PPL is exposed to changes in the fair value of these instruments, any changes in the fair value of these instruments are recorded in equity and then reclassified into earnings in the same period during which the item being hedged affects earnings. Sensitivities represent a 10% adverse movement in interest rates.
(d) WPDH Limited uses cross-currency swaps to hedge the interest payments and principal of its U.S. dollar-denominated senior notes with maturity dates ranging from December 2017 to December 2028. While PPL is exposed to changes in the fair value of these instruments, any change in the fair value of these instruments is recorded in equity and reclassified into earnings in the same period during which the item being hedged affects earnings. Sensitivities represent a 10% adverse movement in both interest rates and foreign currency exchange rates.
(e) PPL utilizes various risk management instruments to adjust the mix of fixed and floating interest rates in its debt portfolio. The change in fair value of these instruments, as well as the offsetting change in the value of the hedged exposure of the debt, is reflected in earnings. Sensitivities represent a 10% adverse movement in interest rates.
Foreign Currency Risk PPL is exposed to foreign currency risk, primarily through investments in U.K. affiliates. In addition, PPL's domestic operations may make purchases of equipment in currencies other than U.S. dollars. See Note 1 to the Financial Statements for additional information regarding foreign currency translation.
PPL has adopted a foreign currency risk management program designed to hedge certain foreign currency exposures, including firm commitments, recognized assets or liabilities, anticipated transactions and net investments. In addition, PPL enters into financial instruments to protect against foreign currency translation risk of expected earnings.
At December 31, PPL had the following foreign currency hedges outstanding. 2009 2008
Exposure Hedged
Fair Value, Net - Asset (Liability)
Effect of a 10%
Adverse Movement in Foreign Currency Exchange Rates (a)
Exposure Hedged
Fair Value, Net - Asset (Liability)
Effect of a 10%
Adverse Movement in Foreign Currency Exchange Rates (a)
Net investment hedges (b) £ 40 $ 13 $ (6) £ 68 $ 34 $ (10)Economic hedges (c) 48 2 (4) (a) Effects of adverse movements decrease assets or increase liabilities, as applicable, which could result in an asset becoming a liability.
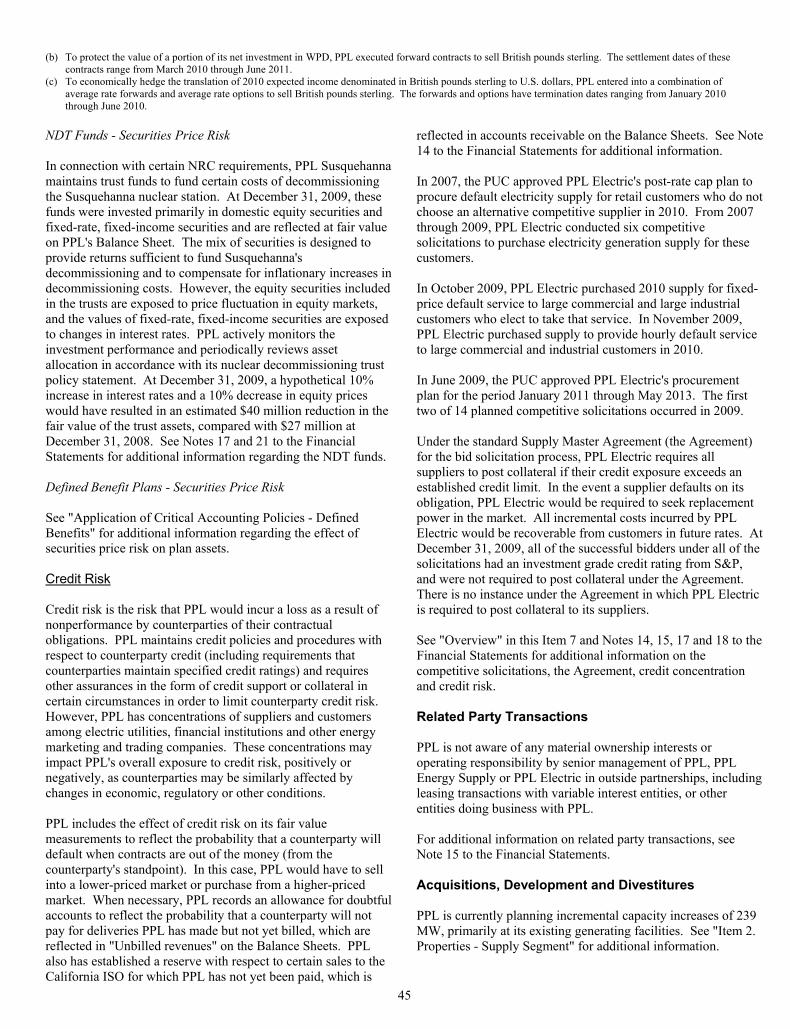
45
(b) To protect the value of a portion of its net investment in WPD, PPL executed forward contracts to sell British pounds sterling. The settlement dates of these contracts range from March 2010 through June 2011.
(c) To economically hedge the translation of 2010 expected income denominated in British pounds sterling to U.S. dollars, PPL entered into a combination of average rate forwards and average rate options to sell British pounds sterling. The forwards and options have termination dates ranging from January 2010 through June 2010.
NDT Funds - Securities Price Risk In connection with certain NRC requirements, PPL Susquehanna maintains trust funds to fund certain costs of decommissioning the Susquehanna nuclear station. At December 31, 2009, these funds were invested primarily in domestic equity securities and fixed-rate, fixed-income securities and are reflected at fair value on PPL's Balance Sheet. The mix of securities is designed to provide returns sufficient to fund Susquehanna's decommissioning and to compensate for inflationary increases in decommissioning costs. However, the equity securities included in the trusts are exposed to price fluctuation in equity markets, and the values of fixed-rate, fixed-income securities are exposed to changes in interest rates. PPL actively monitors the investment performance and periodically reviews asset allocation in accordance with its nuclear decommissioning trust policy statement. At December 31, 2009, a hypothetical 10% increase in interest rates and a 10% decrease in equity prices would have resulted in an estimated $40 million reduction in the fair value of the trust assets, compared with $27 million at December 31, 2008. See Notes 17 and 21 to the Financial Statements for additional information regarding the NDT funds. Defined Benefit Plans - Securities Price Risk See "Application of Critical Accounting Policies - Defined Benefits" for additional information regarding the effect of securities price risk on plan assets. Credit Risk Credit risk is the risk that PPL would incur a loss as a result of nonperformance by counterparties of their contractual obligations. PPL maintains credit policies and procedures with respect to counterparty credit (including requirements that counterparties maintain specified credit ratings) and requires other assurances in the form of credit support or collateral in certain circumstances in order to limit counterparty credit risk. However, PPL has concentrations of suppliers and customers among electric utilities, financial institutions and other energy marketing and trading companies. These concentrations may impact PPL's overall exposure to credit risk, positively or negatively, as counterparties may be similarly affected by changes in economic, regulatory or other conditions. PPL includes the effect of credit risk on its fair value measurements to reflect the probability that a counterparty will default when contracts are out of the money (from the counterparty's standpoint). In this case, PPL would have to sell into a lower-priced market or purchase from a higher-priced market. When necessary, PPL records an allowance for doubtful accounts to reflect the probability that a counterparty will not pay for deliveries PPL has made but not yet billed, which are reflected in "Unbilled revenues" on the Balance Sheets. PPL also has established a reserve with respect to certain sales to the California ISO for which PPL has not yet been paid, which is
reflected in accounts receivable on the Balance Sheets. See Note 14 to the Financial Statements for additional information. In 2007, the PUC approved PPL Electric's post-rate cap plan to procure default electricity supply for retail customers who do not choose an alternative competitive supplier in 2010. From 2007 through 2009, PPL Electric conducted six competitive solicitations to purchase electricity generation supply for these customers. In October 2009, PPL Electric purchased 2010 supply for fixed-price default service to large commercial and large industrial customers who elect to take that service. In November 2009, PPL Electric purchased supply to provide hourly default service to large commercial and industrial customers in 2010. In June 2009, the PUC approved PPL Electric's procurement plan for the period January 2011 through May 2013. The first two of 14 planned competitive solicitations occurred in 2009. Under the standard Supply Master Agreement (the Agreement) for the bid solicitation process, PPL Electric requires all suppliers to post collateral if their credit exposure exceeds an established credit limit. In the event a supplier defaults on its obligation, PPL Electric would be required to seek replacement power in the market. All incremental costs incurred by PPL Electric would be recoverable from customers in future rates. At December 31, 2009, all of the successful bidders under all of the solicitations had an investment grade credit rating from S&P, and were not required to post collateral under the Agreement. There is no instance under the Agreement in which PPL Electric is required to post collateral to its suppliers. See "Overview" in this Item 7 and Notes 14, 15, 17 and 18 to the Financial Statements for additional information on the competitive solicitations, the Agreement, credit concentration and credit risk. Related Party Transactions PPL is not aware of any material ownership interests or operating responsibility by senior management of PPL, PPL Energy Supply or PPL Electric in outside partnerships, including leasing transactions with variable interest entities, or other entities doing business with PPL. For additional information on related party transactions, see Note 15 to the Financial Statements. Acquisitions, Development and Divestitures PPL is currently planning incremental capacity increases of 239 MW, primarily at its existing generating facilities. See "Item 2. Properties - Supply Segment" for additional information.
46
PPL continuously reexamines development projects based on market conditions and other factors to determine whether to proceed with the projects, sell, cancel or expand them, execute tolling agreements or pursue other options. See Notes 8 and 9 to the Financial Statements for additional information on the more significant activities. Environmental Matters See "Item 1. Business - Environmental Matters" and Note 14 to the Financial Statements for a discussion of environmental matters. Competition See "Item 1. Business - Competition" under each of PPL's reportable segments and "Item 1A. Risk Factors" for a discussion of competitive factors affecting PPL.
New Accounting Guidance See Notes 1 and 22 to the Financial Statements for a discussion of new accounting guidance adopted and pending adoption.
Application of Critical Accounting Policies PPL's financial condition and results of operations are impacted by the methods, assumptions and estimates used in the application of critical accounting policies. The following accounting policies are particularly important to the financial condition or results of operations of PPL, and require estimates or other judgments of matters inherently uncertain. Changes in the estimates or other judgments included within these accounting policies could result in a significant change to the information presented in the Financial Statements (these accounting policies are also discussed in Note 1 to the Financial Statements). PPL's senior management has reviewed these critical accounting policies and the estimates and assumptions regarding them with its Audit Committee. In addition, PPL's senior management has reviewed the following disclosures regarding the application of these critical accounting policies with the Audit Committee. Effective January 1, 2009, PPL and its subsidiaries fully applied accounting guidance that provides a framework for measuring fair value. The fair value measurement concepts provided by this guidance are used within its financial statements where applicable. See Notes 1 and 17 to the Financial Statements for additional information regarding fair value measurements. 1) Price Risk Management See "Risk Management - Energy Marketing & Trading and Other" above and Note 18 to the Financial Statements. 2) Defined Benefits PPL and certain of its subsidiaries sponsor various defined benefit pension and other postretirement plans applicable to the majority of the employees of PPL and its subsidiaries. PPL and
certain of its subsidiaries record an asset or liability to recognize the funded status of all defined benefit plans with an offsetting entry to OCI or regulatory assets for PPL Electric. Consequently, the funded status of all defined benefit plans is fully recognized on the Balance Sheets. See Note 12 to the Financial Statements for additional information about the plans and the accounting for defined benefits. PPL makes certain assumptions regarding the valuation of benefit obligations and the performance of plan assets. When accounting for defined benefits, delayed recognition in earnings of differences between actual results and expected or estimated results is a guiding principle. Annual net periodic defined benefit costs are recorded in current earnings based on estimated results. Any differences between actual and estimated results are recorded in OCI or regulatory assets for PPL Electric. These amounts in AOCI or regulatory assets are amortized to income over future periods. The delayed recognition allows for a smoothed recognition of costs over the working lives of the employees who benefit under the plans. The primary assumptions are: • Discount Rate - The discount rate is used in calculating the
present value of benefits, which is based on projections of benefit payments to be made in the future. The objective in selecting the discount rate is to measure the single amount that, if invested at the measurement date in a portfolio of high-quality debt instruments, would provide the necessary future cash flows to pay the accumulated benefits when due.
• Expected Return on Plan Assets - Management projects the
long-term rates of return on plan assets based on historical performance, future expectations and periodic portfolio rebalancing among the diversified asset classes. These projected returns reduce the net benefit costs PPL records currently.
• Rate of Compensation Increase - Management projects
employees' annual pay increases, which are used to project employees' pension benefits at retirement.
• Health Care Cost Trend Rate - Management projects the
expected increases in the cost of health care. In selecting a discount rate for its U.S. defined benefit plans, PPL starts with an analysis of the expected benefit payment stream for its plans. This information is first matched against a spot-rate yield curve. A portfolio of 526 Aa-graded non-callable (or callable with make-whole provisions) bonds, with a total amount outstanding in excess of $541 billion, serves as the base from which those with the lowest and highest yields are eliminated to develop the ultimate yield curve. The results of this analysis are considered together with other economic data and movements in various bond indices to determine the discount rate assumption. At December 31, 2009, PPL decreased the discount rate for its U.S. pension plans from 6.50% to 6.00% as a result of this assessment and decreased the discount rate for its other postretirement benefit plans from 6.45% to 5.81%.
47
A similar process is used to select the discount rate for the U.K. pension plans, which uses an iBoxx British pounds sterling denominated corporate bond index as its base. At December 31, 2009, PPL decreased the discount rate for the U.K. pension plans from 7.47% to 5.55% as a result of this assessment. The expected long-term rates of return for PPL's U.S. defined benefit pension and other postretirement benefit plans have been developed using a best-estimate of expected returns, volatilities and correlations for each asset class. PPL management corroborates these rates with expected long-term rates of return calculated by its independent actuary, who uses a building block approach that begins with a risk-free rate of return with factors being added such as inflation, duration, credit spreads and equity risk. Each plan's specific asset allocation is also considered in developing a reasonable return assumption. At December 31, 2009, PPL's expected return on plan assets remained at 8.00% for its U.S. pension plans and remained at 7.00% for its other postretirement benefit plans. The expected long-term rates of return for PPL's U.K. pension plans have been developed by WPD management with assistance from an independent actuary using a best-estimate of expected returns, volatilities and correlations for each asset class. For the U.K. plans, PPL's expected return on plan assets remained at 7.90% at December 31, 2009. In selecting a rate of compensation increase, PPL considers past experience in light of movements in inflation rates. At December 31, 2009, PPL's rate of compensation increase remained at 4.75% for its U.S. plans. For the U.K. plans, PPL's rate of compensation increase remained at 4.00% at December 31, 2009. In selecting health care cost trend rates, PPL considers past performance and forecasts of health care costs. At December 31, 2009, PPL's health care cost trend rates were 8.00% for 2010, gradually declining to 5.50% for 2016. A variance in the assumptions listed above could have a significant impact on accrued defined benefit liabilities or assets, reported annual net periodic defined benefit costs and OCI or regulatory assets for PPL Electric. While the charts below reflect either an increase or decrease in each assumption, the inverse of this change would impact the accrued defined benefit liabilities or assets, reported annual net periodic defined benefit costs and OCI or regulatory assets for PPL Electric by a similar amount in the opposite direction. The sensitivities below reflect an evaluation of the change based solely on a change in that assumption and does not include income tax effects. At December 31, 2009, PPL had recorded the following defined benefit plan liabilities: Pension liabilities $ 1,290 Other postretirement benefit liabilities 197 The following chart reflects the sensitivities in the December 31, 2009 Balance Sheet associated with a change in certain assumptions based on PPL's primary defined benefit plans.
Increase (Decrease)
Actuarial assumptionChange in
assumption
Impact on defined benefit
liabilities Impact on
OCI
Impact on regulatory
assets
Discount Rate (0.25)% $ 194 $ (163) $ 31Rate of Compensation Increase 0.25% 26 (21) 5
Health Care Cost Trend Rate (a) 1.0% 12 (8) 4
(a) Only impacts other postretirement benefits. In 2009, PPL recognized net periodic defined benefit costs charged to operating expense of $70 million. This amount represents a $14 million increase from 2008. This increase in expense was primarily attributable to actual asset losses in 2008. As a result, the expected return on assets in 2009 was lower and amortization of gain/loss was impacted. The following chart reflects the sensitivities in the 2009 Statement of Income (excluding income tax effects) associated with a change in certain assumptions based on PPL's primary defined benefit plans.
Actuarial assumption Change in
assumption Impact on defined
benefit costs
Discount Rate (0.25)% $ 7Expected Return on Plan Assets (0.25)% 12Rate of Compensation Increase 0.25% 3Health Care Cost Trend Rate (a) 1.0% 2 (a) Only impacts other postretirement benefits. 3) Asset Impairment PPL performs impairment analyses for long-lived assets that are subject to depreciation or amortization whenever events or changes in circumstances indicate that a long-lived asset's carrying value may not be recoverable. For these long-lived assets to be held and used, such events or changes in circumstances are: • a significant decrease in the market price of an asset; • a significant adverse change in the manner in which an asset is
being used or in its physical condition; • a significant adverse change in legal factors or in the business
climate; • an accumulation of costs significantly in excess of the amount
originally expected for the acquisition or construction of an asset;
• a current-period operating or cash flow loss combined with a history of losses or a forecast that demonstrates continuing losses; or
• a current expectation that, more likely than not, an asset will be sold or otherwise disposed of before the end of its previously estimated useful life.
For a long-lived asset to be held and used, an impairment is recognized when the carrying amount of the asset is not recoverable and exceeds its fair value. The carrying amount is not recoverable if it exceeds the sum of the undiscounted cash flows expected to result from the use and eventual disposition of
48
the asset. If the asset is impaired, an impairment loss is recorded to adjust the asset's carrying value to its estimated fair value. Management must make significant judgments to estimate future cash flows including the useful lives of long-lived assets, the fair value of the assets and management's intent to use the assets. PPL considers alternate courses of action to recover the carrying value of a long-lived asset, and uses estimated cash flows from the "most likely" alternative to assess impairment whenever one alternative is clearly the most likely outcome. If no alternative is clearly the most likely, then a probability-weighted approach is used taking into consideration estimated cash flows from the alternatives. For assets tested for impairment as of the balance sheet date, the estimates of future cash flows used in that test consider the likelihood of possible outcomes that existed at the balance sheet date, including the assessment of the likelihood of a future sale of the assets. That assessment is not revised based on events that occur after the balance sheet date. Changes in assumptions and estimates could result in significantly different results than those identified and recorded in the financial statements. For a long-lived asset held for sale, an impairment exists when the carrying amount of the asset (disposal group) exceeds its fair value less cost to sell. If the asset (disposal group) is impaired, an impairment loss is recorded to adjust its carrying amount to its fair value less cost to sell. A gain is recognized for any subsequent increase in fair value less cost to sell, but not in excess of the cumulative impairment previously recognized. For determining fair value, quoted market prices in active markets are the best evidence of fair value. However, when market prices are unavailable, PPL considers all valuation techniques appropriate in the circumstances and for which market participant inputs can be obtained. PPL has generally used discounted cash flows to estimate fair value, which incorporates market participant inputs when available. Discounted cash flows are calculated by estimating future cash flow streams and applying appropriate discount rates to determine the present value of the cash flow streams. In 2009, PPL recorded impairments of certain long-lived assets. See Note 17 to the Financial Statements for a discussion of impairments related to certain sulfur dioxide emission allowances and the Long Island generation business. PPL tests goodwill for impairment at the reporting unit level. PPL has determined its reporting units to be at or one level below its operating segments. PPL performs a goodwill impairment test annually or more frequently if events or changes in circumstances indicate that the carrying value of the reporting unit may be greater than the unit's fair value. Additionally, goodwill is tested for impairment after a portion of goodwill has been allocated to a business to be disposed of. Goodwill is tested for impairment using a two-step approach. The first step of the goodwill impairment test compares the estimated fair value of a reporting unit with its carrying amount, including goodwill. If the estimated fair value of a reporting unit exceeds its carrying amount, goodwill of the reporting unit is not considered impaired. If the carrying amount exceeds the
estimated fair value of the reporting unit, the second step is performed to measure the amount of impairment loss, if any. The second step requires a calculation of the implied fair value of goodwill. The implied fair value of goodwill is determined in the same manner as the amount of goodwill in a business combination. That is, the estimated fair value of a reporting unit is allocated to all of the assets and liabilities of that unit as if the reporting unit had been acquired in a business combination and the estimated fair value of the reporting unit was the price paid to acquire the reporting unit. The excess of the estimated fair value of a reporting unit over the amounts assigned to its assets and liabilities is the implied fair value of goodwill. The implied fair value of the reporting unit's goodwill is then compared with the carrying amount of that goodwill. If the carrying amount exceeds the implied fair value, an impairment loss is recognized in an amount equal to that excess. The loss recognized cannot exceed the carrying amount of the reporting unit's goodwill. In 2009, PPL was not required to impair any goodwill. Management primarily used discounted cash flows, which required significant assumptions, to estimate the fair value of each reporting unit. A decrease in the forecasted cash flows of 10%, or an increase of the discount rate by 25 basis points, would not have resulted in an impairment of goodwill. Additionally, in 2009, PPL wrote off $3 million of goodwill allocated to discontinued operations. 4) Loss Accruals PPL accrues losses for the estimated impacts of various conditions, situations or circumstances involving uncertain or contingent future outcomes. For loss contingencies, the loss must be accrued if (1) information is available that indicates it is probable that a loss has been incurred, given the likelihood of the uncertain future events, and (2) the amount of the loss can be reasonably estimated. Accounting guidance defines "probable" as cases in which "the future event or events are likely to occur." PPL does not record the accrual of contingencies that might result in gains, unless recovery is assured. PPL continuously assesses potential loss contingencies for environmental remediation, litigation claims, regulatory penalties and other events. The accounting aspects of estimated loss accruals include (1) the initial identification and recording of the loss, (2) the determination of triggering events for reducing a recorded loss accrual, and (3) the ongoing assessment as to whether a recorded loss accrual is sufficient. All three of these aspects require significant judgment by PPL's management. PPL uses its internal expertise and outside experts (such as lawyers and engineers), as necessary, to help estimate the probability that a loss has been incurred and the amount (or range) of the loss. No new significant loss accruals were recorded in 2009. In 2008, significant judgment was required by PPL's management to perform an assessment of the contingency related to the Montana hydroelectric litigation.
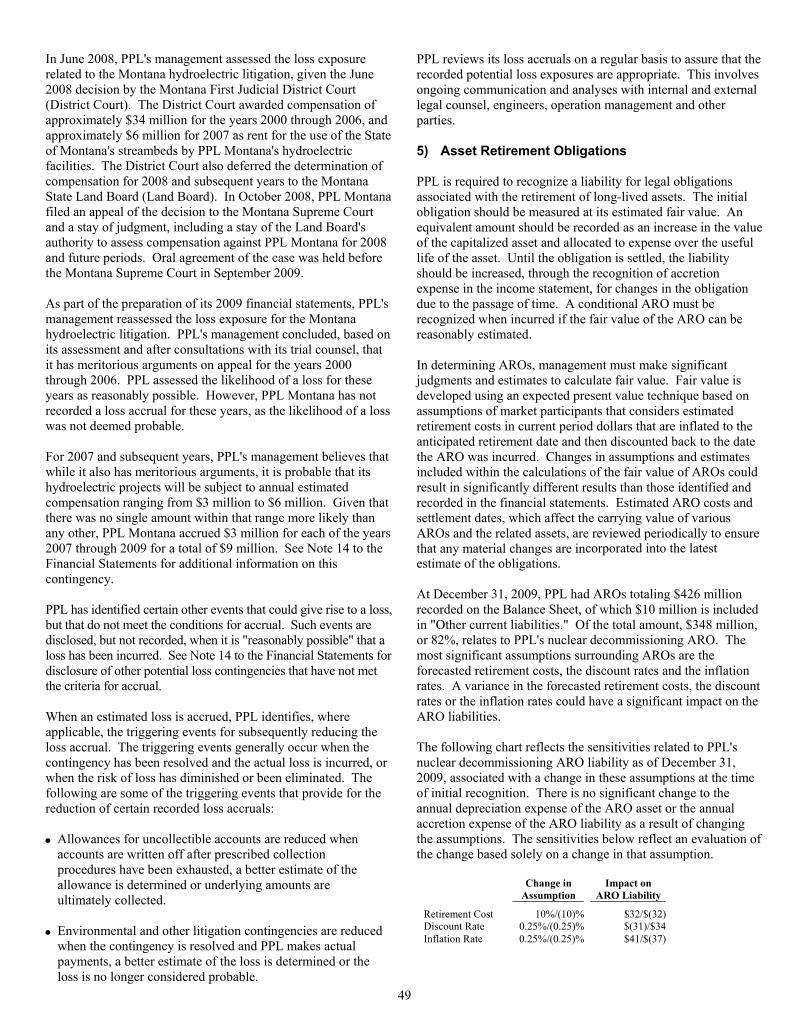
49
In June 2008, PPL's management assessed the loss exposure related to the Montana hydroelectric litigation, given the June 2008 decision by the Montana First Judicial District Court (District Court). The District Court awarded compensation of approximately $34 million for the years 2000 through 2006, and approximately $6 million for 2007 as rent for the use of the State of Montana's streambeds by PPL Montana's hydroelectric facilities. The District Court also deferred the determination of compensation for 2008 and subsequent years to the Montana State Land Board (Land Board). In October 2008, PPL Montana filed an appeal of the decision to the Montana Supreme Court and a stay of judgment, including a stay of the Land Board's authority to assess compensation against PPL Montana for 2008 and future periods. Oral agreement of the case was held before the Montana Supreme Court in September 2009. As part of the preparation of its 2009 financial statements, PPL's management reassessed the loss exposure for the Montana hydroelectric litigation. PPL's management concluded, based on its assessment and after consultations with its trial counsel, that it has meritorious arguments on appeal for the years 2000 through 2006. PPL assessed the likelihood of a loss for these years as reasonably possible. However, PPL Montana has not recorded a loss accrual for these years, as the likelihood of a loss was not deemed probable. For 2007 and subsequent years, PPL's management believes that while it also has meritorious arguments, it is probable that its hydroelectric projects will be subject to annual estimated compensation ranging from $3 million to $6 million. Given that there was no single amount within that range more likely than any other, PPL Montana accrued $3 million for each of the years 2007 through 2009 for a total of $9 million. See Note 14 to the Financial Statements for additional information on this contingency. PPL has identified certain other events that could give rise to a loss, but that do not meet the conditions for accrual. Such events are disclosed, but not recorded, when it is "reasonably possible" that a loss has been incurred. See Note 14 to the Financial Statements for disclosure of other potential loss contingencies that have not met the criteria for accrual. When an estimated loss is accrued, PPL identifies, where applicable, the triggering events for subsequently reducing the loss accrual. The triggering events generally occur when the contingency has been resolved and the actual loss is incurred, or when the risk of loss has diminished or been eliminated. The following are some of the triggering events that provide for the reduction of certain recorded loss accruals: • Allowances for uncollectible accounts are reduced when
accounts are written off after prescribed collection procedures have been exhausted, a better estimate of the allowance is determined or underlying amounts are ultimately collected.
• Environmental and other litigation contingencies are reduced
when the contingency is resolved and PPL makes actual payments, a better estimate of the loss is determined or the loss is no longer considered probable.
PPL reviews its loss accruals on a regular basis to assure that the recorded potential loss exposures are appropriate. This involves ongoing communication and analyses with internal and external legal counsel, engineers, operation management and other parties. 5) Asset Retirement Obligations PPL is required to recognize a liability for legal obligations associated with the retirement of long-lived assets. The initial obligation should be measured at its estimated fair value. An equivalent amount should be recorded as an increase in the value of the capitalized asset and allocated to expense over the useful life of the asset. Until the obligation is settled, the liability should be increased, through the recognition of accretion expense in the income statement, for changes in the obligation due to the passage of time. A conditional ARO must be recognized when incurred if the fair value of the ARO can be reasonably estimated. In determining AROs, management must make significant judgments and estimates to calculate fair value. Fair value is developed using an expected present value technique based on assumptions of market participants that considers estimated retirement costs in current period dollars that are inflated to the anticipated retirement date and then discounted back to the date the ARO was incurred. Changes in assumptions and estimates included within the calculations of the fair value of AROs could result in significantly different results than those identified and recorded in the financial statements. Estimated ARO costs and settlement dates, which affect the carrying value of various AROs and the related assets, are reviewed periodically to ensure that any material changes are incorporated into the latest estimate of the obligations. At December 31, 2009, PPL had AROs totaling $426 million recorded on the Balance Sheet, of which $10 million is included in "Other current liabilities." Of the total amount, $348 million, or 82%, relates to PPL's nuclear decommissioning ARO. The most significant assumptions surrounding AROs are the forecasted retirement costs, the discount rates and the inflation rates. A variance in the forecasted retirement costs, the discount rates or the inflation rates could have a significant impact on the ARO liabilities. The following chart reflects the sensitivities related to PPL's nuclear decommissioning ARO liability as of December 31, 2009, associated with a change in these assumptions at the time of initial recognition. There is no significant change to the annual depreciation expense of the ARO asset or the annual accretion expense of the ARO liability as a result of changing the assumptions. The sensitivities below reflect an evaluation of the change based solely on a change in that assumption.
Change in
Assumption Impact on
ARO Liability
Retirement Cost 10%/(10)% $32/$(32)Discount Rate 0.25%/(0.25)% $(31)/$34Inflation Rate 0.25%/(0.25)% $41/$(37)
50
6) Income Tax Uncertainties Significant management judgment is required in developing PPL's provision for income taxes primarily due to the uncertainty related to tax positions taken or expected to be taken in tax returns and the determination of deferred tax assets, liabilities and valuation allowances. Significant management judgment is required to determine the amount of benefit recognized related to an uncertain tax position. PPL evaluates its tax positions following a two-step process. The first step requires an entity to determine whether, based on the technical merits supporting a particular tax position, it is more likely than not (greater than a 50% chance) that the tax position will be sustained. This determination assumes that the relevant taxing authority will examine the tax position and is aware of all the relevant facts surrounding the tax position. The second step requires an entity to recognize in the financial statements the benefit of a tax position that meets the more-likely-than-not recognition criterion. The benefit recognized is measured at the largest amount of benefit that has a likelihood of realization, upon settlement, that exceeds 50%. PPL's management considers a number of factors in assessing the benefit to be recognized, including negotiation of a settlement. On a quarterly basis, PPL reassesses its uncertain tax positions by considering information known at the reporting date. Based on management's assessment of new information, PPL may subsequently recognize a tax benefit for a previously unrecognized tax position, de-recognize a previously recognized tax position, or re-measure the benefit of a previously recognized tax position. The amounts ultimately paid upon resolution of issues raised by taxing authorities may differ materially from the amounts accrued and may materially impact PPL's financial statements in the future. The balance sheet classification of unrecognized tax benefits and the need for valuation allowances to reduce deferred tax assets also require significant management judgment. PPL classifies unrecognized tax benefits as current, to the extent management expects to settle an uncertain tax position, by payment or receipt of cash, within one year of the reporting date. Valuation allowances are initially recorded and reevaluated each reporting period by assessing the likelihood of the ultimate realization of a deferred tax asset. Management considers a number of factors in assessing the realization of a deferred tax asset, including the reversal of temporary differences, future taxable income and ongoing prudent and feasible tax planning strategies. Any tax planning strategy utilized in this assessment must meet the recognition and measurement criteria utilized by PPL to account for an uncertain tax positions. See Note 5 to the Financial Statements for the required disclosures. At December 31, 2009, it was reasonably possible that during the next 12 months the total amount of unrecognized tax benefits could increase by as much as $34 million or decrease by up to $179 million for PPL. This change could result from subsequent recognition, derecognition and/or changes in the measurement of uncertain tax positions related to the creditability of foreign taxes, the timing and utilization of foreign tax credits and the
related impact on alternative minimum tax and other credits, the timing and/or valuation of certain deductions, intercompany transactions and unitary filing groups. The events that could cause these changes are direct settlements with taxing authorities, litigation, legal or administrative guidance by relevant taxing authorities and the lapse of an applicable statute of limitation. 7) Regulatory Assets PPL's domestic electricity delivery business is subject to cost-based rate-regulation. As a result, PPL is required to reflect the effects of regulatory actions in its financial statements. PPL records assets that result from the regulated ratemaking process that may not be recorded under GAAP for non-regulated entities. Regulatory assets generally represent incurred costs that have been deferred because such costs are probable of future recovery in regulated customer rates. Management continually assesses whether the regulatory assets are probable of future recovery by considering factors such as changes in the applicable regulatory and political environments, the ability to recover costs through regulated rates, recent rate orders to other regulated entities, and the status of any pending or potential deregulation legislation. Based on this continual assessment, management believes the existing regulatory assets are probable of recovery. This assessment reflects the current political and regulatory climate at the state and federal levels, and is subject to change in the future. If future recovery of costs ceases to be probable, then asset write-offs would be required to be recognized in operating income. Additionally, the regulatory agencies can provide flexibility in the manner and timing of the depreciation of PP&E and amortization of regulatory assets. At December 31, 2009 and 2008, PPL had regulatory assets of $531 million and $763 million. All of PPL's regulatory assets are either currently being recovered under specific rate orders or represent amounts that will be recovered in future rates based upon established regulatory practices.
Other Information PPL's Audit Committee has approved the independent auditor to provide audit and audit-related services and other services permitted by Sarbanes-Oxley and SEC rules. The audit and audit-related services include services in connection with statutory and regulatory filings, reviews of offering documents and registration statements, and internal control reviews.

51
PPL ENERGY SUPPLY, LLC AND SUBSIDIARIES
Item 7. Management's Discussion and Analysis of Financial Condition and Results of Operations
Overview PPL Energy Supply is an energy company with headquarters in Allentown, Pennsylvania. Refer to "Item 1. Business - Background" for descriptions of its reportable segments, which are Supply and International Delivery. Through its subsidiaries, PPL Energy Supply is primarily engaged in the generation and marketing of electricity in two key markets - the northeastern and western U.S. - and in the delivery of electricity in the U.K. PPL Energy Supply's overall strategy is to achieve disciplined growth in energy supply margins while limiting volatility in both cash flows and earnings and to achieve stable, long-term growth in its regulated international electricity delivery business through efficient operations and strong customer and regulatory relations. More specifically, PPL Energy Supply's strategy for its electricity generation and marketing business is to match energy supply with load, or customer demand, under contracts of varying lengths with creditworthy counterparties to capture profits while effectively managing exposure to energy and fuel price volatility, counterparty credit risk and operational risk. PPL Energy Supply's strategy for its U.K. electricity delivery business is to own and operate this business at the most efficient cost while maintaining high quality customer service and reliability. PPL Energy Supply faces several risks in its supply business, principally electricity and capacity wholesale price risk, fuel supply and price risk, electricity and fuel basis risk, power plant performance, evolving regulatory frameworks and counterparty credit risk. PPL Energy Supply attempts to manage these risks through various means. For instance, PPL Energy Supply operates a portfolio of generation assets that is diversified as to geography, fuel source, cost structure and operating characteristics. PPL Energy Supply expects to expand its generation capacity over the next several years through power uprates at certain of its existing power plants, and is continually evaluating the potential construction of new plants and the potential acquisition of existing plants or businesses. PPL Energy Supply is and will continue to remain focused on the operating efficiency and availability of its existing and any newly constructed or acquired power plants. In addition, PPL Energy Supply has executed and continues to pursue contracts of varying lengths for energy sales and fuel supply, while using other means to mitigate risks associated with adverse changes in the difference, or margin, between the cost to produce electricity and the price at which PPL Energy Supply sells it. PPL Energy Supply's future profitability will be affected by prevailing market conditions and whether PPL Energy Supply decides to, or is able to, continue to enter into long-term or intermediate-term power sales and fuel purchase agreements or renew its existing agreements. Currently, PPL Energy Supply's commitments for energy sales are satisfied through its own generation assets and supply purchased from third parties. PPL Energy Supply markets and trades around its physical portfolio of generating assets through integrated generation, marketing and trading functions.
PPL Energy Supply has adopted financial and operational risk management programs that, among other things, are designed to monitor and manage its exposure to earnings and cash flow volatility related to changes in energy and fuel prices, interest rates, foreign currency exchange rates, counterparty credit quality and the operating performance of its generating units. The principal challenge that PPL Energy Supply faces in its international electricity delivery business is to maintain high quality customer service and reliability in a cost-effective manner. PPL Energy Supply's international electricity delivery business is rate-regulated. Accordingly, the business is subject to regulatory risk with respect to the costs that may not be recovered and investment returns that may not be collected through customer rates. PPL Energy Supply faces additional financial risks in conducting U.K. operations, such as fluctuations in foreign currency exchange rates and the effect these rates have on the conversion of U.K. earnings and cash flows to U.S. dollars. PPL Energy Supply attempts to manage these financial risks through its risk management programs. In order to manage financing costs and access to credit markets, a key objective for PPL Energy Supply's business as a whole is to maintain a strong credit profile. PPL Energy Supply continually focuses on maintaining an appropriate capital structure and liquidity position. See "Item 1A. Risk Factors" for more information concerning these and other material risks PPL Energy Supply faces in its businesses. In May 2009, PPL Generation signed a definitive agreement to sell its Long Island generation business and related tolling agreements and expects the sale to close on or about February 26, 2010. In November 2009, PPL Maine completed the sale of the majority of its hydroelectric generation business. These businesses are included in the Supply segment. In 2007, PPL Energy Supply sold its regulated electricity delivery businesses in Latin America, which were included in the International Delivery segment. See Note 9 to the Financial Statements for additional information. The purpose of "Management's Discussion and Analysis of Financial Condition and Results of Operations" is to provide information concerning PPL Energy Supply's performance in implementing the strategies and managing the risks and challenges mentioned above. Specifically: • "Results of Operations" provides an overview of PPL Energy
Supply's operating results in 2009, 2008 and 2007, including a review of earnings, with details of results by reportable segment. It also provides a brief outlook for 2010.
• "Financial Condition - Liquidity and Capital Resources"
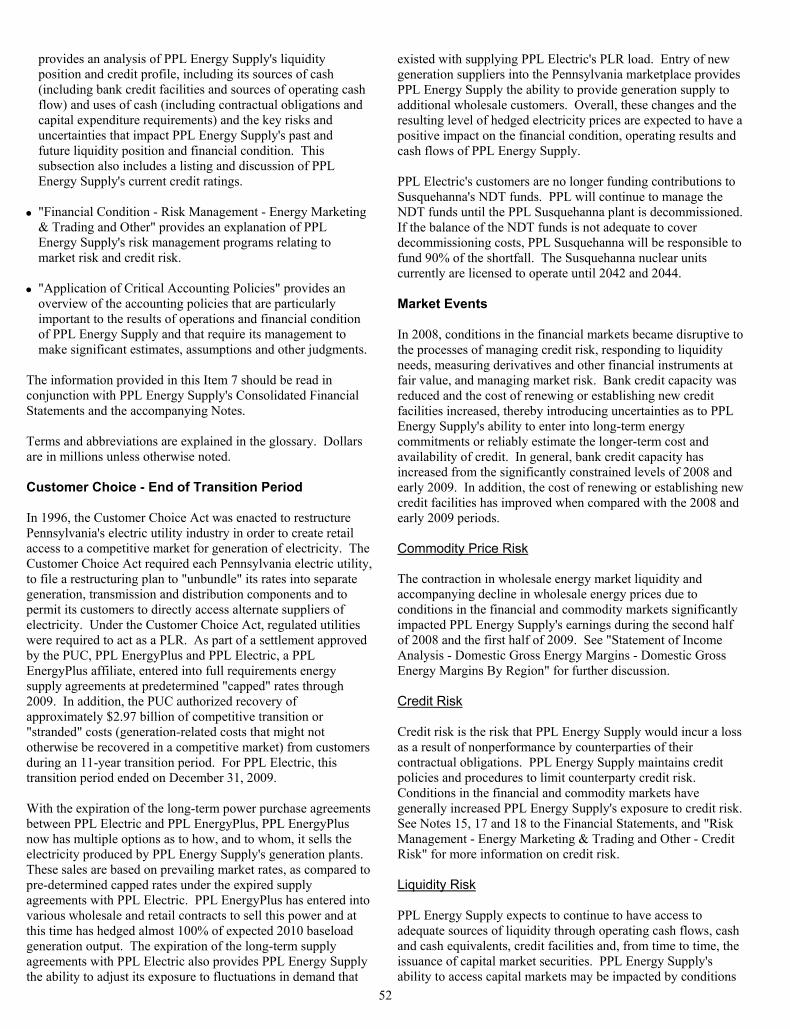
52
provides an analysis of PPL Energy Supply's liquidity position and credit profile, including its sources of cash (including bank credit facilities and sources of operating cash flow) and uses of cash (including contractual obligations and capital expenditure requirements) and the key risks and uncertainties that impact PPL Energy Supply's past and future liquidity position and financial condition. This subsection also includes a listing and discussion of PPL Energy Supply's current credit ratings.
• "Financial Condition - Risk Management - Energy Marketing
& Trading and Other" provides an explanation of PPL Energy Supply's risk management programs relating to market risk and credit risk.
• "Application of Critical Accounting Policies" provides an
overview of the accounting policies that are particularly important to the results of operations and financial condition of PPL Energy Supply and that require its management to make significant estimates, assumptions and other judgments.
The information provided in this Item 7 should be read in conjunction with PPL Energy Supply's Consolidated Financial Statements and the accompanying Notes. Terms and abbreviations are explained in the glossary. Dollars are in millions unless otherwise noted. Customer Choice - End of Transition Period In 1996, the Customer Choice Act was enacted to restructure Pennsylvania's electric utility industry in order to create retail access to a competitive market for generation of electricity. The Customer Choice Act required each Pennsylvania electric utility, to file a restructuring plan to "unbundle" its rates into separate generation, transmission and distribution components and to permit its customers to directly access alternate suppliers of electricity. Under the Customer Choice Act, regulated utilities were required to act as a PLR. As part of a settlement approved by the PUC, PPL EnergyPlus and PPL Electric, a PPL EnergyPlus affiliate, entered into full requirements energy supply agreements at predetermined "capped" rates through 2009. In addition, the PUC authorized recovery of approximately $2.97 billion of competitive transition or "stranded" costs (generation-related costs that might not otherwise be recovered in a competitive market) from customers during an 11-year transition period. For PPL Electric, this transition period ended on December 31, 2009. With the expiration of the long-term power purchase agreements between PPL Electric and PPL EnergyPlus, PPL EnergyPlus now has multiple options as to how, and to whom, it sells the electricity produced by PPL Energy Supply's generation plants. These sales are based on prevailing market rates, as compared to pre-determined capped rates under the expired supply agreements with PPL Electric. PPL EnergyPlus has entered into various wholesale and retail contracts to sell this power and at this time has hedged almost 100% of expected 2010 baseload generation output. The expiration of the long-term supply agreements with PPL Electric also provides PPL Energy Supply the ability to adjust its exposure to fluctuations in demand that
existed with supplying PPL Electric's PLR load. Entry of new generation suppliers into the Pennsylvania marketplace provides PPL Energy Supply the ability to provide generation supply to additional wholesale customers. Overall, these changes and the resulting level of hedged electricity prices are expected to have a positive impact on the financial condition, operating results and cash flows of PPL Energy Supply. PPL Electric's customers are no longer funding contributions to Susquehanna's NDT funds. PPL will continue to manage the NDT funds until the PPL Susquehanna plant is decommissioned. If the balance of the NDT funds is not adequate to cover decommissioning costs, PPL Susquehanna will be responsible to fund 90% of the shortfall. The Susquehanna nuclear units currently are licensed to operate until 2042 and 2044. Market Events In 2008, conditions in the financial markets became disruptive to the processes of managing credit risk, responding to liquidity needs, measuring derivatives and other financial instruments at fair value, and managing market risk. Bank credit capacity was reduced and the cost of renewing or establishing new credit facilities increased, thereby introducing uncertainties as to PPL Energy Supply's ability to enter into long-term energy commitments or reliably estimate the longer-term cost and availability of credit. In general, bank credit capacity has increased from the significantly constrained levels of 2008 and early 2009. In addition, the cost of renewing or establishing new credit facilities has improved when compared with the 2008 and early 2009 periods. Commodity Price Risk The contraction in wholesale energy market liquidity and accompanying decline in wholesale energy prices due to conditions in the financial and commodity markets significantly impacted PPL Energy Supply's earnings during the second half of 2008 and the first half of 2009. See "Statement of Income Analysis - Domestic Gross Energy Margins - Domestic Gross Energy Margins By Region" for further discussion. Credit Risk Credit risk is the risk that PPL Energy Supply would incur a loss as a result of nonperformance by counterparties of their contractual obligations. PPL Energy Supply maintains credit policies and procedures to limit counterparty credit risk. Conditions in the financial and commodity markets have generally increased PPL Energy Supply's exposure to credit risk. See Notes 15, 17 and 18 to the Financial Statements, and "Risk Management - Energy Marketing & Trading and Other - Credit Risk" for more information on credit risk. Liquidity Risk PPL Energy Supply expects to continue to have access to adequate sources of liquidity through operating cash flows, cash and cash equivalents, credit facilities and, from time to time, the issuance of capital market securities. PPL Energy Supply's ability to access capital markets may be impacted by conditions

53
in the overall financial and capital markets, as well as conditions specific to the utility sector. See "Financial Condition - Liquidity and Capital Resources" for an expanded discussion of PPL Energy Supply's liquidity position and a discussion of its forecasted sources of cash. Valuations in Inactive Markets Conditions in the financial markets have generally made it difficult to determine the fair value of certain assets and liabilities in inactive markets. Management has reviewed the activity in the energy and financial markets in which PPL Energy Supply transacts, concluding that all of these markets were active at December 31, 2009, with the exception of the market for auction rate securities. See Notes 17 and 21 to the Financial Statements and "Financial Condition - Liquidity and Capital Resources - Auction Rate Securities" for a discussion of these investments. Securities Price Risk Declines in the market price of debt and equity securities result in unrealized losses that reduce the asset values of PPL Energy Supply's investments in its defined benefit plans and NDT funds. Both the defined benefit plans and the NDT funds earned positive returns in the second half of 2009, thereby recovering a portion of the negative returns incurred in 2008 and the first quarter of 2009. PPL Energy Supply actively monitors the performance of the investments held in its defined benefit plans and NDT funds and periodically reviews the funds' investment allocations. See "Financial Condition - Risk Management - Energy Marketing & Trading and Other - NDT Funds - Securities Price Risk" for additional information on securities price risk. PPL Energy Supply's subsidiaries sponsor various defined benefit plans and participate in and are allocated costs from defined benefit plans sponsored by PPL. Determination of the funded status of defined benefit plans, contribution requirements and net periodic defined benefit costs for future years are subject to changes in various assumptions, in addition to the actual performance of the assets in the plans. See "Application of Critical Accounting Policies - Defined Benefits" for a discussion of the assumptions and sensitivities regarding those assumptions. The Economic Stimulus Package The Economic Stimulus Package was intended to stimulate the U.S. economy through federal tax relief, expansion of unemployment benefits and other social stimulus provisions, domestic spending for education, health care and infrastructure, including the energy sector. A portion of the benefits included in the Economic Stimulus Package are offered in the form of loan fee reductions, expanded loan guarantees and secondary market incentives, including delayed recognition for tax purposes of income related to the cancellation of certain types of debt. See "Financial Condition - Liquidity and Capital Resources" for a discussion of the applicability to the purchase of notes by PPL Energy Supply.
Funds from the Economic Stimulus Package have been allocated to various federal agencies, such as the DOE, and provided to state agencies through block grants. The DOE has made awards of the funds for smart grid, efficiency-related and renewable energy programs. The Commonwealth of Pennsylvania has also made awards for funding certain energy projects, including solar projects. As discussed in Note 8 to the Financial Statements, PPL Energy Supply has reconsidered and decided to pursue its Holtwood expansion project in view of the tax incentives and potential loan guarantees for renewable energy projects contained in the Economic Stimulus Package. PPL Energy Supply has applied for DOE loan guarantees for the Holtwood expansion project and, through its subsidiary PPL Montana, for the Rainbow redevelopment project.
Results of Operations PPL Energy Supply presents tables analyzing changes in amounts between periods within "Segment Results" and "Statement of Income Analysis" on a constant U.K. foreign currency exchange rate basis, where applicable, in order to isolate the impact of the change in the exchange rate on the item being explained. Results computed on a constant U.K. foreign currency exchange rate basis are calculated by translating current year results at the prior year weighted-average foreign currency exchange rate. Earnings Net income attributable to PPL Energy Supply was: 2009 2008 2007
$ 246 $ 768 $ 1,205 The changes in net income attributable to PPL Energy Supply from year to year were, in part, due to several special items that management considers significant. Details of these special items are provided within the review of each segment's earnings. The year-to-year changes in significant earnings components, including domestic gross energy margins by region and significant income statement line items, are explained in the "Statement of Income Analysis." PPL Energy Supply's earnings beyond 2009 are subject to various risks and uncertainties. See "Forward-Looking Information," "Item 1A. Risk Factors," the rest of this Item 7 and Note 14 to the Financial Statements for a discussion of the risks, uncertainties and factors that may impact PPL Energy Supply's future earnings. Segment Results Net income attributable to PPL Energy Supply by segment was: 2009 2008 2007
Supply $ 3 $ 478 $ 595International Delivery 243 290 610
Total $ 246 $ 768 $ 1,205
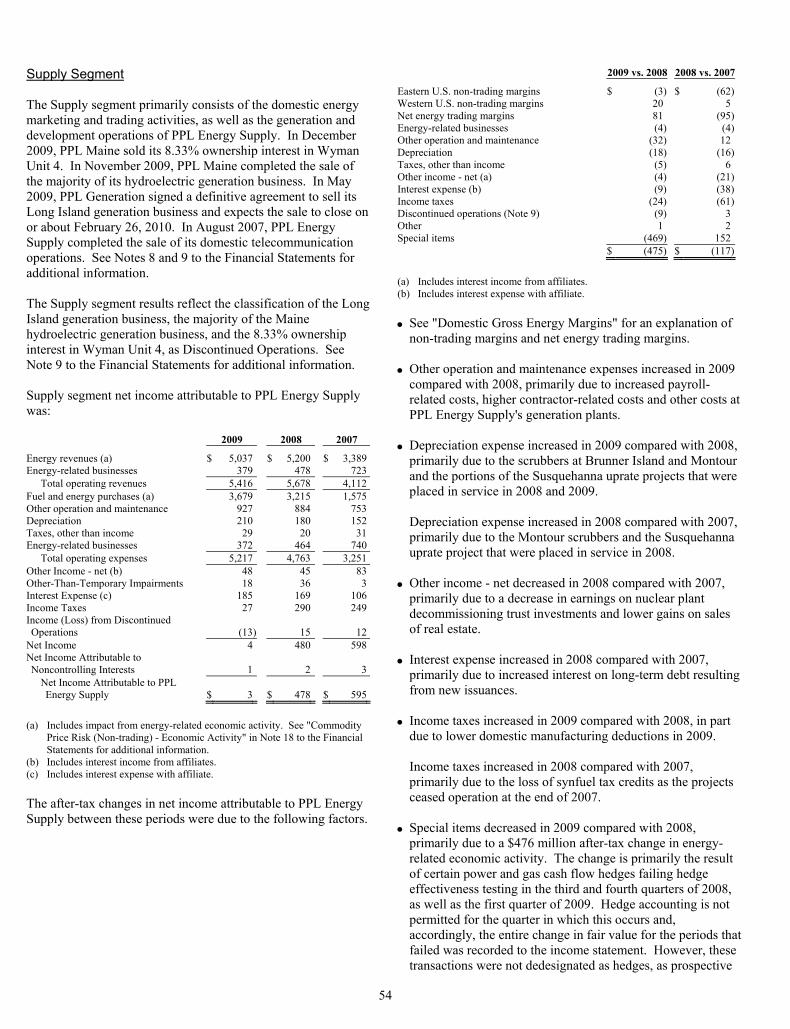
54
Supply Segment The Supply segment primarily consists of the domestic energy marketing and trading activities, as well as the generation and development operations of PPL Energy Supply. In December 2009, PPL Maine sold its 8.33% ownership interest in Wyman Unit 4. In November 2009, PPL Maine completed the sale of the majority of its hydroelectric generation business. In May 2009, PPL Generation signed a definitive agreement to sell its Long Island generation business and expects the sale to close on or about February 26, 2010. In August 2007, PPL Energy Supply completed the sale of its domestic telecommunication operations. See Notes 8 and 9 to the Financial Statements for additional information. The Supply segment results reflect the classification of the Long Island generation business, the majority of the Maine hydroelectric generation business, and the 8.33% ownership interest in Wyman Unit 4, as Discontinued Operations. See Note 9 to the Financial Statements for additional information. Supply segment net income attributable to PPL Energy Supply was: 2009 2008 2007
Energy revenues (a) $ 5,037 $ 5,200 $ 3,389Energy-related businesses 379 478 723
Total operating revenues 5,416 5,678 4,112Fuel and energy purchases (a) 3,679 3,215 1,575Other operation and maintenance 927 884 753Depreciation 210 180 152Taxes, other than income 29 20 31Energy-related businesses 372 464 740
Total operating expenses 5,217 4,763 3,251Other Income - net (b) 48 45 83Other-Than-Temporary Impairments 18 36 3Interest Expense (c) 185 169 106Income Taxes 27 290 249Income (Loss) from Discontinued Operations (13 ) 15 12
Net Income 4 480 598Net Income Attributable to Noncontrolling Interests 1 2 3
Net Income Attributable to PPL Energy Supply $ 3 $ 478 $ 595
(a) Includes impact from energy-related economic activity. See "Commodity
Price Risk (Non-trading) - Economic Activity" in Note 18 to the Financial Statements for additional information.
(b) Includes interest income from affiliates. (c) Includes interest expense with affiliate. The after-tax changes in net income attributable to PPL Energy Supply between these periods were due to the following factors.
2009 vs. 2008 2008 vs. 2007
Eastern U.S. non-trading margins $ (3) $ (62)Western U.S. non-trading margins 20 5Net energy trading margins 81 (95)Energy-related businesses (4) (4)Other operation and maintenance (32) 12Depreciation (18) (16)Taxes, other than income (5) 6Other income - net (a) (4) (21)Interest expense (b) (9) (38)Income taxes (24) (61)Discontinued operations (Note 9) (9) 3Other 1 2Special items (469) 152 $ (475) $ (117)
(a) Includes interest income from affiliates. (b) Includes interest expense with affiliate. • See "Domestic Gross Energy Margins" for an explanation of
non-trading margins and net energy trading margins. • Other operation and maintenance expenses increased in 2009
compared with 2008, primarily due to increased payroll-related costs, higher contractor-related costs and other costs at PPL Energy Supply's generation plants.
• Depreciation expense increased in 2009 compared with 2008,
primarily due to the scrubbers at Brunner Island and Montour and the portions of the Susquehanna uprate projects that were placed in service in 2008 and 2009. Depreciation expense increased in 2008 compared with 2007, primarily due to the Montour scrubbers and the Susquehanna uprate project that were placed in service in 2008.
• Other income - net decreased in 2008 compared with 2007,
primarily due to a decrease in earnings on nuclear plant decommissioning trust investments and lower gains on sales of real estate.
• Interest expense increased in 2008 compared with 2007,
primarily due to increased interest on long-term debt resulting from new issuances.
• Income taxes increased in 2009 compared with 2008, in part
due to lower domestic manufacturing deductions in 2009. Income taxes increased in 2008 compared with 2007, primarily due to the loss of synfuel tax credits as the projects ceased operation at the end of 2007.
• Special items decreased in 2009 compared with 2008,
primarily due to a $476 million after-tax change in energy-related economic activity. The change is primarily the result of certain power and gas cash flow hedges failing hedge effectiveness testing in the third and fourth quarters of 2008, as well as the first quarter of 2009. Hedge accounting is not permitted for the quarter in which this occurs and, accordingly, the entire change in fair value for the periods that failed was recorded to the income statement. However, these transactions were not dedesignated as hedges, as prospective
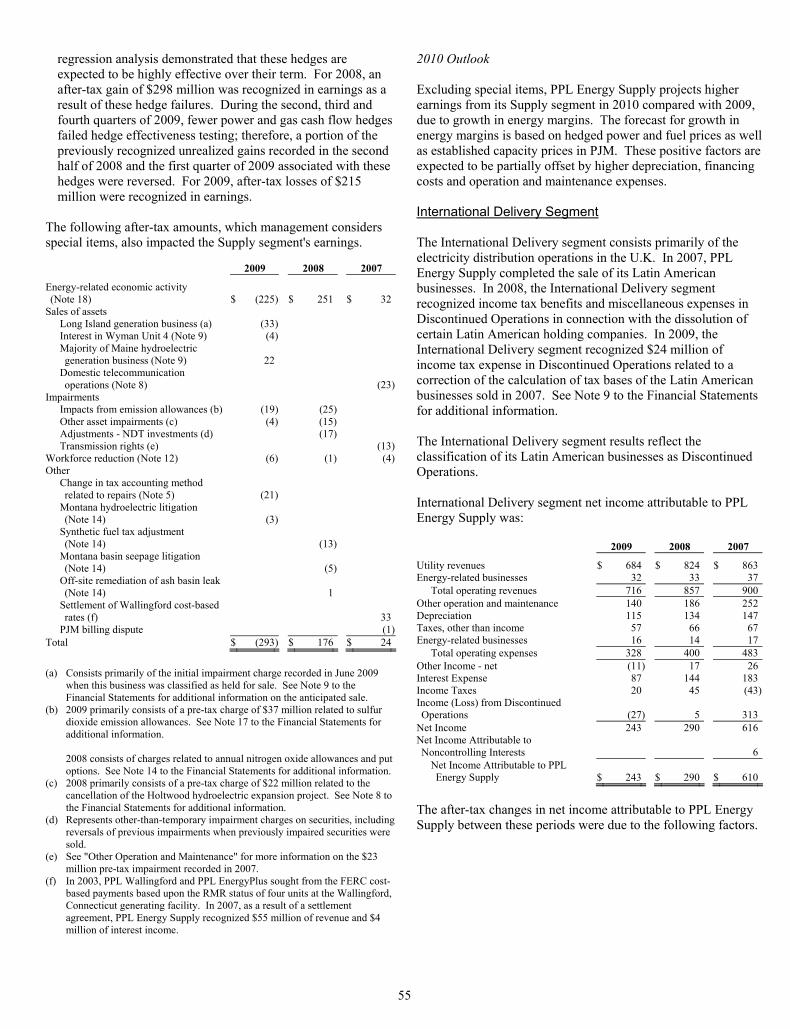
55
regression analysis demonstrated that these hedges are expected to be highly effective over their term. For 2008, an after-tax gain of $298 million was recognized in earnings as a result of these hedge failures. During the second, third and fourth quarters of 2009, fewer power and gas cash flow hedges failed hedge effectiveness testing; therefore, a portion of the previously recognized unrealized gains recorded in the second half of 2008 and the first quarter of 2009 associated with these hedges were reversed. For 2009, after-tax losses of $215 million were recognized in earnings.
The following after-tax amounts, which management considers special items, also impacted the Supply segment's earnings. 2009 2008 2007
Energy-related economic activity (Note 18) $ (225 ) $ 251 $ 32
Sales of assets Long Island generation business (a) (33 ) Interest in Wyman Unit 4 (Note 9) (4 ) Majority of Maine hydroelectric generation business (Note 9) 22
Domestic telecommunication operations (Note 8) (23)
Impairments Impacts from emission allowances (b) (19 ) (25) Other asset impairments (c) (4 ) (15) Adjustments - NDT investments (d) (17) Transmission rights (e) (13)
Workforce reduction (Note 12) (6 ) (1) (4)Other
Change in tax accounting method related to repairs (Note 5) (21 )
Montana hydroelectric litigation (Note 14) (3 )
Synthetic fuel tax adjustment (Note 14) (13)
Montana basin seepage litigation (Note 14) (5)
Off-site remediation of ash basin leak (Note 14) 1
Settlement of Wallingford cost-based rates (f) 33
PJM billing dispute (1)Total $ (293 ) $ 176 $ 24
(a) Consists primarily of the initial impairment charge recorded in June 2009
when this business was classified as held for sale. See Note 9 to the Financial Statements for additional information on the anticipated sale.
(b) 2009 primarily consists of a pre-tax charge of $37 million related to sulfur dioxide emission allowances. See Note 17 to the Financial Statements for additional information. 2008 consists of charges related to annual nitrogen oxide allowances and put options. See Note 14 to the Financial Statements for additional information.
(c) 2008 primarily consists of a pre-tax charge of $22 million related to the cancellation of the Holtwood hydroelectric expansion project. See Note 8 to the Financial Statements for additional information.
(d) Represents other-than-temporary impairment charges on securities, including reversals of previous impairments when previously impaired securities were sold.
(e) See "Other Operation and Maintenance" for more information on the $23 million pre-tax impairment recorded in 2007.
(f) In 2003, PPL Wallingford and PPL EnergyPlus sought from the FERC cost-based payments based upon the RMR status of four units at the Wallingford, Connecticut generating facility. In 2007, as a result of a settlement agreement, PPL Energy Supply recognized $55 million of revenue and $4 million of interest income.
2010 Outlook Excluding special items, PPL Energy Supply projects higher earnings from its Supply segment in 2010 compared with 2009, due to growth in energy margins. The forecast for growth in energy margins is based on hedged power and fuel prices as well as established capacity prices in PJM. These positive factors are expected to be partially offset by higher depreciation, financing costs and operation and maintenance expenses. International Delivery Segment The International Delivery segment consists primarily of the electricity distribution operations in the U.K. In 2007, PPL Energy Supply completed the sale of its Latin American businesses. In 2008, the International Delivery segment recognized income tax benefits and miscellaneous expenses in Discontinued Operations in connection with the dissolution of certain Latin American holding companies. In 2009, the International Delivery segment recognized $24 million of income tax expense in Discontinued Operations related to a correction of the calculation of tax bases of the Latin American businesses sold in 2007. See Note 9 to the Financial Statements for additional information. The International Delivery segment results reflect the classification of its Latin American businesses as Discontinued Operations. International Delivery segment net income attributable to PPL Energy Supply was: 2009 2008 2007
Utility revenues $ 684 $ 824 $ 863Energy-related businesses 32 33 37
Total operating revenues 716 857 900Other operation and maintenance 140 186 252Depreciation 115 134 147Taxes, other than income 57 66 67Energy-related businesses 16 14 17
Total operating expenses 328 400 483Other Income - net (11) 17 26Interest Expense 87 144 183Income Taxes 20 45 (43)Income (Loss) from Discontinued Operations (27) 5 313
Net Income 243 290 616Net Income Attributable to Noncontrolling Interests 6
Net Income Attributable to PPL Energy Supply $ 243 $ 290 $ 610
The after-tax changes in net income attributable to PPL Energy Supply between these periods were due to the following factors.
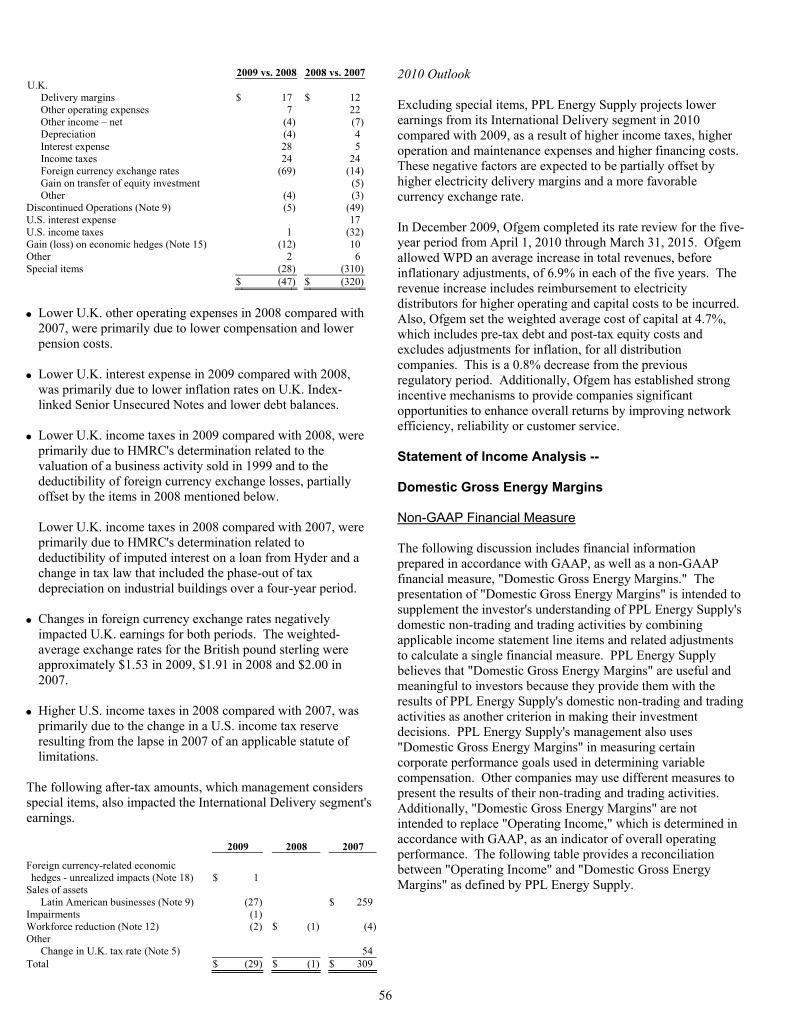
56
2009 vs. 2008 2008 vs. 2007U.K.
Delivery margins $ 17 $ 12 Other operating expenses 7 22 Other income – net (4) (7)Depreciation (4) 4 Interest expense 28 5 Income taxes 24 24 Foreign currency exchange rates (69) (14)Gain on transfer of equity investment (5)Other (4) (3)
Discontinued Operations (Note 9) (5) (49)U.S. interest expense 17 U.S. income taxes 1 (32)Gain (loss) on economic hedges (Note 15) (12) 10 Other 2 6 Special items (28) (310) $ (47) $ (320) • Lower U.K. other operating expenses in 2008 compared with
2007, were primarily due to lower compensation and lower pension costs.
• Lower U.K. interest expense in 2009 compared with 2008,
was primarily due to lower inflation rates on U.K. Index-linked Senior Unsecured Notes and lower debt balances.
• Lower U.K. income taxes in 2009 compared with 2008, were
primarily due to HMRC's determination related to the valuation of a business activity sold in 1999 and to the deductibility of foreign currency exchange losses, partially offset by the items in 2008 mentioned below. Lower U.K. income taxes in 2008 compared with 2007, were primarily due to HMRC's determination related to deductibility of imputed interest on a loan from Hyder and a change in tax law that included the phase-out of tax depreciation on industrial buildings over a four-year period.
• Changes in foreign currency exchange rates negatively
impacted U.K. earnings for both periods. The weighted-average exchange rates for the British pound sterling were approximately $1.53 in 2009, $1.91 in 2008 and $2.00 in 2007.
• Higher U.S. income taxes in 2008 compared with 2007, was
primarily due to the change in a U.S. income tax reserve resulting from the lapse in 2007 of an applicable statute of limitations.
The following after-tax amounts, which management considers special items, also impacted the International Delivery segment's earnings. 2009 2008 2007
Foreign currency-related economic hedges - unrealized impacts (Note 18) $ 1
Sales of assets Latin American businesses (Note 9) (27 ) $ 259
Impairments (1 ) Workforce reduction (Note 12) (2 ) $ (1) (4)Other
Change in U.K. tax rate (Note 5) 54Total $ (29 ) $ (1) $ 309
2010 Outlook Excluding special items, PPL Energy Supply projects lower earnings from its International Delivery segment in 2010 compared with 2009, as a result of higher income taxes, higher operation and maintenance expenses and higher financing costs. These negative factors are expected to be partially offset by higher electricity delivery margins and a more favorable currency exchange rate. In December 2009, Ofgem completed its rate review for the five-year period from April 1, 2010 through March 31, 2015. Ofgem allowed WPD an average increase in total revenues, before inflationary adjustments, of 6.9% in each of the five years. The revenue increase includes reimbursement to electricity distributors for higher operating and capital costs to be incurred. Also, Ofgem set the weighted average cost of capital at 4.7%, which includes pre-tax debt and post-tax equity costs and excludes adjustments for inflation, for all distribution companies. This is a 0.8% decrease from the previous regulatory period. Additionally, Ofgem has established strong incentive mechanisms to provide companies significant opportunities to enhance overall returns by improving network efficiency, reliability or customer service. Statement of Income Analysis -- Domestic Gross Energy Margins Non-GAAP Financial Measure The following discussion includes financial information prepared in accordance with GAAP, as well as a non-GAAP financial measure, "Domestic Gross Energy Margins." The presentation of "Domestic Gross Energy Margins" is intended to supplement the investor's understanding of PPL Energy Supply's domestic non-trading and trading activities by combining applicable income statement line items and related adjustments to calculate a single financial measure. PPL Energy Supply believes that "Domestic Gross Energy Margins" are useful and meaningful to investors because they provide them with the results of PPL Energy Supply's domestic non-trading and trading activities as another criterion in making their investment decisions. PPL Energy Supply's management also uses "Domestic Gross Energy Margins" in measuring certain corporate performance goals used in determining variable compensation. Other companies may use different measures to present the results of their non-trading and trading activities. Additionally, "Domestic Gross Energy Margins" are not intended to replace "Operating Income," which is determined in accordance with GAAP, as an indicator of overall operating performance. The following table provides a reconciliation between "Operating Income" and "Domestic Gross Energy Margins" as defined by PPL Energy Supply.
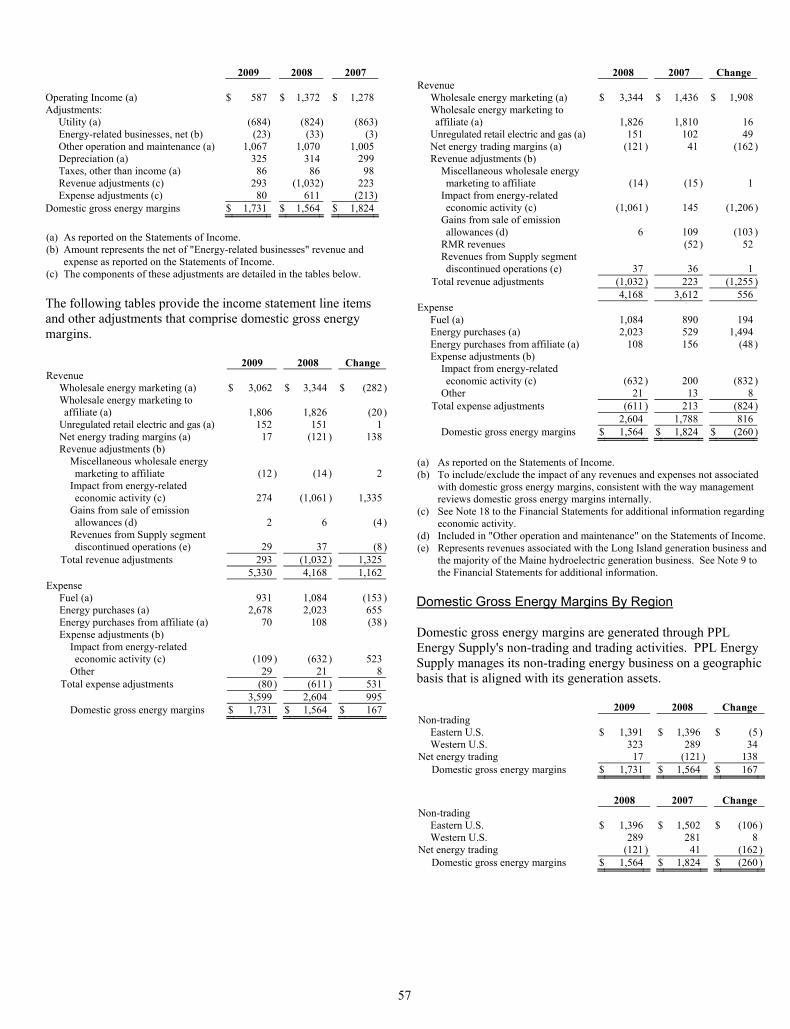
57
2009 2008 2007 Operating Income (a) $ 587 $ 1,372 $ 1,278Adjustments:
Utility (a) (684) (824) (863)Energy-related businesses, net (b) (23) (33) (3)Other operation and maintenance (a) 1,067 1,070 1,005Depreciation (a) 325 314 299Taxes, other than income (a) 86 86 98Revenue adjustments (c) 293 (1,032) 223Expense adjustments (c) 80 611 (213)
Domestic gross energy margins $ 1,731 $ 1,564 $ 1,824 (a) As reported on the Statements of Income. (b) Amount represents the net of "Energy-related businesses" revenue and
expense as reported on the Statements of Income. (c) The components of these adjustments are detailed in the tables below. The following tables provide the income statement line items and other adjustments that comprise domestic gross energy margins. 2009 2008 Change Revenue
Wholesale energy marketing (a) $ 3,062 $ 3,344 $ (282 )Wholesale energy marketing to affiliate (a) 1,806 1,826 (20 )
Unregulated retail electric and gas (a) 152 151 1Net energy trading margins (a) 17 (121 ) 138Revenue adjustments (b)
Miscellaneous wholesale energy marketing to affiliate (12 ) (14 ) 2
Impact from energy-related economic activity (c) 274 (1,061 ) 1,335
Gains from sale of emission allowances (d) 2 6 (4 )
Revenues from Supply segment discontinued operations (e) 29 37 (8 )
Total revenue adjustments 293 (1,032 ) 1,325 5,330 4,168 1,162
Expense Fuel (a) 931 1,084 (153 )Energy purchases (a) 2,678 2,023 655Energy purchases from affiliate (a) 70 108 (38 )Expense adjustments (b)
Impact from energy-related economic activity (c) (109 ) (632 ) 523
Other 29 21 8Total expense adjustments (80 ) (611 ) 531
3,599 2,604 995Domestic gross energy margins $ 1,731 $ 1,564 $ 167
2008 2007 Change Revenue
Wholesale energy marketing (a) $ 3,344 $ 1,436 $ 1,908Wholesale energy marketing to affiliate (a) 1,826 1,810 16
Unregulated retail electric and gas (a) 151 102 49Net energy trading margins (a) (121 ) 41 (162 )Revenue adjustments (b)
Miscellaneous wholesale energy marketing to affiliate (14 ) (15 ) 1
Impact from energy-related economic activity (c) (1,061 ) 145 (1,206 )
Gains from sale of emission allowances (d) 6 109 (103 )
RMR revenues (52 ) 52Revenues from Supply segment discontinued operations (e) 37 36 1
Total revenue adjustments (1,032 ) 223 (1,255 ) 4,168 3,612 556
Expense Fuel (a) 1,084 890 194Energy purchases (a) 2,023 529 1,494Energy purchases from affiliate (a) 108 156 (48 )Expense adjustments (b)
Impact from energy-related economic activity (c) (632 ) 200 (832 )
Other 21 13 8Total expense adjustments (611 ) 213 (824 )
2,604 1,788 816Domestic gross energy margins $ 1,564 $ 1,824 $ (260 )
(a) As reported on the Statements of Income. (b) To include/exclude the impact of any revenues and expenses not associated
with domestic gross energy margins, consistent with the way management reviews domestic gross energy margins internally.
(c) See Note 18 to the Financial Statements for additional information regarding economic activity.
(d) Included in "Other operation and maintenance" on the Statements of Income.(e) Represents revenues associated with the Long Island generation business and
the majority of the Maine hydroelectric generation business. See Note 9 to the Financial Statements for additional information.
Domestic Gross Energy Margins By Region Domestic gross energy margins are generated through PPL Energy Supply's non-trading and trading activities. PPL Energy Supply manages its non-trading energy business on a geographic basis that is aligned with its generation assets. 2009 2008 Change Non-trading
Eastern U.S. $ 1,391 $ 1,396 $ (5 )Western U.S. 323 289 34
Net energy trading 17 (121 ) 138 Domestic gross energy margins $ 1,731 $ 1,564 $ 167
2008 2007 Change Non-trading
Eastern U.S. $ 1,396 $ 1,502 $ (106 )Western U.S. 289 281 8
Net energy trading (121 ) 41 (162 )Domestic gross energy margins $ 1,564 $ 1,824 $ (260 )
58
Eastern U.S. Eastern U.S. non-trading margins were $5 million lower in 2009 compared with 2008. This decrease was primarily due to lower margins on full-requirement sales contracts resulting from mild weather, decreased demand, and customer migration. Also contributing to the decrease were higher average baseload generation fuel costs of 7%, primarily due to higher coal prices. Partially offsetting these lower margins were net gains resulting from the settlement of economic positions associated with rebalancing PPL Energy Supply's portfolios to better align them with current strategies, higher capacity revenue, higher baseload generation output due to unplanned major outages in 2008, and a 2.2% increase in the PLR sales prices in accordance with the PUC Final Order. Eastern U.S. non-trading margins were $106 million lower in 2008 compared with 2007. This decrease was primarily due to higher fuel costs, up 16%, primarily due to higher coal prices. Also contributing to the decrease was lower baseload generation, down 4%, primarily due to the unplanned outages at the eastern coal-fired units and retirement of the Martins Creek coal-fired units in September 2007. Partially offsetting these lower margins were higher margins from the hedged sale of generation in the wholesale market and a 1.4% increase in PLR sales prices in accordance with the PUC Final Order. Western U.S. Western U.S. non-trading margins were $34 million higher in 2009 compared with 2008. This increase was primarily due to higher wholesale volumes of 6% and increased generation from the hydroelectric units of 5%. Western U.S. non-trading margins were $8 million higher in 2008 compared with 2007. This increase was primarily due to increased generation from the hydroelectric units of 2%. Net Energy Trading PPL Energy Supply enters into energy contracts to take advantage of market opportunities. As a result, PPL Energy Supply may at times create a net open position in its portfolio that could result in significant losses if prices do not move in the manner or direction anticipated. However, these trading activities are subject to risk management program limits that are designed to protect PPL Energy Supply from undue financial loss. The margins from these trading activities are reflected in the Statements of Income as "Net energy trading margins." These physical and financial contracts cover trading activity associated with electricity, emission allowances, uranium, FTRs, natural gas, and oil. Net energy trading margins increased by $138 million in 2009 compared with 2008. This increase consisted of $215 million of higher unrealized margins partially offset by $77 million of lower realized margins. These changes were primarily due to increased margins in the power, gas and oil trading positions resulting from unrealized trading losses in 2008 due to a dramatic decline in energy prices and a severe contraction of liquidity in the wholesale power markets.
Net energy trading margins decreased by $162 million in 2008 compared with 2007. This decrease consists of $135 million of lower unrealized margins and $27 million of lower realized margins, both driven by significant decreases in power and gas prices in the second half of 2008. Utility Revenues The changes in utility revenues were attributable to: 2009 vs. 2008 2008 vs. 2007 U.K. foreign currency exchange rates $ (154) $ (42)U.K. electric delivery revenue 14 3
$ (140) $ (39) Higher U.K. electric delivery revenues for 2009 compared with 2008, excluding foreign currency exchange rate impacts, were primarily due to an increase in prices effective April 1, a revised estimate of network electricity losses, and favorable changes in customer mix. These increases were partially offset by lower volumes due to unfavorable economic conditions, including industrial customers scaling back on production, and a decrease in engineering and metering services performed for third parties. Energy-related Businesses Energy-related businesses contributed $10 million less to operating income in 2009 compared with 2008. The decrease was primarily attributable to: • contributions from domestic energy services-related
businesses decreasing by $6 million, primarily due to a decline in construction activity caused by the slowdown in the economy; and
• contributions from U.K. energy-related businesses decreasing by $4 million, primarily due to changes in foreign currency exchange rates.
Energy-related businesses contributed $30 million more to operating income in 2008 compared with 2007. The increase was primarily attributable to: • a $39 million impairment in 2007 of domestic
telecommunication operations that were sold in 2007; and • an $11 million increase in contributions from domestic energy
services-related businesses mainly due to increased construction activity; partially offset by
• $11 million of lower pre-tax contributions from synfuel projects. This reflects a $77 million net gain recorded in 2007 on options purchased to hedge the risk associated with the phase-out of synthetic fuel tax credits. This decrease was partially offset by $66 million less in operating losses from synfuel projects as the projects ceased operation at the end of 2007; and
• $5 million less in contributions from the domestic telecommunication operations sold in 2007.
See Note 8 to the Financial Statements for additional information on the sale of domestic telecommunication assets. See Note 14 to the Financial Statements for additional information on the shutdown of the synfuel facilities in 2007.
59
Other Operation and Maintenance The changes in other operation and maintenance expenses were due to: 2009 vs. 2008 2008 vs. 2007
U.K. foreign currency exchange rates $ (24) $ (8)Impairment of cancelled generation expansion project in 2008 (Note 8) (22) 22
Defined benefit costs - U.K. (Note 12) (16) (28)WPD recoverable engineering services (9) (17)Impairment and other charges - emission allowances (Notes 14 and 17) (9) 42
Montana basin seepage litigation (Note 14) (8) 8Uncollectible accounts (8) 4Trademark royalty fees from a PPL subsidiary (Note 15) (7) 9
WPD meter operator expenses (7) (6)Payroll-related costs 24 (6)Allocation of corporate service costs 16 (21)WPD distribution costs 15 7Domestic and international workforce reductions (Note 12) 13 (10)
Contractor-related expenses 11 (7)Defined benefit costs - U.S. (Note 12) 11 (3)Montana hydroelectric litigation (Note 14) 8 1Other costs at fossil/hydroelectric stations 7 1Other nuclear related expenses 7 (10)Lower gains on sales of emission allowances 4 103Impairment of transmission rights (a) (23)Other - Domestic (4) 10Other - U.K. (5) (3) $ (3) $ 65
(a) In 2007, Maine Electric Power Company (MEPCO), ISO New England
and other New England transmission owners submitted a filing to the FERC seeking to roll the revenue requirement of the MEPCO transmission facilities into the regional transmission rates in New England and to change certain rules concerning the use of the transmission line for energy and capacity. PPL Energy Supply protested this proposal and recorded an impairment of the transmission rights based on their estimated fair value.
Depreciation The increases in depreciation expense were due to: 2009 vs. 2008 2008 vs. 2007
Additions to PP&E (a) $ 40 $ 37U.K. foreign currency exchange rates (25) (7)Extension of useful lives of certain WPD network assets in mid-2007 (Note 1) (13)
Other (4) (2) $ 11 $ 15
(a) Primarily attributable to the completion of the Susquehanna generation
uprate and the Montour scrubber projects in 2008 and the Brunner Island scrubber projects in 2009.
Taxes, Other Than Income The changes in taxes, other than income were due to: 2009 vs. 2008 2008 vs. 2007
Domestic property tax expense (a) $ 10 $ (7)U.K. foreign currency exchange rates (12) (3)Other 2 (2) $ $ (12)
(a) The change in both periods was primarily due to a $7 million property tax credit recorded by PPL Montana in 2008.
Other Income - net See Note 16 to the Financial Statements for details of other income. Other-Than-Temporary Impairments Other-than-temporary impairments decreased by $18 million in 2009 compared with 2008, primarily due to stronger investment returns caused by improved market conditions within the financial markets. Other-than-temporary impairments increased by $33 million in 2008 compared with 2007, primarily due to negative investment returns caused by the downturn in the financial markets in 2008. Interest Income from Affiliates Interest income from affiliates decreased by $12 million in 2009 compared with 2008, and decreased by $15 million in 2008 compared with 2007. The decrease in 2009 was primarily due to the decline in the average balance outstanding and the floating interest rate on the collateral deposit related to the PLR contract. The decrease in 2008 was the result of reduced average balances outstanding on notes receivable from affiliates and the floating interest rate on the collateral deposit related to the PLR contract. Interest Expense The changes in interest expense, which includes "Interest Expense with Affiliate," were due to:
2009 vs. 2008 2008 vs. 2007
Inflation adjustment on U.K. Index-linked Senior Unsecured Notes $ (29) $ 6
U.K. foreign currency exchange rates (17) (8)Long-term debt interest expense (13) 21Hedging activities (3) (4)Capitalized interest 12 (1)Short-term debt interest expense 6 8Amortization of debt issuance costs 6 5Other (3) (3) $ (41) $ 24
Income Taxes The changes in income taxes were due to: 2009 vs. 2008 2008 vs. 2007
Lower pre-tax book income $ (300) $ (6)Tax on foreign earnings (a) (43) (3)Synthetic fuel and other tax credits (b) (17) 72Tax reserve adjustments (a) (c) (d) (2) 44Tax return adjustments (d) 44 (16)Domestic manufacturing deduction 13 (2)U.K. Finance Act adjustments (e) 8 46Other 9 (6) $ (288) $ 129
(a) During 2009, WPD recorded a $46 million foreign tax benefit (and a full
tax reserve reflected in "Tax reserve adjustments") related to losses generated by restructuring.
60
(b) The Section 29/45K synthetic fuel tax credits expired at the end of 2007. During 2008, PPL recorded a $13 million adjustment to its estimated 2007 fuel tax credits as a result of the IRS publishing the final 2007 inflation-adjusted credit in April 2008.
(c) During 2007, PPL Energy Supply recorded a $35 million benefit as a result of the expiration of applicable statutes of limitations. The expiration of applicable statues of limitations resulted in an $8 million benefit in 2008. Additionally, PPL Energy Supply recorded tax benefits of $27 million in 2009 for the settlement of a tax dispute and foreign currency exchange losses.
(d) During 2009, PPL Energy Supply received consent from the IRS to change its method of accounting for certain expenditures for tax purposes. PPL Energy Supply deducted the resulting IRC Sec. 481 adjustment on its 2008 tax return and recorded a $21 million adjustment to federal and state income tax expense, which results from the reduction of federal income tax benefits, related to the domestic manufacturing deduction and a reduction of certain state tax benefits related to state net operating losses. During 2008, WPD recorded tax benefits of approximately $17 million from tax return adjustments that were fully reserved.
(e) The U.K.'s Finance Act of 2008, enacted in July 2008, included a phase-out of tax depreciation on certain buildings. As a result, WPD recorded an $8 million deferred tax benefit during 2008 related to the reduction in its deferred tax liabilities. The U.K.'s Finance Act of 2007, enacted in July 2007, included a reduction in the U.K.'s statutory income tax rate. Effective April 1, 2008, the statutory income tax rate was reduced from 30% to 28%. As a result, WPD recorded a $54 million deferred tax benefit during 2007 related to the reduction in its deferred tax liabilities.
See Note 5 to the Financial Statements for additional information on income taxes. Discontinued Operations See Note 9 to the Financial Statements for information related to: • the anticipated sale of the Long Island generation business; • the sale of the majority of the Maine hydroelectric generation
business in 2009; • the sale of the 8.33% interest in Wyman Unit 4 in 2009; and • the sale of the Latin American businesses in 2007 and the
substantial dissolution of the remaining holding companies in 2008.
Financial Condition
Liquidity and Capital Resources PPL Energy Supply expects to continue to have adequate liquidity available through operating cash flows, cash and cash equivalents and its credit facilities. Additionally, subject to market conditions, PPL Energy Supply currently plans to access debt capital markets in 2010. PPL Energy Supply's cash flows from operations and access to cost-effective bank and capital markets are subject to risks and uncertainties including, but not limited to: • changes in market prices for electricity; • changes in commodity prices that may increase the cost of
producing power or decrease the amount PPL Energy Supply receives from selling power;
• operational and credit risks associated with selling and marketing products in the wholesale power markets;
• potential ineffectiveness of the trading, marketing and risk management policy and programs used to mitigate PPL Energy Supply's risk exposure to adverse electricity and fuel prices, interest rates, foreign currency exchange rates and counterparty credit;
• unusual or extreme weather that may damage PPL Energy Supply's international distribution facilities or affect energy sales to customers;
• reliance on transmission and distribution facilities that PPL Energy Supply does not own or control to deliver its electricity and natural gas;
• unavailability of generating units (due to unscheduled or longer-than-anticipated generation outages, weather and natural disasters) and the resulting loss of revenues and additional costs of replacement electricity;
• the ability to recover and the timeliness and adequacy of recovery of costs associated with international electricity delivery businesses;
• costs of compliance with existing and new environmental laws and with new security and safety requirements for nuclear facilities;
• any adverse outcome of legal proceedings and investigations with respect to PPL Energy Supply's current and past business activities;
• deterioration in the financial markets that could make obtaining new sources of bank and capital markets funding more difficult and more costly; and
• a downgrade in PPL Energy Supply's or its rated subsidiaries' credit ratings that could adversely affect their ability to access capital and increase the cost of credit facilities and any new debt.
See "Item 1A. Risk Factors" for further discussion of risks and uncertainties affecting PPL Energy Supply's cash flows. At December 31, PPL Energy Supply had the following: 2009 2008 2007
Cash and cash equivalents $ 245 $ 464 $ 355Short-term investments (a) (b) 150 102 $ 245 $ 614 $ 457Short-term debt $ 639 $ 584 $ 51
(a) 2008 amount represents tax-exempt bonds issued by the PEDFA in
December 2008 on behalf of PPL Energy Supply and purchased by a subsidiary of PPL Energy Supply upon issuance. Such bonds were refunded in April 2009. See Note 7 to the Financial Statements for further discussion.
(b) Includes $10 million of auction rate securities at December 31, 2007. See below for a discussion of auction rate securities.
The changes in PPL Energy Supply's cash and cash equivalents position resulted from:
2009 2008 2007
Net Cash Provided by Operating Activities $ 1,413 $ 1,039 $ 1,094
Net Cash Used in Investing Activities (551) (1,696) (305)Net Cash Provided by (Used in) Financing Activities (1,081) 779 (963)
Effect of Exchange Rates on Cash and Cash Equivalents (13) 5
Net Increase (Decrease) in Cash and Cash Equivalents $ (219) $ 109 $ (169)
61
Auction Rate Securities PPL Energy Supply held auction rate securities with an aggregate par value of $20 million and $24 million at December 31, 2009 and 2008. Historically, an active market existed for such investments, and the auctions provided an opportunity for investors either to hold an investment at a periodically reset interest rate or to sell the investment at its par value for immediate liquidity. In early 2008, investor concerns about credit and liquidity in the financial markets, generally, as well as investor concerns over specific insurers that guarantee the credit of certain of the underlying securities, created uncertainty in the auction rate securities market and these securities generally failed to be remarketed through their established auction process. The auctions continue to fail and the resulting illiquidity continues to impact PPL Energy Supply's investment in auction rate securities. At December 31, 2008, PPL Energy Supply estimated that the fair value of its auction rate securities was $19 million, which is reflected in "Other investments" on the Balance Sheet and represented a temporary decline of $5 million from par value. In 2009, PPL Energy Supply liquidated $4 million of auction rate securities at par. At December 31, 2009, PPL Energy Supply estimated that the fair value of its auction rate securities was equal to par value, which was $20 million and is reflected in "Other investments" on the Balance Sheet. PPL Energy Supply reversed the previously recorded temporary impairment. Because PPL Energy Supply intends and has the ability to hold these auction rate securities until they can be liquidated at par value, PPL Energy Supply believes that it does not have significant exposure to realize losses on these securities. Based upon the evaluation of available information, PPL Energy Supply believes these investments continue to be of high credit quality. Additionally, PPL Energy Supply does not anticipate having to sell these securities to fund operations. See Notes 17 and 21 to the Financial Statements for further discussion of auction rate securities. Operating Activities Net cash provided by operating activities increased by 36%, or $374 million, in 2009 compared with 2008, primarily as a result of the return of $300 million in cash collateral from PPL Electric related to the long-term PLR energy supply agreements (which expired at the end of 2009); cash collateral received from counterparties; and the benefit of lower income tax payments due to the change in method of accounting for certain expenditures for tax purposes. These increases were partially offset by a decrease in accounts payable and the unfavorable impact of foreign currency exchange rates in 2009 compared with 2008. Net cash provided by operating activities decreased by 5%, or $55 million, in 2008 compared with 2007, primarily as a result of increased expenditures for fuel, primarily due to higher coal prices, lower realized net energy trading margins, driven by significant decreases in power and gas prices, higher interest paid, primarily due to higher debt levels in 2008, and cash flows
provided by Latin America's operations in 2007 but not 2008, due to the sale of the Latin American businesses in 2007. The decreases to cash provided by operating activities resulting from these items were partially offset by higher revenues, due primarily to the hedged sale of generation in the wholesale market, increased sales volumes to PPL Electric under the PLR contracts to support the PLR load and a 1.4% increase in PLR sales prices, as well as less U.S. income tax payments, primarily as a result of a refund received in 2008, and operating losses incurred in 2007 in connection with synfuel projects that ceased operation at the end of 2007. A significant portion of PPL Energy Supply's operating cash flows is derived from its Supply segment baseload generation business activities. PPL Energy Supply employs a formal hedging program for its baseload generation fleet, the primary objective of which is to provide a reasonable level of near-term cash flow and earnings certainty over the next three years, while preserving upside potential if power prices increase over the medium term. See Note 18 to the Financial Statements for further discussion. Based on its generation portfolio contracting practices (including related fuel purchases and commitments), PPL Energy Supply expects to achieve relatively stable cash flows related to baseload generation during the next three years, although, future cash flows from operating activities are expected to be influenced more by commodity prices than during the past nine years when long-term supply contracts were in place between PPL EnergyPlus and PPL Electric. As discussed in "Item 1. Business," PPL Energy Supply estimates that, on average, approximately 94% of its total expected annual generation output (which includes baseload and other generation) for 2010 is committed under power sales contracts. PPL Energy Supply has also entered into commitments of varying quantities and terms for the years 2011 and beyond. PPL Energy Supply's contracts for the sale and purchase of electricity and fuel often require cash collateral or other credit enhancements, or reductions or terminations of a portion of the entire contract through cash settlement, in the event of a downgrade of PPL Energy Supply's or its subsidiary's credit ratings or adverse changes in market prices. For example, in addition to limiting its trading ability, if PPL Energy Supply's or its subsidiary's ratings were lowered to below "investment grade" and there was a 10% adverse movement in energy prices, PPL Energy Supply estimates that, based on its December 31, 2009 positions, it would have had to post additional collateral of approximately $291 million, compared with $815 million at December 31, 2008. PPL Energy Supply has in place risk management programs that are designed to monitor and manage its exposure to volatility of cash flows related to changes in energy and fuel prices, interest rates, foreign currency exchange rates, counterparty credit quality and the operating performance of its generating units. Investing Activities The primary use of cash in investing activities is capital expenditures. See "Forecasted Uses of Cash" for detail regarding capital expenditures in 2009 and projected expenditures for the years 2010 through 2012.
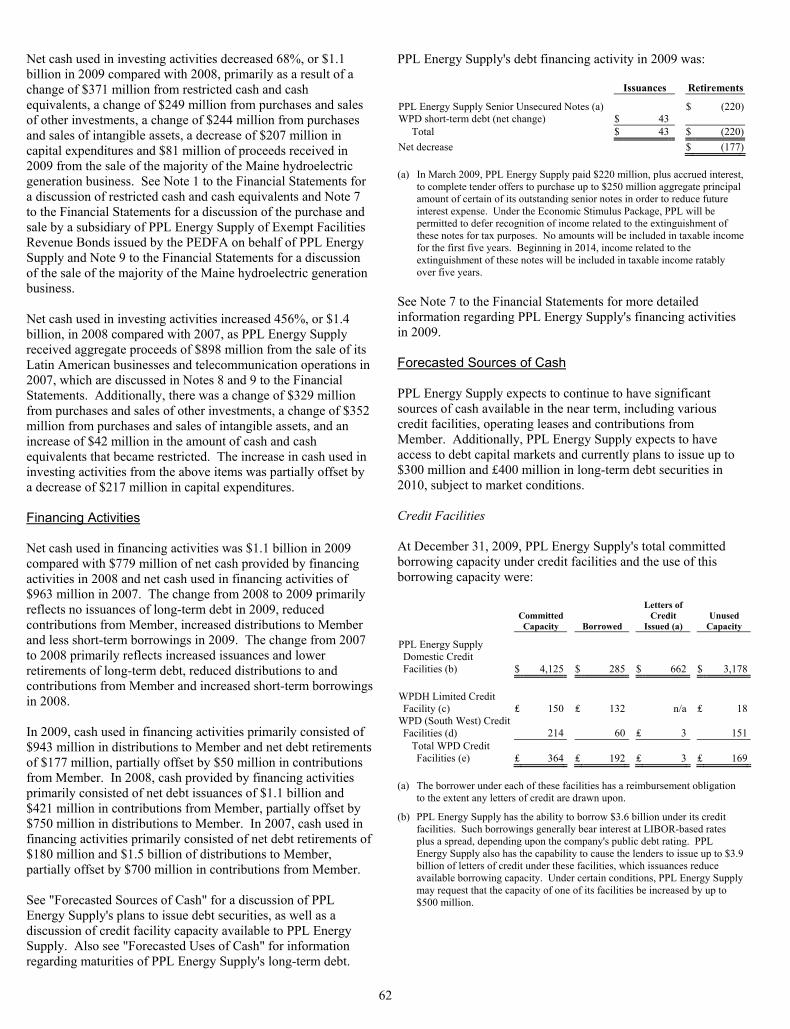
62
Net cash used in investing activities decreased 68%, or $1.1 billion in 2009 compared with 2008, primarily as a result of a change of $371 million from restricted cash and cash equivalents, a change of $249 million from purchases and sales of other investments, a change of $244 million from purchases and sales of intangible assets, a decrease of $207 million in capital expenditures and $81 million of proceeds received in 2009 from the sale of the majority of the Maine hydroelectric generation business. See Note 1 to the Financial Statements for a discussion of restricted cash and cash equivalents and Note 7 to the Financial Statements for a discussion of the purchase and sale by a subsidiary of PPL Energy Supply of Exempt Facilities Revenue Bonds issued by the PEDFA on behalf of PPL Energy Supply and Note 9 to the Financial Statements for a discussion of the sale of the majority of the Maine hydroelectric generation business. Net cash used in investing activities increased 456%, or $1.4 billion, in 2008 compared with 2007, as PPL Energy Supply received aggregate proceeds of $898 million from the sale of its Latin American businesses and telecommunication operations in 2007, which are discussed in Notes 8 and 9 to the Financial Statements. Additionally, there was a change of $329 million from purchases and sales of other investments, a change of $352 million from purchases and sales of intangible assets, and an increase of $42 million in the amount of cash and cash equivalents that became restricted. The increase in cash used in investing activities from the above items was partially offset by a decrease of $217 million in capital expenditures. Financing Activities Net cash used in financing activities was $1.1 billion in 2009 compared with $779 million of net cash provided by financing activities in 2008 and net cash used in financing activities of $963 million in 2007. The change from 2008 to 2009 primarily reflects no issuances of long-term debt in 2009, reduced contributions from Member, increased distributions to Member and less short-term borrowings in 2009. The change from 2007 to 2008 primarily reflects increased issuances and lower retirements of long-term debt, reduced distributions to and contributions from Member and increased short-term borrowings in 2008. In 2009, cash used in financing activities primarily consisted of $943 million in distributions to Member and net debt retirements of $177 million, partially offset by $50 million in contributions from Member. In 2008, cash provided by financing activities primarily consisted of net debt issuances of $1.1 billion and $421 million in contributions from Member, partially offset by $750 million in distributions to Member. In 2007, cash used in financing activities primarily consisted of net debt retirements of $180 million and $1.5 billion of distributions to Member, partially offset by $700 million in contributions from Member. See "Forecasted Sources of Cash" for a discussion of PPL Energy Supply's plans to issue debt securities, as well as a discussion of credit facility capacity available to PPL Energy Supply. Also see "Forecasted Uses of Cash" for information regarding maturities of PPL Energy Supply's long-term debt.
PPL Energy Supply's debt financing activity in 2009 was: Issuances Retirements
PPL Energy Supply Senior Unsecured Notes (a) $ (220)WPD short-term debt (net change) $ 43
Total $ 43 $ (220)Net decrease $ (177) (a) In March 2009, PPL Energy Supply paid $220 million, plus accrued interest,
to complete tender offers to purchase up to $250 million aggregate principal amount of certain of its outstanding senior notes in order to reduce future interest expense. Under the Economic Stimulus Package, PPL will be permitted to defer recognition of income related to the extinguishment of these notes for tax purposes. No amounts will be included in taxable income for the first five years. Beginning in 2014, income related to the extinguishment of these notes will be included in taxable income ratably over five years.
See Note 7 to the Financial Statements for more detailed information regarding PPL Energy Supply's financing activities in 2009. Forecasted Sources of Cash PPL Energy Supply expects to continue to have significant sources of cash available in the near term, including various credit facilities, operating leases and contributions from Member. Additionally, PPL Energy Supply expects to have access to debt capital markets and currently plans to issue up to $300 million and £400 million in long-term debt securities in 2010, subject to market conditions. Credit Facilities At December 31, 2009, PPL Energy Supply's total committed borrowing capacity under credit facilities and the use of this borrowing capacity were:
Committed Capacity Borrowed
Letters of Credit
Issued (a) Unused
Capacity
PPL Energy Supply Domestic Credit Facilities (b) $ 4,125 $ 285 $ 662 $ 3,178
WPDH Limited Credit Facility (c) ₤ 150 ₤ 132 n/a ₤ 18
WPD (South West) Credit Facilities (d) 214 60 ₤ 3 151
Total WPD Credit Facilities (e) ₤ 364 ₤ 192 ₤ 3 ₤ 169
(a) The borrower under each of these facilities has a reimbursement obligation
to the extent any letters of credit are drawn upon.
(b) PPL Energy Supply has the ability to borrow $3.6 billion under its credit facilities. Such borrowings generally bear interest at LIBOR-based rates plus a spread, depending upon the company's public debt rating. PPL Energy Supply also has the capability to cause the lenders to issue up to $3.9billion of letters of credit under these facilities, which issuances reduce available borrowing capacity. Under certain conditions, PPL Energy Supply may request that the capacity of one of its facilities be increased by up to $500 million.
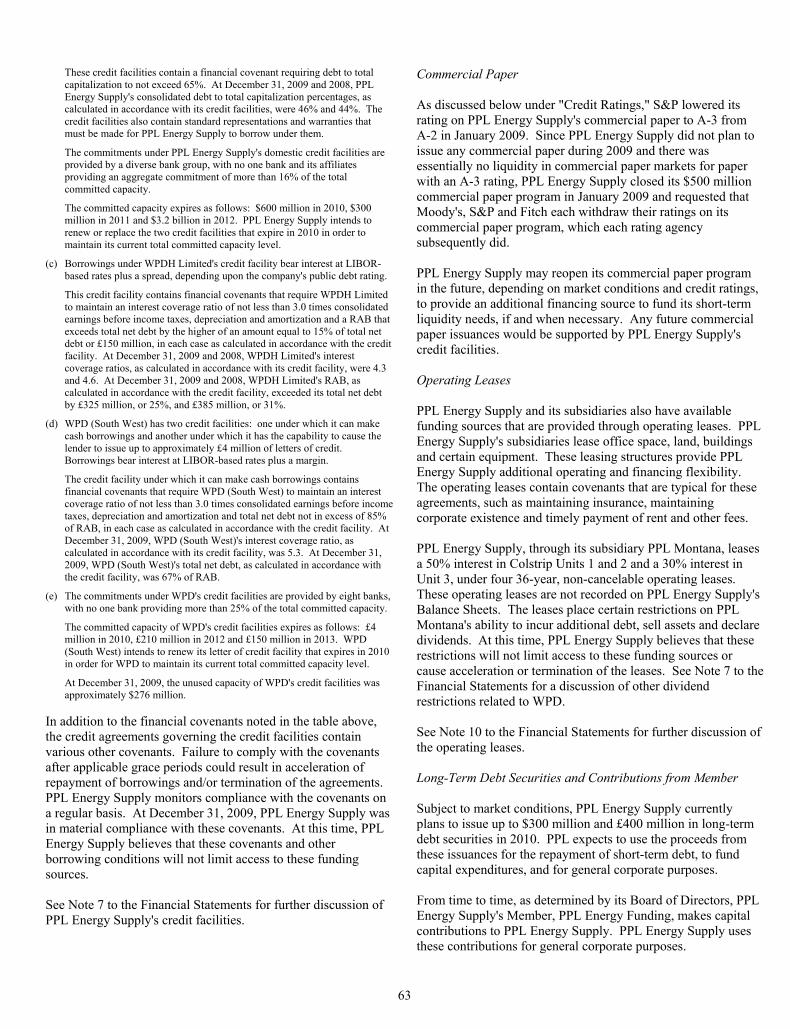
63
These credit facilities contain a financial covenant requiring debt to total
capitalization to not exceed 65%. At December 31, 2009 and 2008, PPL Energy Supply's consolidated debt to total capitalization percentages, as calculated in accordance with its credit facilities, were 46% and 44%. The credit facilities also contain standard representations and warranties that must be made for PPL Energy Supply to borrow under them.
The commitments under PPL Energy Supply's domestic credit facilities are provided by a diverse bank group, with no one bank and its affiliates providing an aggregate commitment of more than 16% of the total committed capacity.
The committed capacity expires as follows: $600 million in 2010, $300 million in 2011 and $3.2 billion in 2012. PPL Energy Supply intends to renew or replace the two credit facilities that expire in 2010 in order to maintain its current total committed capacity level.
(c) Borrowings under WPDH Limited's credit facility bear interest at LIBOR-based rates plus a spread, depending upon the company's public debt rating.
This credit facility contains financial covenants that require WPDH Limited to maintain an interest coverage ratio of not less than 3.0 times consolidated earnings before income taxes, depreciation and amortization and a RAB that exceeds total net debt by the higher of an amount equal to 15% of total net debt or £150 million, in each case as calculated in accordance with the credit facility. At December 31, 2009 and 2008, WPDH Limited's interest coverage ratios, as calculated in accordance with its credit facility, were 4.3 and 4.6. At December 31, 2009 and 2008, WPDH Limited's RAB, as calculated in accordance with the credit facility, exceeded its total net debt by £325 million, or 25%, and £385 million, or 31%.
(d) WPD (South West) has two credit facilities: one under which it can make cash borrowings and another under which it has the capability to cause the lender to issue up to approximately £4 million of letters of credit. Borrowings bear interest at LIBOR-based rates plus a margin.
The credit facility under which it can make cash borrowings contains financial covenants that require WPD (South West) to maintain an interest coverage ratio of not less than 3.0 times consolidated earnings before income taxes, depreciation and amortization and total net debt not in excess of 85% of RAB, in each case as calculated in accordance with the credit facility. At December 31, 2009, WPD (South West)'s interest coverage ratio, as calculated in accordance with its credit facility, was 5.3. At December 31, 2009, WPD (South West)'s total net debt, as calculated in accordance with the credit facility, was 67% of RAB.
(e) The commitments under WPD's credit facilities are provided by eight banks, with no one bank providing more than 25% of the total committed capacity.
The committed capacity of WPD's credit facilities expires as follows: £4 million in 2010, £210 million in 2012 and £150 million in 2013. WPD (South West) intends to renew its letter of credit facility that expires in 2010 in order for WPD to maintain its current total committed capacity level.
At December 31, 2009, the unused capacity of WPD's credit facilities was approximately $276 million.
In addition to the financial covenants noted in the table above, the credit agreements governing the credit facilities contain various other covenants. Failure to comply with the covenants after applicable grace periods could result in acceleration of repayment of borrowings and/or termination of the agreements. PPL Energy Supply monitors compliance with the covenants on a regular basis. At December 31, 2009, PPL Energy Supply was in material compliance with these covenants. At this time, PPL Energy Supply believes that these covenants and other borrowing conditions will not limit access to these funding sources. See Note 7 to the Financial Statements for further discussion of PPL Energy Supply's credit facilities.
Commercial Paper As discussed below under "Credit Ratings," S&P lowered its rating on PPL Energy Supply's commercial paper to A-3 from A-2 in January 2009. Since PPL Energy Supply did not plan to issue any commercial paper during 2009 and there was essentially no liquidity in commercial paper markets for paper with an A-3 rating, PPL Energy Supply closed its $500 million commercial paper program in January 2009 and requested that Moody's, S&P and Fitch each withdraw their ratings on its commercial paper program, which each rating agency subsequently did. PPL Energy Supply may reopen its commercial paper program in the future, depending on market conditions and credit ratings, to provide an additional financing source to fund its short-term liquidity needs, if and when necessary. Any future commercial paper issuances would be supported by PPL Energy Supply's credit facilities. Operating Leases PPL Energy Supply and its subsidiaries also have available funding sources that are provided through operating leases. PPL Energy Supply's subsidiaries lease office space, land, buildings and certain equipment. These leasing structures provide PPL Energy Supply additional operating and financing flexibility. The operating leases contain covenants that are typical for these agreements, such as maintaining insurance, maintaining corporate existence and timely payment of rent and other fees. PPL Energy Supply, through its subsidiary PPL Montana, leases a 50% interest in Colstrip Units 1 and 2 and a 30% interest in Unit 3, under four 36-year, non-cancelable operating leases. These operating leases are not recorded on PPL Energy Supply's Balance Sheets. The leases place certain restrictions on PPL Montana's ability to incur additional debt, sell assets and declare dividends. At this time, PPL Energy Supply believes that these restrictions will not limit access to these funding sources or cause acceleration or termination of the leases. See Note 7 to the Financial Statements for a discussion of other dividend restrictions related to WPD. See Note 10 to the Financial Statements for further discussion of the operating leases. Long-Term Debt Securities and Contributions from Member Subject to market conditions, PPL Energy Supply currently plans to issue up to $300 million and £400 million in long-term debt securities in 2010. PPL expects to use the proceeds from these issuances for the repayment of short-term debt, to fund capital expenditures, and for general corporate purposes. From time to time, as determined by its Board of Directors, PPL Energy Supply's Member, PPL Energy Funding, makes capital contributions to PPL Energy Supply. PPL Energy Supply uses these contributions for general corporate purposes.
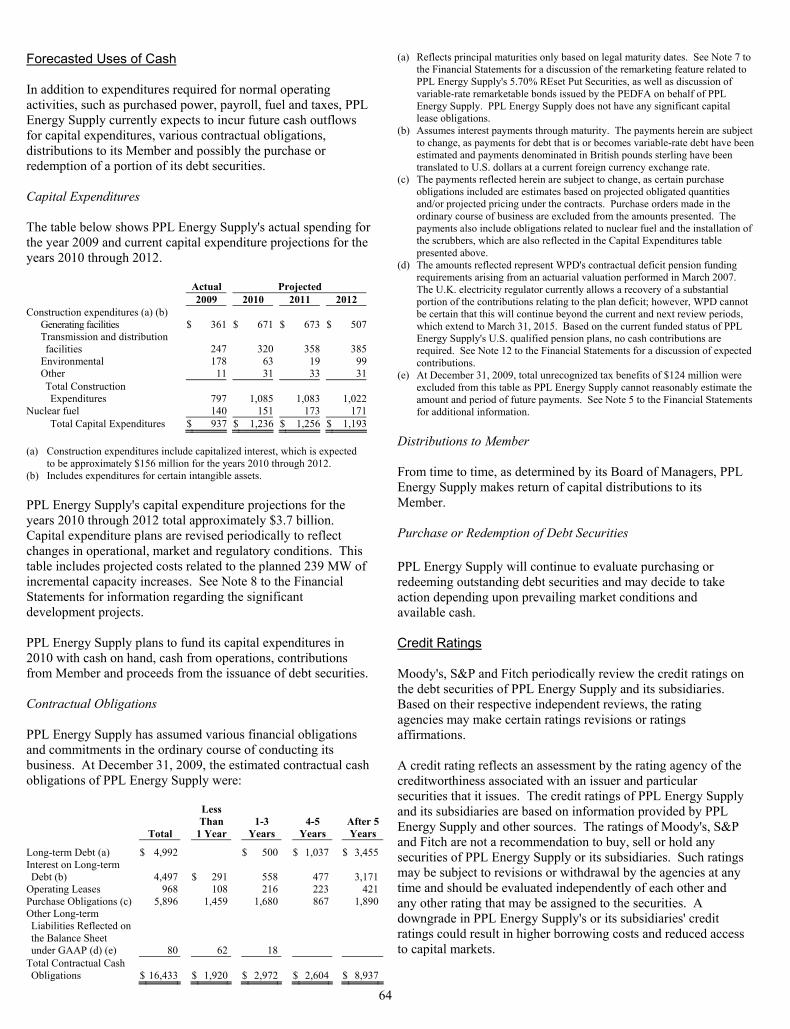
64
Forecasted Uses of Cash In addition to expenditures required for normal operating activities, such as purchased power, payroll, fuel and taxes, PPL Energy Supply currently expects to incur future cash outflows for capital expenditures, various contractual obligations, distributions to its Member and possibly the purchase or redemption of a portion of its debt securities. Capital Expenditures The table below shows PPL Energy Supply's actual spending for the year 2009 and current capital expenditure projections for the years 2010 through 2012. Actual Projected 2009 2010 2011 2012 Construction expenditures (a) (b)
Generating facilities $ 361 $ 671 $ 673 $ 507Transmission and distribution facilities 247 320 358 385
Environmental 178 63 19 99Other 11 31 33 31Total Construction Expenditures 797 1,085 1,083 1,022
Nuclear fuel 140 151 173 171Total Capital Expenditures $ 937 $ 1,236 $ 1,256 $ 1,193
(a) Construction expenditures include capitalized interest, which is expected
to be approximately $156 million for the years 2010 through 2012. (b) Includes expenditures for certain intangible assets. PPL Energy Supply's capital expenditure projections for the years 2010 through 2012 total approximately $3.7 billion. Capital expenditure plans are revised periodically to reflect changes in operational, market and regulatory conditions. This table includes projected costs related to the planned 239 MW of incremental capacity increases. See Note 8 to the Financial Statements for information regarding the significant development projects. PPL Energy Supply plans to fund its capital expenditures in 2010 with cash on hand, cash from operations, contributions from Member and proceeds from the issuance of debt securities. Contractual Obligations PPL Energy Supply has assumed various financial obligations and commitments in the ordinary course of conducting its business. At December 31, 2009, the estimated contractual cash obligations of PPL Energy Supply were:
Total
Less Than
1 Year 1-3
Years 4-5
Years After 5 Years
Long-term Debt (a) $ 4,992 $ 500 $ 1,037 $ 3,455Interest on Long-term Debt (b) 4,497 $ 291 558 477 3,171
Operating Leases 968 108 216 223 421Purchase Obligations (c) 5,896 1,459 1,680 867 1,890Other Long-term Liabilities Reflected on the Balance Sheet under GAAP (d) (e) 80 62 18
Total Contractual Cash Obligations $ 16,433 $ 1,920 $ 2,972 $ 2,604 $ 8,937
(a) Reflects principal maturities only based on legal maturity dates. See Note 7 to the Financial Statements for a discussion of the remarketing feature related to PPL Energy Supply's 5.70% REset Put Securities, as well as discussion of variable-rate remarketable bonds issued by the PEDFA on behalf of PPL Energy Supply. PPL Energy Supply does not have any significant capital lease obligations.
(b) Assumes interest payments through maturity. The payments herein are subject to change, as payments for debt that is or becomes variable-rate debt have been estimated and payments denominated in British pounds sterling have been translated to U.S. dollars at a current foreign currency exchange rate.
(c) The payments reflected herein are subject to change, as certain purchase obligations included are estimates based on projected obligated quantities and/or projected pricing under the contracts. Purchase orders made in the ordinary course of business are excluded from the amounts presented. The payments also include obligations related to nuclear fuel and the installation of the scrubbers, which are also reflected in the Capital Expenditures table presented above.
(d) The amounts reflected represent WPD's contractual deficit pension funding requirements arising from an actuarial valuation performed in March 2007. The U.K. electricity regulator currently allows a recovery of a substantial portion of the contributions relating to the plan deficit; however, WPD cannot be certain that this will continue beyond the current and next review periods, which extend to March 31, 2015. Based on the current funded status of PPL Energy Supply's U.S. qualified pension plans, no cash contributions are required. See Note 12 to the Financial Statements for a discussion of expected contributions.
(e) At December 31, 2009, total unrecognized tax benefits of $124 million were excluded from this table as PPL Energy Supply cannot reasonably estimate the amount and period of future payments. See Note 5 to the Financial Statements for additional information.
Distributions to Member From time to time, as determined by its Board of Managers, PPL Energy Supply makes return of capital distributions to its Member. Purchase or Redemption of Debt Securities PPL Energy Supply will continue to evaluate purchasing or redeeming outstanding debt securities and may decide to take action depending upon prevailing market conditions and available cash. Credit Ratings Moody's, S&P and Fitch periodically review the credit ratings on the debt securities of PPL Energy Supply and its subsidiaries. Based on their respective independent reviews, the rating agencies may make certain ratings revisions or ratings affirmations. A credit rating reflects an assessment by the rating agency of the creditworthiness associated with an issuer and particular securities that it issues. The credit ratings of PPL Energy Supply and its subsidiaries are based on information provided by PPL Energy Supply and other sources. The ratings of Moody's, S&P and Fitch are not a recommendation to buy, sell or hold any securities of PPL Energy Supply or its subsidiaries. Such ratings may be subject to revisions or withdrawal by the agencies at any time and should be evaluated independently of each other and any other rating that may be assigned to the securities. A downgrade in PPL Energy Supply's or its subsidiaries' credit ratings could result in higher borrowing costs and reduced access to capital markets.
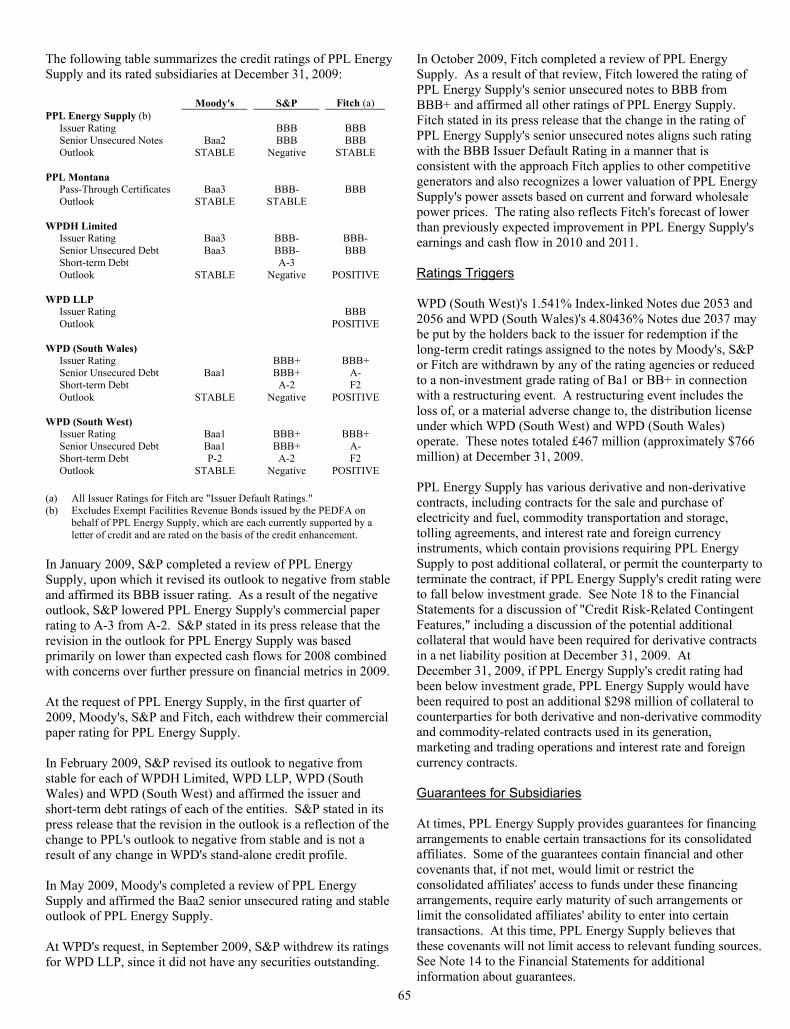
65
The following table summarizes the credit ratings of PPL Energy Supply and its rated subsidiaries at December 31, 2009:
Moody's S&P Fitch (a) PPL Energy Supply (b)
Issuer Rating BBB BBB Senior Unsecured Notes Baa2 BBB BBB Outlook STABLE Negative STABLE
PPL Montana Pass-Through Certificates Baa3 BBB- BBB Outlook STABLE STABLE
WPDH Limited Issuer Rating Baa3 BBB- BBB- Senior Unsecured Debt Baa3 BBB- BBB Short-term Debt A-3 Outlook STABLE Negative POSITIVE
WPD LLP Issuer Rating BBB Outlook POSITIVE
WPD (South Wales) Issuer Rating BBB+ BBB+ Senior Unsecured Debt Baa1 BBB+ A- Short-term Debt A-2 F2 Outlook STABLE Negative POSITIVE
WPD (South West) Issuer Rating Baa1 BBB+ BBB+ Senior Unsecured Debt Baa1 BBB+ A- Short-term Debt P-2 A-2 F2 Outlook STABLE Negative POSITIVE
(a) All Issuer Ratings for Fitch are "Issuer Default Ratings." (b) Excludes Exempt Facilities Revenue Bonds issued by the PEDFA on
behalf of PPL Energy Supply, which are each currently supported by a letter of credit and are rated on the basis of the credit enhancement.
In January 2009, S&P completed a review of PPL Energy Supply, upon which it revised its outlook to negative from stable and affirmed its BBB issuer rating. As a result of the negative outlook, S&P lowered PPL Energy Supply's commercial paper rating to A-3 from A-2. S&P stated in its press release that the revision in the outlook for PPL Energy Supply was based primarily on lower than expected cash flows for 2008 combined with concerns over further pressure on financial metrics in 2009. At the request of PPL Energy Supply, in the first quarter of 2009, Moody's, S&P and Fitch, each withdrew their commercial paper rating for PPL Energy Supply. In February 2009, S&P revised its outlook to negative from stable for each of WPDH Limited, WPD LLP, WPD (South Wales) and WPD (South West) and affirmed the issuer and short-term debt ratings of each of the entities. S&P stated in its press release that the revision in the outlook is a reflection of the change to PPL's outlook to negative from stable and is not a result of any change in WPD's stand-alone credit profile. In May 2009, Moody's completed a review of PPL Energy Supply and affirmed the Baa2 senior unsecured rating and stable outlook of PPL Energy Supply. At WPD's request, in September 2009, S&P withdrew its ratings for WPD LLP, since it did not have any securities outstanding.
In October 2009, Fitch completed a review of PPL Energy Supply. As a result of that review, Fitch lowered the rating of PPL Energy Supply's senior unsecured notes to BBB from BBB+ and affirmed all other ratings of PPL Energy Supply. Fitch stated in its press release that the change in the rating of PPL Energy Supply's senior unsecured notes aligns such rating with the BBB Issuer Default Rating in a manner that is consistent with the approach Fitch applies to other competitive generators and also recognizes a lower valuation of PPL Energy Supply's power assets based on current and forward wholesale power prices. The rating also reflects Fitch's forecast of lower than previously expected improvement in PPL Energy Supply's earnings and cash flow in 2010 and 2011. Ratings Triggers WPD (South West)'s 1.541% Index-linked Notes due 2053 and 2056 and WPD (South Wales)'s 4.80436% Notes due 2037 may be put by the holders back to the issuer for redemption if the long-term credit ratings assigned to the notes by Moody's, S&P or Fitch are withdrawn by any of the rating agencies or reduced to a non-investment grade rating of Ba1 or BB+ in connection with a restructuring event. A restructuring event includes the loss of, or a material adverse change to, the distribution license under which WPD (South West) and WPD (South Wales) operate. These notes totaled £467 million (approximately $766 million) at December 31, 2009. PPL Energy Supply has various derivative and non-derivative contracts, including contracts for the sale and purchase of electricity and fuel, commodity transportation and storage, tolling agreements, and interest rate and foreign currency instruments, which contain provisions requiring PPL Energy Supply to post additional collateral, or permit the counterparty to terminate the contract, if PPL Energy Supply's credit rating were to fall below investment grade. See Note 18 to the Financial Statements for a discussion of "Credit Risk-Related Contingent Features," including a discussion of the potential additional collateral that would have been required for derivative contracts in a net liability position at December 31, 2009. At December 31, 2009, if PPL Energy Supply's credit rating had been below investment grade, PPL Energy Supply would have been required to post an additional $298 million of collateral to counterparties for both derivative and non-derivative commodity and commodity-related contracts used in its generation, marketing and trading operations and interest rate and foreign currency contracts. Guarantees for Subsidiaries At times, PPL Energy Supply provides guarantees for financing arrangements to enable certain transactions for its consolidated affiliates. Some of the guarantees contain financial and other covenants that, if not met, would limit or restrict the consolidated affiliates' access to funds under these financing arrangements, require early maturity of such arrangements or limit the consolidated affiliates' ability to enter into certain transactions. At this time, PPL Energy Supply believes that these covenants will not limit access to relevant funding sources. See Note 14 to the Financial Statements for additional information about guarantees.
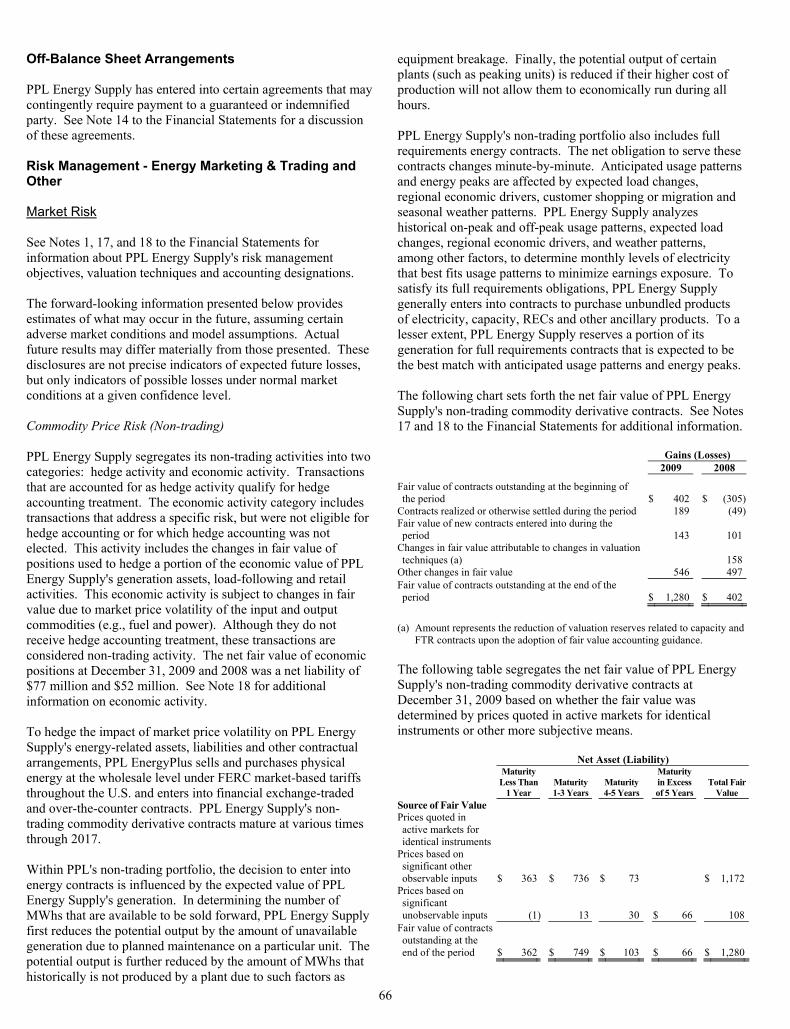
66
Off-Balance Sheet Arrangements PPL Energy Supply has entered into certain agreements that may contingently require payment to a guaranteed or indemnified party. See Note 14 to the Financial Statements for a discussion of these agreements. Risk Management - Energy Marketing & Trading and Other Market Risk See Notes 1, 17, and 18 to the Financial Statements for information about PPL Energy Supply's risk management objectives, valuation techniques and accounting designations. The forward-looking information presented below provides estimates of what may occur in the future, assuming certain adverse market conditions and model assumptions. Actual future results may differ materially from those presented. These disclosures are not precise indicators of expected future losses, but only indicators of possible losses under normal market conditions at a given confidence level. Commodity Price Risk (Non-trading) PPL Energy Supply segregates its non-trading activities into two categories: hedge activity and economic activity. Transactions that are accounted for as hedge activity qualify for hedge accounting treatment. The economic activity category includes transactions that address a specific risk, but were not eligible for hedge accounting or for which hedge accounting was not elected. This activity includes the changes in fair value of positions used to hedge a portion of the economic value of PPL Energy Supply's generation assets, load-following and retail activities. This economic activity is subject to changes in fair value due to market price volatility of the input and output commodities (e.g., fuel and power). Although they do not receive hedge accounting treatment, these transactions are considered non-trading activity. The net fair value of economic positions at December 31, 2009 and 2008 was a net liability of $77 million and $52 million. See Note 18 for additional information on economic activity. To hedge the impact of market price volatility on PPL Energy Supply's energy-related assets, liabilities and other contractual arrangements, PPL EnergyPlus sells and purchases physical energy at the wholesale level under FERC market-based tariffs throughout the U.S. and enters into financial exchange-traded and over-the-counter contracts. PPL Energy Supply's non-trading commodity derivative contracts mature at various times through 2017. Within PPL's non-trading portfolio, the decision to enter into energy contracts is influenced by the expected value of PPL Energy Supply's generation. In determining the number of MWhs that are available to be sold forward, PPL Energy Supply first reduces the potential output by the amount of unavailable generation due to planned maintenance on a particular unit. The potential output is further reduced by the amount of MWhs that historically is not produced by a plant due to such factors as
equipment breakage. Finally, the potential output of certain plants (such as peaking units) is reduced if their higher cost of production will not allow them to economically run during all hours. PPL Energy Supply's non-trading portfolio also includes full requirements energy contracts. The net obligation to serve these contracts changes minute-by-minute. Anticipated usage patterns and energy peaks are affected by expected load changes, regional economic drivers, customer shopping or migration and seasonal weather patterns. PPL Energy Supply analyzes historical on-peak and off-peak usage patterns, expected load changes, regional economic drivers, and weather patterns, among other factors, to determine monthly levels of electricity that best fits usage patterns to minimize earnings exposure. To satisfy its full requirements obligations, PPL Energy Supply generally enters into contracts to purchase unbundled products of electricity, capacity, RECs and other ancillary products. To a lesser extent, PPL Energy Supply reserves a portion of its generation for full requirements contracts that is expected to be the best match with anticipated usage patterns and energy peaks. The following chart sets forth the net fair value of PPL Energy Supply's non-trading commodity derivative contracts. See Notes 17 and 18 to the Financial Statements for additional information. Gains (Losses) 2009 2008
Fair value of contracts outstanding at the beginning of the period $ 402 $ (305)
Contracts realized or otherwise settled during the period 189 (49)Fair value of new contracts entered into during the period 143 101
Changes in fair value attributable to changes in valuation techniques (a) 158
Other changes in fair value 546 497Fair value of contracts outstanding at the end of the period $ 1,280 $ 402
(a) Amount represents the reduction of valuation reserves related to capacity and
FTR contracts upon the adoption of fair value accounting guidance. The following table segregates the net fair value of PPL Energy Supply's non-trading commodity derivative contracts at December 31, 2009 based on whether the fair value was determined by prices quoted in active markets for identical instruments or other more subjective means. Net Asset (Liability)
Maturity Less Than
1 Year Maturity 1-3 Years
Maturity 4-5 Years
Maturity in Excess of 5 Years
Total Fair Value
Source of Fair Value Prices quoted in active markets for identical instruments
Prices based on significant other observable inputs $ 363 $ 736 $ 73 $ 1,172
Prices based on significant unobservable inputs (1) 13 30 $ 66 108
Fair value of contracts outstanding at the end of the period $ 362 $ 749 $ 103 $ 66 $ 1,280
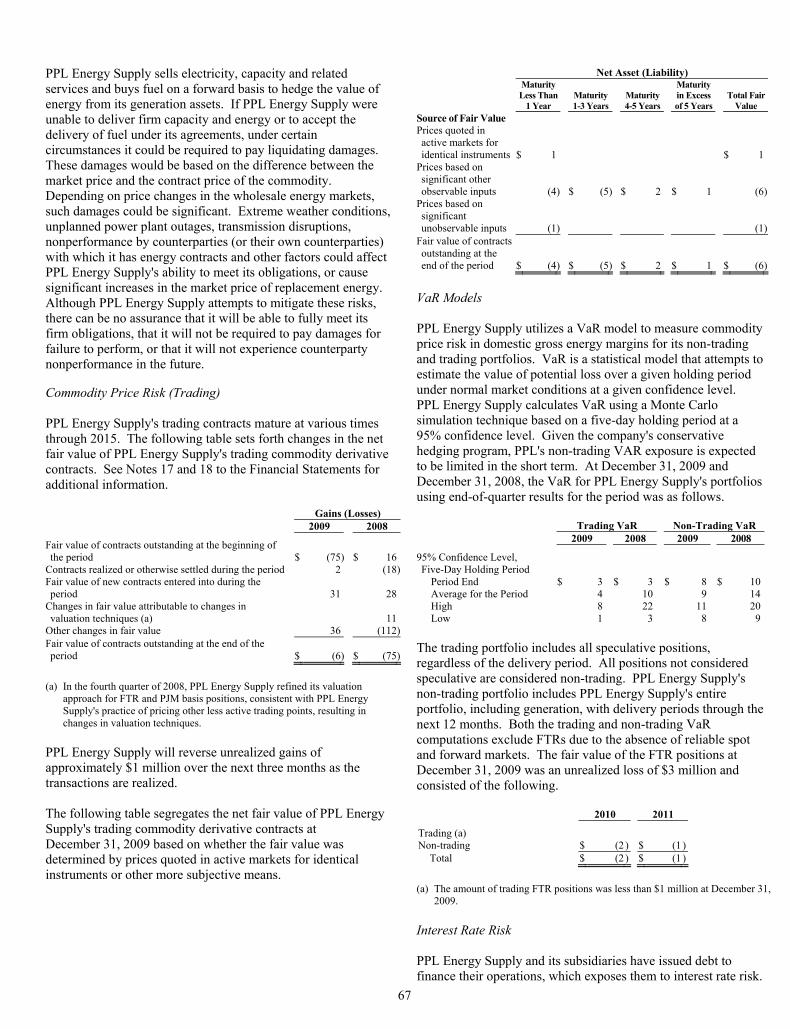
67
PPL Energy Supply sells electricity, capacity and related services and buys fuel on a forward basis to hedge the value of energy from its generation assets. If PPL Energy Supply were unable to deliver firm capacity and energy or to accept the delivery of fuel under its agreements, under certain circumstances it could be required to pay liquidating damages. These damages would be based on the difference between the market price and the contract price of the commodity. Depending on price changes in the wholesale energy markets, such damages could be significant. Extreme weather conditions, unplanned power plant outages, transmission disruptions, nonperformance by counterparties (or their own counterparties) with which it has energy contracts and other factors could affect PPL Energy Supply's ability to meet its obligations, or cause significant increases in the market price of replacement energy. Although PPL Energy Supply attempts to mitigate these risks, there can be no assurance that it will be able to fully meet its firm obligations, that it will not be required to pay damages for failure to perform, or that it will not experience counterparty nonperformance in the future. Commodity Price Risk (Trading) PPL Energy Supply's trading contracts mature at various times through 2015. The following table sets forth changes in the net fair value of PPL Energy Supply's trading commodity derivative contracts. See Notes 17 and 18 to the Financial Statements for additional information. Gains (Losses) 2009 2008
Fair value of contracts outstanding at the beginning of the period $ (75) $ 16
Contracts realized or otherwise settled during the period 2 (18)Fair value of new contracts entered into during the period 31 28
Changes in fair value attributable to changes in valuation techniques (a) 11
Other changes in fair value 36 (112)Fair value of contracts outstanding at the end of the period $ (6) $ (75)
(a) In the fourth quarter of 2008, PPL Energy Supply refined its valuation
approach for FTR and PJM basis positions, consistent with PPL Energy Supply's practice of pricing other less active trading points, resulting in changes in valuation techniques.
PPL Energy Supply will reverse unrealized gains of approximately $1 million over the next three months as the transactions are realized. The following table segregates the net fair value of PPL Energy Supply's trading commodity derivative contracts at December 31, 2009 based on whether the fair value was determined by prices quoted in active markets for identical instruments or other more subjective means.
Net Asset (Liability)
Maturity Less Than
1 Year Maturity 1-3 Years
Maturity 4-5 Years
Maturity in Excess of 5 Years
Total Fair Value
Source of Fair Value Prices quoted in active markets for identical instruments $ 1 $ 1
Prices based on significant other observable inputs (4) $ (5) $ 2 $ 1 (6)
Prices based on significant unobservable inputs (1) (1)
Fair value of contracts outstanding at the end of the period $ (4) $ (5) $ 2 $ 1 $ (6)
VaR Models PPL Energy Supply utilizes a VaR model to measure commodity price risk in domestic gross energy margins for its non-trading and trading portfolios. VaR is a statistical model that attempts to estimate the value of potential loss over a given holding period under normal market conditions at a given confidence level. PPL Energy Supply calculates VaR using a Monte Carlo simulation technique based on a five-day holding period at a 95% confidence level. Given the company's conservative hedging program, PPL's non-trading VAR exposure is expected to be limited in the short term. At December 31, 2009 and December 31, 2008, the VaR for PPL Energy Supply's portfolios using end-of-quarter results for the period was as follows.
Trading VaR Non-Trading VaR 2009 2008 2009 2008
95% Confidence Level, Five-Day Holding Period
Period End $ 3 $ 3 $ 8 $ 10Average for the Period 4 10 9 14High 8 22 11 20Low 1 3 8 9
The trading portfolio includes all speculative positions, regardless of the delivery period. All positions not considered speculative are considered non-trading. PPL Energy Supply's non-trading portfolio includes PPL Energy Supply's entire portfolio, including generation, with delivery periods through the next 12 months. Both the trading and non-trading VaR computations exclude FTRs due to the absence of reliable spot and forward markets. The fair value of the FTR positions at December 31, 2009 was an unrealized loss of $3 million and consisted of the following. 2010 2011
Trading (a) Non-trading $ (2 ) $ (1 )
Total $ (2 ) $ (1 )
(a) The amount of trading FTR positions was less than $1 million at December 31,
2009. Interest Rate Risk PPL Energy Supply and its subsidiaries have issued debt to finance their operations, which exposes them to interest rate risk.
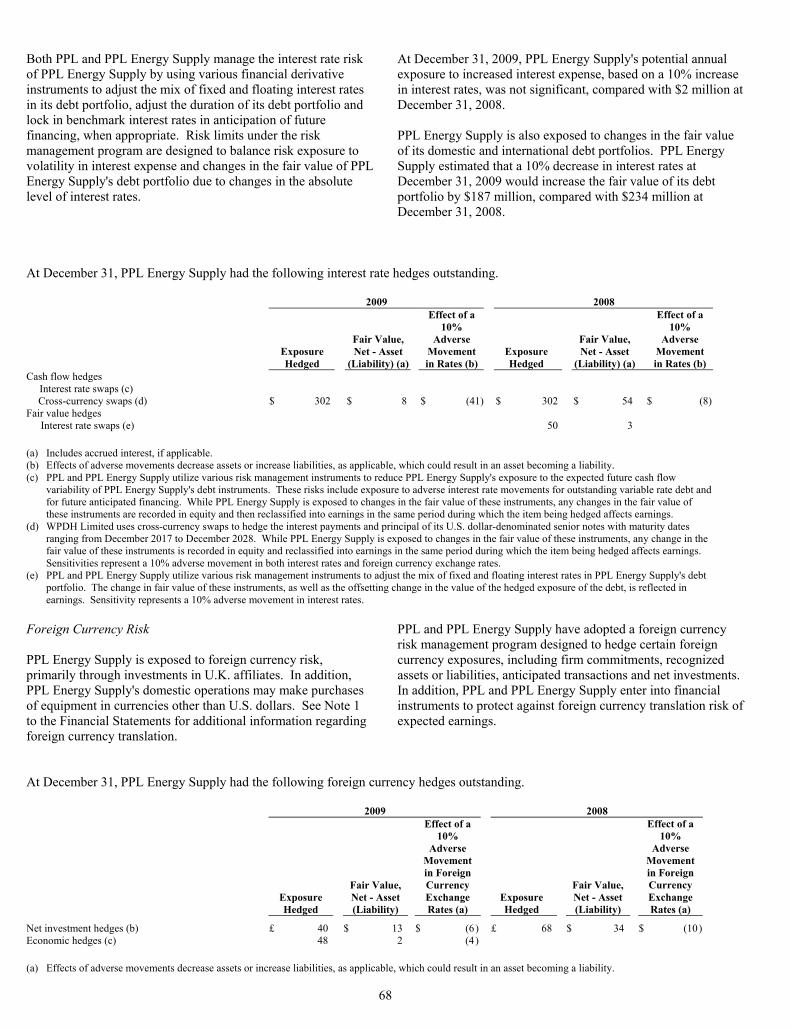
68
Both PPL and PPL Energy Supply manage the interest rate risk of PPL Energy Supply by using various financial derivative instruments to adjust the mix of fixed and floating interest rates in its debt portfolio, adjust the duration of its debt portfolio and lock in benchmark interest rates in anticipation of future financing, when appropriate. Risk limits under the risk management program are designed to balance risk exposure to volatility in interest expense and changes in the fair value of PPL Energy Supply's debt portfolio due to changes in the absolute level of interest rates.
At December 31, 2009, PPL Energy Supply's potential annual exposure to increased interest expense, based on a 10% increase in interest rates, was not significant, compared with $2 million at December 31, 2008. PPL Energy Supply is also exposed to changes in the fair value of its domestic and international debt portfolios. PPL Energy Supply estimated that a 10% decrease in interest rates at December 31, 2009 would increase the fair value of its debt portfolio by $187 million, compared with $234 million at December 31, 2008.
At December 31, PPL Energy Supply had the following interest rate hedges outstanding. 2009 2008
Exposure Hedged
Fair Value, Net - Asset
(Liability) (a)
Effect of a 10%
Adverse Movement in Rates (b)
Exposure Hedged
Fair Value, Net - Asset
(Liability) (a)
Effect of a 10%
Adverse Movement in Rates (b)
Cash flow hedges Interest rate swaps (c) Cross-currency swaps (d) $ 302 $ 8 $ (41) $ 302 $ 54 $ (8)
Fair value hedges Interest rate swaps (e) 50 3
(a) Includes accrued interest, if applicable. (b) Effects of adverse movements decrease assets or increase liabilities, as applicable, which could result in an asset becoming a liability. (c) PPL and PPL Energy Supply utilize various risk management instruments to reduce PPL Energy Supply's exposure to the expected future cash flow
variability of PPL Energy Supply's debt instruments. These risks include exposure to adverse interest rate movements for outstanding variable rate debt and for future anticipated financing. While PPL Energy Supply is exposed to changes in the fair value of these instruments, any changes in the fair value of these instruments are recorded in equity and then reclassified into earnings in the same period during which the item being hedged affects earnings.
(d) WPDH Limited uses cross-currency swaps to hedge the interest payments and principal of its U.S. dollar-denominated senior notes with maturity dates ranging from December 2017 to December 2028. While PPL Energy Supply is exposed to changes in the fair value of these instruments, any change in the fair value of these instruments is recorded in equity and reclassified into earnings in the same period during which the item being hedged affects earnings. Sensitivities represent a 10% adverse movement in both interest rates and foreign currency exchange rates.
(e) PPL and PPL Energy Supply utilize various risk management instruments to adjust the mix of fixed and floating interest rates in PPL Energy Supply's debt portfolio. The change in fair value of these instruments, as well as the offsetting change in the value of the hedged exposure of the debt, is reflected in earnings. Sensitivity represents a 10% adverse movement in interest rates.
Foreign Currency Risk PPL Energy Supply is exposed to foreign currency risk, primarily through investments in U.K. affiliates. In addition, PPL Energy Supply's domestic operations may make purchases of equipment in currencies other than U.S. dollars. See Note 1 to the Financial Statements for additional information regarding foreign currency translation.
PPL and PPL Energy Supply have adopted a foreign currency risk management program designed to hedge certain foreign currency exposures, including firm commitments, recognized assets or liabilities, anticipated transactions and net investments. In addition, PPL and PPL Energy Supply enter into financial instruments to protect against foreign currency translation risk of expected earnings.
At December 31, PPL Energy Supply had the following foreign currency hedges outstanding. 2009 2008
Exposure Hedged
Fair Value, Net - Asset (Liability)
Effect of a 10%
Adverse Movement in Foreign Currency Exchange Rates (a)
Exposure Hedged
Fair Value, Net - Asset (Liability)
Effect of a 10%
Adverse Movement in Foreign Currency Exchange Rates (a)
Net investment hedges (b) £ 40 $ 13 $ (6) £ 68 $ 34 $ (10)Economic hedges (c) 48 2 (4) (a) Effects of adverse movements decrease assets or increase liabilities, as applicable, which could result in an asset becoming a liability.
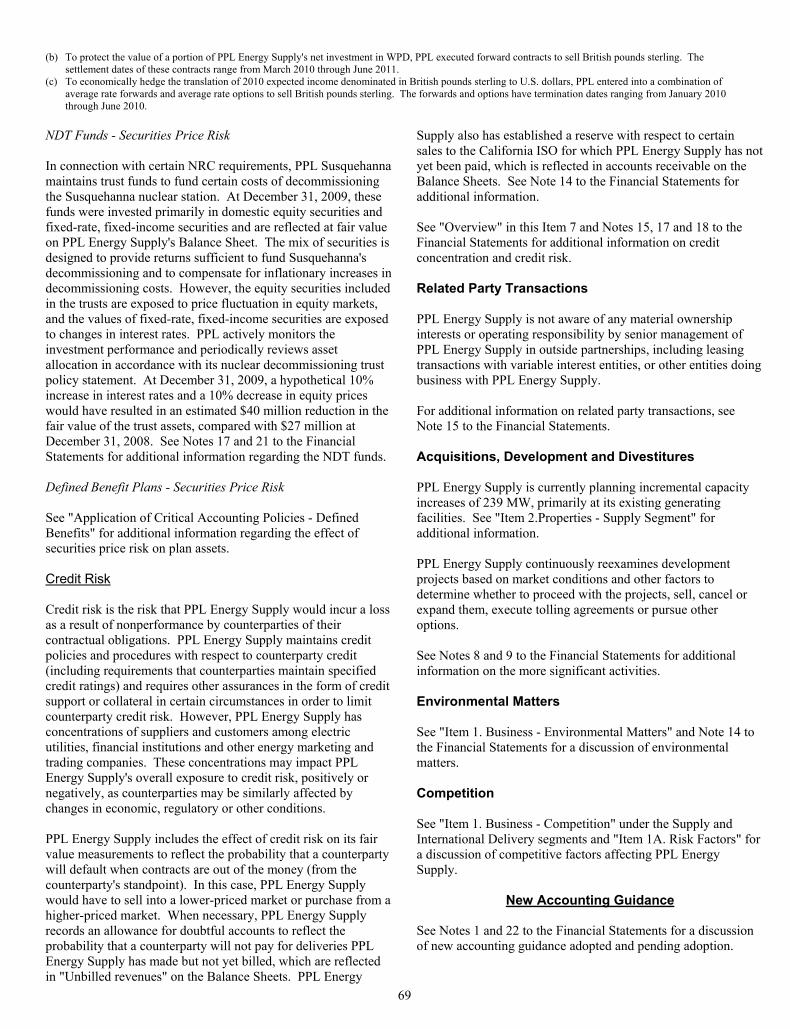
69
(b) To protect the value of a portion of PPL Energy Supply's net investment in WPD, PPL executed forward contracts to sell British pounds sterling. The settlement dates of these contracts range from March 2010 through June 2011.
(c) To economically hedge the translation of 2010 expected income denominated in British pounds sterling to U.S. dollars, PPL entered into a combination of average rate forwards and average rate options to sell British pounds sterling. The forwards and options have termination dates ranging from January 2010 through June 2010.
NDT Funds - Securities Price Risk In connection with certain NRC requirements, PPL Susquehanna maintains trust funds to fund certain costs of decommissioning the Susquehanna nuclear station. At December 31, 2009, these funds were invested primarily in domestic equity securities and fixed-rate, fixed-income securities and are reflected at fair value on PPL Energy Supply's Balance Sheet. The mix of securities is designed to provide returns sufficient to fund Susquehanna's decommissioning and to compensate for inflationary increases in decommissioning costs. However, the equity securities included in the trusts are exposed to price fluctuation in equity markets, and the values of fixed-rate, fixed-income securities are exposed to changes in interest rates. PPL actively monitors the investment performance and periodically reviews asset allocation in accordance with its nuclear decommissioning trust policy statement. At December 31, 2009, a hypothetical 10% increase in interest rates and a 10% decrease in equity prices would have resulted in an estimated $40 million reduction in the fair value of the trust assets, compared with $27 million at December 31, 2008. See Notes 17 and 21 to the Financial Statements for additional information regarding the NDT funds. Defined Benefit Plans - Securities Price Risk See "Application of Critical Accounting Policies - Defined Benefits" for additional information regarding the effect of securities price risk on plan assets. Credit Risk Credit risk is the risk that PPL Energy Supply would incur a loss as a result of nonperformance by counterparties of their contractual obligations. PPL Energy Supply maintains credit policies and procedures with respect to counterparty credit (including requirements that counterparties maintain specified credit ratings) and requires other assurances in the form of credit support or collateral in certain circumstances in order to limit counterparty credit risk. However, PPL Energy Supply has concentrations of suppliers and customers among electric utilities, financial institutions and other energy marketing and trading companies. These concentrations may impact PPL Energy Supply's overall exposure to credit risk, positively or negatively, as counterparties may be similarly affected by changes in economic, regulatory or other conditions. PPL Energy Supply includes the effect of credit risk on its fair value measurements to reflect the probability that a counterparty will default when contracts are out of the money (from the counterparty's standpoint). In this case, PPL Energy Supply would have to sell into a lower-priced market or purchase from a higher-priced market. When necessary, PPL Energy Supply records an allowance for doubtful accounts to reflect the probability that a counterparty will not pay for deliveries PPL Energy Supply has made but not yet billed, which are reflected in "Unbilled revenues" on the Balance Sheets. PPL Energy
Supply also has established a reserve with respect to certain sales to the California ISO for which PPL Energy Supply has not yet been paid, which is reflected in accounts receivable on the Balance Sheets. See Note 14 to the Financial Statements for additional information. See "Overview" in this Item 7 and Notes 15, 17 and 18 to the Financial Statements for additional information on credit concentration and credit risk. Related Party Transactions PPL Energy Supply is not aware of any material ownership interests or operating responsibility by senior management of PPL Energy Supply in outside partnerships, including leasing transactions with variable interest entities, or other entities doing business with PPL Energy Supply. For additional information on related party transactions, see Note 15 to the Financial Statements. Acquisitions, Development and Divestitures PPL Energy Supply is currently planning incremental capacity increases of 239 MW, primarily at its existing generating facilities. See "Item 2.Properties - Supply Segment" for additional information. PPL Energy Supply continuously reexamines development projects based on market conditions and other factors to determine whether to proceed with the projects, sell, cancel or expand them, execute tolling agreements or pursue other options. See Notes 8 and 9 to the Financial Statements for additional information on the more significant activities. Environmental Matters See "Item 1. Business - Environmental Matters" and Note 14 to the Financial Statements for a discussion of environmental matters. Competition See "Item 1. Business - Competition" under the Supply and International Delivery segments and "Item 1A. Risk Factors" for a discussion of competitive factors affecting PPL Energy Supply.
New Accounting Guidance See Notes 1 and 22 to the Financial Statements for a discussion of new accounting guidance adopted and pending adoption.
70
Application of Critical Accounting Policies PPL Energy Supply's financial condition and results of operations are impacted by the methods, assumptions and estimates used in the application of critical accounting policies. The following accounting policies are particularly important to the financial condition or results of operations of PPL Energy Supply, and require estimates or other judgments of matters inherently uncertain. Changes in the estimates or other judgments included within these accounting policies could result in a significant change to the information presented in the Financial Statements (these accounting policies are also discussed in Note 1 to the Financial Statements). PPL's senior management has reviewed these critical accounting policies and the estimates and assumptions regarding them with its Audit Committee. In addition, PPL's senior management has reviewed the following disclosures regarding the application of these critical accounting policies with the Audit Committee. Effective January 1, 2009, PPL Energy Supply fully applied accounting guidance that provides a framework for measuring fair value. The fair value measurement concepts provided by this guidance are used within its financial statements where applicable. See Notes 1 and 17 to the Financial Statements for additional information regarding fair value measurements. 1) Price Risk Management See "Risk Management - Energy Marketing & Trading and Other" above and Note 18 to the Financial Statements. 2) Defined Benefits PPL Energy Supply subsidiaries sponsor various defined benefit pension and other postretirement plans and participate in and are allocated a significant portion of the liability and net periodic defined benefit costs of plans sponsored by PPL Services based on participation in those plans. PPL Energy Supply subsidiaries record an asset or liability to recognize the funded status of all defined benefit plans with an offsetting entry to OCI. Consequently, the funded status of all defined benefit plans is fully recognized on the Balance Sheets. See Note 12 to the Financial Statements for additional information about the plans and the accounting for defined benefits. PPL and PPL Energy Supply make certain assumptions regarding the valuation of benefit obligations and the performance of plan assets. When accounting for defined benefits, delayed recognition in earnings of differences between actual results and expected or estimated results is a guiding principle. Annual net periodic defined benefit costs are recorded in current earnings based on estimated results. Any differences between actual and estimated results are recorded in OCI. These amounts in AOCI are amortized to income over future periods. The delayed recognition allows for a smoothed recognition of costs over the working lives of the employees who benefit under the plans. The primary assumptions are: • Discount Rate - The discount rate is used in calculating the
present value of benefits, which is based on projections of benefit payments to be made in the future. The objective in
selecting the discount rate is to measure the single amount that, if invested at the measurement date in a portfolio of high-quality debt instruments, would provide the necessary future cash flows to pay the accumulated benefits when due.
• Expected Return on Plan Assets - Management projects the
long-term rates of return on plan assets based on historical performance, future expectations and periodic portfolio rebalancing among the diversified asset classes. These projected returns reduce the net benefit costs PPL Energy Supply records currently.
• Rate of Compensation Increase - Management projects
employees' annual pay increases, which are used to project employees' pension benefits at retirement.
• Health Care Cost Trend Rate - Management projects the
expected increases in the cost of health care. In selecting a discount rate for its U.S. defined benefit plans, PPL and PPL Energy Supply start with an analysis of the expected benefit payment stream for its plans. This information is first matched against a spot-rate yield curve. A portfolio of 526 Aa-graded non-callable (or callable with make-whole provisions) bonds, with a total amount outstanding in excess of $541 billion, serves as the base from which those with the lowest and highest yields are eliminated to develop the ultimate yield curve. The results of this analysis are considered together with other economic data and movements in various bond indices to determine the discount rate assumption. At December 31, 2009, PPL and PPL Energy Supply decreased the discount rate for their U.S. pension plans from 6.50% to 6.00% as a result of this assessment. PPL decreased the discount rate for its other postretirement benefit plans from 6.45% to 5.81% and PPL Energy Supply decreased the discount rate for its other postretirement benefit plans from 6.37% to 5.55%. A similar process is used to select the discount rate for the U.K. pension plans, which uses an iBoxx British pounds sterling denominated corporate bond index as its base. At December 31, 2009, PPL and PPL Energy Supply decreased the discount rate for the U.K. pension plans from 7.47% to 5.55% as a result of this assessment. The expected long-term rates of return for PPL and PPL Energy Supply's U.S. defined benefit pension and other postretirement benefit plans have been developed using a best-estimate of expected returns, volatilities and correlations for each asset class. PPL management corroborates these rates with expected long-term rates of return calculated by its independent actuary, who uses a building block approach that begins with a risk-free rate of return with factors being added such as inflation, duration, credit spreads and equity risk. Each plan's specific asset allocation is also considered in developing a reasonable return assumption. At December 31, 2009, PPL's expected return on plan assets remained at 8.00% for its U.S. pension plans and remained at 7.00% for PPL's other postretirement benefit plans. PPL Energy Supply's expected return on plan assets increased from 7.78% to 8.00% as a result of the settlement of the PA Mines, LLC
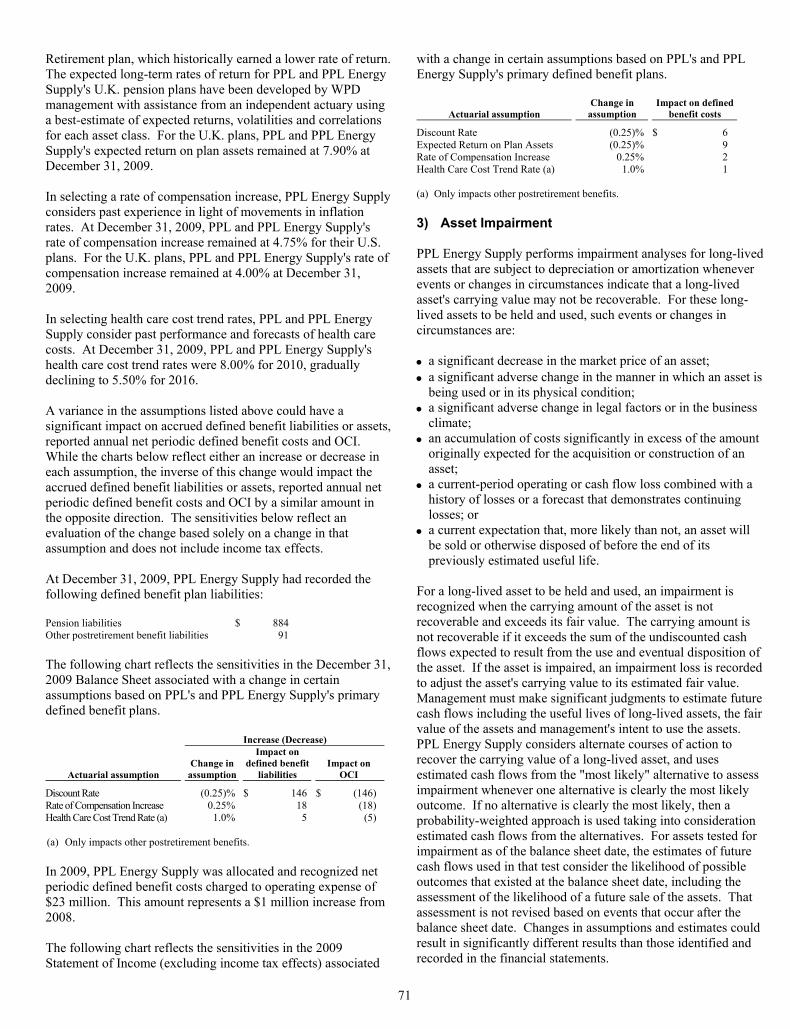
71
Retirement plan, which historically earned a lower rate of return. The expected long-term rates of return for PPL and PPL Energy Supply's U.K. pension plans have been developed by WPD management with assistance from an independent actuary using a best-estimate of expected returns, volatilities and correlations for each asset class. For the U.K. plans, PPL and PPL Energy Supply's expected return on plan assets remained at 7.90% at December 31, 2009. In selecting a rate of compensation increase, PPL Energy Supply considers past experience in light of movements in inflation rates. At December 31, 2009, PPL and PPL Energy Supply's rate of compensation increase remained at 4.75% for their U.S. plans. For the U.K. plans, PPL and PPL Energy Supply's rate of compensation increase remained at 4.00% at December 31, 2009. In selecting health care cost trend rates, PPL and PPL Energy Supply consider past performance and forecasts of health care costs. At December 31, 2009, PPL and PPL Energy Supply's health care cost trend rates were 8.00% for 2010, gradually declining to 5.50% for 2016. A variance in the assumptions listed above could have a significant impact on accrued defined benefit liabilities or assets, reported annual net periodic defined benefit costs and OCI. While the charts below reflect either an increase or decrease in each assumption, the inverse of this change would impact the accrued defined benefit liabilities or assets, reported annual net periodic defined benefit costs and OCI by a similar amount in the opposite direction. The sensitivities below reflect an evaluation of the change based solely on a change in that assumption and does not include income tax effects. At December 31, 2009, PPL Energy Supply had recorded the following defined benefit plan liabilities: Pension liabilities $ 884 Other postretirement benefit liabilities 91 The following chart reflects the sensitivities in the December 31, 2009 Balance Sheet associated with a change in certain assumptions based on PPL's and PPL Energy Supply's primary defined benefit plans.
Increase (Decrease)
Actuarial assumption
Change in
assumption
Impact on defined benefit
liabilities Impact on
OCI
Discount Rate (0.25)% $ 146 $ (146) Rate of Compensation Increase 0.25% 18 (18) Health Care Cost Trend Rate (a) 1.0% 5 (5) (a) Only impacts other postretirement benefits. In 2009, PPL Energy Supply was allocated and recognized net periodic defined benefit costs charged to operating expense of $23 million. This amount represents a $1 million increase from 2008. The following chart reflects the sensitivities in the 2009 Statement of Income (excluding income tax effects) associated
with a change in certain assumptions based on PPL's and PPL Energy Supply's primary defined benefit plans.
Actuarial assumption Change in
assumption Impact on defined
benefit costs
Discount Rate (0.25)% $ 6Expected Return on Plan Assets (0.25)% 9Rate of Compensation Increase 0.25% 2Health Care Cost Trend Rate (a) 1.0% 1 (a) Only impacts other postretirement benefits. 3) Asset Impairment PPL Energy Supply performs impairment analyses for long-lived assets that are subject to depreciation or amortization whenever events or changes in circumstances indicate that a long-lived asset's carrying value may not be recoverable. For these long-lived assets to be held and used, such events or changes in circumstances are: • a significant decrease in the market price of an asset; • a significant adverse change in the manner in which an asset is
being used or in its physical condition; • a significant adverse change in legal factors or in the business
climate; • an accumulation of costs significantly in excess of the amount
originally expected for the acquisition or construction of an asset;
• a current-period operating or cash flow loss combined with a history of losses or a forecast that demonstrates continuing losses; or
• a current expectation that, more likely than not, an asset will be sold or otherwise disposed of before the end of its previously estimated useful life.
For a long-lived asset to be held and used, an impairment is recognized when the carrying amount of the asset is not recoverable and exceeds its fair value. The carrying amount is not recoverable if it exceeds the sum of the undiscounted cash flows expected to result from the use and eventual disposition of the asset. If the asset is impaired, an impairment loss is recorded to adjust the asset's carrying value to its estimated fair value. Management must make significant judgments to estimate future cash flows including the useful lives of long-lived assets, the fair value of the assets and management's intent to use the assets. PPL Energy Supply considers alternate courses of action to recover the carrying value of a long-lived asset, and uses estimated cash flows from the "most likely" alternative to assess impairment whenever one alternative is clearly the most likely outcome. If no alternative is clearly the most likely, then a probability-weighted approach is used taking into consideration estimated cash flows from the alternatives. For assets tested for impairment as of the balance sheet date, the estimates of future cash flows used in that test consider the likelihood of possible outcomes that existed at the balance sheet date, including the assessment of the likelihood of a future sale of the assets. That assessment is not revised based on events that occur after the balance sheet date. Changes in assumptions and estimates could result in significantly different results than those identified and recorded in the financial statements.
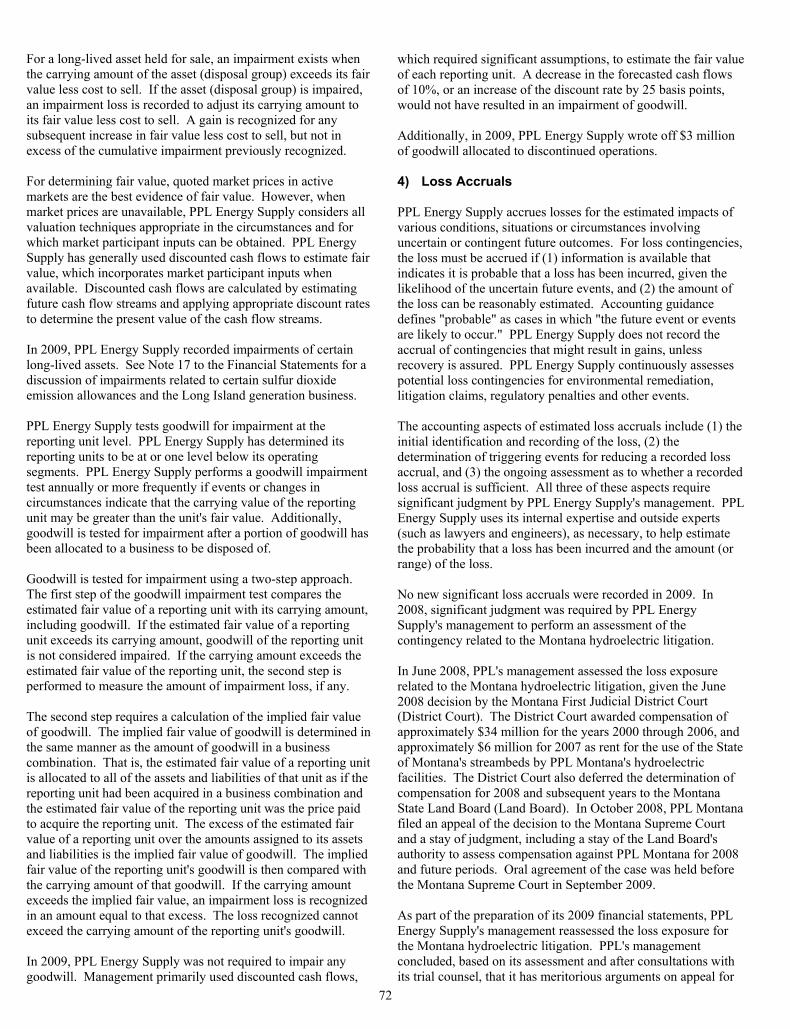
72
For a long-lived asset held for sale, an impairment exists when the carrying amount of the asset (disposal group) exceeds its fair value less cost to sell. If the asset (disposal group) is impaired, an impairment loss is recorded to adjust its carrying amount to its fair value less cost to sell. A gain is recognized for any subsequent increase in fair value less cost to sell, but not in excess of the cumulative impairment previously recognized. For determining fair value, quoted market prices in active markets are the best evidence of fair value. However, when market prices are unavailable, PPL Energy Supply considers all valuation techniques appropriate in the circumstances and for which market participant inputs can be obtained. PPL Energy Supply has generally used discounted cash flows to estimate fair value, which incorporates market participant inputs when available. Discounted cash flows are calculated by estimating future cash flow streams and applying appropriate discount rates to determine the present value of the cash flow streams. In 2009, PPL Energy Supply recorded impairments of certain long-lived assets. See Note 17 to the Financial Statements for a discussion of impairments related to certain sulfur dioxide emission allowances and the Long Island generation business. PPL Energy Supply tests goodwill for impairment at the reporting unit level. PPL Energy Supply has determined its reporting units to be at or one level below its operating segments. PPL Energy Supply performs a goodwill impairment test annually or more frequently if events or changes in circumstances indicate that the carrying value of the reporting unit may be greater than the unit's fair value. Additionally, goodwill is tested for impairment after a portion of goodwill has been allocated to a business to be disposed of. Goodwill is tested for impairment using a two-step approach. The first step of the goodwill impairment test compares the estimated fair value of a reporting unit with its carrying amount, including goodwill. If the estimated fair value of a reporting unit exceeds its carrying amount, goodwill of the reporting unit is not considered impaired. If the carrying amount exceeds the estimated fair value of the reporting unit, the second step is performed to measure the amount of impairment loss, if any. The second step requires a calculation of the implied fair value of goodwill. The implied fair value of goodwill is determined in the same manner as the amount of goodwill in a business combination. That is, the estimated fair value of a reporting unit is allocated to all of the assets and liabilities of that unit as if the reporting unit had been acquired in a business combination and the estimated fair value of the reporting unit was the price paid to acquire the reporting unit. The excess of the estimated fair value of a reporting unit over the amounts assigned to its assets and liabilities is the implied fair value of goodwill. The implied fair value of the reporting unit's goodwill is then compared with the carrying amount of that goodwill. If the carrying amount exceeds the implied fair value, an impairment loss is recognized in an amount equal to that excess. The loss recognized cannot exceed the carrying amount of the reporting unit's goodwill. In 2009, PPL Energy Supply was not required to impair any goodwill. Management primarily used discounted cash flows,
which required significant assumptions, to estimate the fair value of each reporting unit. A decrease in the forecasted cash flows of 10%, or an increase of the discount rate by 25 basis points, would not have resulted in an impairment of goodwill. Additionally, in 2009, PPL Energy Supply wrote off $3 million of goodwill allocated to discontinued operations. 4) Loss Accruals PPL Energy Supply accrues losses for the estimated impacts of various conditions, situations or circumstances involving uncertain or contingent future outcomes. For loss contingencies, the loss must be accrued if (1) information is available that indicates it is probable that a loss has been incurred, given the likelihood of the uncertain future events, and (2) the amount of the loss can be reasonably estimated. Accounting guidance defines "probable" as cases in which "the future event or events are likely to occur." PPL Energy Supply does not record the accrual of contingencies that might result in gains, unless recovery is assured. PPL Energy Supply continuously assesses potential loss contingencies for environmental remediation, litigation claims, regulatory penalties and other events. The accounting aspects of estimated loss accruals include (1) the initial identification and recording of the loss, (2) the determination of triggering events for reducing a recorded loss accrual, and (3) the ongoing assessment as to whether a recorded loss accrual is sufficient. All three of these aspects require significant judgment by PPL Energy Supply's management. PPL Energy Supply uses its internal expertise and outside experts (such as lawyers and engineers), as necessary, to help estimate the probability that a loss has been incurred and the amount (or range) of the loss. No new significant loss accruals were recorded in 2009. In 2008, significant judgment was required by PPL Energy Supply's management to perform an assessment of the contingency related to the Montana hydroelectric litigation. In June 2008, PPL's management assessed the loss exposure related to the Montana hydroelectric litigation, given the June 2008 decision by the Montana First Judicial District Court (District Court). The District Court awarded compensation of approximately $34 million for the years 2000 through 2006, and approximately $6 million for 2007 as rent for the use of the State of Montana's streambeds by PPL Montana's hydroelectric facilities. The District Court also deferred the determination of compensation for 2008 and subsequent years to the Montana State Land Board (Land Board). In October 2008, PPL Montana filed an appeal of the decision to the Montana Supreme Court and a stay of judgment, including a stay of the Land Board's authority to assess compensation against PPL Montana for 2008 and future periods. Oral agreement of the case was held before the Montana Supreme Court in September 2009. As part of the preparation of its 2009 financial statements, PPL Energy Supply's management reassessed the loss exposure for the Montana hydroelectric litigation. PPL's management concluded, based on its assessment and after consultations with its trial counsel, that it has meritorious arguments on appeal for
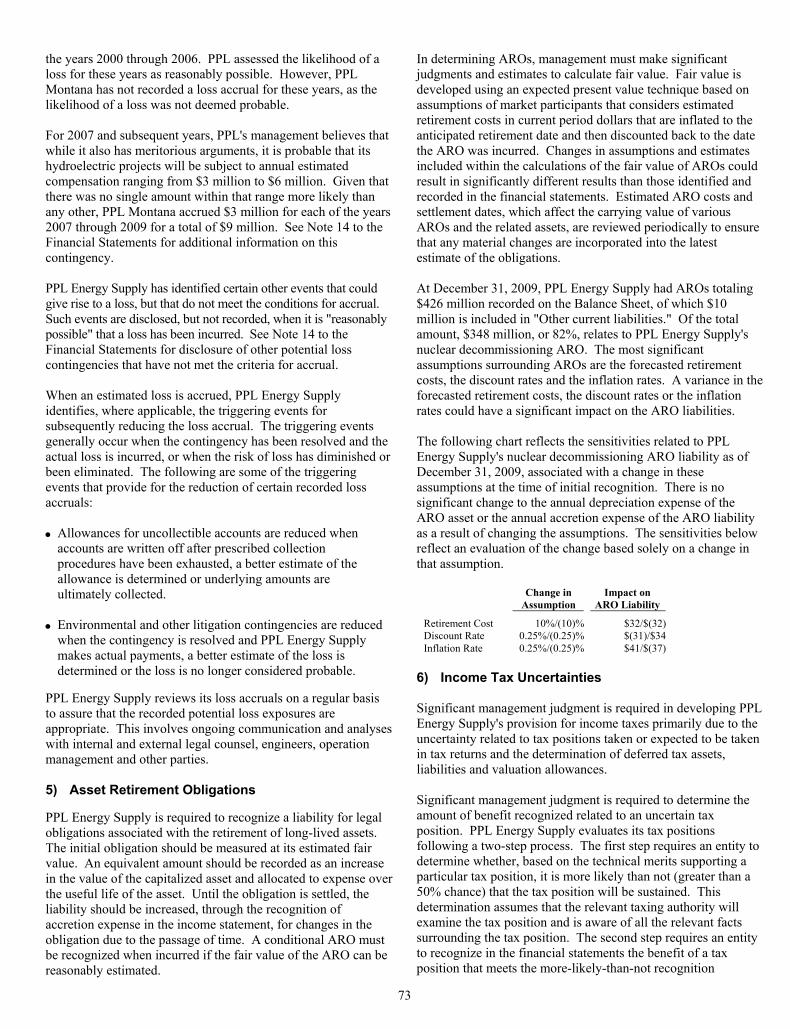
73
the years 2000 through 2006. PPL assessed the likelihood of a loss for these years as reasonably possible. However, PPL Montana has not recorded a loss accrual for these years, as the likelihood of a loss was not deemed probable. For 2007 and subsequent years, PPL's management believes that while it also has meritorious arguments, it is probable that its hydroelectric projects will be subject to annual estimated compensation ranging from $3 million to $6 million. Given that there was no single amount within that range more likely than any other, PPL Montana accrued $3 million for each of the years 2007 through 2009 for a total of $9 million. See Note 14 to the Financial Statements for additional information on this contingency. PPL Energy Supply has identified certain other events that could give rise to a loss, but that do not meet the conditions for accrual. Such events are disclosed, but not recorded, when it is "reasonably possible" that a loss has been incurred. See Note 14 to the Financial Statements for disclosure of other potential loss contingencies that have not met the criteria for accrual. When an estimated loss is accrued, PPL Energy Supply identifies, where applicable, the triggering events for subsequently reducing the loss accrual. The triggering events generally occur when the contingency has been resolved and the actual loss is incurred, or when the risk of loss has diminished or been eliminated. The following are some of the triggering events that provide for the reduction of certain recorded loss accruals: • Allowances for uncollectible accounts are reduced when
accounts are written off after prescribed collection procedures have been exhausted, a better estimate of the allowance is determined or underlying amounts are ultimately collected.
• Environmental and other litigation contingencies are reduced
when the contingency is resolved and PPL Energy Supply makes actual payments, a better estimate of the loss is determined or the loss is no longer considered probable.
PPL Energy Supply reviews its loss accruals on a regular basis to assure that the recorded potential loss exposures are appropriate. This involves ongoing communication and analyses with internal and external legal counsel, engineers, operation management and other parties. 5) Asset Retirement Obligations PPL Energy Supply is required to recognize a liability for legal obligations associated with the retirement of long-lived assets. The initial obligation should be measured at its estimated fair value. An equivalent amount should be recorded as an increase in the value of the capitalized asset and allocated to expense over the useful life of the asset. Until the obligation is settled, the liability should be increased, through the recognition of accretion expense in the income statement, for changes in the obligation due to the passage of time. A conditional ARO must be recognized when incurred if the fair value of the ARO can be reasonably estimated.
In determining AROs, management must make significant judgments and estimates to calculate fair value. Fair value is developed using an expected present value technique based on assumptions of market participants that considers estimated retirement costs in current period dollars that are inflated to the anticipated retirement date and then discounted back to the date the ARO was incurred. Changes in assumptions and estimates included within the calculations of the fair value of AROs could result in significantly different results than those identified and recorded in the financial statements. Estimated ARO costs and settlement dates, which affect the carrying value of various AROs and the related assets, are reviewed periodically to ensure that any material changes are incorporated into the latest estimate of the obligations. At December 31, 2009, PPL Energy Supply had AROs totaling $426 million recorded on the Balance Sheet, of which $10 million is included in "Other current liabilities." Of the total amount, $348 million, or 82%, relates to PPL Energy Supply's nuclear decommissioning ARO. The most significant assumptions surrounding AROs are the forecasted retirement costs, the discount rates and the inflation rates. A variance in the forecasted retirement costs, the discount rates or the inflation rates could have a significant impact on the ARO liabilities. The following chart reflects the sensitivities related to PPL Energy Supply's nuclear decommissioning ARO liability as of December 31, 2009, associated with a change in these assumptions at the time of initial recognition. There is no significant change to the annual depreciation expense of the ARO asset or the annual accretion expense of the ARO liability as a result of changing the assumptions. The sensitivities below reflect an evaluation of the change based solely on a change in that assumption.
Change in
Assumption Impact on
ARO Liability
Retirement Cost 10%/(10)% $32/$(32)Discount Rate 0.25%/(0.25)% $(31)/$34Inflation Rate 0.25%/(0.25)% $41/$(37)
6) Income Tax Uncertainties Significant management judgment is required in developing PPL Energy Supply's provision for income taxes primarily due to the uncertainty related to tax positions taken or expected to be taken in tax returns and the determination of deferred tax assets, liabilities and valuation allowances. Significant management judgment is required to determine the amount of benefit recognized related to an uncertain tax position. PPL Energy Supply evaluates its tax positions following a two-step process. The first step requires an entity to determine whether, based on the technical merits supporting a particular tax position, it is more likely than not (greater than a 50% chance) that the tax position will be sustained. This determination assumes that the relevant taxing authority will examine the tax position and is aware of all the relevant facts surrounding the tax position. The second step requires an entity to recognize in the financial statements the benefit of a tax position that meets the more-likely-than-not recognition

74
criterion. The benefit recognized is measured at the largest amount of benefit that has a likelihood of realization, upon settlement, that exceeds 50%. PPL Energy Supply's management considers a number of factors in assessing the benefit to be recognized, including negotiation of a settlement. On a quarterly basis, PPL Energy Supply reassesses its uncertain tax positions by considering information known at the reporting date. Based on management's assessment of new information, PPL Energy Supply may subsequently recognize a tax benefit for a previously unrecognized tax position, de-recognize a previously recognized tax position, or re-measure the benefit of a previously recognized tax position. The amounts ultimately paid upon resolution of issues raised by taxing authorities may differ materially from the amounts accrued and may materially impact PPL Energy Supply's financial statements in the future. The balance sheet classification of unrecognized tax benefits and the need for valuation allowances to reduce deferred tax assets also require significant management judgment. PPL Energy Supply classifies unrecognized tax benefits as current, to the extent management expects to settle an uncertain tax position, by payment or receipt of cash, within one year of the reporting date. Valuation allowances are initially recorded and reevaluated each reporting period by assessing the likelihood of the ultimate realization of a deferred tax asset. Management considers a number of factors in assessing the realization of a deferred tax asset, including the reversal of temporary differences, future taxable income and ongoing prudent and feasible tax planning strategies. Any tax planning strategy utilized in this assessment must meet the recognition and measurement criteria utilized by PPL Energy Supply to account for an uncertain tax positions. See Note 5 to the Financial Statements for the required disclosures.
At December 31, 2009, it was reasonably possible that during the next 12 months the total amount of unrecognized tax benefits could increase by as much as $11 million or decrease by up to $123 million for PPL Energy Supply. This change could result from subsequent recognition, derecognition and/or changes in the measurement of uncertain tax positions related to the creditability of foreign taxes, the timing and utilization of foreign tax credits and the related impact on alternative minimum tax and other credits, the timing and/or valuation of certain deductions, intercompany transactions and unitary filing groups. The events that could cause these changes are direct settlements with taxing authorities, litigation, legal or administrative guidance by relevant taxing authorities and the lapse of an applicable statute of limitation.
Other Information PPL's Audit Committee has approved the independent auditor to provide audit and audit-related services and other services permitted by Sarbanes-Oxley and SEC rules. The audit and audit-related services include services in connection with statutory and regulatory filings, reviews of offering documents and registration statements, and internal control reviews. See "Item 14. Principal Accounting Fees and Services" for more information.
75
PPL ELECTRIC UTILITIES CORPORATION AND SUBSIDIARIES
Item 7. Management's Discussion and Analysis of Financial Condition and Results of Operations
Overview PPL Electric is an electricity delivery service provider in eastern and central Pennsylvania with headquarters in Allentown, Pennsylvania. Refer to "Item 1. Business - Background" for a description of its business. PPL Electric's strategy and principal challenge is to own and operate its electricity delivery business at the most efficient cost while maintaining high quality customer service and reliability. PPL Electric's electricity delivery business is rate-regulated. Accordingly, this business is subject to regulatory risk with respect to costs that may be recovered and investment returns that may be collected through customer rates. See "Customer Choice - End of Transition Period" below for information on additional risks PPL Electric may face. In order to manage financing costs and access to credit markets, a key objective for PPL Electric's business as a whole is to maintain a strong credit profile. PPL Electric continually focuses on maintaining an appropriate capital structure and liquidity position. See "Item 1A. Risk Factors" for more information concerning these and other material risks PPL Electric faces in its business. The purpose of "Management's Discussion and Analysis of Financial Condition and Results of Operations" is to provide information concerning PPL Electric's performance in implementing the strategies and managing the risks and challenges mentioned above. Specifically: • "Results of Operations" provides an overview of PPL
Electric's operating results in 2009, 2008 and 2007, including a review of earnings. It also provides a brief outlook for 2010.
• "Financial Condition - Liquidity and Capital Resources"
provides an analysis of PPL Electric's liquidity position and credit profile, including its sources of cash (including bank credit facilities and sources of operating cash flow) and uses of cash (including contractual obligations and capital expenditure requirements) and the key risks and uncertainties that impact PPL Electric's past and future liquidity position and financial condition. This subsection also includes a listing and discussion of PPL Electric's current credit ratings.
• "Financial Condition - Risk Management" provides an
explanation of PPL Electric's risk management programs relating to market risk and credit risk.
• "Application of Critical Accounting Policies" provides an
overview of the accounting policies that are particularly important to the results of operations and financial condition of PPL Electric and that require its management to make significant estimates, assumptions and other judgments.
The information provided in this Item 7 should be read in conjunction with PPL Electric's Consolidated Financial Statements and the accompanying Notes. Terms and abbreviations are explained in the glossary. Dollars are in millions unless otherwise noted. Customer Choice – End of Transition Period In 1996, the Customer Choice Act was enacted to restructure Pennsylvania's electric utility industry in order to create retail access to a competitive market for generation of electricity. The Customer Choice Act required each Pennsylvania electric utility, including PPL Electric, to file a restructuring plan to "unbundle" its rates into separate generation, transmission and distribution components and to permit its customers to directly access alternate suppliers of electricity. Under the Customer Choice Act, PPL Electric was required to act as a PLR. As part of a settlement approved by the PUC and in connection with the restructuring plan PPL Electric filed under the Customer Choice Act, PPL Electric agreed to provide electricity as a PLR at predetermined "capped" rates through 2009. In addition, the PUC authorized recovery of approximately $2.97 billion of competitive transition or "stranded" costs (generation-related costs that might not otherwise be recovered in a competitive market) from customers during an 11-year transition period. For PPL Electric, this transition period ended on December 31, 2009. As a result of the PUC settlement order and the PLR obligation, PPL Electric, through 2009, generally bore the risk that it would not be able to obtain adequate energy supply at the "capped" rates it could charge to its customers who did not select an alternate electricity supplier. To mitigate this risk, PPL Electric entered into full requirements energy supply agreements with PPL EnergyPlus, a PPL Electric affiliate. Under these agreements, through 2009, PPL EnergyPlus supplied PPL Electric's entire PLR load at predetermined prices equal to the capped generation rates that PPL Electric was authorized to charge its customers. Related to PPL Electric's transition period, the following has occurred or will occur: • In August 1999, CTC of $2.4 billion were converted to
intangible transition costs when they were securitized by the issuance of transition bonds. The intangible transition costs were amortized over the life of the transition bonds, through December 2008, in accordance with an amortization schedule filed with the PUC. These transition bonds matured in tranches, with the final tranche being repaid in December 2008.
• During the transition period, PPL Electric was authorized by
the PUC to bill its customers $130 million for a portion of the costs associated with decommissioning of PPL's Susquehanna nuclear plant. Under the power supply
76
agreements between PPL Electric and PPL EnergyPlus, these revenues were passed on to PPL EnergyPlus. Similarly, these revenues were passed on to PPL Susquehanna under a power supply agreement between PPL EnergyPlus and PPL Susquehanna and invested in the NDT funds. Effective January 1, 2010, these ratepayer billings have ceased.
• In December 2009, PPL Electric filed with the PUC a final
reconciliation of CTC and ITC recoveries during the transition period. At December 31, 2009, PPL Electric has recorded a net regulatory liability of $33 million related to these recoveries. The net overcollection will be reflected in customer rates in 2010.
• At December 31, 2009, PPL Electric's long-term power
purchase agreements with PPL EnergyPlus (effective since 2000 and 2002) expired.
• To mitigate 2010 rate increases, PPL Electric implemented
two programs in 2008 and 2009 that allowed customers to make prepayments toward their 2010 and 2011 electric bills or to defer any 2010 electric bill increases exceeding 25%. Any deferred amounts are to be repaid by 2012. At December 31, 2009, PPL Electric has recorded a liability of $36 million for these programs.
• Effective January 1, 2010, PPL Electric's rates for generation
supply as a PLR are no longer capped and the cost of electric generation is based on a competitive solicitation process. During 2007 through 2009, PPL Electric procured through PUC-approved solicitation procedures, the electric generation supply it will need in 2010 for customers who do not choose an alternative supplier. The prices in these contracts will result in an average residential customer paying approximately 30% higher rates, as compared to the previously-capped rates on delivered electricity. PPL Electric is currently procuring the PLR supply it will need for the January 2011 through May 2013 period. The results of all procurements continue to require the approval of the PUC.
• For those customers who choose to procure generation
supply from alternative providers, PPL Electric will provide services for these alternative generation suppliers to bill usage charges, among other duties. As required by a PUC-approved plan, PPL Electric will be purchasing certain receivables from alternative suppliers at a discount.
In October 2008, Act 129 became effective. This law created requirements for energy efficiency and conservation programs and for the use of smart metering technology, imposed new PLR electricity supply procurement rules, provided remedies for market misconduct, and made changes to the existing Alternative Energy Portfolio Standard. Prior to the expiration of the generation rate caps, customers' interest in purchasing generation supply from other providers was limited because in recent years, the long-term supply agreement between PPL Electric and PPL EnergyPlus provided a below-market cost of generation supply for these customers. As a result, a limited amount of "shopping" occurred. In 2010, several alternative suppliers have offered to provide generation
supply in PPL Electric's service territory. When its customers purchase supply from these alternative suppliers or from PPL Electric as PLR, the purchase of such supply has no significant impact on the operating results of PPL Electric. The cost to purchase PLR supply is passed directly by PPL Electric to its customers without markup. For those customers who receive their supply from an alternative supplier, PPL Electric may act as billing agent or the alternative supplier may bill for their supply directly, and in either case, PPL Electric does not record revenues or expenses related to this supply. PPL Electric remains the distribution provider for all the customers in its service territory and charges a regulated rate for the service of delivering that electricity. Lower demand for electric power due to increased prices, the economic downturn or the conservation provisions of Act 129 that require PPL Electric to reduce its customers' electricity usage in future periods, could impact future revenues. The reduction in volume could be offset by changes in customer rates for this service, subject to PUC approval, depending on PPL Electric's cost structure. Act 129 includes one-time penalties of up to $20 million for not attaining the required reductions by 2011 and 2013. At this time, PPL Electric expects to meet these targeted reductions. The costs of complying with the other provisions of Act 129 would, subject to PUC approval, be recoverable through an automatic adjustment clause. None of the above changes are expected to have a significant impact on PPL Electric's 2010 financial condition, operating results or cash flows. The final expiration of generation rate caps in Pennsylvania, applicable to three other large regulated utilities, is scheduled to occur at the end of 2010. Discussions concerning generation rate caps and rate increase mitigation are continuing. The final result of those discussions and the future impact on the financial condition and future cash flows of PPL Electric cannot be predicted at this time. See Note 14 to the Financial Statements for additional information on Pennsylvania legislative and other regulatory activities. Market Events In 2008, conditions in the financial markets became disruptive to the processes of managing credit risk, responding to liquidity needs, measuring financial instruments at fair value, and managing market price risk. Bank credit capacity was reduced and the cost of renewing or establishing new credit facilities increased, thereby introducing uncertainties as to PPL Electric's ability to reliably estimate the longer-term cost and availability of credit. In general, bank credit capacity has increased from the significantly constrained levels of 2008 and early 2009. In addition, the cost of renewing or establishing new credit facilities has improved when compared with the 2008 and early 2009 periods. Credit Risk Credit risk is the risk that PPL Electric would incur a loss as a result of nonperformance by counterparties of their contractual
77
obligations. PPL Electric maintains credit policies and procedures to limit counterparty credit risk. Conditions in the financial and commodity markets have generally increased PPL Electric's exposure to credit risk. See Notes 15, 17 and 18 to the Financial Statements, and "Risk Management - Credit Risk" for more information on credit risk. Liquidity Risk PPL Electric expects to continue to have access to adequate sources of liquidity through operating cash flows, cash and cash equivalents, credit facilities and, from time to time, the issuance of capital market securities. PPL Electric's ability to access capital markets may be impacted by conditions in the overall financial and capital markets, as well as conditions specific to the utility sector. See "Financial Condition - Liquidity and Capital Resources" for an expanded discussion of PPL Electric's liquidity position and a discussion of its forecasted sources of cash. Securities Price Risk PPL Electric participates in and is allocated costs from defined benefit plans sponsored by PPL. Declines in the market price of debt and equity securities result in unrealized losses that reduce the asset values of PPL's defined benefit plans. PPL's defined benefit plans earned positive returns in the second half of 2009, thereby recovering a portion of the negative returns incurred in 2008 and the first quarter of 2009. Determination of the funded status of defined benefit plans, contribution requirements and net periodic defined benefit costs for future years are subject to changes in various assumptions, in addition to the actual performance of the assets in the plans. See "Application of Critical Accounting Policies - Defined Benefits" for a discussion of the assumptions and sensitivities regarding those assumptions. The Economic Stimulus Package The Economic Stimulus Package was intended to stimulate the U.S. economy through federal tax relief, expansion of unemployment benefits and other social stimulus provisions, domestic spending for education, health care and infrastructure, including the energy sector. A portion of the benefits included in the Economic Stimulus Package are offered in the form of loan fee reductions, expanded loan guarantees and secondary market incentives. Funds from the Economic Stimulus Package have been allocated to various federal agencies, such as the DOE, and provided to state agencies through block grants. The DOE has made awards of the funds for smart grid and efficiency-related programs. In addition, in July 2009, PPL Electric proposed to the DOE that the agency provide funding for one-half of a $38 million smart grid project. The project would use smart grid technology to strengthen reliability, save energy and improve electric service for 60,000 Harrisburg, Pennsylvania area customers. It would also provide benefits beyond the Harrisburg region, helping to speed power restoration across PPL Electric's 29-county service territory. In October 2009, PPL Electric received notification
that its grant proposal had been selected by the DOE for award negotiations. PPL Electric cannot predict the outcome of these award negotiations.
Results of Operations Earnings Income available to PPL was: 2009 2008 2007
$ 124 $ 158 $ 145 The changes in income available to PPL from year to year were, in part, attributable to several special items that management considers significant. Details of these special items are provided below. The after-tax changes in income available to PPL between these periods were due to the following factors. 2009 vs. 2008 2008 vs. 2007
Delivery revenues (net of CTC/ITC amortization, interest expense on transition bonds and ancillary charges) $ (16) $ 32
Other operation and maintenance 3 (8)Other income - net (a) (2) (10)Interest expense (12) 1Other 2 (3)Special items (9) 1 $ (34) $ 13
(a) Includes interest income from affiliate. • Delivery revenues decreased in 2009 compared with 2008,
primarily due to unfavorable economic conditions, including industrial customers scaling back on production and the unfavorable impact of weather on sales volumes. See "Revenue Recognition" in Note 1 to the Financial Statements for information on a true-up of FERC formula-based transmission revenues. Delivery revenues increased in 2008 compared with 2007, primarily due to a base rate increase effective January 1, 2008 and normal load growth.
• Other operation and maintenance expenses increased in 2008
compared with 2007, primarily due to insurance recovery of storm costs in 2007, higher vegetation management costs and higher regulatory asset amortization.
• Other income - net decreased in 2008 compared with 2007,
primarily due to a decrease in interest income from affiliate resulting from a decrease in the average balance outstanding on a note receivable from an affiliate and a lower average floating interest rate.
• Interest expense increased in 2009 compared with 2008,
primarily due to $400 million of debt issuances in October 2008 that prefunded a portion of August 2009 debt maturities.
78
The following after-tax amounts, which management considers special items, also impacted earnings. 2009 2008 2007
Impairments $ (1 ) Workforce reduction (a) (5 ) $ (1)Other
Change in tax accounting method related to repairs (Note 5) (3 )
Total $ (9 ) $ (1)
(a) See Note 12 to the Financial Statements for additional information related to
the 2009 workforce reduction. PPL Electric's earnings beyond 2009 are subject to various risks and uncertainties. See "Forward-Looking Information," "Item 1A. Risk Factors," the rest of this Item 7 and Note 14 to the Financial Statements for a discussion of the risks, uncertainties and factors that may impact PPL Electric's future earnings. 2010 Outlook Excluding special items, PPL Electric projects lower earnings in 2010 compared with 2009, as a net result of lower distribution revenues, primarily due to continued slow economic growth and weak customer demand; higher operation and maintenance expenses; offset by lower financing costs. In late March 2010, PPL Electric expects to file a request with the PUC seeking an increase in its distribution rates beginning in January 2011. See Note 14 to the Financial Statements for a discussion of items that could impact future earnings, including Pennsylvania legislative and other regulatory activities. Statement of Income Analysis -- Operating Revenues Retail Electric The changes in revenues from retail electric operations were attributable to: 2009 vs. 2008 2008 vs. 2007
Delivery $ (60) $ 17PLR (20) 19Other 9 3 $ (71) $ 39
The decrease in retail electric revenues for 2009 compared with 2008 was attributable to unfavorable economic conditions, including industrial customers scaling back on production. In addition, weather had an unfavorable impact on sales volumes. These decreases were partially offset by favorable price increases. See "Revenue Recognition" in Note 1 to the Financial Statements for information on a true-up of FERC formula-based transmission revenues.
The increase in PLR revenue for 2008 compared with 2007 was attributable to normal load growth, as well as a favorable price increase. The increase in delivery revenue for the same period was primarily due to a base rate increase effective January 1, 2008, and normal load growth. These increases were partially offset by the unfavorable impact of weather on residential and commercial sales in 2008. Wholesale Electric to Affiliate PPL Electric has a contract to sell to PPL EnergyPlus the electricity that PPL Electric purchases under contracts with NUGs. The decrease of $38 million in wholesale electric to affiliate in 2009 compared with 2008 was primarily due to the expiration of NUG contracts in 2008 and 2009. The final NUG contract will expire in 2014. The decrease of $48 million in wholesale electric to affiliate in 2008 compared with 2007 was primarily due to the expiration of a NUG contract at the end of 2007 and the expiration of two NUG contracts during 2008. The decrease was partially offset by higher prices on certain NUG contracts. Energy Purchases Energy purchases decreased by $49 million for 2009 compared with 2008, primarily due to the expiration of NUG contracts in 2008 and 2009, as well as lower ancillary charges, which are primarily the result of lower pricing. The final NUG contract will expire in 2014. Energy purchases decreased by $43 million for 2008 compared with 2007, primarily due to the expiration of a NUG contract at the end of 2007 and two NUG contracts in 2008, partially offset by higher prices on certain NUG contracts. Energy Purchases from Affiliate Energy purchases from affiliate decreased by $20 million in 2009 compared with 2008. The decrease was attributable to unfavorable weather and the impact of economic conditions, primarily on industrial customers' load, partially offset by higher prices for energy purchased under the power supply contracts with PPL EnergyPlus that support the PLR load. Energy purchases from affiliate increased by $16 million in 2008 compared with 2007. The increase was primarily due to higher prices for energy purchased under the power supply contracts with PPL EnergyPlus that support the PLR load, as well as higher PLR load. Other Operation and Maintenance The increases in other operation and maintenance expense were due to:
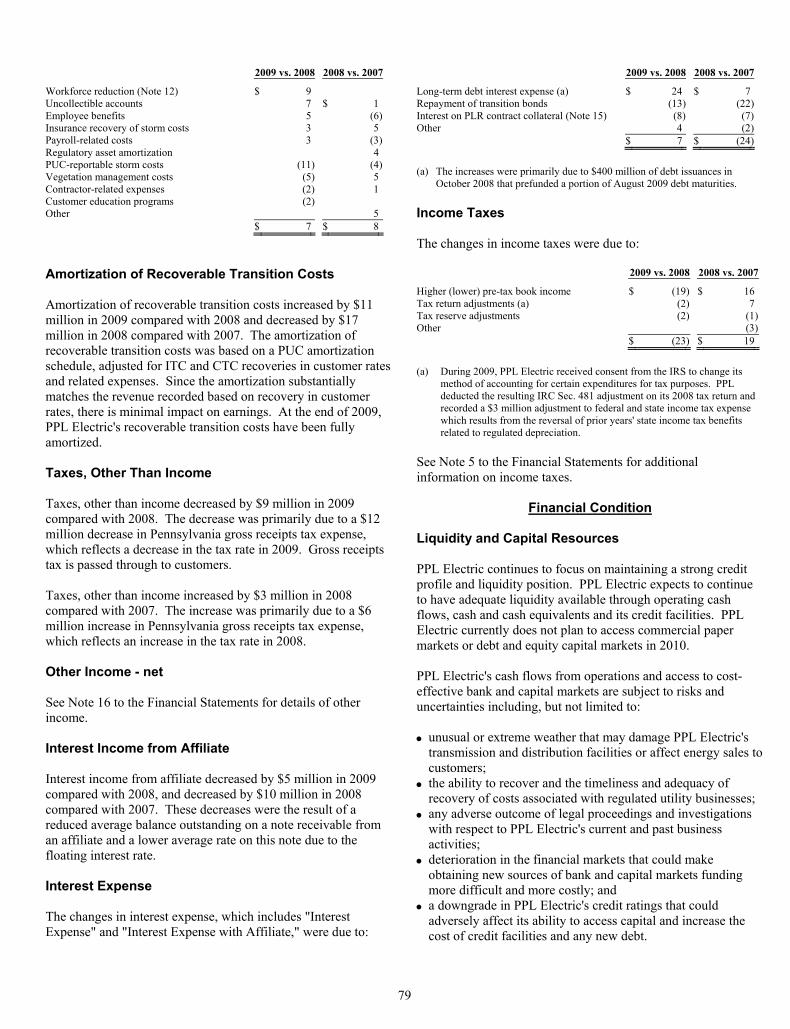
79
2009 vs. 2008 2008 vs. 2007
Workforce reduction (Note 12) $ 9 Uncollectible accounts 7 $ 1Employee benefits 5 (6)Insurance recovery of storm costs 3 5Payroll-related costs 3 (3)Regulatory asset amortization 4PUC-reportable storm costs (11) (4)Vegetation management costs (5) 5Contractor-related expenses (2) 1Customer education programs (2) Other 5 $ 7 $ 8
Amortization of Recoverable Transition Costs Amortization of recoverable transition costs increased by $11 million in 2009 compared with 2008 and decreased by $17 million in 2008 compared with 2007. The amortization of recoverable transition costs was based on a PUC amortization schedule, adjusted for ITC and CTC recoveries in customer rates and related expenses. Since the amortization substantially matches the revenue recorded based on recovery in customer rates, there is minimal impact on earnings. At the end of 2009, PPL Electric's recoverable transition costs have been fully amortized. Taxes, Other Than Income Taxes, other than income decreased by $9 million in 2009 compared with 2008. The decrease was primarily due to a $12 million decrease in Pennsylvania gross receipts tax expense, which reflects a decrease in the tax rate in 2009. Gross receipts tax is passed through to customers. Taxes, other than income increased by $3 million in 2008 compared with 2007. The increase was primarily due to a $6 million increase in Pennsylvania gross receipts tax expense, which reflects an increase in the tax rate in 2008. Other Income - net See Note 16 to the Financial Statements for details of other income. Interest Income from Affiliate Interest income from affiliate decreased by $5 million in 2009 compared with 2008, and decreased by $10 million in 2008 compared with 2007. These decreases were the result of a reduced average balance outstanding on a note receivable from an affiliate and a lower average rate on this note due to the floating interest rate. Interest Expense The changes in interest expense, which includes "Interest Expense" and "Interest Expense with Affiliate," were due to:
2009 vs. 2008 2008 vs. 2007
Long-term debt interest expense (a) $ 24 $ 7Repayment of transition bonds (13) (22)Interest on PLR contract collateral (Note 15) (8) (7)Other 4 (2) $ 7 $ (24)
(a) The increases were primarily due to $400 million of debt issuances in
October 2008 that prefunded a portion of August 2009 debt maturities. Income Taxes The changes in income taxes were due to: 2009 vs. 2008 2008 vs. 2007
Higher (lower) pre-tax book income $ (19) $ 16Tax return adjustments (a) (2) 7Tax reserve adjustments (2) (1)Other (3) $ (23) $ 19
(a) During 2009, PPL Electric received consent from the IRS to change its
method of accounting for certain expenditures for tax purposes. PPL deducted the resulting IRC Sec. 481 adjustment on its 2008 tax return and recorded a $3 million adjustment to federal and state income tax expense which results from the reversal of prior years' state income tax benefits related to regulated depreciation.
See Note 5 to the Financial Statements for additional information on income taxes.
Financial Condition Liquidity and Capital Resources PPL Electric continues to focus on maintaining a strong credit profile and liquidity position. PPL Electric expects to continue to have adequate liquidity available through operating cash flows, cash and cash equivalents and its credit facilities. PPL Electric currently does not plan to access commercial paper markets or debt and equity capital markets in 2010. PPL Electric's cash flows from operations and access to cost-effective bank and capital markets are subject to risks and uncertainties including, but not limited to: • unusual or extreme weather that may damage PPL Electric's
transmission and distribution facilities or affect energy sales to customers;
• the ability to recover and the timeliness and adequacy of recovery of costs associated with regulated utility businesses;
• any adverse outcome of legal proceedings and investigations with respect to PPL Electric's current and past business activities;
• deterioration in the financial markets that could make obtaining new sources of bank and capital markets funding more difficult and more costly; and
• a downgrade in PPL Electric's credit ratings that could adversely affect its ability to access capital and increase the cost of credit facilities and any new debt.
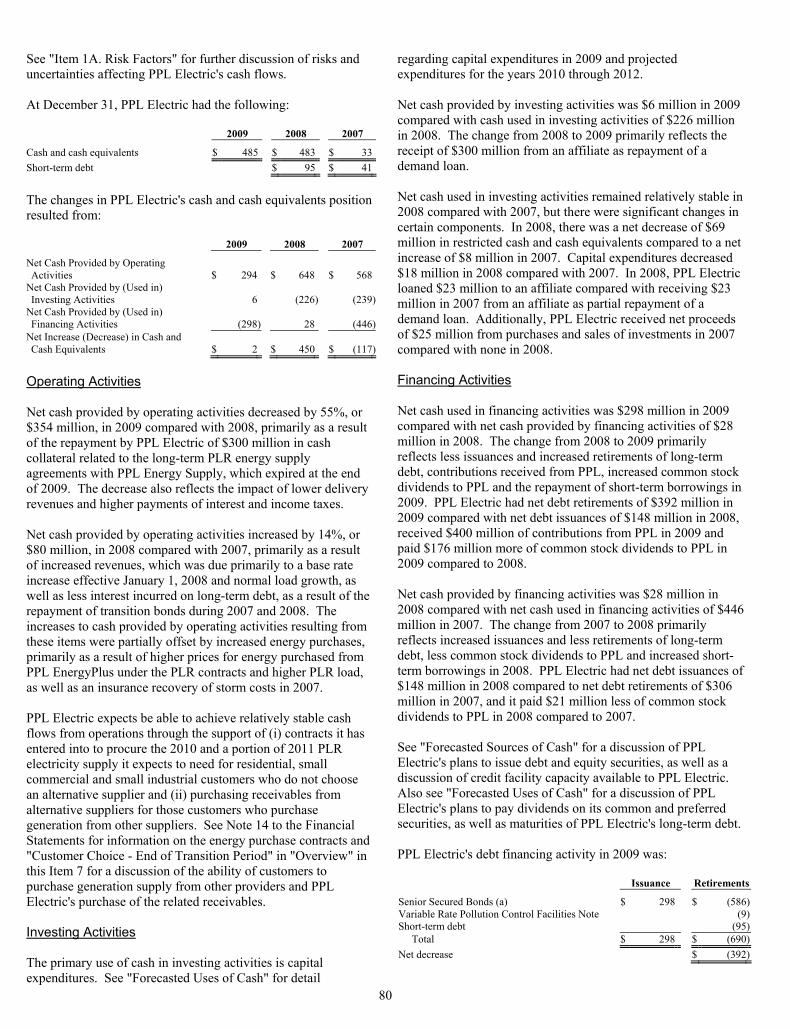
80
See "Item 1A. Risk Factors" for further discussion of risks and uncertainties affecting PPL Electric's cash flows. At December 31, PPL Electric had the following: 2009 2008 2007
Cash and cash equivalents $ 485 $ 483 $ 33Short-term debt $ 95 $ 41
The changes in PPL Electric's cash and cash equivalents position resulted from:
2009 2008 2007
Net Cash Provided by Operating Activities $ 294 $ 648 $ 568
Net Cash Provided by (Used in) Investing Activities 6 (226) (239)
Net Cash Provided by (Used in) Financing Activities (298) 28 (446)
Net Increase (Decrease) in Cash and Cash Equivalents $ 2 $ 450 $ (117)
Operating Activities Net cash provided by operating activities decreased by 55%, or $354 million, in 2009 compared with 2008, primarily as a result of the repayment by PPL Electric of $300 million in cash collateral related to the long-term PLR energy supply agreements with PPL Energy Supply, which expired at the end of 2009. The decrease also reflects the impact of lower delivery revenues and higher payments of interest and income taxes. Net cash provided by operating activities increased by 14%, or $80 million, in 2008 compared with 2007, primarily as a result of increased revenues, which was due primarily to a base rate increase effective January 1, 2008 and normal load growth, as well as less interest incurred on long-term debt, as a result of the repayment of transition bonds during 2007 and 2008. The increases to cash provided by operating activities resulting from these items were partially offset by increased energy purchases, primarily as a result of higher prices for energy purchased from PPL EnergyPlus under the PLR contracts and higher PLR load, as well as an insurance recovery of storm costs in 2007. PPL Electric expects be able to achieve relatively stable cash flows from operations through the support of (i) contracts it has entered into to procure the 2010 and a portion of 2011 PLR electricity supply it expects to need for residential, small commercial and small industrial customers who do not choose an alternative supplier and (ii) purchasing receivables from alternative suppliers for those customers who purchase generation from other suppliers. See Note 14 to the Financial Statements for information on the energy purchase contracts and "Customer Choice - End of Transition Period" in "Overview" in this Item 7 for a discussion of the ability of customers to purchase generation supply from other providers and PPL Electric's purchase of the related receivables. Investing Activities The primary use of cash in investing activities is capital expenditures. See "Forecasted Uses of Cash" for detail
regarding capital expenditures in 2009 and projected expenditures for the years 2010 through 2012. Net cash provided by investing activities was $6 million in 2009 compared with cash used in investing activities of $226 million in 2008. The change from 2008 to 2009 primarily reflects the receipt of $300 million from an affiliate as repayment of a demand loan. Net cash used in investing activities remained relatively stable in 2008 compared with 2007, but there were significant changes in certain components. In 2008, there was a net decrease of $69 million in restricted cash and cash equivalents compared to a net increase of $8 million in 2007. Capital expenditures decreased $18 million in 2008 compared with 2007. In 2008, PPL Electric loaned $23 million to an affiliate compared with receiving $23 million in 2007 from an affiliate as partial repayment of a demand loan. Additionally, PPL Electric received net proceeds of $25 million from purchases and sales of investments in 2007 compared with none in 2008. Financing Activities Net cash used in financing activities was $298 million in 2009 compared with net cash provided by financing activities of $28 million in 2008. The change from 2008 to 2009 primarily reflects less issuances and increased retirements of long-term debt, contributions received from PPL, increased common stock dividends to PPL and the repayment of short-term borrowings in 2009. PPL Electric had net debt retirements of $392 million in 2009 compared with net debt issuances of $148 million in 2008, received $400 million of contributions from PPL in 2009 and paid $176 million more of common stock dividends to PPL in 2009 compared to 2008. Net cash provided by financing activities was $28 million in 2008 compared with net cash used in financing activities of $446 million in 2007. The change from 2007 to 2008 primarily reflects increased issuances and less retirements of long-term debt, less common stock dividends to PPL and increased short-term borrowings in 2008. PPL Electric had net debt issuances of $148 million in 2008 compared to net debt retirements of $306 million in 2007, and it paid $21 million less of common stock dividends to PPL in 2008 compared to 2007. See "Forecasted Sources of Cash" for a discussion of PPL Electric's plans to issue debt and equity securities, as well as a discussion of credit facility capacity available to PPL Electric. Also see "Forecasted Uses of Cash" for a discussion of PPL Electric's plans to pay dividends on its common and preferred securities, as well as maturities of PPL Electric's long-term debt. PPL Electric's debt financing activity in 2009 was: Issuance Retirements
Senior Secured Bonds (a) $ 298 $ (586)Variable Rate Pollution Control Facilities Note (9)Short-term debt (95)
Total $ 298 $ (690)Net decrease $ (392)
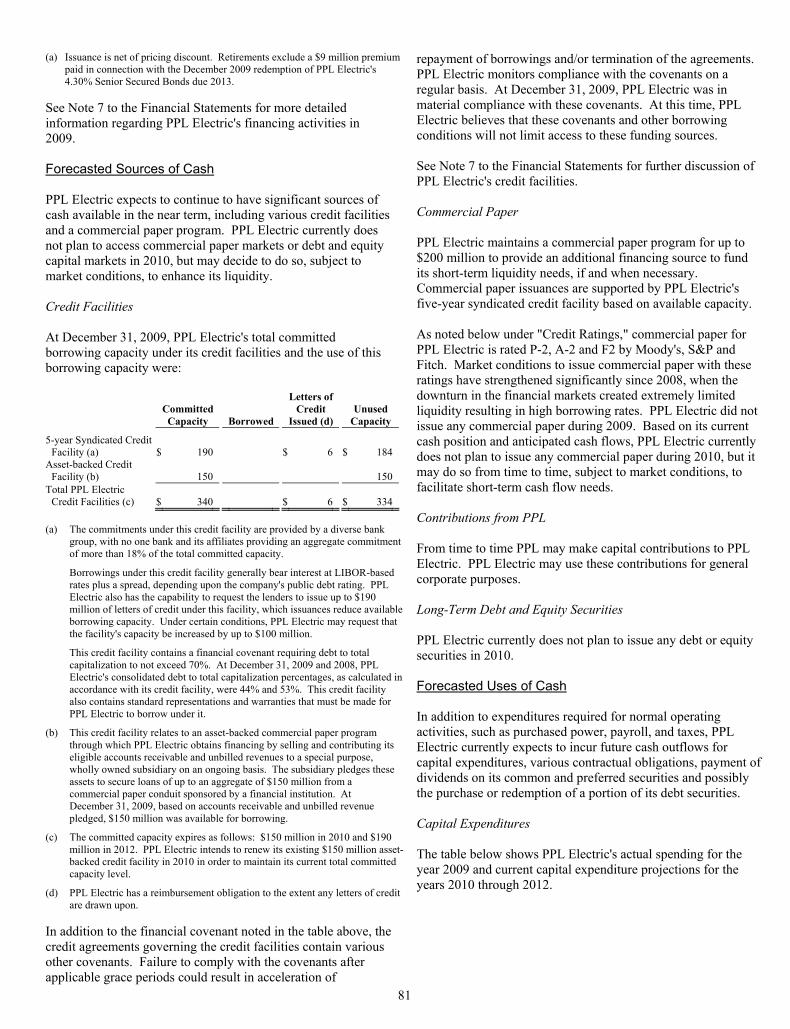
81
(a) Issuance is net of pricing discount. Retirements exclude a $9 million premium paid in connection with the December 2009 redemption of PPL Electric's 4.30% Senior Secured Bonds due 2013.
See Note 7 to the Financial Statements for more detailed information regarding PPL Electric's financing activities in 2009. Forecasted Sources of Cash PPL Electric expects to continue to have significant sources of cash available in the near term, including various credit facilities and a commercial paper program. PPL Electric currently does not plan to access commercial paper markets or debt and equity capital markets in 2010, but may decide to do so, subject to market conditions, to enhance its liquidity. Credit Facilities At December 31, 2009, PPL Electric's total committed borrowing capacity under its credit facilities and the use of this borrowing capacity were:
Committed Capacity Borrowed
Letters of Credit
Issued (d) Unused
Capacity 5-year Syndicated Credit
Facility (a) $ 190 $ 6 $ 184 Asset-backed Credit
Facility (b) 150 150 Total PPL Electric
Credit Facilities (c) $ 340 $ 6 $ 334 (a) The commitments under this credit facility are provided by a diverse bank
group, with no one bank and its affiliates providing an aggregate commitment of more than 18% of the total committed capacity.
Borrowings under this credit facility generally bear interest at LIBOR-based rates plus a spread, depending upon the company's public debt rating. PPL Electric also has the capability to request the lenders to issue up to $190 million of letters of credit under this facility, which issuances reduce available borrowing capacity. Under certain conditions, PPL Electric may request that the facility's capacity be increased by up to $100 million.
This credit facility contains a financial covenant requiring debt to total capitalization to not exceed 70%. At December 31, 2009 and 2008, PPL Electric's consolidated debt to total capitalization percentages, as calculated in accordance with its credit facility, were 44% and 53%. This credit facility also contains standard representations and warranties that must be made for PPL Electric to borrow under it.
(b) This credit facility relates to an asset-backed commercial paper program through which PPL Electric obtains financing by selling and contributing its eligible accounts receivable and unbilled revenues to a special purpose, wholly owned subsidiary on an ongoing basis. The subsidiary pledges these assets to secure loans of up to an aggregate of $150 million from a commercial paper conduit sponsored by a financial institution. At December 31, 2009, based on accounts receivable and unbilled revenue pledged, $150 million was available for borrowing.
(c) The committed capacity expires as follows: $150 million in 2010 and $190 million in 2012. PPL Electric intends to renew its existing $150 million asset-backed credit facility in 2010 in order to maintain its current total committed capacity level.
(d) PPL Electric has a reimbursement obligation to the extent any letters of credit are drawn upon.
In addition to the financial covenant noted in the table above, the credit agreements governing the credit facilities contain various other covenants. Failure to comply with the covenants after applicable grace periods could result in acceleration of
repayment of borrowings and/or termination of the agreements. PPL Electric monitors compliance with the covenants on a regular basis. At December 31, 2009, PPL Electric was in material compliance with these covenants. At this time, PPL Electric believes that these covenants and other borrowing conditions will not limit access to these funding sources. See Note 7 to the Financial Statements for further discussion of PPL Electric's credit facilities. Commercial Paper PPL Electric maintains a commercial paper program for up to $200 million to provide an additional financing source to fund its short-term liquidity needs, if and when necessary. Commercial paper issuances are supported by PPL Electric's five-year syndicated credit facility based on available capacity. As noted below under "Credit Ratings," commercial paper for PPL Electric is rated P-2, A-2 and F2 by Moody's, S&P and Fitch. Market conditions to issue commercial paper with these ratings have strengthened significantly since 2008, when the downturn in the financial markets created extremely limited liquidity resulting in high borrowing rates. PPL Electric did not issue any commercial paper during 2009. Based on its current cash position and anticipated cash flows, PPL Electric currently does not plan to issue any commercial paper during 2010, but it may do so from time to time, subject to market conditions, to facilitate short-term cash flow needs. Contributions from PPL From time to time PPL may make capital contributions to PPL Electric. PPL Electric may use these contributions for general corporate purposes. Long-Term Debt and Equity Securities PPL Electric currently does not plan to issue any debt or equity securities in 2010. Forecasted Uses of Cash In addition to expenditures required for normal operating activities, such as purchased power, payroll, and taxes, PPL Electric currently expects to incur future cash outflows for capital expenditures, various contractual obligations, payment of dividends on its common and preferred securities and possibly the purchase or redemption of a portion of its debt securities. Capital Expenditures The table below shows PPL Electric's actual spending for the year 2009 and current capital expenditure projections for the years 2010 through 2012.
82
Actual Projected 2009 2010 2011 2012
Construction expenditures (a) (b) Transmission and distribution facilities $ 264 $ 542 $ 739 $ 605
Other 34 47 38 39Total Capital Expenditures $ 298 $ 589 $ 777 $ 644
(a) Construction expenditures include AFUDC, which is expected to be
approximately $34 million for the years 2010 through 2012. (b) Includes expenditures for intangible assets. PPL Electric's capital expenditure projections for the years 2010 through 2012 total approximately $2.0 billion. Capital expenditure plans are revised periodically to reflect changes in operational, market and regulatory conditions. The table includes projected costs for the asset optimization program focused on the replacement of aging transmission and distribution assets, and the PJM-approved regional transmission line expansion project. See Note 8 to the Financial Statements for additional information. PPL Electric plans to fund its capital expenditures in 2010 with cash on hand and cash from operations. Contractual Obligations PPL Electric has assumed various financial obligations and commitments in the ordinary course of conducting its business. At December 31, 2009, the estimated contractual cash obligations of PPL Electric were:
Total
Less Than
1 Year 1-3
Years 4-5
Years After 5 Years
Long-term Debt (a) $ 1,474 $ 410 $ 1,064Interest on Long-term Debt (b) 1,454 $ 89 $ 173 147 1,045
Purchase Obligations (c) 3,142 2,599 537 6 Other Long-term Liabilities Reflected on the Balance Sheets under GAAP (d)
Total Contractual Cash Obligations $ 6,070 $ 2,688 $ 710 $ 563 $ 2,109
(a) Reflects principal maturities only based on legal maturity dates. See Note 7 to
the Financial Statements for a discussion of variable-rate remarketable bonds issued by the PEDFA on behalf of PPL Electric. PPL Electric does not have any capital or operating lease obligations.
(b) Assumes interest payments through maturity. The payments herein are subject to change, as payments for variable-rate debt have been estimated.
(c) The payments reflected herein are subject to change, as the purchase obligation reflected is an estimate based on projected obligated quantities and projected pricing under the contract. Purchase orders made in the ordinary course of business are excluded from the amounts presented.
(d) At December 31, 2009, total unrecognized tax benefits of $74 million were excluded from this table as PPL Electric cannot reasonably estimate the amount and period of future payments. See Note 5 to the Financial Statements for additional information.
Dividends From time to time, as determined by its Board of Directors, PPL Electric pays dividends on its common stock to its parent, PPL.
As discussed in Note 7 to the Financial Statements, PPL Electric may not pay dividends on its common stock, except in certain circumstances, unless full dividends have been paid on the 6.25% Series Preference Stock for the then-current dividend period. PPL Electric does not, at this time, expect that such limitation would significantly impact its ability to declare dividends. PPL Electric expects to continue to pay quarterly dividends on its outstanding preferred securities, if and as declared by its Board of Directors. Purchase or Redemption of Debt Securities PPL Electric will continue to evaluate purchasing or redeeming outstanding debt securities and may decide to take action depending upon prevailing market conditions and available cash. Credit Ratings Moody's, S&P and Fitch periodically review the credit ratings on the debt and preferred securities of PPL Electric. Based on their respective independent reviews, the rating agencies may make certain ratings revisions or ratings affirmations. A credit rating reflects an assessment by the rating agency of the creditworthiness associated with an issuer and particular securities that it issues. The credit ratings of PPL Electric are based on information provided by PPL Electric and other sources. The ratings of Moody's, S&P and Fitch are not a recommendation to buy, sell or hold any securities of PPL Electric. Such ratings may be subject to revisions or withdrawal by the agencies at any time and should be evaluated independently of each other and any other rating that may be assigned to the securities. A downgrade in PPL Electric's credit ratings could result in higher borrowing costs and reduced access to capital markets. The following table summarizes the credit ratings of PPL Electric at December 31, 2009:
Moody's S&P Fitch (a) PPL Electric (b)
Senior Unsecured/Issuer Rating Baa1
A- BBB
First Mortgage Bonds/Senior Secured Bonds A3
A- A- Commercial Paper P-2 A-2 F2 Preferred Stock Baa3 BBB BBB Preference Stock Baa3 BBB BBB Outlook Negative Negative STABLE
(a) Issuer Rating for Fitch is an "Issuer Default Rating." (b) Excludes Pollution Control Revenue Bonds issued by the LCIDA and the
PEDFA on behalf of PPL Electric, of which the LCIDA bonds are insured and may be rated on the basis of relevant factors, including the insurer's ratings.
In January 2009, S&P completed a review of PPL Electric, upon which it revised its outlook to negative from stable and affirmed the A- issuer rating of PPL Electric. S&P stated in its press release that the revision in its outlook reflects the linkage with
83
PPL, whose outlook was also revised to negative from stable, along with their expectation that PPL Electric's financial metrics could weaken beginning in 2010. In May 2009, Moody's completed a review of PPL Electric. As a result of that review, Moody's revised its outlook for PPL Electric to negative from stable. Moody's stated in its press release that the revision in the outlook for PPL Electric reflects Moody's expectation that PPL Electric's financial metrics will deteriorate beyond 2009 and considers the potential for additional pressure on cash flows. In October 2009, Fitch completed a review of PPL Electric, upon which it affirmed all ratings of PPL Electric. In January 2010, as a result of implementing its recently revised guidelines for rating preferred stock and hybrid securities, Fitch lowered the ratings of PPL Electric's preferred stock and preference stock to BBB- from BBB. Fitch stated in its press release that the new guidelines, which apply to instruments issued by companies in all sectors, typically resulted in downgrades of one notch for many instruments that provide for the ability to defer interest or dividend payments. Fitch stated that it has no reason to believe that deferral will be activated. Off-Balance Sheet Arrangements PPL Electric has entered into certain agreements that may contingently require payment to a guaranteed or indemnified party. See Note 14 to the Financial Statements for a discussion of these agreements. Risk Management Market Risk Commodity Price and Volumetric Risk - PLR Contracts PPL Electric has an obligation to act as a PLR. This role has the potential to expose PPL Electric to electric generation price and volumetric risk. Through 2009, PPL Electric and PPL EnergyPlus had power supply agreements under which PPL EnergyPlus sold PPL Electric (under a predetermined pricing arrangement) energy and capacity to fulfill this PLR obligation. As a result, PPL Electric had shifted these risks to PPL EnergyPlus. For its 2010 PLR obligation, PPL Electric has entered into power purchase agreements with several counterparties, which include fixed prices that shift these risks to the counterparties. PPL Electric is in the process of procuring such supply for the period January 2011 through May 2013. In the event a supplier defaults on its obligation, PPL Electric would be required to seek replacement power in the market. All incremental costs incurred by PPL Electric would be recoverable from customers in future rates. See "Overview" in this Item 7 and Note 14 to the Financial Statements for information on the PUC-approved procurement plan and other ongoing Pennsylvania regulatory and legislative activities.
Interest Rate Risk PPL Electric has issued debt to finance its operations, which exposes it to interest rate risk. PPL Electric's potential annual exposure to increased interest expense, based on a 10% increase in interest rates, was not significant at December 31, 2009 and 2008. PPL Electric estimated that a 10% decrease in interest rates at December 31, 2009 would increase the fair value of its debt portfolio by $69 million, compared with $50 million at December 31, 2008. Credit Risk Credit risk is the risk that PPL Electric would incur a loss as a result of nonperformance by counterparties of their contractual obligations. PPL Electric requires that counterparties maintain specified credit ratings and requires other assurances in the form of credit support or collateral in certain circumstances in order to limit counterparty credit risk. However, PPL Electric has concentrations of suppliers, financial institutions and customers. These concentrations may impact PPL Electric's overall exposure to credit risk, positively or negatively, as counterparties may be similarly affected by changes in economic, regulatory or other conditions. In 2007, the PUC approved PPL Electric's post-rate cap plan to procure default electricity supply for retail customers who do not choose an alternative competitive supplier in 2010. From 2007 through 2009, PPL Electric conducted six competitive solicitations to purchase electricity generation supply for these customers. In October 2009, PPL Electric purchased 2010 supply for fixed-price default service to large commercial and large industrial customers who elect to take that service. In November 2009, PPL Electric purchased supply to provide hourly default service to large commercial and industrial customers in 2010. In June 2009, the PUC approved PPL Electric's procurement plan for the period January 2011 through May 2013. The first two of 14 planned competitive solicitations occurred in 2009. Under the standard Supply Master Agreement (the Agreement) for the bid solicitation process, PPL Electric requires all suppliers to post collateral if their credit exposure exceeds an established credit limit. In the event a supplier defaults on its obligation, PPL Electric would be required to seek replacement power in the market. All incremental costs incurred by PPL Electric would be recoverable from customers in future rates. At December 31, 2009, all of the successful bidders under all of the solicitations had an investment grade credit rating from S&P, and were not required to post collateral under the Agreement. There is no instance under the Agreement in which PPL Electric is required to post collateral to its suppliers. See "Overview" in this Item 7 and Notes 14, 15, 17 and 18 to the Financial Statements for additional information on the competitive solicitations, the Agreement and credit concentration and risk.
84
Related Party Transactions PPL Electric is not aware of any material ownership interests or operating responsibility by senior management of PPL Electric in outside partnerships, including leasing transactions with variable interest entities, or other entities doing business with PPL Electric. For additional information on related party transactions, see Note 15 to the Financial Statements. Environmental Matters See "Item 1. Business - Environmental Matters" and Note 14 to the Financial Statements for a discussion of environmental matters. Competition See "Item 1. Business - Segment Information - Pennsylvania Delivery Segment - Competition" and "Item 1A. Risk Factors" for a discussion of competitive factors affecting PPL Electric.
New Accounting Guidance See Notes 1 and 22 to the Financial Statements for a discussion of new accounting guidance adopted and pending adoption.
Application of Critical Accounting Policies PPL Electric's financial condition and results of operations are impacted by the methods, assumptions and estimates used in the application of critical accounting policies. The following accounting policies are particularly important to the financial condition or results of operations of PPL Electric, and require estimates or other judgments of matters inherently uncertain. Changes in the estimates or other judgments included within these accounting policies could result in a significant change to the information presented in the Financial Statements (these accounting policies are also discussed in Note 1 to the Financial Statements). PPL's senior management has reviewed these critical accounting policies and the estimates and assumptions regarding them with its Audit Committee. In addition, PPL's senior management has reviewed the following disclosures regarding the application of these critical accounting policies with the Audit Committee. Effective January 1, 2009, PPL Electric fully applied accounting guidance that provides a framework for measuring fair value. The fair value measurement concepts provided by this guidance are used within its financial statements where applicable. See Notes 1 and 17 to the Financial Statements for additional information regarding fair value measurements. 1) Defined Benefits PPL Electric participates in and is allocated a significant portion of the liability and net periodic defined benefit pension and other postretirement costs of plans sponsored by PPL Services based on participation in those plans. PPL Electric records an asset or liability to recognize the funded status of all defined benefit
plans with an offsetting entry to regulatory assets. Consequently, the funded status of all defined benefit plans is fully recognized on the Balance Sheets. See Note 12 to the Financial Statements for additional information about the plans and the accounting for defined benefits. PPL makes certain assumptions regarding the valuation of benefit obligations and the performance of plan assets. When accounting for defined benefits, delayed recognition in earnings of differences between actual results and expected or estimated results is a guiding principle. Annual net periodic defined benefit costs are recorded in current earnings based on estimated results. Any differences between actual and estimated results are recorded in regulatory assets. The amount in regulatory assets is amortized to income over future periods. The delayed recognition allows for a smoothed recognition of costs over the working lives of the employees who benefit under the plans. The primary assumptions are: • Discount Rate - The discount rate is used in calculating the
present value of benefits, which is based on projections of benefit payments to be made in the future. The objective in selecting the discount rate is to measure the single amount that, if invested at the measurement date in a portfolio of high-quality debt instruments, would provide the necessary future cash flows to pay the accumulated benefits when due.
• Expected Return on Plan Assets - Management projects the
long-term rates of return on plan assets based on historical performance, future expectations and periodic portfolio rebalancing among the diversified asset classes. These projected returns reduce the net benefit costs PPL Electric records currently.
• Rate of Compensation Increase - Management projects
employees' annual pay increases, which are used to project employees' pension benefits at retirement.
• Health Care Cost Trend Rate - Management projects the
expected increases in the cost of health care. In selecting a discount rate for its U.S. defined benefit plans, PPL starts with an analysis of the expected benefit payment stream for its plans. This information is first matched against a spot-rate yield curve. A portfolio of 526 Aa-graded non-callable (or callable with make-whole provisions) bonds, with a total amount outstanding in excess of $541 billion, serves as the base from which those with the lowest and highest yields are eliminated to develop the ultimate yield curve. The results of this analysis are considered together with other economic data and movements in various bond indices to determine the discount rate assumption. At December 31, 2009, PPL decreased the discount rate for its U.S. pension plans from 6.50% to 6.00% as a result of this assessment and decreased the discount rate for its other postretirement benefit plans from 6.45% to 5.81%. The expected long-term rates of return for PPL's U.S. defined benefit pension and other postretirement benefits have been developed using a best-estimate of expected returns, volatilities and correlations for each asset class. PPL management
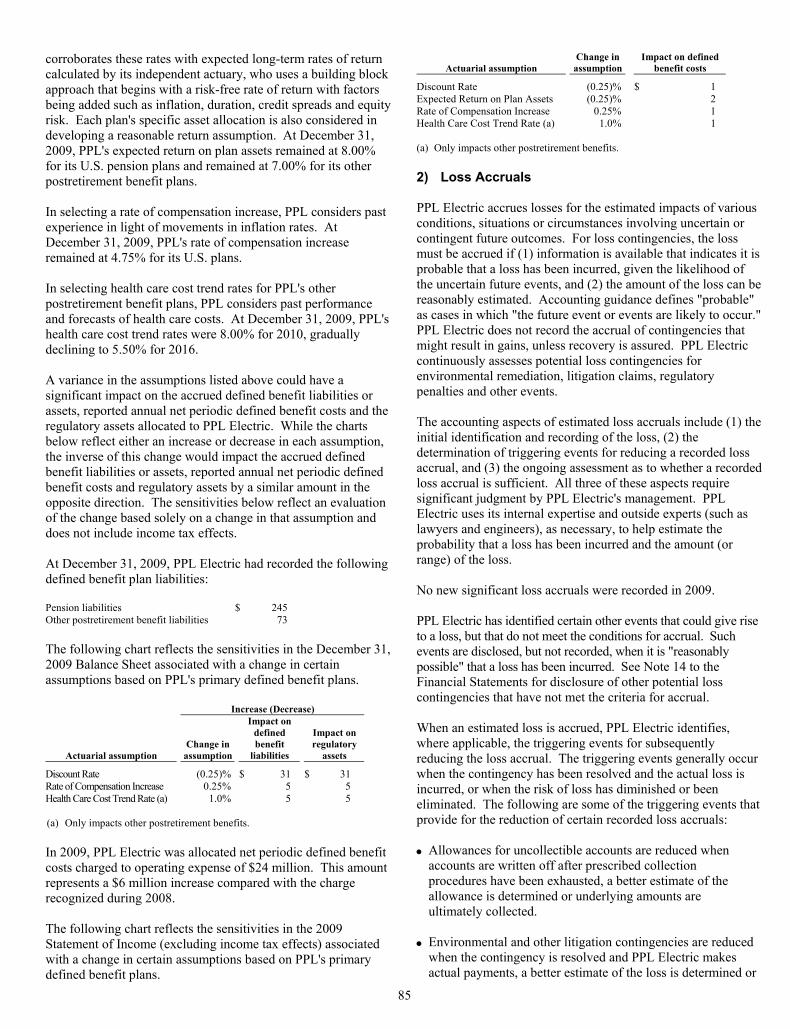
85
corroborates these rates with expected long-term rates of return calculated by its independent actuary, who uses a building block approach that begins with a risk-free rate of return with factors being added such as inflation, duration, credit spreads and equity risk. Each plan's specific asset allocation is also considered in developing a reasonable return assumption. At December 31, 2009, PPL's expected return on plan assets remained at 8.00% for its U.S. pension plans and remained at 7.00% for its other postretirement benefit plans. In selecting a rate of compensation increase, PPL considers past experience in light of movements in inflation rates. At December 31, 2009, PPL's rate of compensation increase remained at 4.75% for its U.S. plans. In selecting health care cost trend rates for PPL's other postretirement benefit plans, PPL considers past performance and forecasts of health care costs. At December 31, 2009, PPL's health care cost trend rates were 8.00% for 2010, gradually declining to 5.50% for 2016. A variance in the assumptions listed above could have a significant impact on the accrued defined benefit liabilities or assets, reported annual net periodic defined benefit costs and the regulatory assets allocated to PPL Electric. While the charts below reflect either an increase or decrease in each assumption, the inverse of this change would impact the accrued defined benefit liabilities or assets, reported annual net periodic defined benefit costs and regulatory assets by a similar amount in the opposite direction. The sensitivities below reflect an evaluation of the change based solely on a change in that assumption and does not include income tax effects. At December 31, 2009, PPL Electric had recorded the following defined benefit plan liabilities: Pension liabilities $ 245 Other postretirement benefit liabilities 73 The following chart reflects the sensitivities in the December 31, 2009 Balance Sheet associated with a change in certain assumptions based on PPL's primary defined benefit plans.
Increase (Decrease)
Actuarial assumption
Change in assumption
Impact on defined benefit
liabilities
Impact on regulatory
assets
Discount Rate (0.25)% $ 31 $ 31 Rate of Compensation Increase 0.25% 5 5 Health Care Cost Trend Rate (a) 1.0% 5 5 (a) Only impacts other postretirement benefits. In 2009, PPL Electric was allocated net periodic defined benefit costs charged to operating expense of $24 million. This amount represents a $6 million increase compared with the charge recognized during 2008. The following chart reflects the sensitivities in the 2009 Statement of Income (excluding income tax effects) associated with a change in certain assumptions based on PPL's primary defined benefit plans.
Actuarial assumption Change in
assumption Impact on defined
benefit costs
Discount Rate (0.25)% $ 1Expected Return on Plan Assets (0.25)% 2Rate of Compensation Increase 0.25% 1Health Care Cost Trend Rate (a) 1.0% 1 (a) Only impacts other postretirement benefits. 2) Loss Accruals PPL Electric accrues losses for the estimated impacts of various conditions, situations or circumstances involving uncertain or contingent future outcomes. For loss contingencies, the loss must be accrued if (1) information is available that indicates it is probable that a loss has been incurred, given the likelihood of the uncertain future events, and (2) the amount of the loss can be reasonably estimated. Accounting guidance defines "probable" as cases in which "the future event or events are likely to occur." PPL Electric does not record the accrual of contingencies that might result in gains, unless recovery is assured. PPL Electric continuously assesses potential loss contingencies for environmental remediation, litigation claims, regulatory penalties and other events. The accounting aspects of estimated loss accruals include (1) the initial identification and recording of the loss, (2) the determination of triggering events for reducing a recorded loss accrual, and (3) the ongoing assessment as to whether a recorded loss accrual is sufficient. All three of these aspects require significant judgment by PPL Electric's management. PPL Electric uses its internal expertise and outside experts (such as lawyers and engineers), as necessary, to help estimate the probability that a loss has been incurred and the amount (or range) of the loss. No new significant loss accruals were recorded in 2009. PPL Electric has identified certain other events that could give rise to a loss, but that do not meet the conditions for accrual. Such events are disclosed, but not recorded, when it is "reasonably possible" that a loss has been incurred. See Note 14 to the Financial Statements for disclosure of other potential loss contingencies that have not met the criteria for accrual. When an estimated loss is accrued, PPL Electric identifies, where applicable, the triggering events for subsequently reducing the loss accrual. The triggering events generally occur when the contingency has been resolved and the actual loss is incurred, or when the risk of loss has diminished or been eliminated. The following are some of the triggering events that provide for the reduction of certain recorded loss accruals: • Allowances for uncollectible accounts are reduced when
accounts are written off after prescribed collection procedures have been exhausted, a better estimate of the allowance is determined or underlying amounts are ultimately collected.
• Environmental and other litigation contingencies are reduced
when the contingency is resolved and PPL Electric makes actual payments, a better estimate of the loss is determined or
86
the loss is no longer considered probable. PPL Electric reviews its loss accruals on a regular basis to assure that the recorded potential loss exposures are appropriate. This involves ongoing communication and analyses with internal and external legal counsel, engineers, operation management and other parties. 3) Income Tax Uncertainties Significant management judgment is required in developing PPL Electric's provision for income taxes primarily due to the uncertainty related to tax positions taken or expected to be taken in tax returns and the determination of deferred tax assets, liabilities and valuation allowances. Significant management judgment is required to determine the amount of benefit recognized related to an uncertain tax position. PPL Electric evaluates its tax positions following a two-step process. The first step requires an entity to determine whether, based on the technical merits supporting a particular tax position, it is more likely than not (greater than a 50% chance) that the tax position will be sustained. This determination assumes that the relevant taxing authority will examine the tax position and is aware of all the relevant facts surrounding the tax position. The second step requires an entity to recognize in the financial statements the benefit of a tax position that meets the more-likely-than-not recognition criterion. The benefit recognized is measured at the largest amount of benefit that has a likelihood of realization, upon settlement, that exceeds 50%. PPL Electric's management considers a number of factors in assessing the benefit to be recognized, including negotiation of a settlement. On a quarterly basis, PPL Electric reassesses its uncertain tax positions by considering information known at the reporting date. Based on management's assessment of new information, PPL Electric may subsequently recognize a tax benefit for a previously unrecognized tax position, de-recognize a previously recognized tax position, or re-measure the benefit of a previously recognized tax position. The amounts ultimately paid upon resolution of issues raised by taxing authorities may differ materially from the amounts accrued and may materially impact PPL Electric's financial statements in the future. The balance sheet classification of unrecognized tax benefits and the need for valuation allowances to reduce deferred tax assets also require significant management judgment. PPL Electric classifies unrecognized tax benefits as current, to the extent management expects to settle an uncertain tax position, by payment or receipt of cash, within one year of the reporting date. Valuation allowances are initially recorded and reevaluated each reporting period by assessing the likelihood of the ultimate realization of a deferred tax asset. Management considers a number of factors in assessing the realization of a deferred tax asset, including the reversal of temporary differences, future taxable income and ongoing prudent and feasible tax planning strategies. Any tax planning strategy utilized in this assessment must meet the recognition and measurement criteria utilized by PPL Electric to account for an uncertain tax positions. See Note 5 to the Financial Statements for the required disclosures.
At December 31, 2009, it was reasonably possible that during the next 12 months the total amount of unrecognized tax benefits could increase by as much as $23 million or decrease by up to $22 million for PPL Electric. This change could result from the timing and/or valuation of certain deductions, intercompany transactions and unitary filing groups. The events that could cause these changes are direct settlements with taxing authorities, litigation, legal or administrative guidance by relevant taxing authorities and the lapse of an applicable statute of limitation. 4) Regulatory Assets PPL Electric's electricity delivery business is subject to cost-based rate-regulation. As a result, PPL Electric is required to reflect the effects of regulatory actions in its financial statements. PPL Electric records assets that result from the regulated ratemaking process that may not be recorded under GAAP for non-regulated entities. Regulatory assets generally represent incurred costs that have been deferred because such costs are probable of future recovery in regulated customer rates. Management continually assesses whether the regulatory assets are probable of future recovery by considering factors such as changes in the applicable regulatory and political environments, the ability to recover costs through regulated rates, recent rate orders to other regulated entities, and the status of any pending or potential deregulation legislation. Based on this continual assessment, management believes the existing regulatory assets are probable of recovery. This assessment reflects the current political and regulatory climate at the state and federal levels, and is subject to change in the future. If future recovery of costs ceases to be probable, then asset write-offs would be required to be recognized in operating income. Additionally, the regulatory agencies can provide flexibility in the manner and timing of the depreciation of PP&E and amortization of regulatory assets. At December 31, 2009 and 2008, PPL Electric had regulatory assets of $531 million and $763 million. All of PPL Electric's regulatory assets are either currently being recovered under specific rate orders or represent amounts that will be recovered in future rates based upon established regulatory practices.
Other Information PPL's Audit Committee has approved the independent auditor to provide audit and audit-related services and other services permitted by Sarbanes-Oxley and SEC rules. The audit and audit-related services include services in connection with statutory and regulatory filings, reviews of offering documents and registration statements, and internal control reviews.

87
ITEM 7A. QUANTITATIVE AND QUALITATIVE DISCLOSURES ABOUT MARKET RISK
PPL Corporation, PPL Energy Supply, LLC and PPL Electric Utilities Corporation Reference is made to "Risk Management - Energy Marketing & Trading and Other" for PPL and PPL Energy Supply and "Risk Management" for PPL Electric in "Item 7. Management's Discussion and Analysis of Financial Condition and Results of Operations."

88
(THIS PAGE LEFT BLANK INTENTIONALLY.)

89
Report of Independent Registered Public Accounting Firm To the Board of Directors and Shareowners of PPL Corporation We have audited the accompanying consolidated balance sheets of PPL Corporation and subsidiaries as of December 31, 2009 and 2008, and the related consolidated statements of income, equity, comprehensive income, and cash flows for each of the three years in the period ended December 31, 2009. These financial statements are the responsibility of the Company's management. Our responsibility is to express an opinion on these financial statements based on our audits. We conducted our audits in accordance with the standards of the Public Company Accounting Oversight Board (United States). Those standards require that we plan and perform the audit to obtain reasonable assurance about whether the financial statements are free of material misstatement. An audit includes examining, on a test basis, evidence supporting the amounts and disclosures in the financial statements. An audit also includes assessing the accounting principles used and significant estimates made by management, as well as evaluating the overall financial statement presentation. We believe that our audits provide a reasonable basis for our opinion. In our opinion, the financial statements referred to above present fairly, in all material respects, the consolidated financial position of PPL Corporation and subsidiaries at December 31, 2009 and 2008, and the consolidated results of their operations and their cash flows for each of the three years in the period ended December 31, 2009, in conformity with U.S. generally accepted accounting principles. We also have audited, in accordance with the standards of the Public Company Accounting Oversight Board (United States), PPL Corporation's internal control over financial reporting as of December 31, 2009, based on criteria established in Internal Control-Integrated Framework issued by the Committee of Sponsoring Organizations of the Treadway Commission and our report dated February 25, 2010 expressed an unqualified opinion thereon.
Philadelphia, Pennsylvania February 25, 2010

90
Report of Independent Registered Public Accounting Firm
To the Board of Directors and Shareowners of PPL Corporation We have audited PPL Corporation's internal control over financial reporting as of December 31, 2009, based on criteria established in Internal Control—Integrated Framework issued by the Committee of Sponsoring Organizations of the Treadway Commission (the COSO criteria). PPL Corporation's management is responsible for maintaining effective internal control over financial reporting, and for its assessment of the effectiveness of internal control over financial reporting included in Management's Report on Internal Control over Financial Reporting at Item 9A. Our responsibility is to express an opinion on the company's internal control over financial reporting based on our audit. We conducted our audit in accordance with the standards of the Public Company Accounting Oversight Board (United States). Those standards require that we plan and perform the audit to obtain reasonable assurance about whether effective internal control over financial reporting was maintained in all material respects. Our audit included obtaining an understanding of internal control over financial reporting, assessing the risk that a material weakness exists, testing and evaluating the design and operating effectiveness of internal control based on the assessed risk, and performing such other procedures as we considered necessary in the circumstances. We believe that our audit provides a reasonable basis for our opinion. A company's internal control over financial reporting is a process designed to provide reasonable assurance regarding the reliability of financial reporting and the preparation of financial statements for external purposes in accordance with generally accepted accounting principles. A company's internal control over financial reporting includes those policies and procedures that (1) pertain to the maintenance of records that, in reasonable detail, accurately and fairly reflect the transactions and dispositions of the assets of the company; (2) provide reasonable assurance that transactions are recorded as necessary to permit preparation of financial statements in accordance with U.S. generally accepted accounting principles, and that receipts and expenditures of the company are being made only in accordance with authorizations of management and directors of the company; and (3) provide reasonable assurance regarding prevention or timely detection of unauthorized acquisition, use, or disposition of the company's assets that could have a material effect on the financial statements. Because of its inherent limitations, internal control over financial reporting may not prevent or detect misstatements. Also, projections of any evaluation of effectiveness to future periods are subject to the risk that controls may become inadequate because of changes in conditions, or that the degree of compliance with the policies or procedures may deteriorate. In our opinion, PPL Corporation maintained, in all material respects, effective internal control over financial reporting as of December 31, 2009, based on the COSO criteria. We also have audited, in accordance with the standards of the Public Company Accounting Oversight Board (United States), the consolidated balance sheets of PPL Corporation and subsidiaries as of December 31, 2009 and 2008, and the related consolidated statements of income, equity, comprehensive income, and cash flows for each of the three years in the period ended December 31, 2009 and our report dated February 25, 2010 expressed an unqualified opinion thereon.
Philadelphia, Pennsylvania February 25, 2010

91
Report of Independent Registered Public Accounting Firm
To the Board of Managers and Sole Member of PPL Energy Supply, LLC We have audited the accompanying consolidated balance sheets of PPL Energy Supply, LLC and subsidiaries as of December 31, 2009 and 2008, and the related consolidated statements of income, equity, comprehensive income, and cash flows for each of the three years in the period ended December 31, 2009. These financial statements are the responsibility of the Company's management. Our responsibility is to express an opinion on these financial statements based on our audits. We conducted our audits in accordance with the standards of the Public Company Accounting Oversight Board (United States). Those standards require that we plan and perform the audit to obtain reasonable assurance about whether the financial statements are free of material misstatement. We were not engaged to perform an audit of the Company's internal control over financial reporting. Our audits included consideration of internal control over financial reporting as a basis for designing audit procedures that are appropriate in the circumstances, but not for the purpose of expressing an opinion on the effectiveness of the Company's internal control over financial reporting. Accordingly, we express no such opinion. An audit also includes examining, on a test basis, evidence supporting the amounts and disclosures in the financial statements, assessing the accounting principles used and significant estimates made by management, and evaluating the overall financial statement presentation. We believe that our audits provide a reasonable basis for our opinion. In our opinion, the financial statements referred to above present fairly, in all material respects, the consolidated financial position of PPL Energy Supply, LLC and subsidiaries at December 31, 2009 and 2008, and the consolidated results of their operations and their cash flows for each of the three years in the period ended December 31, 2009, in conformity with U.S. generally accepted accounting principles.
Philadelphia, Pennsylvania February 25, 2010

92
Report of Independent Registered Public Accounting Firm
To the Board of Directors and Shareowner of PPL Electric Utilities Corporation We have audited the accompanying consolidated balance sheets of PPL Electric Utilities Corporation and subsidiaries as of December 31, 2009 and 2008, and the related consolidated statements of income, shareowners' equity, and cash flows for each of the three years in the period ended December 31, 2009. These financial statements are the responsibility of the Company's management. Our responsibility is to express an opinion on these financial statements based on our audits. We conducted our audits in accordance with the standards of the Public Company Accounting Oversight Board (United States). Those standards require that we plan and perform the audit to obtain reasonable assurance about whether the financial statements are free of material misstatement. We were not engaged to perform an audit of the Company's internal control over financial reporting. Our audits included consideration of internal control over financial reporting as a basis for designing audit procedures that are appropriate in the circumstances, but not for the purpose of expressing an opinion on the effectiveness of the Company's internal control over financial reporting. Accordingly, we express no such opinion. An audit also includes examining, on a test basis, evidence supporting the amounts and disclosures in the financial statements, assessing the accounting principles used and significant estimates made by management, and evaluating the overall financial statement presentation. We believe that our audits provide a reasonable basis for our opinion. In our opinion, the financial statements referred to above present fairly, in all material respects, the consolidated financial position of PPL Electric Utilities Corporation and subsidiaries at December 31, 2009 and 2008, and the consolidated results of their operations and their cash flows for each of the three years in the period ended December 31, 2009, in conformity with U.S. generally accepted accounting principles.
Philadelphia, Pennsylvania February 25, 2010
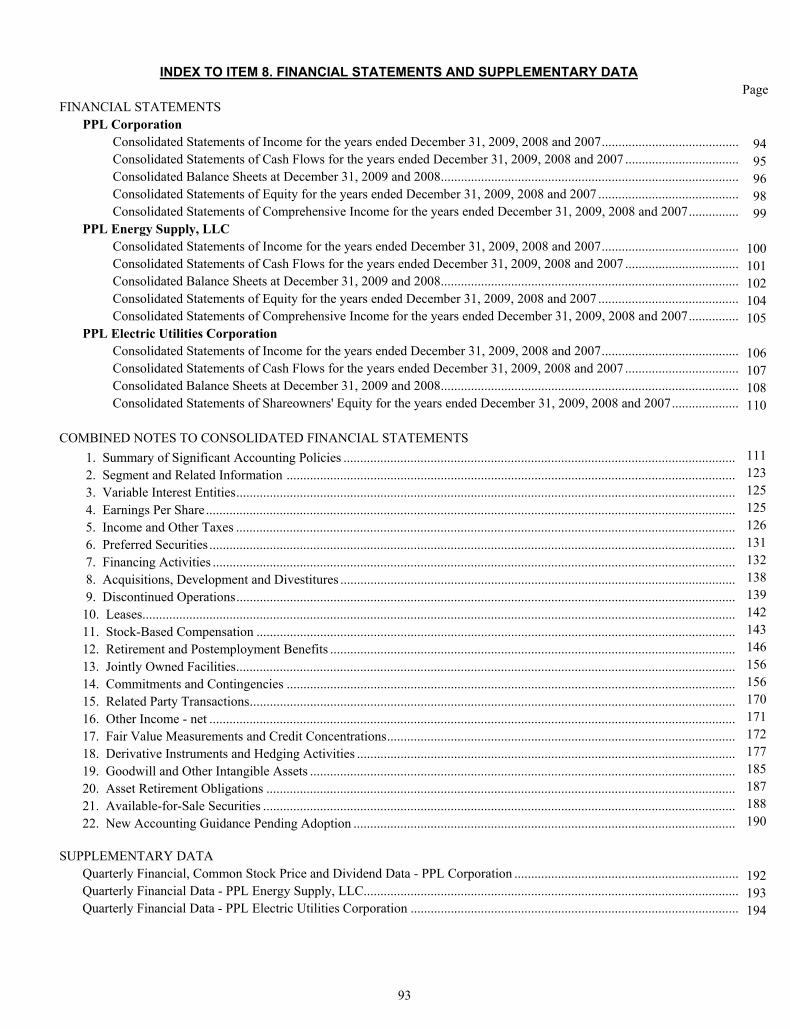
93
INDEX TO ITEM 8. FINANCIAL STATEMENTS AND SUPPLEMENTARY DATA
Page FINANCIAL STATEMENTS PPL Corporation Consolidated Statements of Income for the years ended December 31, 2009, 2008 and 2007......................................... 94 Consolidated Statements of Cash Flows for the years ended December 31, 2009, 2008 and 2007 .................................. 95 Consolidated Balance Sheets at December 31, 2009 and 2008......................................................................................... 96 Consolidated Statements of Equity for the years ended December 31, 2009, 2008 and 2007 .......................................... 98 Consolidated Statements of Comprehensive Income for the years ended December 31, 2009, 2008 and 2007............... 99 PPL Energy Supply, LLC Consolidated Statements of Income for the years ended December 31, 2009, 2008 and 2007......................................... 100 Consolidated Statements of Cash Flows for the years ended December 31, 2009, 2008 and 2007 .................................. 101 Consolidated Balance Sheets at December 31, 2009 and 2008......................................................................................... 102 Consolidated Statements of Equity for the years ended December 31, 2009, 2008 and 2007 .......................................... 104 Consolidated Statements of Comprehensive Income for the years ended December 31, 2009, 2008 and 2007............... 105 PPL Electric Utilities Corporation Consolidated Statements of Income for the years ended December 31, 2009, 2008 and 2007......................................... 106 Consolidated Statements of Cash Flows for the years ended December 31, 2009, 2008 and 2007 .................................. 107 Consolidated Balance Sheets at December 31, 2009 and 2008......................................................................................... 108 Consolidated Statements of Shareowners' Equity for the years ended December 31, 2009, 2008 and 2007.................... 110 COMBINED NOTES TO CONSOLIDATED FINANCIAL STATEMENTS 1. Summary of Significant Accounting Policies ..................................................................................................................... 111 2. Segment and Related Information ...................................................................................................................................... 123 3. Variable Interest Entities..................................................................................................................................................... 125 4. Earnings Per Share.............................................................................................................................................................. 125 5. Income and Other Taxes ..................................................................................................................................................... 126 6. Preferred Securities ............................................................................................................................................................. 131 7. Financing Activities ............................................................................................................................................................ 132 8. Acquisitions, Development and Divestitures ...................................................................................................................... 138 9. Discontinued Operations..................................................................................................................................................... 139 10. Leases................................................................................................................................................................................. 142 11. Stock-Based Compensation ............................................................................................................................................... 143 12. Retirement and Postemployment Benefits ......................................................................................................................... 146 13. Jointly Owned Facilities..................................................................................................................................................... 156 14. Commitments and Contingencies ...................................................................................................................................... 156 15. Related Party Transactions................................................................................................................................................. 170 16. Other Income - net ............................................................................................................................................................. 171 17. Fair Value Measurements and Credit Concentrations........................................................................................................ 172 18. Derivative Instruments and Hedging Activities ................................................................................................................. 177 19. Goodwill and Other Intangible Assets ............................................................................................................................... 185 20. Asset Retirement Obligations ............................................................................................................................................ 187 21. Available-for-Sale Securities ............................................................................................................................................. 188 22. New Accounting Guidance Pending Adoption .................................................................................................................. 190 SUPPLEMENTARY DATA Quarterly Financial, Common Stock Price and Dividend Data - PPL Corporation ................................................................... 192 Quarterly Financial Data - PPL Energy Supply, LLC................................................................................................................ 193 Quarterly Financial Data - PPL Electric Utilities Corporation .................................................................................................. 194
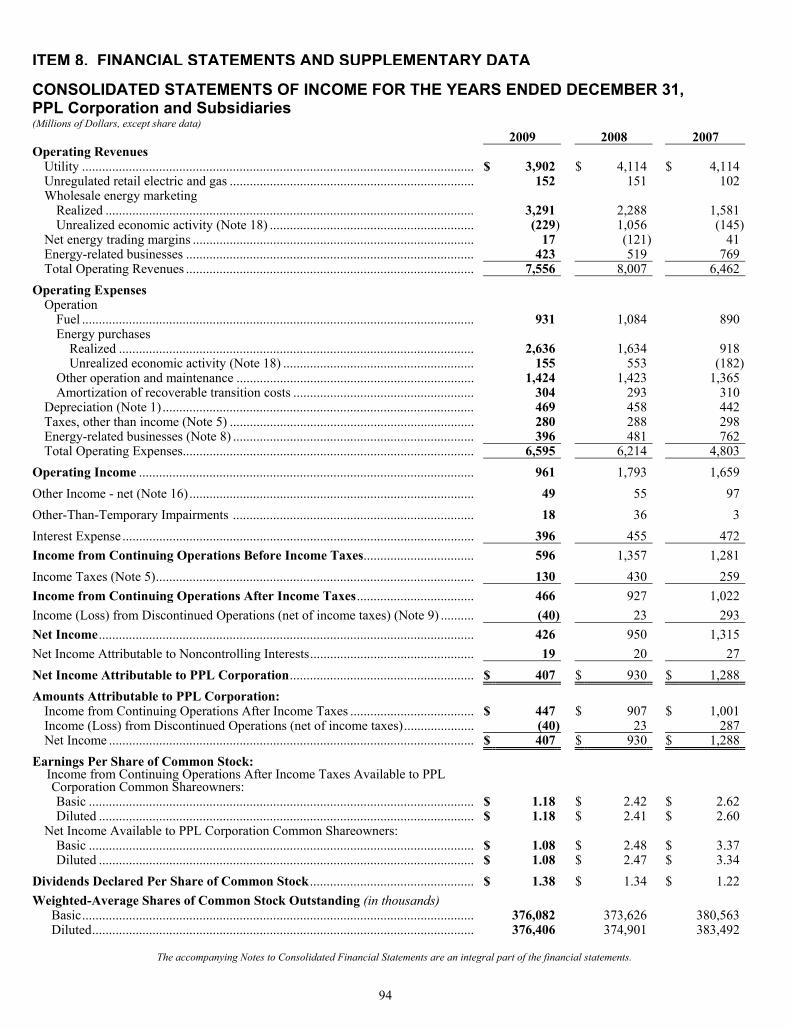
94
ITEM 8. FINANCIAL STATEMENTS AND SUPPLEMENTARY DATA
CONSOLIDATED STATEMENTS OF INCOME FOR THE YEARS ENDED DECEMBER 31, PPL Corporation and Subsidiaries (Millions of Dollars, except share data)
2009 2008 2007 Operating Revenues
Utility ..................................................................................................................... $ 3,902 $ 4,114 $ 4,114Unregulated retail electric and gas ......................................................................... 152 151 102Wholesale energy marketing
Realized .............................................................................................................. 3,291 2,288 1,581Unrealized economic activity (Note 18) ............................................................. (229) 1,056 (145)
Net energy trading margins .................................................................................... 17 (121) 41Energy-related businesses ...................................................................................... 423 519 769Total Operating Revenues ...................................................................................... 7,556 8,007 6,462
Operating Expenses Operation
Fuel ..................................................................................................................... 931 1,084 890Energy purchases
Realized .......................................................................................................... 2,636 1,634 918Unrealized economic activity (Note 18) ......................................................... 155 553 (182)
Other operation and maintenance ....................................................................... 1,424 1,423 1,365Amortization of recoverable transition costs ...................................................... 304 293 310
Depreciation (Note 1) ............................................................................................. 469 458 442Taxes, other than income (Note 5) ......................................................................... 280 288 298Energy-related businesses (Note 8) ........................................................................ 396 481 762Total Operating Expenses....................................................................................... 6,595 6,214 4,803
Operating Income .................................................................................................... 961 1,793 1,659Other Income - net (Note 16) ..................................................................................... 49 55 97Other-Than-Temporary Impairments ........................................................................ 18 36 3Interest Expense ......................................................................................................... 396 455 472Income from Continuing Operations Before Income Taxes................................. 596 1,357 1,281Income Taxes (Note 5)............................................................................................... 130 430 259Income from Continuing Operations After Income Taxes................................... 466 927 1,022Income (Loss) from Discontinued Operations (net of income taxes) (Note 9) .......... (40) 23 293Net Income................................................................................................................ 426 950 1,315Net Income Attributable to Noncontrolling Interests................................................. 19 20 27Net Income Attributable to PPL Corporation....................................................... $ 407 $ 930 $ 1,288Amounts Attributable to PPL Corporation:
Income from Continuing Operations After Income Taxes ..................................... $ 447 $ 907 $ 1,001Income (Loss) from Discontinued Operations (net of income taxes)..................... (40) 23 287Net Income ............................................................................................................. $ 407 $ 930 $ 1,288
Earnings Per Share of Common Stock: Income from Continuing Operations After Income Taxes Available to PPL Corporation Common Shareowners: Basic ................................................................................................................... $ 1.18 $ 2.42 $ 2.62Diluted ................................................................................................................ $ 1.18 $ 2.41 $ 2.60
Net Income Available to PPL Corporation Common Shareowners: Basic ................................................................................................................... $ 1.08 $ 2.48 $ 3.37Diluted ................................................................................................................ $ 1.08 $ 2.47 $ 3.34
Dividends Declared Per Share of Common Stock ................................................. $ 1.38 $ 1.34 $ 1.22Weighted-Average Shares of Common Stock Outstanding (in thousands)
Basic..................................................................................................................... 376,082 373,626 380,563Diluted.................................................................................................................. 376,406 374,901 383,492
The accompanying Notes to Consolidated Financial Statements are an integral part of the financial statements.
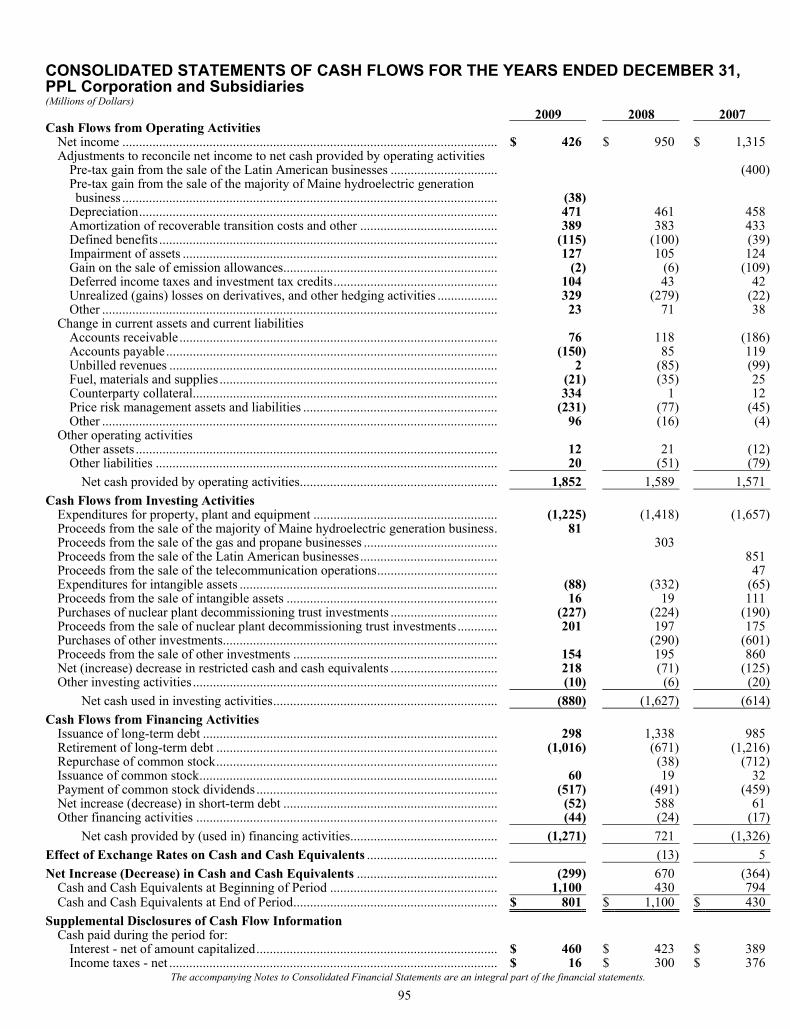
95
CONSOLIDATED STATEMENTS OF CASH FLOWS FOR THE YEARS ENDED DECEMBER 31, PPL Corporation and Subsidiaries (Millions of Dollars) 2009 2008 2007Cash Flows from Operating Activities
Net income ................................................................................................................ $ 426 $ 950 $ 1,315Adjustments to reconcile net income to net cash provided by operating activities
Pre-tax gain from the sale of the Latin American businesses ................................ (400)Pre-tax gain from the sale of the majority of Maine hydroelectric generation business ................................................................................................................ (38)
Depreciation........................................................................................................... 471 461 458Amortization of recoverable transition costs and other ......................................... 389 383 433Defined benefits ..................................................................................................... (115) (100) (39)Impairment of assets .............................................................................................. 127 105 124Gain on the sale of emission allowances................................................................ (2) (6) (109)Deferred income taxes and investment tax credits................................................. 104 43 42Unrealized (gains) losses on derivatives, and other hedging activities .................. 329 (279) (22)Other ...................................................................................................................... 23 71 38
Change in current assets and current liabilities Accounts receivable ............................................................................................... 76 118 (186)Accounts payable................................................................................................... (150) 85 119Unbilled revenues .................................................................................................. 2 (85) (99)Fuel, materials and supplies ................................................................................... (21) (35) 25Counterparty collateral........................................................................................... 334 1 12Price risk management assets and liabilities .......................................................... (231) (77) (45)Other ...................................................................................................................... 96 (16) (4)
Other operating activities Other assets ............................................................................................................ 12 21 (12)Other liabilities ...................................................................................................... 20 (51) (79)
Net cash provided by operating activities........................................................... 1,852 1,589 1,571Cash Flows from Investing Activities
Expenditures for property, plant and equipment ....................................................... (1,225) (1,418) (1,657)Proceeds from the sale of the majority of Maine hydroelectric generation business. 81 Proceeds from the sale of the gas and propane businesses ........................................ 303 Proceeds from the sale of the Latin American businesses......................................... 851Proceeds from the sale of the telecommunication operations.................................... 47Expenditures for intangible assets ............................................................................. (88) (332) (65)Proceeds from the sale of intangible assets ............................................................... 16 19 111Purchases of nuclear plant decommissioning trust investments ................................ (227) (224) (190)Proceeds from the sale of nuclear plant decommissioning trust investments............ 201 197 175Purchases of other investments.................................................................................. (290) (601)Proceeds from the sale of other investments ............................................................. 154 195 860Net (increase) decrease in restricted cash and cash equivalents ................................ 218 (71) (125)Other investing activities ........................................................................................... (10) (6) (20)
Net cash used in investing activities................................................................... (880) (1,627) (614)Cash Flows from Financing Activities
Issuance of long-term debt ........................................................................................ 298 1,338 985Retirement of long-term debt .................................................................................... (1,016) (671) (1,216)Repurchase of common stock.................................................................................... (38) (712)Issuance of common stock......................................................................................... 60 19 32Payment of common stock dividends........................................................................ (517) (491) (459)Net increase (decrease) in short-term debt ................................................................ (52) 588 61Other financing activities .......................................................................................... (44) (24) (17)
Net cash provided by (used in) financing activities............................................ (1,271) 721 (1,326)Effect of Exchange Rates on Cash and Cash Equivalents ....................................... (13) 5Net Increase (Decrease) in Cash and Cash Equivalents .......................................... (299) 670 (364)
Cash and Cash Equivalents at Beginning of Period .................................................. 1,100 430 794Cash and Cash Equivalents at End of Period............................................................. $ 801 $ 1,100 $ 430
Supplemental Disclosures of Cash Flow Information Cash paid during the period for:
Interest - net of amount capitalized........................................................................ $ 460 $ 423 $ 389Income taxes - net .................................................................................................. $ 16 $ 300 $ 376
The accompanying Notes to Consolidated Financial Statements are an integral part of the financial statements.
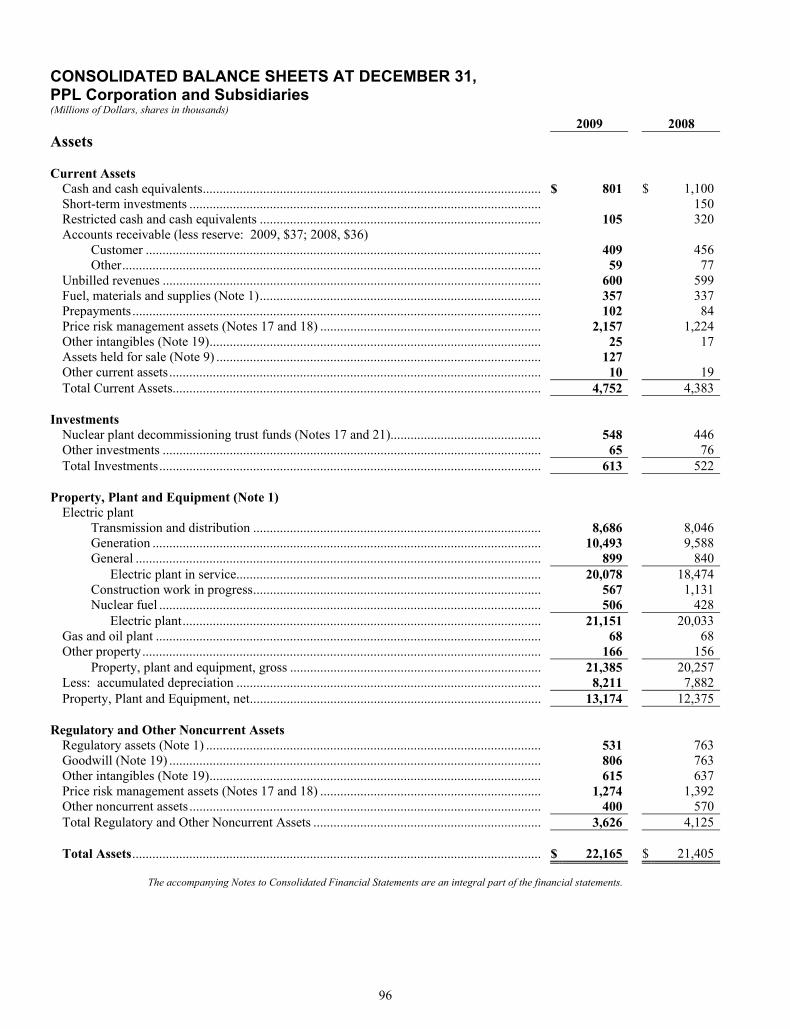
96
CONSOLIDATED BALANCE SHEETS AT DECEMBER 31, PPL Corporation and Subsidiaries (Millions of Dollars, shares in thousands) 2009 2008 Assets Current Assets
Cash and cash equivalents..................................................................................................... $ 801 $ 1,100Short-term investments ......................................................................................................... 150Restricted cash and cash equivalents .................................................................................... 105 320Accounts receivable (less reserve: 2009, $37; 2008, $36)
Customer ...................................................................................................................... 409 456Other............................................................................................................................. 59 77
Unbilled revenues ................................................................................................................. 600 599Fuel, materials and supplies (Note 1).................................................................................... 357 337Prepayments.......................................................................................................................... 102 84Price risk management assets (Notes 17 and 18) .................................................................. 2,157 1,224Other intangibles (Note 19)................................................................................................... 25 17Assets held for sale (Note 9) ................................................................................................. 127 Other current assets............................................................................................................... 10 19Total Current Assets.............................................................................................................. 4,752 4,383
Investments
Nuclear plant decommissioning trust funds (Notes 17 and 21)............................................. 548 446Other investments ................................................................................................................. 65 76Total Investments.................................................................................................................. 613 522
Property, Plant and Equipment (Note 1)
Electric plant Transmission and distribution ...................................................................................... 8,686 8,046Generation .................................................................................................................... 10,493 9,588General ......................................................................................................................... 899 840
Electric plant in service........................................................................................... 20,078 18,474Construction work in progress...................................................................................... 567 1,131Nuclear fuel .................................................................................................................. 506 428
Electric plant........................................................................................................... 21,151 20,033Gas and oil plant ................................................................................................................... 68 68Other property....................................................................................................................... 166 156
Property, plant and equipment, gross ........................................................................... 21,385 20,257Less: accumulated depreciation ........................................................................................... 8,211 7,882Property, Plant and Equipment, net....................................................................................... 13,174 12,375
Regulatory and Other Noncurrent Assets
Regulatory assets (Note 1) .................................................................................................... 531 763Goodwill (Note 19) ............................................................................................................... 806 763Other intangibles (Note 19)................................................................................................... 615 637Price risk management assets (Notes 17 and 18) .................................................................. 1,274 1,392Other noncurrent assets ......................................................................................................... 400 570Total Regulatory and Other Noncurrent Assets .................................................................... 3,626 4,125
Total Assets.......................................................................................................................... $ 22,165 $ 21,405
The accompanying Notes to Consolidated Financial Statements are an integral part of the financial statements.
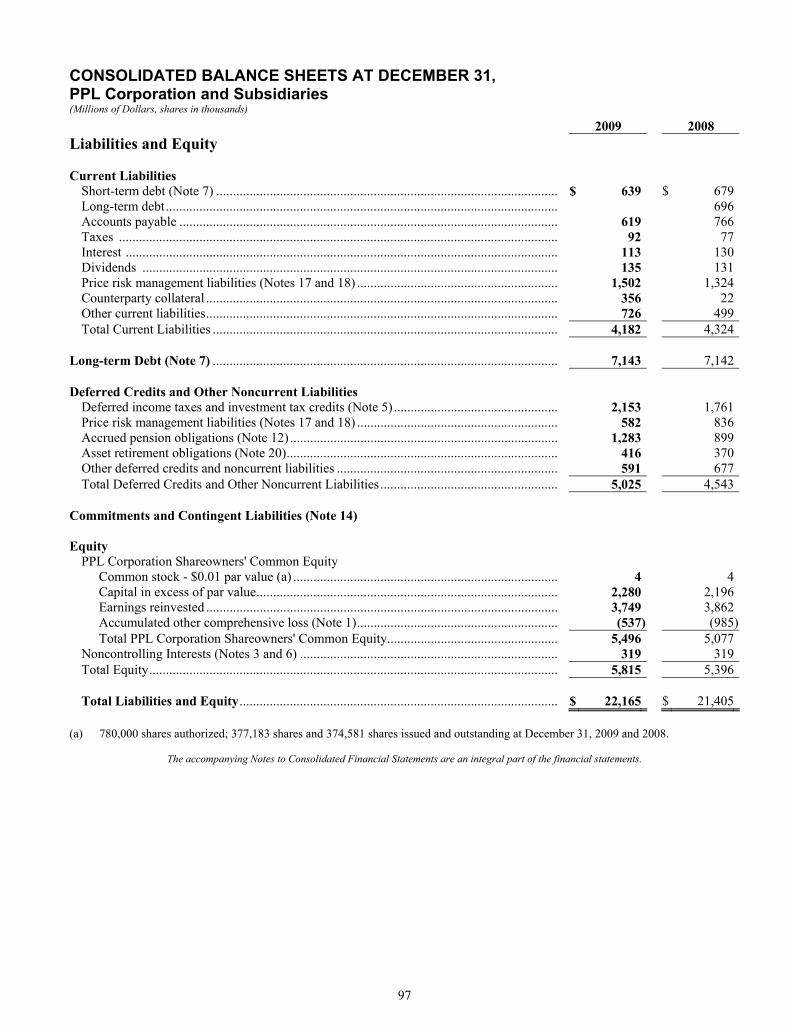
97
CONSOLIDATED BALANCE SHEETS AT DECEMBER 31, PPL Corporation and Subsidiaries (Millions of Dollars, shares in thousands)
2009 2008 Liabilities and Equity Current Liabilities
Short-term debt (Note 7) ...................................................................................................... $ 639 $ 679Long-term debt..................................................................................................................... 696Accounts payable ................................................................................................................. 619 766Taxes ................................................................................................................................... 92 77Interest ................................................................................................................................. 113 130Dividends ............................................................................................................................ 135 131Price risk management liabilities (Notes 17 and 18) ............................................................ 1,502 1,324Counterparty collateral ......................................................................................................... 356 22Other current liabilities......................................................................................................... 726 499Total Current Liabilities ....................................................................................................... 4,182 4,324
Long-term Debt (Note 7) ....................................................................................................... 7,143 7,142 Deferred Credits and Other Noncurrent Liabilities
Deferred income taxes and investment tax credits (Note 5)................................................. 2,153 1,761Price risk management liabilities (Notes 17 and 18) ............................................................ 582 836Accrued pension obligations (Note 12) ................................................................................ 1,283 899Asset retirement obligations (Note 20)................................................................................. 416 370Other deferred credits and noncurrent liabilities .................................................................. 591 677Total Deferred Credits and Other Noncurrent Liabilities..................................................... 5,025 4,543
Commitments and Contingent Liabilities (Note 14) Equity
PPL Corporation Shareowners' Common Equity Common stock - $0.01 par value (a) ............................................................................... 4 4Capital in excess of par value.......................................................................................... 2,280 2,196Earnings reinvested ......................................................................................................... 3,749 3,862Accumulated other comprehensive loss (Note 1)............................................................ (537) (985)Total PPL Corporation Shareowners' Common Equity................................................... 5,496 5,077
Noncontrolling Interests (Notes 3 and 6) ............................................................................. 319 319Total Equity.......................................................................................................................... 5,815 5,396 Total Liabilities and Equity............................................................................................... $ 22,165 $ 21,405
(a) 780,000 shares authorized; 377,183 shares and 374,581 shares issued and outstanding at December 31, 2009 and 2008.
The accompanying Notes to Consolidated Financial Statements are an integral part of the financial statements.
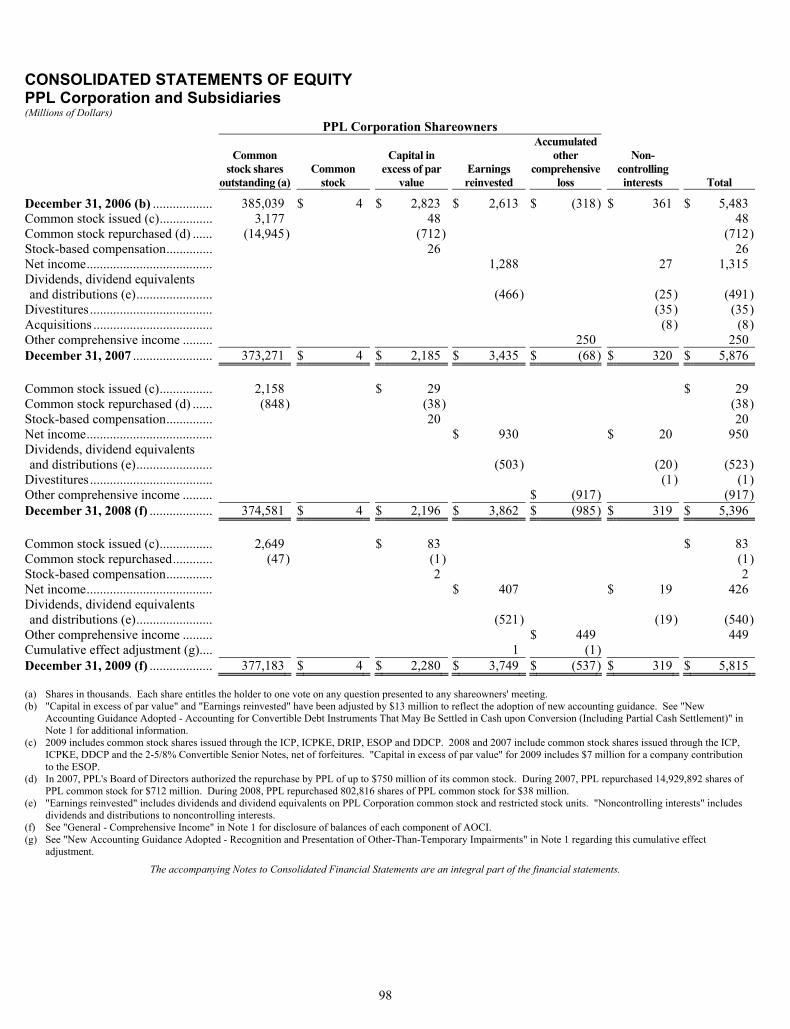
98
CONSOLIDATED STATEMENTS OF EQUITY PPL Corporation and Subsidiaries (Millions of Dollars)
PPL Corporation Shareowners
Common stock shares
outstanding (a) Common
stock
Capital in excess of par
value Earnings reinvested
Accumulated other
comprehensive loss
Non-controlling interests Total
December 31, 2006 (b) .................. 385,039 $ 4 $ 2,823 $ 2,613 $ (318 ) $ 361 $ 5,483Common stock issued (c)................ 3,177 48 48Common stock repurchased (d) ...... (14,945 ) (712) (712)Stock-based compensation.............. 26 26Net income...................................... 1,288 27 1,315Dividends, dividend equivalents and distributions (e)....................... (466) (25) (491)
Divestitures..................................... (35) (35)Acquisitions .................................... (8) (8)Other comprehensive income ......... 250 250December 31, 2007 ........................ 373,271 $ 4 $ 2,185 $ 3,435 $ (68 ) $ 320 $ 5,876 Common stock issued (c)................ 2,158 $ 29 $ 29Common stock repurchased (d) ...... (848 ) (38) (38)Stock-based compensation.............. 20 20Net income...................................... $ 930 $ 20 950Dividends, dividend equivalents and distributions (e)....................... (503) (20) (523)
Divestitures..................................... (1) (1)Other comprehensive income ......... $ (917 ) (917)December 31, 2008 (f) ................... 374,581 $ 4 $ 2,196 $ 3,862 $ (985 ) $ 319 $ 5,396 Common stock issued (c)................ 2,649 $ 83 $ 83Common stock repurchased............ (47 ) (1) (1)Stock-based compensation.............. 2 2Net income...................................... $ 407 $ 19 426Dividends, dividend equivalents and distributions (e)....................... (521) (19) (540)
Other comprehensive income ......... $ 449 449Cumulative effect adjustment (g).... 1 (1 ) December 31, 2009 (f) ................... 377,183 $ 4 $ 2,280 $ 3,749 $ (537 ) $ 319 $ 5,815 (a) Shares in thousands. Each share entitles the holder to one vote on any question presented to any shareowners' meeting. (b) "Capital in excess of par value" and "Earnings reinvested" have been adjusted by $13 million to reflect the adoption of new accounting guidance. See "New
Accounting Guidance Adopted - Accounting for Convertible Debt Instruments That May Be Settled in Cash upon Conversion (Including Partial Cash Settlement)" in Note 1 for additional information.
(c) 2009 includes common stock shares issued through the ICP, ICPKE, DRIP, ESOP and DDCP. 2008 and 2007 include common stock shares issued through the ICP, ICPKE, DDCP and the 2-5/8% Convertible Senior Notes, net of forfeitures. "Capital in excess of par value" for 2009 includes $7 million for a company contribution to the ESOP.
(d) In 2007, PPL's Board of Directors authorized the repurchase by PPL of up to $750 million of its common stock. During 2007, PPL repurchased 14,929,892 shares of PPL common stock for $712 million. During 2008, PPL repurchased 802,816 shares of PPL common stock for $38 million.
(e) "Earnings reinvested" includes dividends and dividend equivalents on PPL Corporation common stock and restricted stock units. "Noncontrolling interests" includes dividends and distributions to noncontrolling interests.
(f) See "General - Comprehensive Income" in Note 1 for disclosure of balances of each component of AOCI. (g) See "New Accounting Guidance Adopted - Recognition and Presentation of Other-Than-Temporary Impairments" in Note 1 regarding this cumulative effect
adjustment.
The accompanying Notes to Consolidated Financial Statements are an integral part of the financial statements.
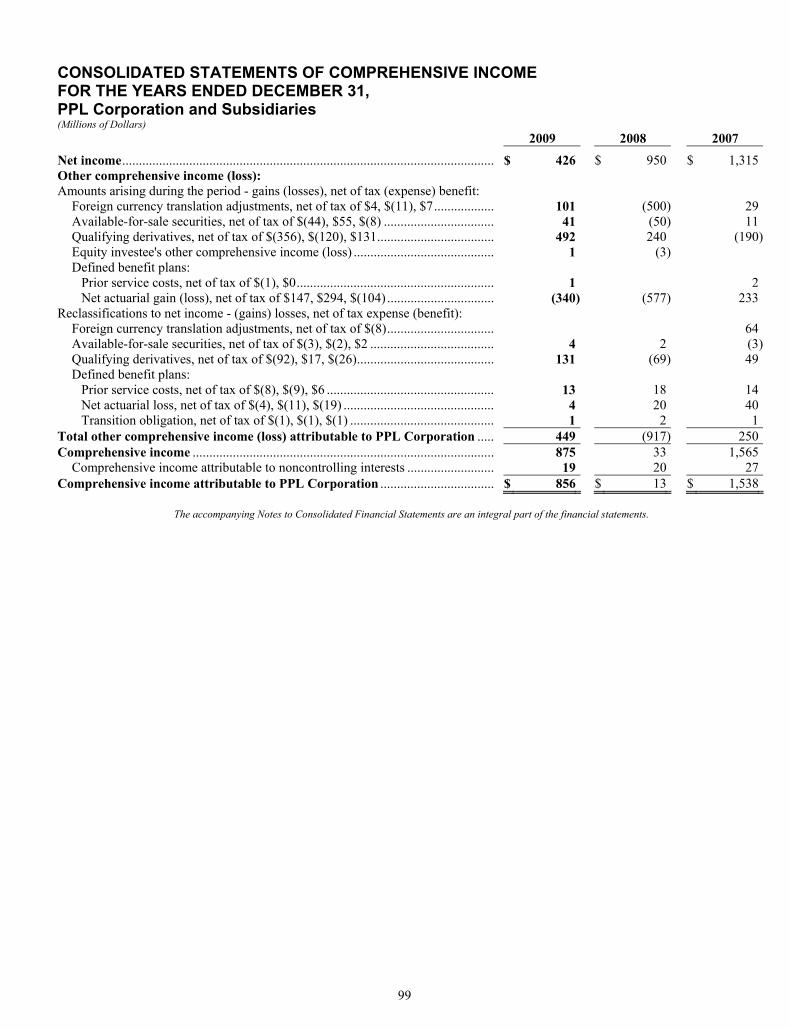
99
CONSOLIDATED STATEMENTS OF COMPREHENSIVE INCOME FOR THE YEARS ENDED DECEMBER 31, PPL Corporation and Subsidiaries (Millions of Dollars) 2009 2008 2007
Net income............................................................................................................... $ 426 $ 950 $ 1,315Other comprehensive income (loss): Amounts arising during the period - gains (losses), net of tax (expense) benefit:
Foreign currency translation adjustments, net of tax of $4, $(11), $7.................. 101 (500) 29Available-for-sale securities, net of tax of $(44), $55, $(8) ................................. 41 (50) 11Qualifying derivatives, net of tax of $(356), $(120), $131................................... 492 240 (190)Equity investee's other comprehensive income (loss) .......................................... 1 (3) Defined benefit plans:
Prior service costs, net of tax of $(1), $0........................................................... 1 2Net actuarial gain (loss), net of tax of $147, $294, $(104) ................................ (340) (577) 233
Reclassifications to net income - (gains) losses, net of tax expense (benefit): Foreign currency translation adjustments, net of tax of $(8)................................ 64Available-for-sale securities, net of tax of $(3), $(2), $2 ..................................... 4 2 (3)Qualifying derivatives, net of tax of $(92), $17, $(26)......................................... 131 (69) 49Defined benefit plans:
Prior service costs, net of tax of $(8), $(9), $6 .................................................. 13 18 14Net actuarial loss, net of tax of $(4), $(11), $(19) ............................................. 4 20 40Transition obligation, net of tax of $(1), $(1), $(1) ........................................... 1 2 1
Total other comprehensive income (loss) attributable to PPL Corporation ..... 449 (917) 250Comprehensive income .......................................................................................... 875 33 1,565
Comprehensive income attributable to noncontrolling interests .......................... 19 20 27Comprehensive income attributable to PPL Corporation .................................. $ 856 $ 13 $ 1,538
The accompanying Notes to Consolidated Financial Statements are an integral part of the financial statements.
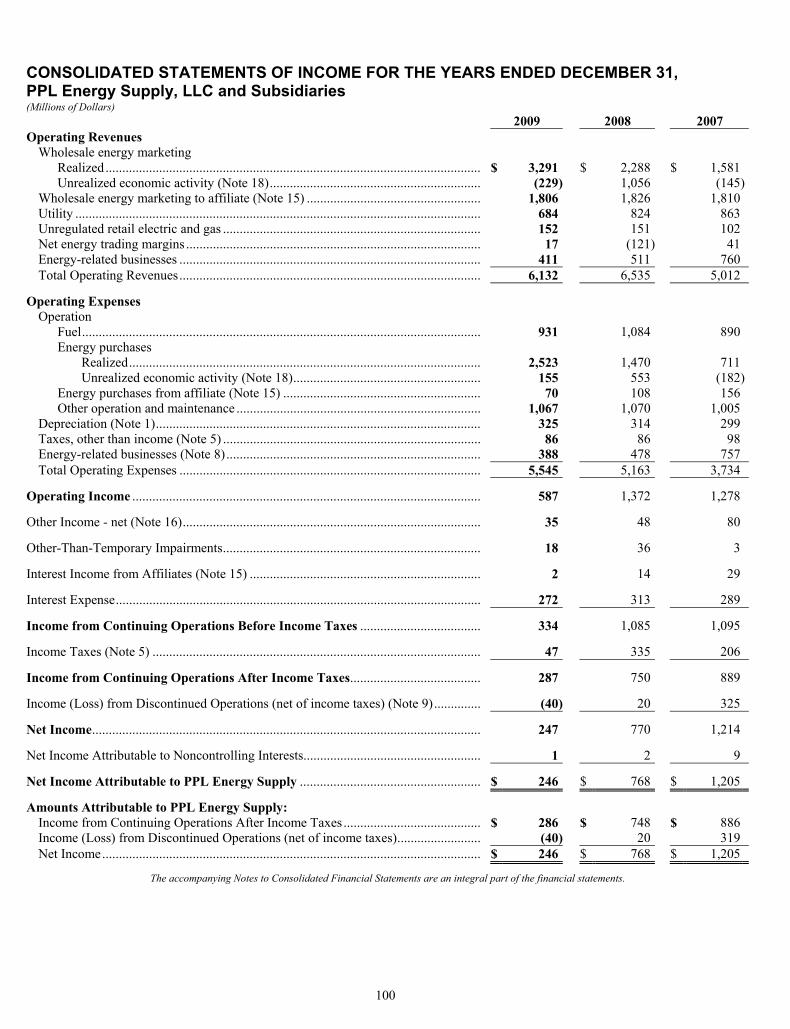
100
CONSOLIDATED STATEMENTS OF INCOME FOR THE YEARS ENDED DECEMBER 31, PPL Energy Supply, LLC and Subsidiaries (Millions of Dollars) 2009 2008 2007 Operating Revenues
Wholesale energy marketing Realized................................................................................................................ $ 3,291 $ 2,288 $ 1,581 Unrealized economic activity (Note 18)............................................................... (229) 1,056 (145)
Wholesale energy marketing to affiliate (Note 15) .................................................... 1,806 1,826 1,810 Utility ......................................................................................................................... 684 824 863 Unregulated retail electric and gas ............................................................................. 152 151 102 Net energy trading margins ........................................................................................ 17 (121) 41 Energy-related businesses .......................................................................................... 411 511 760 Total Operating Revenues.......................................................................................... 6,132 6,535 5,012
Operating Expenses Operation
Fuel....................................................................................................................... 931 1,084 890 Energy purchases
Realized......................................................................................................... 2,523 1,470 711 Unrealized economic activity (Note 18)........................................................ 155 553 (182)
Energy purchases from affiliate (Note 15) ........................................................... 70 108 156 Other operation and maintenance ......................................................................... 1,067 1,070 1,005
Depreciation (Note 1)................................................................................................. 325 314 299 Taxes, other than income (Note 5) ............................................................................. 86 86 98 Energy-related businesses (Note 8)............................................................................ 388 478 757 Total Operating Expenses .......................................................................................... 5,545 5,163 3,734
Operating Income ........................................................................................................ 587 1,372 1,278
Other Income - net (Note 16)......................................................................................... 35 48 80
Other-Than-Temporary Impairments............................................................................. 18 36 3
Interest Income from Affiliates (Note 15) ..................................................................... 2 14 29
Interest Expense............................................................................................................. 272 313 289
Income from Continuing Operations Before Income Taxes .................................... 334 1,085 1,095
Income Taxes (Note 5) .................................................................................................. 47 335 206
Income from Continuing Operations After Income Taxes....................................... 287 750 889
Income (Loss) from Discontinued Operations (net of income taxes) (Note 9).............. (40) 20 325
Net Income.................................................................................................................... 247 770 1,214
Net Income Attributable to Noncontrolling Interests..................................................... 1 2 9
Net Income Attributable to PPL Energy Supply ...................................................... $ 246 $ 768 $ 1,205
Amounts Attributable to PPL Energy Supply: Income from Continuing Operations After Income Taxes ......................................... $ 286 $ 748 $ 886 Income (Loss) from Discontinued Operations (net of income taxes)......................... (40) 20 319 Net Income................................................................................................................. $ 246 $ 768 $ 1,205
The accompanying Notes to Consolidated Financial Statements are an integral part of the financial statements.
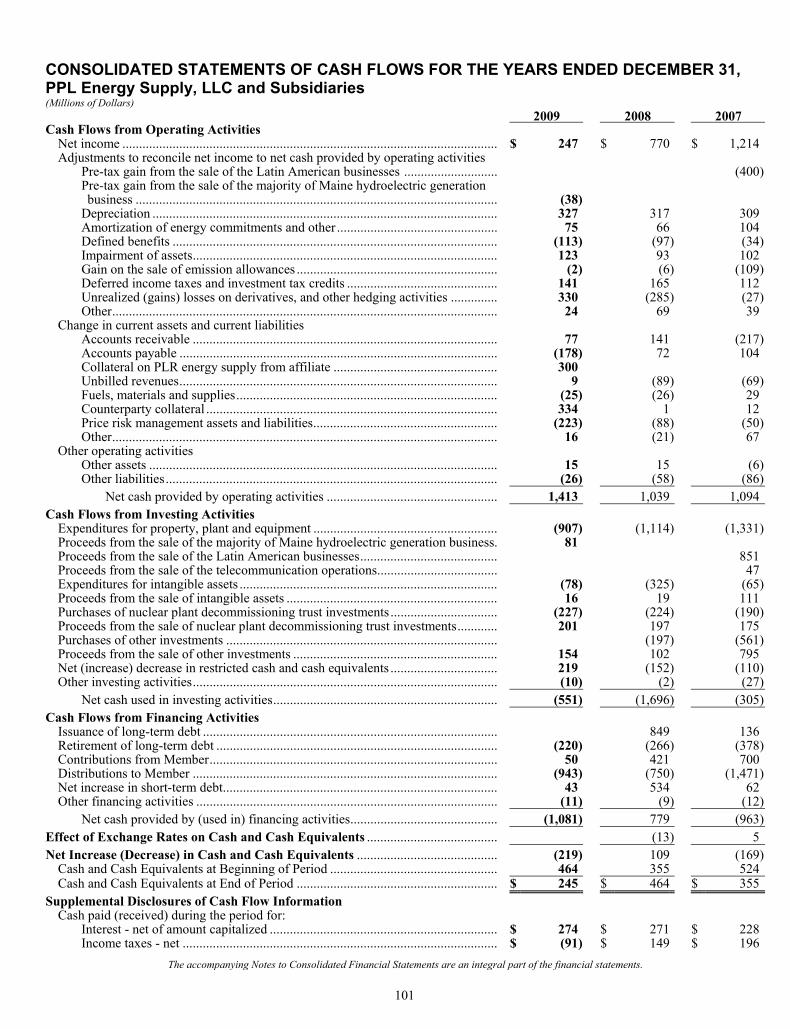
101
CONSOLIDATED STATEMENTS OF CASH FLOWS FOR THE YEARS ENDED DECEMBER 31, PPL Energy Supply, LLC and Subsidiaries (Millions of Dollars) 2009 2008 2007Cash Flows from Operating Activities
Net income ................................................................................................................ $ 247 $ 770 $ 1,214Adjustments to reconcile net income to net cash provided by operating activities
Pre-tax gain from the sale of the Latin American businesses ............................ (400)Pre-tax gain from the sale of the majority of Maine hydroelectric generation business ............................................................................................................ (38)
Depreciation ....................................................................................................... 327 317 309Amortization of energy commitments and other ................................................ 75 66 104Defined benefits ................................................................................................. (113) (97) (34)Impairment of assets........................................................................................... 123 93 102Gain on the sale of emission allowances ............................................................ (2) (6) (109)Deferred income taxes and investment tax credits ............................................. 141 165 112Unrealized (gains) losses on derivatives, and other hedging activities .............. 330 (285) (27)Other................................................................................................................... 24 69 39
Change in current assets and current liabilities Accounts receivable ........................................................................................... 77 141 (217)Accounts payable ............................................................................................... (178) 72 104Collateral on PLR energy supply from affiliate ................................................. 300 Unbilled revenues............................................................................................... 9 (89) (69)Fuels, materials and supplies.............................................................................. (25) (26) 29Counterparty collateral ....................................................................................... 334 1 12Price risk management assets and liabilities....................................................... (223) (88) (50)Other................................................................................................................... 16 (21) 67
Other operating activities Other assets ........................................................................................................ 15 15 (6)Other liabilities................................................................................................... (26) (58) (86)
Net cash provided by operating activities ................................................... 1,413 1,039 1,094Cash Flows from Investing Activities
Expenditures for property, plant and equipment ....................................................... (907) (1,114) (1,331)Proceeds from the sale of the majority of Maine hydroelectric generation business. 81 Proceeds from the sale of the Latin American businesses......................................... 851Proceeds from the sale of the telecommunication operations.................................... 47Expenditures for intangible assets ............................................................................. (78) (325) (65)Proceeds from the sale of intangible assets ............................................................... 16 19 111Purchases of nuclear plant decommissioning trust investments ................................ (227) (224) (190)Proceeds from the sale of nuclear plant decommissioning trust investments............ 201 197 175Purchases of other investments ................................................................................. (197) (561)Proceeds from the sale of other investments ............................................................. 154 102 795Net (increase) decrease in restricted cash and cash equivalents ................................ 219 (152) (110)Other investing activities........................................................................................... (10) (2) (27)
Net cash used in investing activities................................................................... (551) (1,696) (305)Cash Flows from Financing Activities
Issuance of long-term debt ........................................................................................ 849 136Retirement of long-term debt .................................................................................... (220) (266) (378)Contributions from Member...................................................................................... 50 421 700Distributions to Member ........................................................................................... (943) (750) (1,471)Net increase in short-term debt.................................................................................. 43 534 62Other financing activities .......................................................................................... (11) (9) (12)
Net cash provided by (used in) financing activities............................................ (1,081) 779 (963)Effect of Exchange Rates on Cash and Cash Equivalents ....................................... (13) 5Net Increase (Decrease) in Cash and Cash Equivalents .......................................... (219) 109 (169)
Cash and Cash Equivalents at Beginning of Period .................................................. 464 355 524Cash and Cash Equivalents at End of Period ............................................................ $ 245 $ 464 $ 355
Supplemental Disclosures of Cash Flow Information Cash paid (received) during the period for:
Interest - net of amount capitalized .................................................................... $ 274 $ 271 $ 228Income taxes - net .............................................................................................. $ (91) $ 149 $ 196
The accompanying Notes to Consolidated Financial Statements are an integral part of the financial statements.

102
CONSOLIDATED BALANCE SHEETS AT DECEMBER 31, PPL Energy Supply, LLC and Subsidiaries (Millions of Dollars) 2009 2008 Assets Current Assets
Cash and cash equivalents............................................................................................. $ 245 $ 464Short-term investments.................................................................................................. 150Restricted cash and cash equivalents............................................................................. 99 315Accounts receivable (less reserve: 2009, $21; 2008, $21)
Customer .................................................................................................................. 168 220Other......................................................................................................................... 31 66
Unbilled revenues.......................................................................................................... 402 408Accounts receivable from affiliates............................................................................... 165 159Collateral on PLR energy supply to affiliate (Note 15)................................................. 300Fuel, materials and supplies (Note 1) ............................................................................ 325 301Prepayments .................................................................................................................. 56 71Price risk management assets (Notes 17 and 18)........................................................... 2,147 1,221Other intangibles (Note 19)........................................................................................... 25 17Assets held for sale (Note 9) ......................................................................................... 127 Other current assets ....................................................................................................... 1 6Total Current Assets...................................................................................................... 3,791 3,698
Investments
Nuclear plant decommissioning trust funds (Notes 17 and 21)..................................... 548 446Other investments.......................................................................................................... 58 68Total Investments .......................................................................................................... 606 514
Property, Plant and Equipment (Note 1)
Electric plant Transmission and distribution .................................................................................. 4,024 3,540Generation ................................................................................................................ 10,493 9,588General ..................................................................................................................... 285 286
Electric plant in service....................................................................................... 14,802 13,414Construction work in progress.................................................................................. 422 1,031Nuclear fuel .............................................................................................................. 506 428
Electric plant....................................................................................................... 15,730 14,873Gas and oil plant............................................................................................................ 68 68Other property ............................................................................................................... 164 154
Property, plant and equipment, gross ....................................................................... 15,962 15,095Less: accumulated depreciation.................................................................................... 6,169 5,935Property, Plant and Equipment, net............................................................................... 9,793 9,160
Other Noncurrent Assets
Goodwill (Note 19) ....................................................................................................... 806 763Other intangibles (Note 19)........................................................................................... 477 507Price risk management assets (Notes 17 and 18)........................................................... 1,234 1,346Other noncurrent assets ................................................................................................. 317 481Total Other Noncurrent Assets...................................................................................... 2,834 3,097 Total Assets .................................................................................................................. $ 17,024 $ 16,469
The accompanying Notes to Consolidated Financial Statements are an integral part of the financial statements.
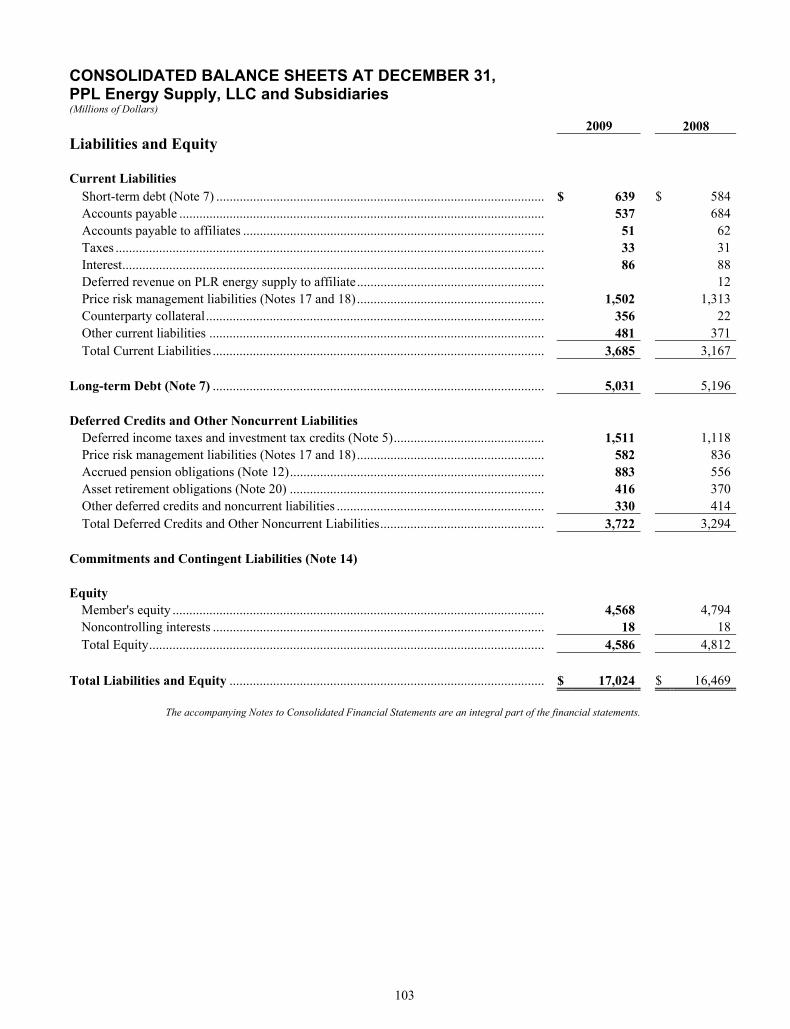
103
CONSOLIDATED BALANCE SHEETS AT DECEMBER 31, PPL Energy Supply, LLC and Subsidiaries (Millions of Dollars) 2009 2008 Liabilities and Equity Current Liabilities
Short-term debt (Note 7) .................................................................................................. $ 639 $ 584Accounts payable ............................................................................................................. 537 684Accounts payable to affiliates .......................................................................................... 51 62Taxes ................................................................................................................................ 33 31Interest.............................................................................................................................. 86 88Deferred revenue on PLR energy supply to affiliate........................................................ 12Price risk management liabilities (Notes 17 and 18)........................................................ 1,502 1,313Counterparty collateral..................................................................................................... 356 22Other current liabilities .................................................................................................... 481 371Total Current Liabilities ................................................................................................... 3,685 3,167
Long-term Debt (Note 7) ................................................................................................... 5,031 5,196 Deferred Credits and Other Noncurrent Liabilities
Deferred income taxes and investment tax credits (Note 5)............................................. 1,511 1,118Price risk management liabilities (Notes 17 and 18)........................................................ 582 836Accrued pension obligations (Note 12)............................................................................ 883 556Asset retirement obligations (Note 20) ............................................................................ 416 370Other deferred credits and noncurrent liabilities .............................................................. 330 414Total Deferred Credits and Other Noncurrent Liabilities................................................. 3,722 3,294
Commitments and Contingent Liabilities (Note 14) Equity
Member's equity ............................................................................................................... 4,568 4,794Noncontrolling interests ................................................................................................... 18 18Total Equity...................................................................................................................... 4,586 4,812
Total Liabilities and Equity .............................................................................................. $ 17,024 $ 16,469
The accompanying Notes to Consolidated Financial Statements are an integral part of the financial statements.
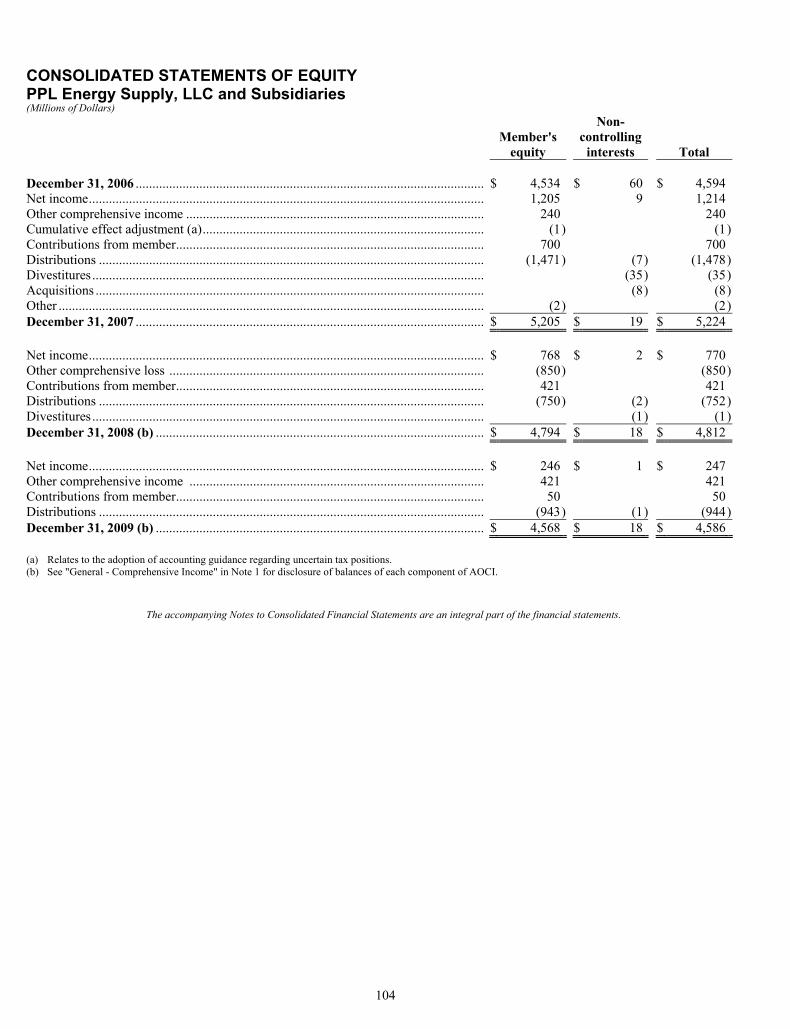
104
CONSOLIDATED STATEMENTS OF EQUITY PPL Energy Supply, LLC and Subsidiaries (Millions of Dollars)
Member's
equity
Non-controlling
interests Total December 31, 2006 ........................................................................................................ $ 4,534 $ 60 $ 4,594Net income...................................................................................................................... 1,205 9 1,214Other comprehensive income ......................................................................................... 240 240Cumulative effect adjustment (a).................................................................................... (1 ) (1)Contributions from member............................................................................................ 700 700Distributions ................................................................................................................... (1,471 ) (7) (1,478)Divestitures..................................................................................................................... (35) (35)Acquisitions .................................................................................................................... (8) (8)Other ............................................................................................................................... (2 ) (2)December 31, 2007 ........................................................................................................ $ 5,205 $ 19 $ 5,224 Net income...................................................................................................................... $ 768 $ 2 $ 770Other comprehensive loss .............................................................................................. (850 ) (850)Contributions from member............................................................................................ 421 421Distributions ................................................................................................................... (750 ) (2) (752)Divestitures..................................................................................................................... (1) (1)December 31, 2008 (b) .................................................................................................. $ 4,794 $ 18 $ 4,812 Net income...................................................................................................................... $ 246 $ 1 $ 247Other comprehensive income ........................................................................................ 421 421Contributions from member............................................................................................ 50 50Distributions ................................................................................................................... (943 ) (1) (944)December 31, 2009 (b) .................................................................................................. $ 4,568 $ 18 $ 4,586 (a) Relates to the adoption of accounting guidance regarding uncertain tax positions. (b) See "General - Comprehensive Income" in Note 1 for disclosure of balances of each component of AOCI.
The accompanying Notes to Consolidated Financial Statements are an integral part of the financial statements.
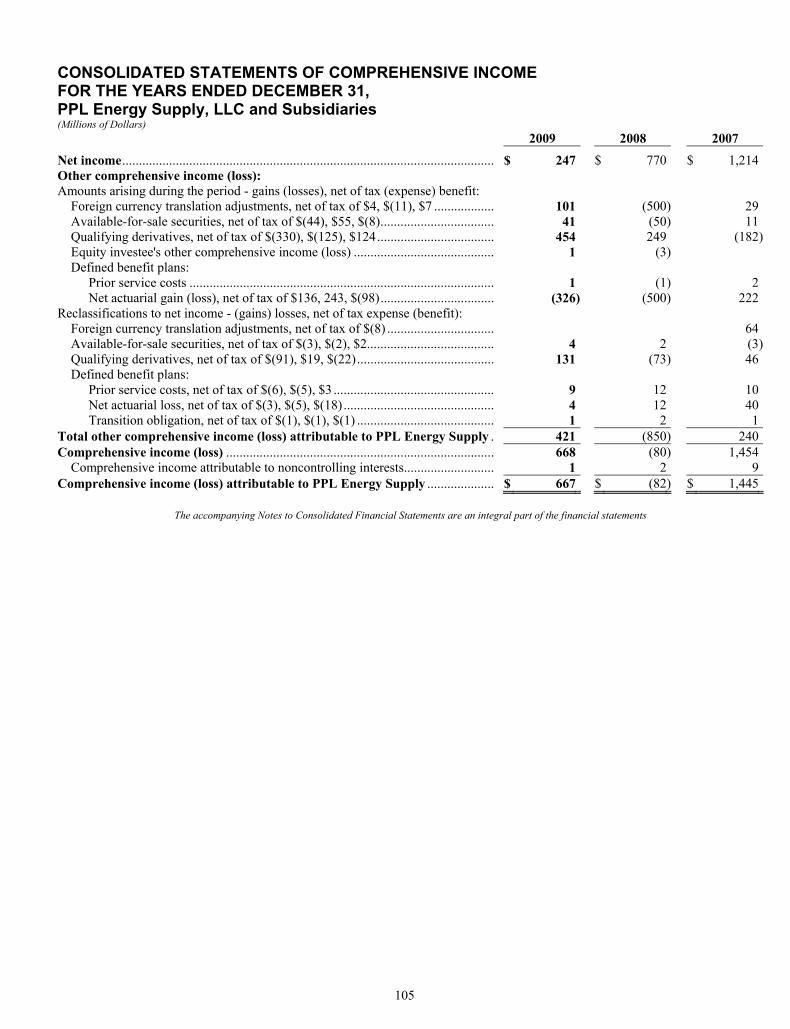
105
CONSOLIDATED STATEMENTS OF COMPREHENSIVE INCOME FOR THE YEARS ENDED DECEMBER 31, PPL Energy Supply, LLC and Subsidiaries (Millions of Dollars) 2009 2008 2007
Net income............................................................................................................... $ 247 $ 770 $ 1,214Other comprehensive income (loss): Amounts arising during the period - gains (losses), net of tax (expense) benefit:
Foreign currency translation adjustments, net of tax of $4, $(11), $7 .................. 101 (500) 29Available-for-sale securities, net of tax of $(44), $55, $(8).................................. 41 (50) 11Qualifying derivatives, net of tax of $(330), $(125), $124................................... 454 249 (182)Equity investee's other comprehensive income (loss) .......................................... 1 (3) Defined benefit plans:
Prior service costs ........................................................................................... 1 (1) 2Net actuarial gain (loss), net of tax of $136, 243, $(98).................................. (326) (500) 222
Reclassifications to net income - (gains) losses, net of tax expense (benefit): Foreign currency translation adjustments, net of tax of $(8) ................................ 64Available-for-sale securities, net of tax of $(3), $(2), $2...................................... 4 2 (3)Qualifying derivatives, net of tax of $(91), $19, $(22)......................................... 131 (73) 46Defined benefit plans:
Prior service costs, net of tax of $(6), $(5), $3 ................................................ 9 12 10Net actuarial loss, net of tax of $(3), $(5), $(18) ............................................. 4 12 40Transition obligation, net of tax of $(1), $(1), $(1) ......................................... 1 2 1
Total other comprehensive income (loss) attributable to PPL Energy Supply . 421 (850) 240Comprehensive income (loss) ................................................................................ 668 (80) 1,454
Comprehensive income attributable to noncontrolling interests........................... 1 2 9Comprehensive income (loss) attributable to PPL Energy Supply .................... $ 667 $ (82) $ 1,445
The accompanying Notes to Consolidated Financial Statements are an integral part of the financial statements
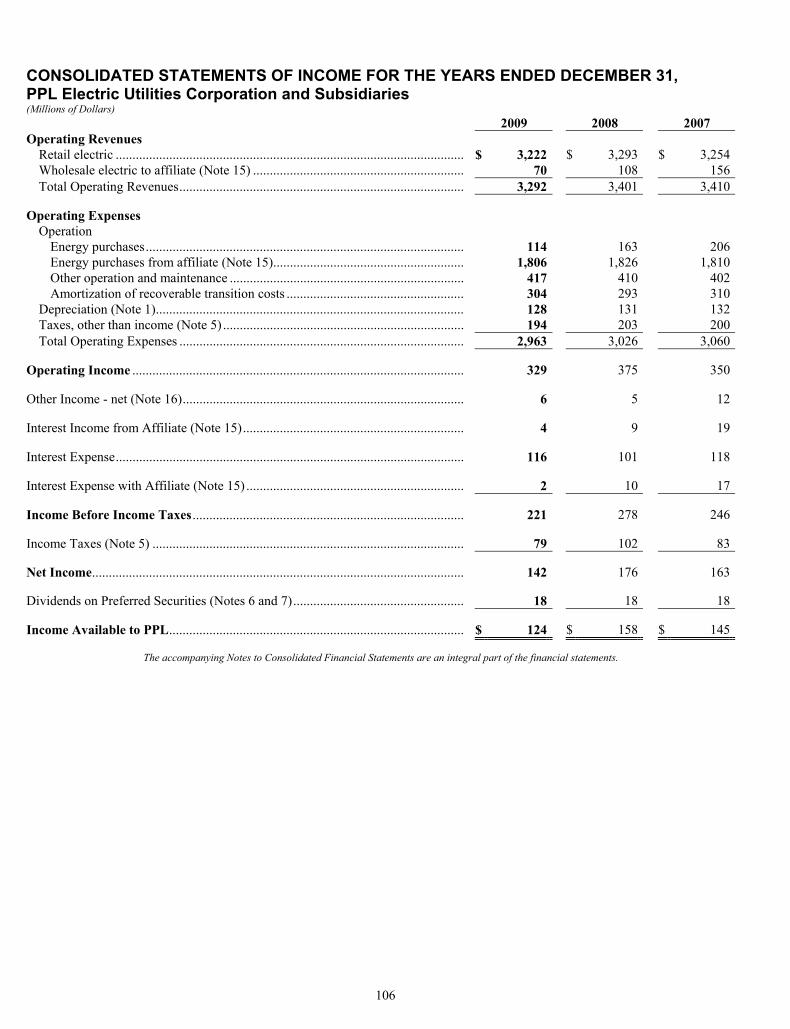
106
CONSOLIDATED STATEMENTS OF INCOME FOR THE YEARS ENDED DECEMBER 31, PPL Electric Utilities Corporation and Subsidiaries (Millions of Dollars) 2009 2008 2007 Operating Revenues
Retail electric ......................................................................................................... $ 3,222 $ 3,293 $ 3,254Wholesale electric to affiliate (Note 15) ................................................................ 70 108 156Total Operating Revenues...................................................................................... 3,292 3,401 3,410
Operating Expenses
Operation Energy purchases................................................................................................ 114 163 206Energy purchases from affiliate (Note 15).......................................................... 1,806 1,826 1,810Other operation and maintenance ....................................................................... 417 410 402Amortization of recoverable transition costs ...................................................... 304 293 310
Depreciation (Note 1)............................................................................................. 128 131 132Taxes, other than income (Note 5) ......................................................................... 194 203 200Total Operating Expenses ...................................................................................... 2,963 3,026 3,060
Operating Income .................................................................................................... 329 375 350 Other Income - net (Note 16)..................................................................................... 6 5 12 Interest Income from Affiliate (Note 15)................................................................... 4 9 19 Interest Expense......................................................................................................... 116 101 118 Interest Expense with Affiliate (Note 15) .................................................................. 2 10 17 Income Before Income Taxes .................................................................................. 221 278 246 Income Taxes (Note 5) .............................................................................................. 79 102 83 Net Income................................................................................................................ 142 176 163 Dividends on Preferred Securities (Notes 6 and 7).................................................... 18 18 18 Income Available to PPL......................................................................................... $ 124 $ 158 $ 145
The accompanying Notes to Consolidated Financial Statements are an integral part of the financial statements.
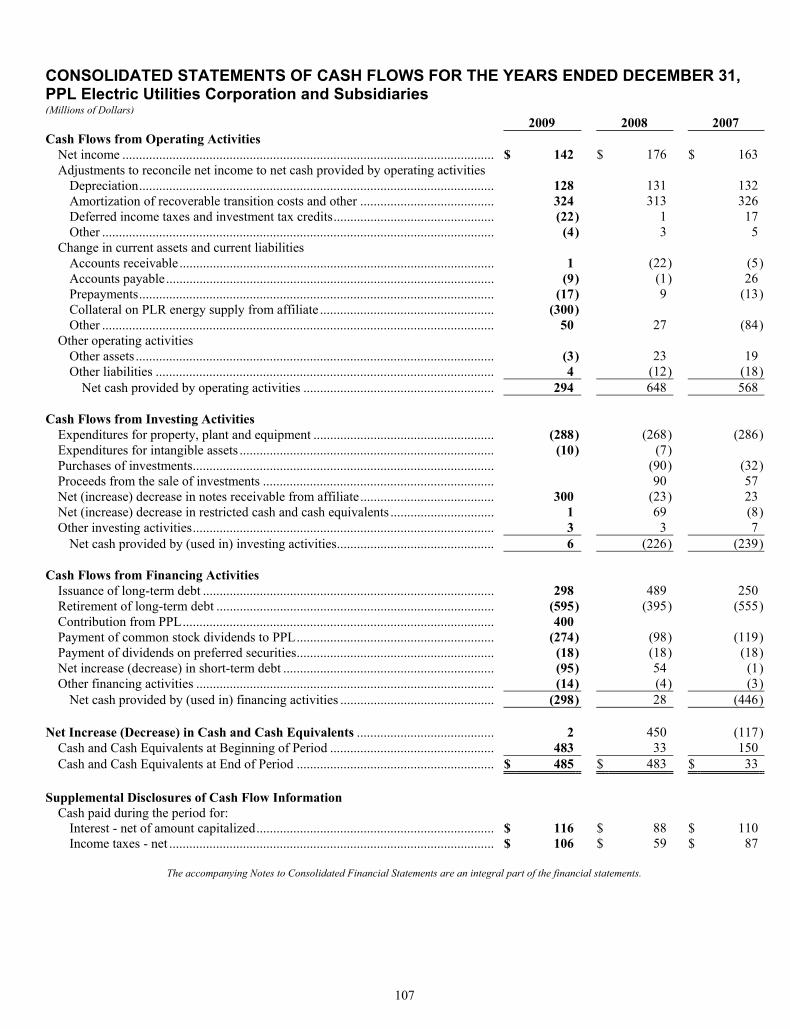
107
CONSOLIDATED STATEMENTS OF CASH FLOWS FOR THE YEARS ENDED DECEMBER 31, PPL Electric Utilities Corporation and Subsidiaries (Millions of Dollars) 2009 2008 2007 Cash Flows from Operating Activities
Net income ............................................................................................................... $ 142 $ 176 $ 163Adjustments to reconcile net income to net cash provided by operating activities
Depreciation.......................................................................................................... 128 131 132Amortization of recoverable transition costs and other ........................................ 324 313 326Deferred income taxes and investment tax credits................................................ (22 ) 1 17Other ..................................................................................................................... (4 ) 3 5
Change in current assets and current liabilities Accounts receivable .............................................................................................. 1 (22) (5)Accounts payable.................................................................................................. (9 ) (1) 26Prepayments.......................................................................................................... (17 ) 9 (13)Collateral on PLR energy supply from affiliate .................................................... (300 ) Other ..................................................................................................................... 50 27 (84)
Other operating activities Other assets ........................................................................................................... (3 ) 23 19Other liabilities ..................................................................................................... 4 (12) (18)
Net cash provided by operating activities ......................................................... 294 648 568 Cash Flows from Investing Activities
Expenditures for property, plant and equipment ...................................................... (288 ) (268) (286)Expenditures for intangible assets ............................................................................ (10 ) (7) Purchases of investments.......................................................................................... (90) (32)Proceeds from the sale of investments ..................................................................... 90 57Net (increase) decrease in notes receivable from affiliate ........................................ 300 (23) 23Net (increase) decrease in restricted cash and cash equivalents ............................... 1 69 (8)Other investing activities.......................................................................................... 3 3 7
Net cash provided by (used in) investing activities............................................... 6 (226) (239) Cash Flows from Financing Activities
Issuance of long-term debt ....................................................................................... 298 489 250Retirement of long-term debt ................................................................................... (595 ) (395) (555)Contribution from PPL............................................................................................. 400 Payment of common stock dividends to PPL........................................................... (274 ) (98) (119)Payment of dividends on preferred securities........................................................... (18 ) (18) (18)Net increase (decrease) in short-term debt ............................................................... (95 ) 54 (1)Other financing activities ......................................................................................... (14 ) (4) (3)
Net cash provided by (used in) financing activities .............................................. (298 ) 28 (446) Net Increase (Decrease) in Cash and Cash Equivalents ......................................... 2 450 (117)
Cash and Cash Equivalents at Beginning of Period ................................................. 483 33 150Cash and Cash Equivalents at End of Period ........................................................... $ 485 $ 483 $ 33
Supplemental Disclosures of Cash Flow Information
Cash paid during the period for: Interest - net of amount capitalized....................................................................... $ 116 $ 88 $ 110Income taxes - net ................................................................................................. $ 106 $ 59 $ 87
The accompanying Notes to Consolidated Financial Statements are an integral part of the financial statements.
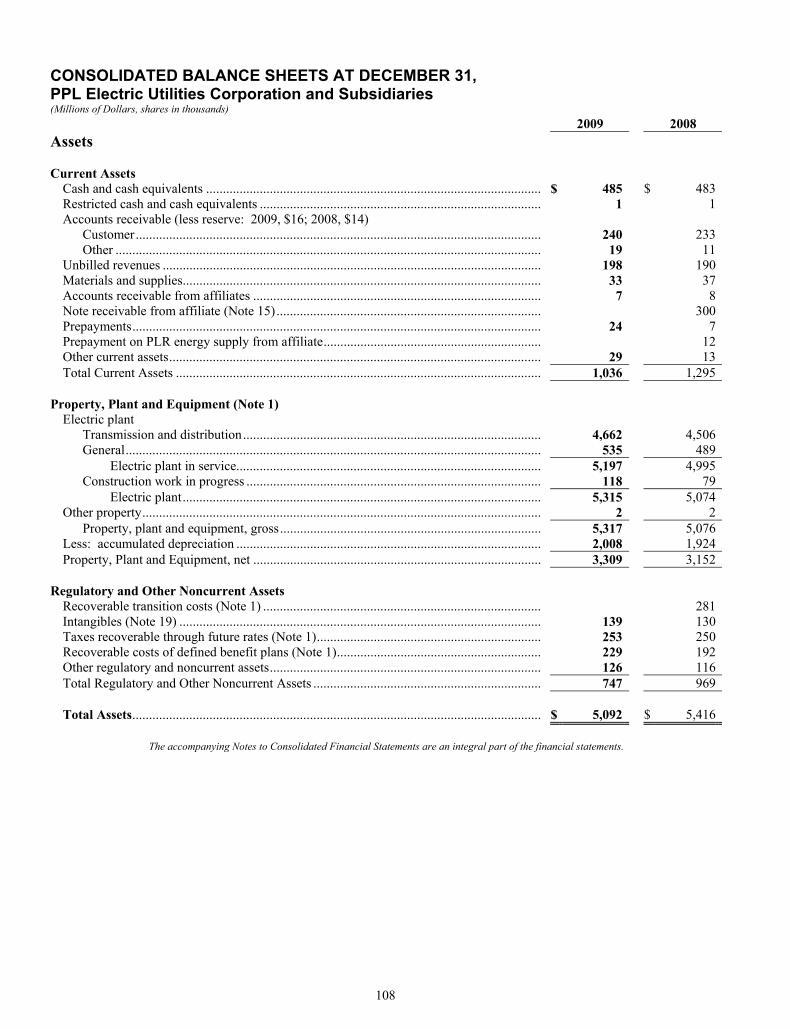
108
CONSOLIDATED BALANCE SHEETS AT DECEMBER 31, PPL Electric Utilities Corporation and Subsidiaries (Millions of Dollars, shares in thousands) 2009 2008 Assets
Current Assets
Cash and cash equivalents .................................................................................................... $ 485 $ 483Restricted cash and cash equivalents .................................................................................... 1 1Accounts receivable (less reserve: 2009, $16; 2008, $14)
Customer......................................................................................................................... 240 233Other ............................................................................................................................... 19 11
Unbilled revenues ................................................................................................................. 198 190Materials and supplies........................................................................................................... 33 37Accounts receivable from affiliates ...................................................................................... 7 8Note receivable from affiliate (Note 15)............................................................................... 300Prepayments.......................................................................................................................... 24 7Prepayment on PLR energy supply from affiliate................................................................. 12Other current assets............................................................................................................... 29 13Total Current Assets ............................................................................................................. 1,036 1,295
Property, Plant and Equipment (Note 1)
Electric plant Transmission and distribution......................................................................................... 4,662 4,506General............................................................................................................................ 535 489
Electric plant in service........................................................................................... 5,197 4,995Construction work in progress ........................................................................................ 118 79
Electric plant........................................................................................................... 5,315 5,074Other property....................................................................................................................... 2 2
Property, plant and equipment, gross.............................................................................. 5,317 5,076Less: accumulated depreciation ........................................................................................... 2,008 1,924Property, Plant and Equipment, net ...................................................................................... 3,309 3,152
Regulatory and Other Noncurrent Assets
Recoverable transition costs (Note 1) ................................................................................... 281Intangibles (Note 19) ............................................................................................................ 139 130Taxes recoverable through future rates (Note 1)................................................................... 253 250Recoverable costs of defined benefit plans (Note 1)............................................................. 229 192Other regulatory and noncurrent assets................................................................................. 126 116Total Regulatory and Other Noncurrent Assets .................................................................... 747 969 Total Assets.......................................................................................................................... $ 5,092 $ 5,416
The accompanying Notes to Consolidated Financial Statements are an integral part of the financial statements.
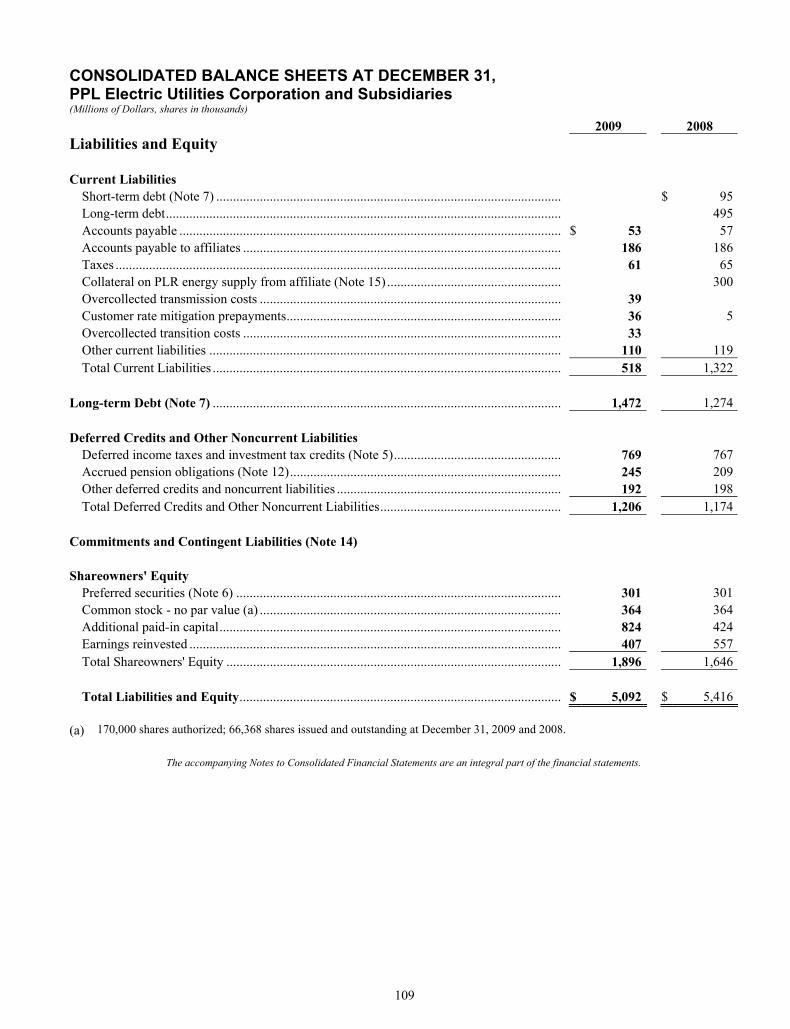
109
CONSOLIDATED BALANCE SHEETS AT DECEMBER 31, PPL Electric Utilities Corporation and Subsidiaries (Millions of Dollars, shares in thousands)
2009 2008 Liabilities and Equity Current Liabilities
Short-term debt (Note 7) ....................................................................................................... $ 95Long-term debt...................................................................................................................... 495Accounts payable .................................................................................................................. $ 53 57Accounts payable to affiliates ............................................................................................... 186 186Taxes ..................................................................................................................................... 61 65Collateral on PLR energy supply from affiliate (Note 15) .................................................... 300Overcollected transmission costs .......................................................................................... 39 Customer rate mitigation prepayments.................................................................................. 36 5Overcollected transition costs ............................................................................................... 33 Other current liabilities ......................................................................................................... 110 119Total Current Liabilities ........................................................................................................ 518 1,322
Long-term Debt (Note 7) ........................................................................................................ 1,472 1,274 Deferred Credits and Other Noncurrent Liabilities
Deferred income taxes and investment tax credits (Note 5).................................................. 769 767Accrued pension obligations (Note 12)................................................................................. 245 209Other deferred credits and noncurrent liabilities ................................................................... 192 198Total Deferred Credits and Other Noncurrent Liabilities...................................................... 1,206 1,174
Commitments and Contingent Liabilities (Note 14) Shareowners' Equity
Preferred securities (Note 6) ................................................................................................. 301 301Common stock - no par value (a) .......................................................................................... 364 364Additional paid-in capital...................................................................................................... 824 424Earnings reinvested ............................................................................................................... 407 557Total Shareowners' Equity .................................................................................................... 1,896 1,646 Total Liabilities and Equity................................................................................................ $ 5,092 $ 5,416
(a) 170,000 shares authorized; 66,368 shares issued and outstanding at December 31, 2009 and 2008.
The accompanying Notes to Consolidated Financial Statements are an integral part of the financial statements.
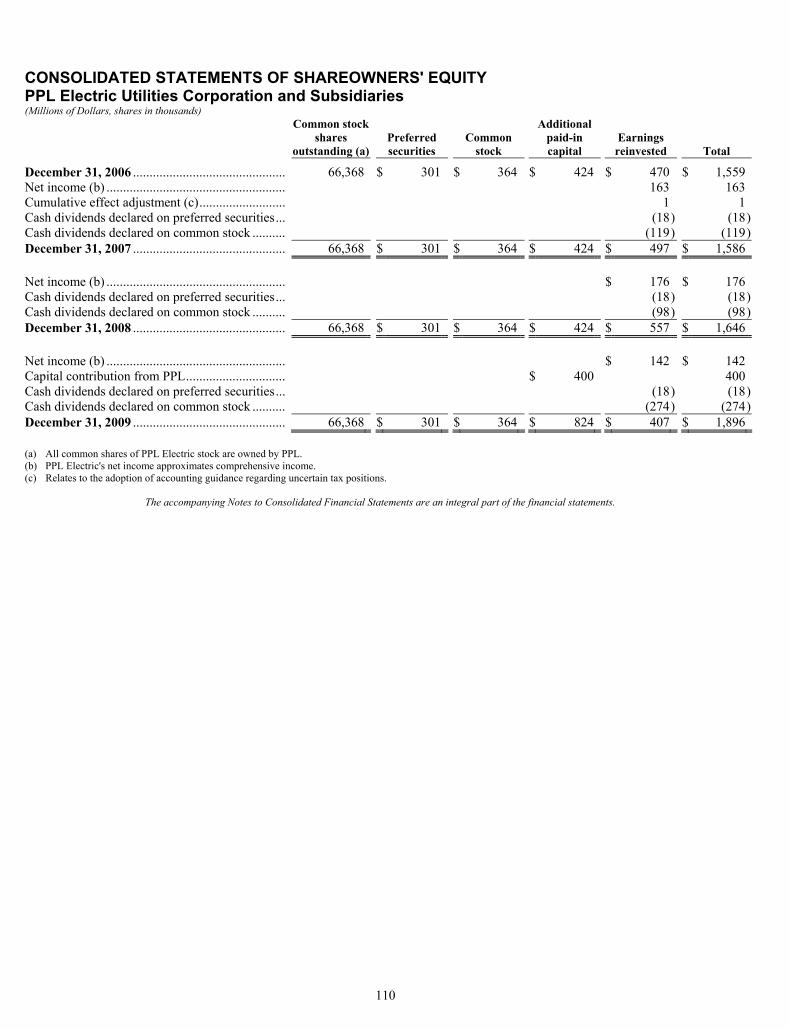
110
CONSOLIDATED STATEMENTS OF SHAREOWNERS' EQUITY PPL Electric Utilities Corporation and Subsidiaries (Millions of Dollars, shares in thousands)
Common stock shares
outstanding (a)Preferred securities
Common stock
Additional paid-in capital
Earnings reinvested Total
December 31, 2006 .............................................. 66,368 $ 301 $ 364 $ 424 $ 470 $ 1,559Net income (b) ...................................................... 163 163Cumulative effect adjustment (c).......................... 1 1Cash dividends declared on preferred securities... (18) (18)Cash dividends declared on common stock .......... (119) (119)December 31, 2007 .............................................. 66,368 $ 301 $ 364 $ 424 $ 497 $ 1,586 Net income (b) ...................................................... $ 176 $ 176Cash dividends declared on preferred securities... (18) (18)Cash dividends declared on common stock .......... (98) (98)December 31, 2008 .............................................. 66,368 $ 301 $ 364 $ 424 $ 557 $ 1,646 Net income (b) ...................................................... $ 142 $ 142Capital contribution from PPL.............................. $ 400 400Cash dividends declared on preferred securities... (18) (18)Cash dividends declared on common stock .......... (274) (274)December 31, 2009 .............................................. 66,368 $ 301 $ 364 $ 824 $ 407 $ 1,896 (a) All common shares of PPL Electric stock are owned by PPL. (b) PPL Electric's net income approximates comprehensive income. (c) Relates to the adoption of accounting guidance regarding uncertain tax positions.
The accompanying Notes to Consolidated Financial Statements are an integral part of the financial statements.
111
COMBINED NOTES TO CONSOLIDATED FINANCIAL STATEMENTS
1. Summary of Significant Accounting Policies General Terms and abbreviations are explained in the glossary. Dollars are in millions, except per share data, unless otherwise noted. Business and Consolidation (PPL) PPL is an energy and utility holding company that, through its subsidiaries, is primarily engaged in the generation and marketing of electricity in the northeastern and western U.S. and in the delivery of electricity in Pennsylvania and the U.K. Headquartered in Allentown, PA, PPL's principal direct subsidiaries are PPL Energy Funding, PPL Electric, PPL Services and PPL Capital Funding. (PPL and PPL Energy Supply) PPL Energy Funding is the parent of PPL Energy Supply, which serves as the holding company for PPL's principal unregulated subsidiaries. PPL Energy Supply is the parent of PPL Generation, PPL EnergyPlus and PPL Global. PPL Generation owns and operates a portfolio of domestic power generating assets. These power plants are primarily located in Pennsylvania, Montana, Illinois, Connecticut and New York and use well-diversified fuel sources including coal, uranium, natural gas, oil and water. PPL EnergyPlus sells electricity produced by PPL Generation subsidiaries, participates in wholesale market load-following auctions, and markets various energy commodities such as: capacity, transmission, FTRs, coal, natural gas, oil, uranium, emission allowances, RECs and other commodities in competitive wholesale and deregulated retail markets, primarily in the northeastern and western U.S. In May 2009, PPL Generation signed a definitive agreement to sell its Long Island generation business and related tolling agreements. In the fourth quarter of 2009, PPL Maine completed the sales of the majority of its hydroelectric generation business and its 8.33% ownership interest in Wyman Unit 4. See Note 9 for additional information on both the anticipated and completed sales. PPL Global owns and operates WPD's electricity delivery businesses in the U.K. In 2007, PPL Global completed the sale of its Latin American businesses. It is the policy of PPL and PPL Energy Supply to consolidate foreign subsidiaries on a one-month lag. Material intervening events, such as debt issuances and retirements, acquisitions or divestitures that occur in the lag period are recognized in the
current Financial Statements. Events that are significant but not material are disclosed. The consolidated financial statements of PPL and PPL Energy Supply include their share of undivided interests in jointly owned facilities, as well as their share of the related operating costs of those facilities. See Note 13 for additional information. (PPL and PPL Electric) PPL Electric is a rate-regulated subsidiary of PPL. PPL Electric's principal business is the transmission and distribution of electricity to serve retail customers in its franchised territory in eastern and central Pennsylvania and the supply of electricity to retail customers in that territory as a PLR. (PPL, PPL Energy Supply and PPL Electric) The consolidated financial statements of PPL, PPL Energy Supply and PPL Electric include each company's own accounts as well as the accounts of all entities in which the company has a controlling financial interest. Consolidation generally has been applied to subsidiaries in which PPL, PPL Energy Supply and PPL Electric have a majority voting interest. However, the voting interest approach is not effective in identifying controlling financial interests in entities that are not controllable through voting interests or in which the equity investors do not bear the residual economic risks. These types of entities are referred to as variable interest entities. PPL, PPL Energy Supply and PPL Electric consolidate a variable interest entity when they are determined to be the primary beneficiary of the entity. The primary beneficiary of a variable interest entity is the party that absorbs a majority of the entity's expected losses, receives a majority of its expected residual returns, or both, as a result of holding variable interests. See Note 3 for additional information regarding variable interest entities. Investments in entities in which a company has the ability to exercise significant influence but does not have a controlling financial interest are accounted for under the equity method. All other investments are carried at cost or fair value. All significant intercompany transactions have been eliminated. Any noncontrolling interests are reflected in the consolidated financial statements. Regulation (PPL and PPL Electric) The cost-based rate-regulated utility operations of PPL and PPL Electric reflect the effects of regulatory actions in their financial statements. The regulatory assets below are included in "Regulatory and Other Noncurrent Assets" on the Balance Sheets of PPL and PPL Electric at December 31 and are probable of future recovery in regulated customer rates.
112
2009 2008
Recoverable transition costs (a) $ 281Taxes recoverable through future rates $ 253 250Recoverable costs of defined benefit plans 229 192Unamortized loss on reacquired debt 33 26Costs associated with severe ice storms - January 2005 9 11
Other 7 3 $ 531 $ 763
(a) A return on these assets is included in regulated rates. The recoverable transition costs are the result of the PUC Final Order, which allowed PPL Electric to begin amortizing its competitive transition (or stranded) costs of $2.97 billion, over an 11-year transition period effective January 1, 1999. In August 1999, competitive transition costs of $2.4 billion were converted to intangible transition costs when they were securitized by the issuance of transition bonds. The intangible transition costs were amortized over the life of the transition bonds, through December 2008, in accordance with an amortization schedule filed with the PUC. The assets of PPL Transition Bond Company, including the intangible transition property, were not available to creditors of PPL or PPL Electric. The remaining competitive transition costs were also amortized based on an amortization schedule previously filed with the PUC, adjusted for those competitive transition costs that were converted to intangible transition costs. These costs were fully amortized in 2009. Taxes recoverable through future rates represent the portion of future income taxes that will be recovered through future rates based upon established regulatory practices. Accordingly, this regulatory asset is recognized when the offsetting deferred tax liability is recognized. For general-purpose financial reporting, this regulatory asset and the deferred tax liability are not offset; rather, each is displayed separately. Because this regulatory asset does not represent cash tax expenditures already incurred by PPL, this regulatory asset is not earning a current return. This regulatory asset is expected to be recovered over the period that the underlying book-tax timing differences reverse and the actual cash taxes are incurred. Recoverable costs of defined benefit plans represent the portion of unrecognized transition obligation, prior service cost, and net actuarial loss that will be recovered through future rates based upon established regulatory practices. These regulatory assets are adjusted at least annually or whenever the funded status of PPL's defined benefit plans is remeasured. These regulatory assets for PPL and PPL Electric do not represent cash expenditures already incurred; consequently, these assets are not earning a current return. 2009 2008
Transition obligation $ 10 $ 10Prior service cost 55 69Net actuarial loss 164 113Recoverable costs of defined benefit plans $ 229 $ 192
Of these costs, $15 million for PPL and PPL Electric are expected to be amortized into net periodic defined benefit costs in 2010. All costs will be amortized over the average service lives of plan participants.
Unamortized loss on reacquired debt represents losses on long-term debt reacquired or redeemed that have been deferred and will be amortized and recovered through 2029. In December 2007, the PUC approved recovery of $12 million of costs associated with severe ice storms that occurred in January 2005. Monthly amortization began in January 2008 and will continue through August 2015. The remainder of the regulatory assets included in "Other" will be recovered through 2013. PPL and PPL Electric had the following regulatory liabilities at December 31, 2009. No significant regulatory liabilities existed at December 31, 2008. 2009
Overcollected transition costs $ 33 PURTA tax refund 10
$ 43
The overcollected transition costs will be refunded to customers in 2010 and are reflected on the Balance Sheet in "Other current liabilities" for PPL and in "Overcollected transition costs" for PPL Electric. In December 2009, PPL Electric reached a settlement with the Pennsylvania Department of Revenue related to the appeal of its 1997 PURTA tax assessments that resulted in a $10 million reduction in PURTA tax. The $10 million is expected to be refunded to customers in 2011 and is reflected in "Other deferred credits and noncurrent liabilities" on PPL's and PPL Electric's Balance Sheet. (PPL and PPL Energy Supply) WPD operates under distribution licenses granted and price controls set by Ofgem. The price control formula that governs WPD's allowed revenue is normally determined every five years. Ofgem completed a review in December 2009. WPD is not subject to accounting for the effects of certain types of regulation as prescribed by GAAP. Accounting Records (PPL and PPL Electric) The system of accounts for PPL Electric is maintained in accordance with the Uniform System of Accounts prescribed by the FERC and adopted by the PUC. Use of Estimates (PPL, PPL Energy Supply and PPL Electric) The preparation of financial statements in conformity with GAAP requires management to make estimates and assumptions that affect the reported amounts of assets and liabilities, the disclosure of contingent liabilities at the date of the financial statements and the reported amounts of revenues and expenses during the reporting period. Actual results could differ from those estimates.
113
Loss Accruals (PPL, PPL Energy Supply and PPL Electric) Potential losses are accrued when (1) information is available that indicates it is "probable" that a loss has been incurred, given the likelihood of the uncertain future events and (2) the amount of the loss can be reasonably estimated. Accounting guidance defines "probable" as cases in which "the future event or events are likely to occur." PPL and its subsidiaries continuously assess potential loss contingencies for environmental remediation, litigation claims, regulatory penalties and other events. PPL and its subsidiaries discount loss accruals for environmental remediation when appropriate. PPL and its subsidiaries do not record the accrual of contingencies that might result in gains, unless recovery is assured. Changes in Classification (PPL, PPL Energy Supply and PPL Electric) The classification of certain amounts in the 2008 and 2007 financial statements have been changed to conform to the current presentation. The changes in classification did not affect "Net Income Attributable to PPL Corporation" or "PPL Corporation Shareowners' Common Equity," "Net Income Attributable to PPL Energy Supply" or PPL Energy Supply's "Member's equity" or "Income Available to PPL" or PPL Electric's "Shareowners' Equity". The classification on the Statements of Cash Flows has not been changed for the classification of amounts to Discontinued Operations. Comprehensive Income (PPL and PPL Energy Supply) Comprehensive income, which includes net income and OCI, consists of changes in equity from transactions not related to shareowners. Comprehensive income is shown on PPL's and PPL Energy Supply's Statements of Comprehensive Income. AOCI, which is presented on the Balance Sheets of PPL and included in Member's Equity on the Balance Sheets of PPL Energy Supply, consisted of these after-tax amounts at December 31. 2009 2008 PPL Foreign currency translation adjustments $ (136) $ (237)Unrealized gains on available-for-sale securities 62 18
Net unrealized gains (losses) on qualifying derivatives 602 (21)
Equity investee's AOCI (2) (3)Defined benefit plans:
Prior service cost (61) (75)Actuarial loss (993) (657)Transition obligation (9) (10)
$ (537) $ (985)
2009 2008 PPL Energy Supply Foreign currency translation adjustments $ (136) $ (237)Unrealized gains on available-for-sale securities 62 18
Net unrealized gains (losses) on qualifying derivatives 573 (12)
Equity investee's AOCI (2) (3)Defined benefit plans:
Prior service cost (44) (54)Actuarial loss (930) (608)Transition obligation (7) (8)
$ (484) $ (904) Earnings Per Share (PPL) EPS is computed using the two-class method, which is an earnings allocation method for computing EPS that treats a participating security as having rights to earnings that would otherwise have been available to common shareowners. Share-based payment awards that provide recipients a non-forfeitable right to dividends or dividend equivalents are considered participating securities. Basic EPS is computed by dividing income available to PPL common shareowners by the weighted-average number of common shares outstanding during the period. Diluted EPS is computed by dividing income available to PPL common shareowners by the weighted-average number of shares outstanding that are increased for additional shares that would be outstanding if potentially dilutive non-participating securities were converted to common shares. In 2009, these securities consisted of stock options and performance units granted under the incentive compensation plans. In 2008, these securities consisted of stock options, performance units and PPL Energy Supply's 2-5/8% Convertible Senior Notes. In 2007, these securities consisted of stock options and PPL Energy Supply's 2-5/8% Convertible Senior Notes. Price Risk Management (PPL and PPL Energy Supply) PPL and PPL Energy Supply enter into energy and energy-related contracts to hedge the variability of expected cash flows associated with their generating units and marketing activities, as well as for trading purposes. PPL and PPL Energy Supply enter into interest rate derivative contracts to hedge their exposure to changes in the fair value of their debt instruments and to hedge their exposure to variability in expected cash flows associated with existing debt instruments or forecasted issuances of debt. PPL and PPL Energy Supply also enter into foreign currency derivative contracts to hedge foreign currency exposures related to firm commitments, recognized assets or liabilities, forecasted transactions, net investments and foreign earnings translation. PPL and PPL Energy Supply have contracts that meet the definition of a derivative. Certain derivative energy contracts have been excluded from the requirements of derivative accounting treatment because they meet the definition of a NPNS. These contracts are accounted for using accrual accounting. All contracts that have been classified as derivative
114
contracts are reflected on the balance sheet at their fair value. These contracts are recorded as "Price risk management assets" and "Price risk management liabilities" on the Balance Sheets. Short-term derivative positions are included in "Current Assets" and "Current Liabilities." PPL records long-term derivative positions in "Regulatory and Other Noncurrent Assets" and "Deferred Credits and Other Noncurrent Liabilities" and PPL Energy Supply records long-term derivative positions in "Other Noncurrent Assets" and "Deferred Credits and Other Noncurrent Liabilities." On the date the derivative contract is executed, PPL may designate the derivative as a hedge of the fair value of a recognized asset or liability or of an unrecognized firm commitment ("fair value hedge"), a hedge of a forecasted transaction or of the variability of cash flows to be received or paid related to a recognized asset or liability ("cash flow hedge"), a foreign currency fair value or cash flow hedge ("foreign currency hedge") or a hedge of a net investment in a foreign operation ("net investment hedge"). Changes in the fair value of derivatives are recorded in either OCI or in current-period earnings. Cash inflows and outflows related to derivative instruments are included as a component of operating, investing or financing activities on the Statements of Cash Flows, depending on the underlying nature of the hedged items. See Note 18 for additional information on derivatives. (PPL and PPL Electric) To meet its obligation as a PLR to its customers, PPL Electric has entered into contracts that meet the definition of a derivative. These contracts have been excluded from the requirements of derivative accounting treatment because they meet the definition of a NPNS and are accounted for using accrual accounting. See Notes 17 and 18 for additional information. Revenue Utility Revenue (PPL) The Statements of Income "Utility" line item contains revenues from domestic and U.K. rate-regulated delivery operations. (PPL Energy Supply) The Statements of Income "Utility" line item contains revenues from the U.K. rate-regulated delivery operations. (PPL Electric) Since most of PPL Electric's operations are regulated, it is not meaningful to use a "Utility" caption. Therefore, the revenues of PPL Electric are presented according to specific types of revenue.
Revenue Recognition (PPL, PPL Energy Supply and PPL Electric) Operating revenues, except for "Energy-related businesses," are recorded based on energy deliveries through the end of the calendar month. Unbilled retail revenues result because customers' meters are read and bills are rendered throughout the month, rather than all being read at the end of the month. Unbilled revenues for a month are calculated by multiplying an estimate of unbilled kWh by the estimated average cents per kWh. Unbilled wholesale energy revenues are recorded at month-end to reflect estimated amounts until actual dollars and MWhs are confirmed and invoiced. At that time, unbilled revenue is reversed and actual revenue is recorded. PPL Energy Supply records energy marketing activity in the period when the energy is delivered. Generally, the wholesale sales and purchases that qualify as derivative instruments held for non-trading purposes are reported gross on the Statements of Income within "Wholesale energy marketing" and "Energy purchases." Additionally, the bilateral sales and purchases that are designated as speculative trading activities and qualify as derivative instruments for accounting purposes are reported net on the Statements of Income within "Net energy trading margins." Spot market activity that balances PPL Energy Supply's physical trading positions is included on the Statements of Income in "Net energy trading margins." Certain PPL subsidiaries participate in RTOs, primarily in PJM, but also in the surrounding regions of New York (NYISO), New England (ISO-NE) and the Midwest (MISO). In PJM, PPL EnergyPlus is a marketer, a load-serving entity to its customers who have selected it as a supplier and a seller for PPL's generation subsidiaries. PPL Electric is a transmission owner and PLR in PJM. In ISO-NE, PPL EnergyPlus is a marketer, a load-serving entity, and a seller for PPL's New England generating assets. In the NYISO and MISO regions, PPL EnergyPlus acts as a marketer. PPL Electric does not participate in ISO-NE, NYISO or MISO. A function of interchange accounting is to match participants' MWh entitlements (generation plus scheduled bilateral purchases) against their MWh obligations (load plus scheduled bilateral sales) during every hour of every day. If the net result during any given hour is an entitlement, the participant is credited with a spot-market sale to the ISO at the respective market price for that hour; if the net result is an obligation, the participant is charged with a spot-market purchase from the ISO at the respective market price for that hour. ISO purchases and sales are not allocated to individual customers. PPL records the hourly net sales and purchases in its financial statements as wholesale energy marketing and energy purchases. "Energy-related businesses" revenue includes revenues from the mechanical contracting and engineering subsidiaries, as well as, WPD's telecommunications and property subsidiaries. The mechanical contracting and engineering subsidiaries record revenues from construction contracts on the percentage-of-completion method of accounting, measured by the actual cost incurred to date as a percentage of the estimated total cost for each contract. Accordingly, costs and estimated earnings in
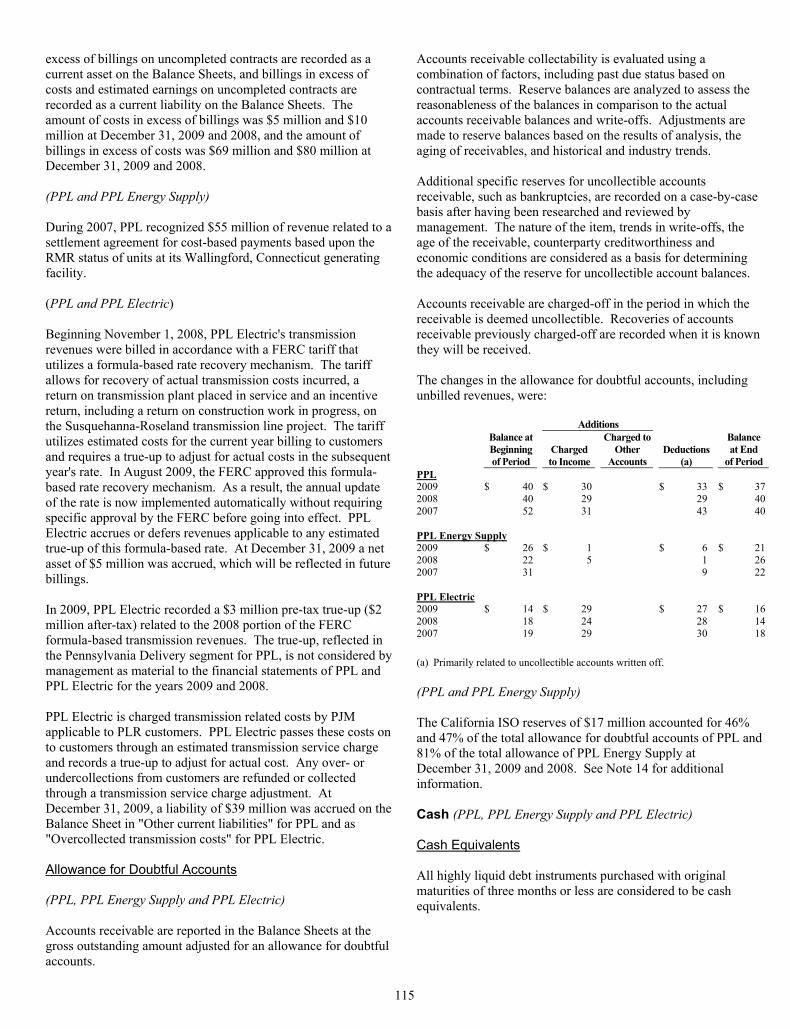
115
excess of billings on uncompleted contracts are recorded as a current asset on the Balance Sheets, and billings in excess of costs and estimated earnings on uncompleted contracts are recorded as a current liability on the Balance Sheets. The amount of costs in excess of billings was $5 million and $10 million at December 31, 2009 and 2008, and the amount of billings in excess of costs was $69 million and $80 million at December 31, 2009 and 2008. (PPL and PPL Energy Supply) During 2007, PPL recognized $55 million of revenue related to a settlement agreement for cost-based payments based upon the RMR status of units at its Wallingford, Connecticut generating facility. (PPL and PPL Electric) Beginning November 1, 2008, PPL Electric's transmission revenues were billed in accordance with a FERC tariff that utilizes a formula-based rate recovery mechanism. The tariff allows for recovery of actual transmission costs incurred, a return on transmission plant placed in service and an incentive return, including a return on construction work in progress, on the Susquehanna-Roseland transmission line project. The tariff utilizes estimated costs for the current year billing to customers and requires a true-up to adjust for actual costs in the subsequent year's rate. In August 2009, the FERC approved this formula-based rate recovery mechanism. As a result, the annual update of the rate is now implemented automatically without requiring specific approval by the FERC before going into effect. PPL Electric accrues or defers revenues applicable to any estimated true-up of this formula-based rate. At December 31, 2009 a net asset of $5 million was accrued, which will be reflected in future billings. In 2009, PPL Electric recorded a $3 million pre-tax true-up ($2 million after-tax) related to the 2008 portion of the FERC formula-based transmission revenues. The true-up, reflected in the Pennsylvania Delivery segment for PPL, is not considered by management as material to the financial statements of PPL and PPL Electric for the years 2009 and 2008. PPL Electric is charged transmission related costs by PJM applicable to PLR customers. PPL Electric passes these costs on to customers through an estimated transmission service charge and records a true-up to adjust for actual cost. Any over- or undercollections from customers are refunded or collected through a transmission service charge adjustment. At December 31, 2009, a liability of $39 million was accrued on the Balance Sheet in "Other current liabilities" for PPL and as "Overcollected transmission costs" for PPL Electric. Allowance for Doubtful Accounts (PPL, PPL Energy Supply and PPL Electric) Accounts receivable are reported in the Balance Sheets at the gross outstanding amount adjusted for an allowance for doubtful accounts.
Accounts receivable collectability is evaluated using a combination of factors, including past due status based on contractual terms. Reserve balances are analyzed to assess the reasonableness of the balances in comparison to the actual accounts receivable balances and write-offs. Adjustments are made to reserve balances based on the results of analysis, the aging of receivables, and historical and industry trends. Additional specific reserves for uncollectible accounts receivable, such as bankruptcies, are recorded on a case-by-case basis after having been researched and reviewed by management. The nature of the item, trends in write-offs, the age of the receivable, counterparty creditworthiness and economic conditions are considered as a basis for determining the adequacy of the reserve for uncollectible account balances. Accounts receivable are charged-off in the period in which the receivable is deemed uncollectible. Recoveries of accounts receivable previously charged-off are recorded when it is known they will be received. The changes in the allowance for doubtful accounts, including unbilled revenues, were:
Additions
Balance at Beginning of Period
Charged to Income
Charged to Other
Accounts Deductions
(a)
Balance at End
of Period PPL 2009 $ 40 $ 30 $ 33 $ 372008 40 29 29 402007 52 31 43 40 PPL Energy Supply 2009 $ 26 $ 1 $ 6 $ 212008 22 5 1 262007 31 9 22 PPL Electric 2009 $ 14 $ 29 $ 27 $ 162008 18 24 28 142007 19 29 30 18 (a) Primarily related to uncollectible accounts written off. (PPL and PPL Energy Supply) The California ISO reserves of $17 million accounted for 46% and 47% of the total allowance for doubtful accounts of PPL and 81% of the total allowance of PPL Energy Supply at December 31, 2009 and 2008. See Note 14 for additional information. Cash (PPL, PPL Energy Supply and PPL Electric) Cash Equivalents All highly liquid debt instruments purchased with original maturities of three months or less are considered to be cash equivalents.
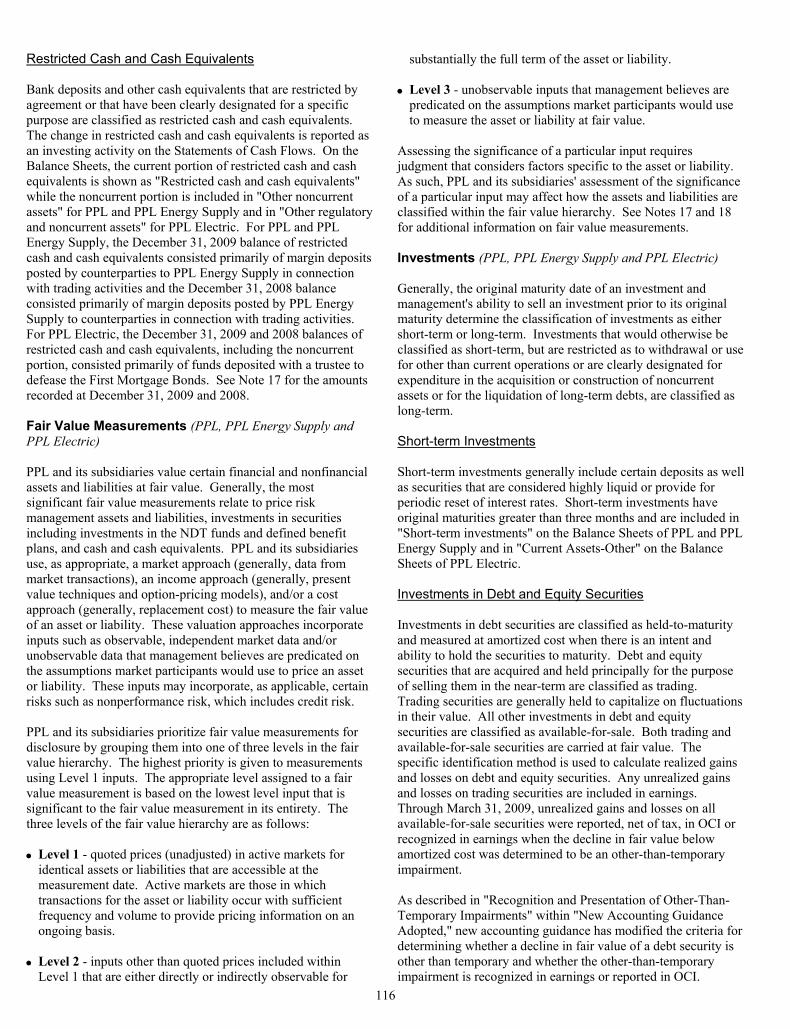
116
Restricted Cash and Cash Equivalents Bank deposits and other cash equivalents that are restricted by agreement or that have been clearly designated for a specific purpose are classified as restricted cash and cash equivalents. The change in restricted cash and cash equivalents is reported as an investing activity on the Statements of Cash Flows. On the Balance Sheets, the current portion of restricted cash and cash equivalents is shown as "Restricted cash and cash equivalents" while the noncurrent portion is included in "Other noncurrent assets" for PPL and PPL Energy Supply and in "Other regulatory and noncurrent assets" for PPL Electric. For PPL and PPL Energy Supply, the December 31, 2009 balance of restricted cash and cash equivalents consisted primarily of margin deposits posted by counterparties to PPL Energy Supply in connection with trading activities and the December 31, 2008 balance consisted primarily of margin deposits posted by PPL Energy Supply to counterparties in connection with trading activities. For PPL Electric, the December 31, 2009 and 2008 balances of restricted cash and cash equivalents, including the noncurrent portion, consisted primarily of funds deposited with a trustee to defease the First Mortgage Bonds. See Note 17 for the amounts recorded at December 31, 2009 and 2008. Fair Value Measurements (PPL, PPL Energy Supply and PPL Electric) PPL and its subsidiaries value certain financial and nonfinancial assets and liabilities at fair value. Generally, the most significant fair value measurements relate to price risk management assets and liabilities, investments in securities including investments in the NDT funds and defined benefit plans, and cash and cash equivalents. PPL and its subsidiaries use, as appropriate, a market approach (generally, data from market transactions), an income approach (generally, present value techniques and option-pricing models), and/or a cost approach (generally, replacement cost) to measure the fair value of an asset or liability. These valuation approaches incorporate inputs such as observable, independent market data and/or unobservable data that management believes are predicated on the assumptions market participants would use to price an asset or liability. These inputs may incorporate, as applicable, certain risks such as nonperformance risk, which includes credit risk. PPL and its subsidiaries prioritize fair value measurements for disclosure by grouping them into one of three levels in the fair value hierarchy. The highest priority is given to measurements using Level 1 inputs. The appropriate level assigned to a fair value measurement is based on the lowest level input that is significant to the fair value measurement in its entirety. The three levels of the fair value hierarchy are as follows: • Level 1 - quoted prices (unadjusted) in active markets for
identical assets or liabilities that are accessible at the measurement date. Active markets are those in which transactions for the asset or liability occur with sufficient frequency and volume to provide pricing information on an ongoing basis.
• Level 2 - inputs other than quoted prices included within
Level 1 that are either directly or indirectly observable for
substantially the full term of the asset or liability. • Level 3 - unobservable inputs that management believes are
predicated on the assumptions market participants would use to measure the asset or liability at fair value.
Assessing the significance of a particular input requires judgment that considers factors specific to the asset or liability. As such, PPL and its subsidiaries' assessment of the significance of a particular input may affect how the assets and liabilities are classified within the fair value hierarchy. See Notes 17 and 18 for additional information on fair value measurements. Investments (PPL, PPL Energy Supply and PPL Electric) Generally, the original maturity date of an investment and management's ability to sell an investment prior to its original maturity determine the classification of investments as either short-term or long-term. Investments that would otherwise be classified as short-term, but are restricted as to withdrawal or use for other than current operations or are clearly designated for expenditure in the acquisition or construction of noncurrent assets or for the liquidation of long-term debts, are classified as long-term. Short-term Investments Short-term investments generally include certain deposits as well as securities that are considered highly liquid or provide for periodic reset of interest rates. Short-term investments have original maturities greater than three months and are included in "Short-term investments" on the Balance Sheets of PPL and PPL Energy Supply and in "Current Assets-Other" on the Balance Sheets of PPL Electric. Investments in Debt and Equity Securities Investments in debt securities are classified as held-to-maturity and measured at amortized cost when there is an intent and ability to hold the securities to maturity. Debt and equity securities that are acquired and held principally for the purpose of selling them in the near-term are classified as trading. Trading securities are generally held to capitalize on fluctuations in their value. All other investments in debt and equity securities are classified as available-for-sale. Both trading and available-for-sale securities are carried at fair value. The specific identification method is used to calculate realized gains and losses on debt and equity securities. Any unrealized gains and losses on trading securities are included in earnings. Through March 31, 2009, unrealized gains and losses on all available-for-sale securities were reported, net of tax, in OCI or recognized in earnings when the decline in fair value below amortized cost was determined to be an other-than-temporary impairment. As described in "Recognition and Presentation of Other-Than-Temporary Impairments" within "New Accounting Guidance Adopted," new accounting guidance has modified the criteria for determining whether a decline in fair value of a debt security is other than temporary and whether the other-than-temporary impairment is recognized in earnings or reported in OCI.
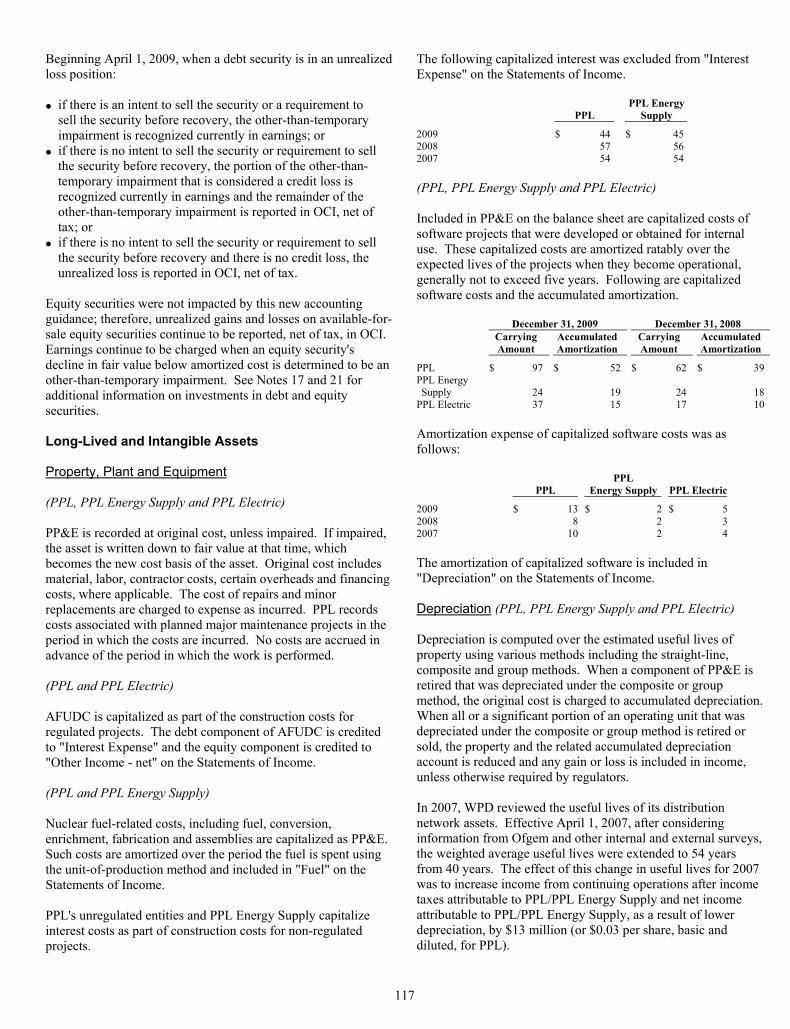
117
Beginning April 1, 2009, when a debt security is in an unrealized loss position: • if there is an intent to sell the security or a requirement to
sell the security before recovery, the other-than-temporary impairment is recognized currently in earnings; or
• if there is no intent to sell the security or requirement to sell the security before recovery, the portion of the other-than-temporary impairment that is considered a credit loss is recognized currently in earnings and the remainder of the other-than-temporary impairment is reported in OCI, net of tax; or
• if there is no intent to sell the security or requirement to sell the security before recovery and there is no credit loss, the unrealized loss is reported in OCI, net of tax.
Equity securities were not impacted by this new accounting guidance; therefore, unrealized gains and losses on available-for-sale equity securities continue to be reported, net of tax, in OCI. Earnings continue to be charged when an equity security's decline in fair value below amortized cost is determined to be an other-than-temporary impairment. See Notes 17 and 21 for additional information on investments in debt and equity securities. Long-Lived and Intangible Assets Property, Plant and Equipment (PPL, PPL Energy Supply and PPL Electric) PP&E is recorded at original cost, unless impaired. If impaired, the asset is written down to fair value at that time, which becomes the new cost basis of the asset. Original cost includes material, labor, contractor costs, certain overheads and financing costs, where applicable. The cost of repairs and minor replacements are charged to expense as incurred. PPL records costs associated with planned major maintenance projects in the period in which the costs are incurred. No costs are accrued in advance of the period in which the work is performed. (PPL and PPL Electric) AFUDC is capitalized as part of the construction costs for regulated projects. The debt component of AFUDC is credited to "Interest Expense" and the equity component is credited to "Other Income - net" on the Statements of Income. (PPL and PPL Energy Supply) Nuclear fuel-related costs, including fuel, conversion, enrichment, fabrication and assemblies are capitalized as PP&E. Such costs are amortized over the period the fuel is spent using the unit-of-production method and included in "Fuel" on the Statements of Income. PPL's unregulated entities and PPL Energy Supply capitalize interest costs as part of construction costs for non-regulated projects.
The following capitalized interest was excluded from "Interest Expense" on the Statements of Income.
PPL PPL Energy
Supply
2009 $ 44 $ 452008 57 562007 54 54 (PPL, PPL Energy Supply and PPL Electric) Included in PP&E on the balance sheet are capitalized costs of software projects that were developed or obtained for internal use. These capitalized costs are amortized ratably over the expected lives of the projects when they become operational, generally not to exceed five years. Following are capitalized software costs and the accumulated amortization. December 31, 2009 December 31, 2008
Carrying Amount
Accumulated Amortization
Carrying Amount
Accumulated Amortization
PPL $ 97 $ 52 $ 62 $ 39 PPL Energy Supply 24 19 24 18
PPL Electric 37 15 17 10 Amortization expense of capitalized software costs was as follows:
PPL PPL
Energy Supply PPL Electric
2009 $ 13 $ 2 $ 5 2008 8 2 3 2007 10 2 4 The amortization of capitalized software is included in "Depreciation" on the Statements of Income. Depreciation (PPL, PPL Energy Supply and PPL Electric) Depreciation is computed over the estimated useful lives of property using various methods including the straight-line, composite and group methods. When a component of PP&E is retired that was depreciated under the composite or group method, the original cost is charged to accumulated depreciation. When all or a significant portion of an operating unit that was depreciated under the composite or group method is retired or sold, the property and the related accumulated depreciation account is reduced and any gain or loss is included in income, unless otherwise required by regulators. In 2007, WPD reviewed the useful lives of its distribution network assets. Effective April 1, 2007, after considering information from Ofgem and other internal and external surveys, the weighted average useful lives were extended to 54 years from 40 years. The effect of this change in useful lives for 2007 was to increase income from continuing operations after income taxes attributable to PPL/PPL Energy Supply and net income attributable to PPL/PPL Energy Supply, as a result of lower depreciation, by $13 million (or $0.03 per share, basic and diluted, for PPL).
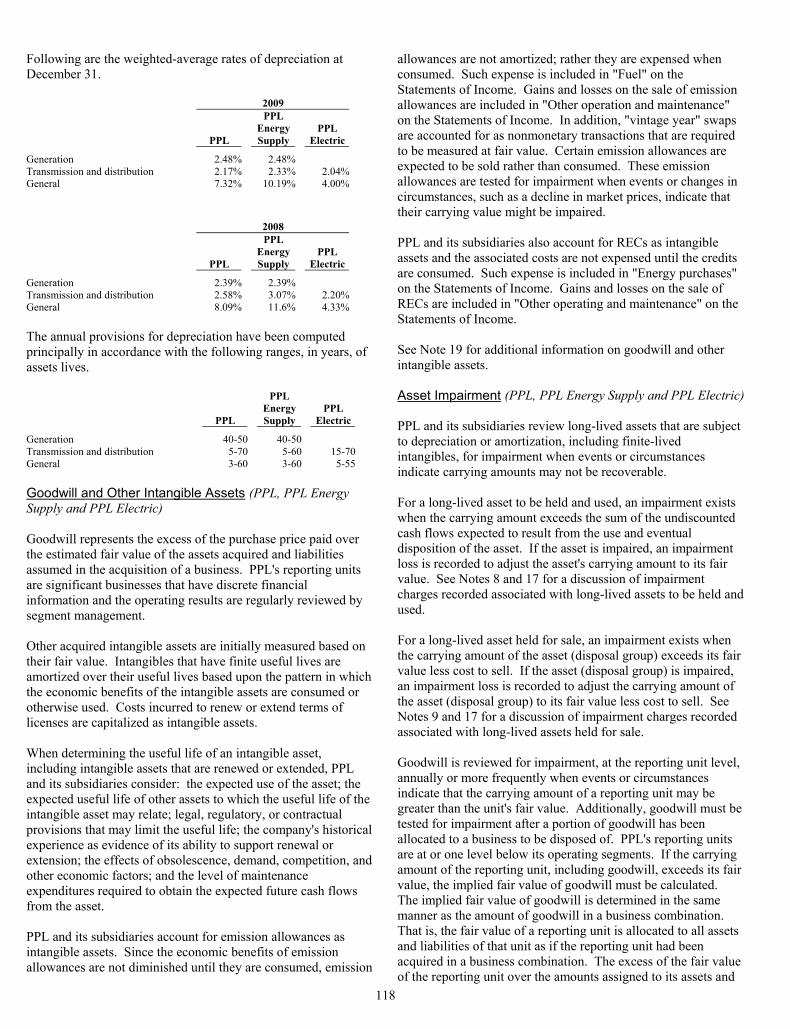
118
Following are the weighted-average rates of depreciation at December 31.
2009
PPL
PPL Energy Supply
PPL Electric
Generation 2.48% 2.48% Transmission and distribution 2.17% 2.33% 2.04% General 7.32% 10.19% 4.00%
2008
PPL
PPL Energy Supply
PPL Electric
Generation 2.39% 2.39% Transmission and distribution 2.58% 3.07% 2.20% General 8.09% 11.6% 4.33% The annual provisions for depreciation have been computed principally in accordance with the following ranges, in years, of assets lives.
PPL
PPL Energy Supply
PPL Electric
Generation 40-50 40-50 Transmission and distribution 5-70 5-60 15-70 General 3-60 3-60 5-55 Goodwill and Other Intangible Assets (PPL, PPL Energy Supply and PPL Electric) Goodwill represents the excess of the purchase price paid over the estimated fair value of the assets acquired and liabilities assumed in the acquisition of a business. PPL's reporting units are significant businesses that have discrete financial information and the operating results are regularly reviewed by segment management. Other acquired intangible assets are initially measured based on their fair value. Intangibles that have finite useful lives are amortized over their useful lives based upon the pattern in which the economic benefits of the intangible assets are consumed or otherwise used. Costs incurred to renew or extend terms of licenses are capitalized as intangible assets. When determining the useful life of an intangible asset, including intangible assets that are renewed or extended, PPL and its subsidiaries consider: the expected use of the asset; the expected useful life of other assets to which the useful life of the intangible asset may relate; legal, regulatory, or contractual provisions that may limit the useful life; the company's historical experience as evidence of its ability to support renewal or extension; the effects of obsolescence, demand, competition, and other economic factors; and the level of maintenance expenditures required to obtain the expected future cash flows from the asset. PPL and its subsidiaries account for emission allowances as intangible assets. Since the economic benefits of emission allowances are not diminished until they are consumed, emission
allowances are not amortized; rather they are expensed when consumed. Such expense is included in "Fuel" on the Statements of Income. Gains and losses on the sale of emission allowances are included in "Other operation and maintenance" on the Statements of Income. In addition, "vintage year" swaps are accounted for as nonmonetary transactions that are required to be measured at fair value. Certain emission allowances are expected to be sold rather than consumed. These emission allowances are tested for impairment when events or changes in circumstances, such as a decline in market prices, indicate that their carrying value might be impaired. PPL and its subsidiaries also account for RECs as intangible assets and the associated costs are not expensed until the credits are consumed. Such expense is included in "Energy purchases" on the Statements of Income. Gains and losses on the sale of RECs are included in "Other operating and maintenance" on the Statements of Income. See Note 19 for additional information on goodwill and other intangible assets. Asset Impairment (PPL, PPL Energy Supply and PPL Electric) PPL and its subsidiaries review long-lived assets that are subject to depreciation or amortization, including finite-lived intangibles, for impairment when events or circumstances indicate carrying amounts may not be recoverable. For a long-lived asset to be held and used, an impairment exists when the carrying amount exceeds the sum of the undiscounted cash flows expected to result from the use and eventual disposition of the asset. If the asset is impaired, an impairment loss is recorded to adjust the asset's carrying amount to its fair value. See Notes 8 and 17 for a discussion of impairment charges recorded associated with long-lived assets to be held and used. For a long-lived asset held for sale, an impairment exists when the carrying amount of the asset (disposal group) exceeds its fair value less cost to sell. If the asset (disposal group) is impaired, an impairment loss is recorded to adjust the carrying amount of the asset (disposal group) to its fair value less cost to sell. See Notes 9 and 17 for a discussion of impairment charges recorded associated with long-lived assets held for sale. Goodwill is reviewed for impairment, at the reporting unit level, annually or more frequently when events or circumstances indicate that the carrying amount of a reporting unit may be greater than the unit's fair value. Additionally, goodwill must be tested for impairment after a portion of goodwill has been allocated to a business to be disposed of. PPL's reporting units are at or one level below its operating segments. If the carrying amount of the reporting unit, including goodwill, exceeds its fair value, the implied fair value of goodwill must be calculated. The implied fair value of goodwill is determined in the same manner as the amount of goodwill in a business combination. That is, the fair value of a reporting unit is allocated to all assets and liabilities of that unit as if the reporting unit had been acquired in a business combination. The excess of the fair value of the reporting unit over the amounts assigned to its assets and
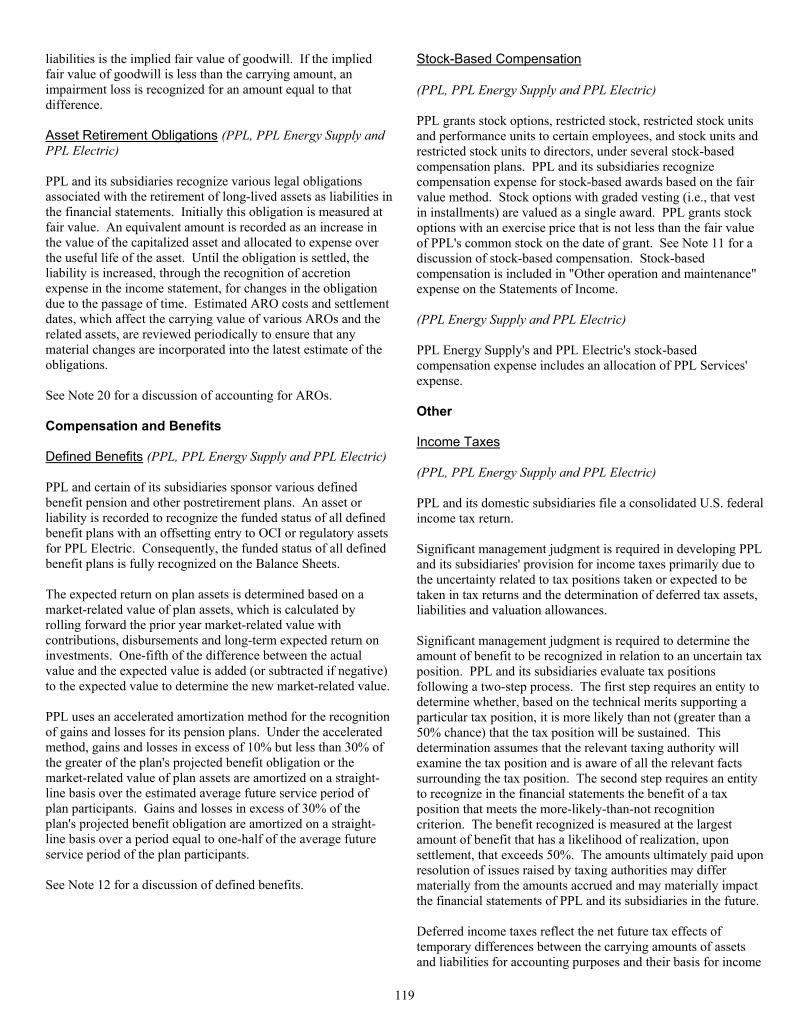
119
liabilities is the implied fair value of goodwill. If the implied fair value of goodwill is less than the carrying amount, an impairment loss is recognized for an amount equal to that difference. Asset Retirement Obligations (PPL, PPL Energy Supply and PPL Electric) PPL and its subsidiaries recognize various legal obligations associated with the retirement of long-lived assets as liabilities in the financial statements. Initially this obligation is measured at fair value. An equivalent amount is recorded as an increase in the value of the capitalized asset and allocated to expense over the useful life of the asset. Until the obligation is settled, the liability is increased, through the recognition of accretion expense in the income statement, for changes in the obligation due to the passage of time. Estimated ARO costs and settlement dates, which affect the carrying value of various AROs and the related assets, are reviewed periodically to ensure that any material changes are incorporated into the latest estimate of the obligations. See Note 20 for a discussion of accounting for AROs. Compensation and Benefits Defined Benefits (PPL, PPL Energy Supply and PPL Electric) PPL and certain of its subsidiaries sponsor various defined benefit pension and other postretirement plans. An asset or liability is recorded to recognize the funded status of all defined benefit plans with an offsetting entry to OCI or regulatory assets for PPL Electric. Consequently, the funded status of all defined benefit plans is fully recognized on the Balance Sheets. The expected return on plan assets is determined based on a market-related value of plan assets, which is calculated by rolling forward the prior year market-related value with contributions, disbursements and long-term expected return on investments. One-fifth of the difference between the actual value and the expected value is added (or subtracted if negative) to the expected value to determine the new market-related value. PPL uses an accelerated amortization method for the recognition of gains and losses for its pension plans. Under the accelerated method, gains and losses in excess of 10% but less than 30% of the greater of the plan's projected benefit obligation or the market-related value of plan assets are amortized on a straight-line basis over the estimated average future service period of plan participants. Gains and losses in excess of 30% of the plan's projected benefit obligation are amortized on a straight-line basis over a period equal to one-half of the average future service period of the plan participants. See Note 12 for a discussion of defined benefits.
Stock-Based Compensation (PPL, PPL Energy Supply and PPL Electric) PPL grants stock options, restricted stock, restricted stock units and performance units to certain employees, and stock units and restricted stock units to directors, under several stock-based compensation plans. PPL and its subsidiaries recognize compensation expense for stock-based awards based on the fair value method. Stock options with graded vesting (i.e., that vest in installments) are valued as a single award. PPL grants stock options with an exercise price that is not less than the fair value of PPL's common stock on the date of grant. See Note 11 for a discussion of stock-based compensation. Stock-based compensation is included in "Other operation and maintenance" expense on the Statements of Income. (PPL Energy Supply and PPL Electric) PPL Energy Supply's and PPL Electric's stock-based compensation expense includes an allocation of PPL Services' expense. Other Income Taxes (PPL, PPL Energy Supply and PPL Electric) PPL and its domestic subsidiaries file a consolidated U.S. federal income tax return. Significant management judgment is required in developing PPL and its subsidiaries' provision for income taxes primarily due to the uncertainty related to tax positions taken or expected to be taken in tax returns and the determination of deferred tax assets, liabilities and valuation allowances. Significant management judgment is required to determine the amount of benefit to be recognized in relation to an uncertain tax position. PPL and its subsidiaries evaluate tax positions following a two-step process. The first step requires an entity to determine whether, based on the technical merits supporting a particular tax position, it is more likely than not (greater than a 50% chance) that the tax position will be sustained. This determination assumes that the relevant taxing authority will examine the tax position and is aware of all the relevant facts surrounding the tax position. The second step requires an entity to recognize in the financial statements the benefit of a tax position that meets the more-likely-than-not recognition criterion. The benefit recognized is measured at the largest amount of benefit that has a likelihood of realization, upon settlement, that exceeds 50%. The amounts ultimately paid upon resolution of issues raised by taxing authorities may differ materially from the amounts accrued and may materially impact the financial statements of PPL and its subsidiaries in the future. Deferred income taxes reflect the net future tax effects of temporary differences between the carrying amounts of assets and liabilities for accounting purposes and their basis for income
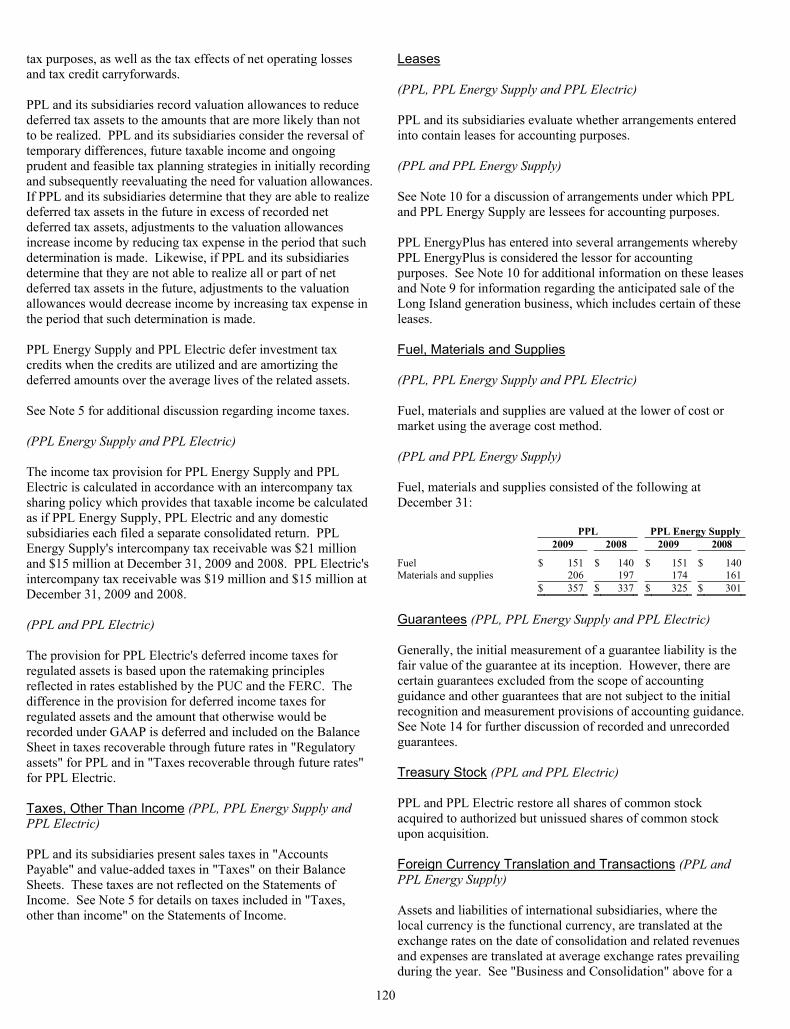
120
tax purposes, as well as the tax effects of net operating losses and tax credit carryforwards. PPL and its subsidiaries record valuation allowances to reduce deferred tax assets to the amounts that are more likely than not to be realized. PPL and its subsidiaries consider the reversal of temporary differences, future taxable income and ongoing prudent and feasible tax planning strategies in initially recording and subsequently reevaluating the need for valuation allowances. If PPL and its subsidiaries determine that they are able to realize deferred tax assets in the future in excess of recorded net deferred tax assets, adjustments to the valuation allowances increase income by reducing tax expense in the period that such determination is made. Likewise, if PPL and its subsidiaries determine that they are not able to realize all or part of net deferred tax assets in the future, adjustments to the valuation allowances would decrease income by increasing tax expense in the period that such determination is made. PPL Energy Supply and PPL Electric defer investment tax credits when the credits are utilized and are amortizing the deferred amounts over the average lives of the related assets. See Note 5 for additional discussion regarding income taxes. (PPL Energy Supply and PPL Electric) The income tax provision for PPL Energy Supply and PPL Electric is calculated in accordance with an intercompany tax sharing policy which provides that taxable income be calculated as if PPL Energy Supply, PPL Electric and any domestic subsidiaries each filed a separate consolidated return. PPL Energy Supply's intercompany tax receivable was $21 million and $15 million at December 31, 2009 and 2008. PPL Electric's intercompany tax receivable was $19 million and $15 million at December 31, 2009 and 2008. (PPL and PPL Electric) The provision for PPL Electric's deferred income taxes for regulated assets is based upon the ratemaking principles reflected in rates established by the PUC and the FERC. The difference in the provision for deferred income taxes for regulated assets and the amount that otherwise would be recorded under GAAP is deferred and included on the Balance Sheet in taxes recoverable through future rates in "Regulatory assets" for PPL and in "Taxes recoverable through future rates" for PPL Electric. Taxes, Other Than Income (PPL, PPL Energy Supply and PPL Electric) PPL and its subsidiaries present sales taxes in "Accounts Payable" and value-added taxes in "Taxes" on their Balance Sheets. These taxes are not reflected on the Statements of Income. See Note 5 for details on taxes included in "Taxes, other than income" on the Statements of Income.
Leases (PPL, PPL Energy Supply and PPL Electric) PPL and its subsidiaries evaluate whether arrangements entered into contain leases for accounting purposes. (PPL and PPL Energy Supply) See Note 10 for a discussion of arrangements under which PPL and PPL Energy Supply are lessees for accounting purposes. PPL EnergyPlus has entered into several arrangements whereby PPL EnergyPlus is considered the lessor for accounting purposes. See Note 10 for additional information on these leases and Note 9 for information regarding the anticipated sale of the Long Island generation business, which includes certain of these leases. Fuel, Materials and Supplies (PPL, PPL Energy Supply and PPL Electric) Fuel, materials and supplies are valued at the lower of cost or market using the average cost method. (PPL and PPL Energy Supply) Fuel, materials and supplies consisted of the following at December 31:
PPL PPL Energy Supply 2009 2008 2009 2008
Fuel $ 151 $ 140 $ 151 $ 140Materials and supplies 206 197 174 161
$ 357 $ 337 $ 325 $ 301 Guarantees (PPL, PPL Energy Supply and PPL Electric) Generally, the initial measurement of a guarantee liability is the fair value of the guarantee at its inception. However, there are certain guarantees excluded from the scope of accounting guidance and other guarantees that are not subject to the initial recognition and measurement provisions of accounting guidance. See Note 14 for further discussion of recorded and unrecorded guarantees. Treasury Stock (PPL and PPL Electric) PPL and PPL Electric restore all shares of common stock acquired to authorized but unissued shares of common stock upon acquisition. Foreign Currency Translation and Transactions (PPL and PPL Energy Supply) Assets and liabilities of international subsidiaries, where the local currency is the functional currency, are translated at the exchange rates on the date of consolidation and related revenues and expenses are translated at average exchange rates prevailing during the year. See "Business and Consolidation" above for a
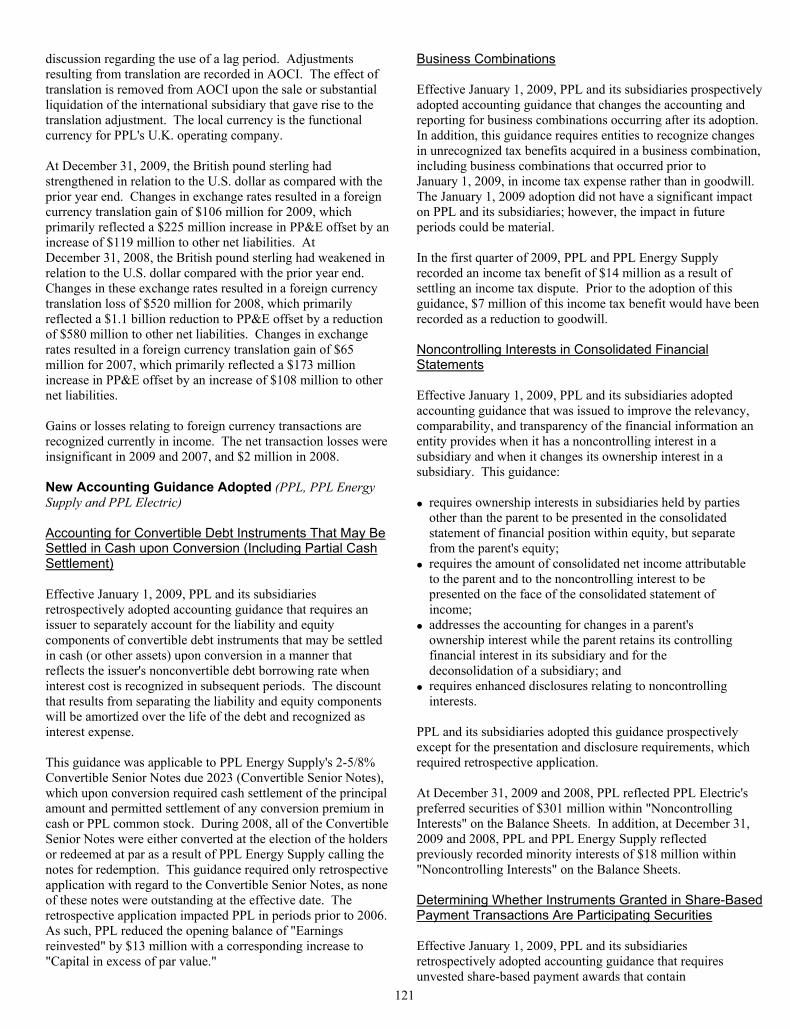
121
discussion regarding the use of a lag period. Adjustments resulting from translation are recorded in AOCI. The effect of translation is removed from AOCI upon the sale or substantial liquidation of the international subsidiary that gave rise to the translation adjustment. The local currency is the functional currency for PPL's U.K. operating company. At December 31, 2009, the British pound sterling had strengthened in relation to the U.S. dollar as compared with the prior year end. Changes in exchange rates resulted in a foreign currency translation gain of $106 million for 2009, which primarily reflected a $225 million increase in PP&E offset by an increase of $119 million to other net liabilities. At December 31, 2008, the British pound sterling had weakened in relation to the U.S. dollar compared with the prior year end. Changes in these exchange rates resulted in a foreign currency translation loss of $520 million for 2008, which primarily reflected a $1.1 billion reduction to PP&E offset by a reduction of $580 million to other net liabilities. Changes in exchange rates resulted in a foreign currency translation gain of $65 million for 2007, which primarily reflected a $173 million increase in PP&E offset by an increase of $108 million to other net liabilities. Gains or losses relating to foreign currency transactions are recognized currently in income. The net transaction losses were insignificant in 2009 and 2007, and $2 million in 2008. New Accounting Guidance Adopted (PPL, PPL Energy Supply and PPL Electric) Accounting for Convertible Debt Instruments That May Be Settled in Cash upon Conversion (Including Partial Cash Settlement) Effective January 1, 2009, PPL and its subsidiaries retrospectively adopted accounting guidance that requires an issuer to separately account for the liability and equity components of convertible debt instruments that may be settled in cash (or other assets) upon conversion in a manner that reflects the issuer's nonconvertible debt borrowing rate when interest cost is recognized in subsequent periods. The discount that results from separating the liability and equity components will be amortized over the life of the debt and recognized as interest expense. This guidance was applicable to PPL Energy Supply's 2-5/8% Convertible Senior Notes due 2023 (Convertible Senior Notes), which upon conversion required cash settlement of the principal amount and permitted settlement of any conversion premium in cash or PPL common stock. During 2008, all of the Convertible Senior Notes were either converted at the election of the holders or redeemed at par as a result of PPL Energy Supply calling the notes for redemption. This guidance required only retrospective application with regard to the Convertible Senior Notes, as none of these notes were outstanding at the effective date. The retrospective application impacted PPL in periods prior to 2006. As such, PPL reduced the opening balance of "Earnings reinvested" by $13 million with a corresponding increase to "Capital in excess of par value."
Business Combinations Effective January 1, 2009, PPL and its subsidiaries prospectively adopted accounting guidance that changes the accounting and reporting for business combinations occurring after its adoption. In addition, this guidance requires entities to recognize changes in unrecognized tax benefits acquired in a business combination, including business combinations that occurred prior to January 1, 2009, in income tax expense rather than in goodwill. The January 1, 2009 adoption did not have a significant impact on PPL and its subsidiaries; however, the impact in future periods could be material. In the first quarter of 2009, PPL and PPL Energy Supply recorded an income tax benefit of $14 million as a result of settling an income tax dispute. Prior to the adoption of this guidance, $7 million of this income tax benefit would have been recorded as a reduction to goodwill. Noncontrolling Interests in Consolidated Financial Statements Effective January 1, 2009, PPL and its subsidiaries adopted accounting guidance that was issued to improve the relevancy, comparability, and transparency of the financial information an entity provides when it has a noncontrolling interest in a subsidiary and when it changes its ownership interest in a subsidiary. This guidance: • requires ownership interests in subsidiaries held by parties
other than the parent to be presented in the consolidated statement of financial position within equity, but separate from the parent's equity;
• requires the amount of consolidated net income attributable to the parent and to the noncontrolling interest to be presented on the face of the consolidated statement of income;
• addresses the accounting for changes in a parent's ownership interest while the parent retains its controlling financial interest in its subsidiary and for the deconsolidation of a subsidiary; and
• requires enhanced disclosures relating to noncontrolling interests.
PPL and its subsidiaries adopted this guidance prospectively except for the presentation and disclosure requirements, which required retrospective application. At December 31, 2009 and 2008, PPL reflected PPL Electric's preferred securities of $301 million within "Noncontrolling Interests" on the Balance Sheets. In addition, at December 31, 2009 and 2008, PPL and PPL Energy Supply reflected previously recorded minority interests of $18 million within "Noncontrolling Interests" on the Balance Sheets. Determining Whether Instruments Granted in Share-Based Payment Transactions Are Participating Securities Effective January 1, 2009, PPL and its subsidiaries retrospectively adopted accounting guidance that requires unvested share-based payment awards that contain
122
nonforfeitable rights to dividends or dividend equivalents to be considered participating securities and to be included in the computation of EPS under the two-class method. The two-class method treats share-based payment awards that pay nonforfeitable dividends as a separate class of stock for purposes of computing EPS. The adoption did not have a material impact on PPL and its subsidiaries. As a result of its application, PPL's restricted stock, restricted stock units, and stock units granted to directors are now considered participating securities; therefore, PPL is required to compute EPS under the two-class method. For the years ended December 31, 2008, the retrospective application caused PPL's basic EPS for income from continuing operations after income taxes available to PPL Corporation common shareholders to decrease by $0.01 and basic EPS for net income available to PPL Corporation common shareowners to decrease by $0.01. For the year ended December 31, 2007, the retrospective application caused PPL's basic EPS for income from continuing operations after income taxes available to PPL Corporation common shareholders to decrease by $0.01 and basic EPS for net income available to PPL Corporation common shareowners to decrease by $0.02. Additionally, PPL's diluted EPS for net income available to PPL Corporation common shareowners decreased by $0.01 for the year ended December 31, 2007. See Note 4 for additional information. Disclosures about Derivative Instruments and Hedging Activities Effective January 1, 2009, PPL and its subsidiaries prospectively adopted accounting guidance that applies to all derivative instruments, including bifurcated derivative instruments and nonderivative instruments that are designated and qualify as hedging instruments, as well as related hedged items. This guidance requires an entity to expand disclosures to provide greater transparency about: • how and why it uses derivative instruments; • how derivative instruments and related hedged items are
accounted for; and • how derivative instruments and related hedged items affect
its financial position, results of operations and cash flows. The guidance was issued to provide greater transparency by enhancing existing disclosures; therefore, the adoption did not have a material impact on PPL and its subsidiaries' financial statements. The enhanced disclosures are presented in Note 18. Fair Value Measurements Effective January 1, 2008, PPL and its subsidiaries adopted accounting guidance that provides a framework for measuring fair value, but elected to defer, until 2009, applying this guidance to nonfinancial assets and nonfinancial liabilities that are not recognized or disclosed at fair value in the financial statements on a recurring basis. Effective January 1, 2009, PPL and its subsidiaries fully applied this guidance to fair value measurement concepts used within their financial statements where applicable.
Issuer's Accounting for Liabilities Measured at Fair Value with a Third-Party Credit Enhancement Effective January 1, 2009, PPL and its subsidiaries prospectively adopted accounting guidance that applies to liabilities issued with an inseparable third-party credit enhancement when the liability is measured or disclosed at fair value on a recurring basis. This guidance indicates that an issuer shall disclose the existence of a third-party credit enhancement, and the fair value measurement of the liability shall not include the effect of this third-party credit enhancement. The initial adoption did not have a material impact on PPL and its subsidiaries' financial statements, as this guidance only impacts the fair value disclosure of certain credit-enhanced debt instruments. See "Financial Instruments Not Recorded at Fair Value" within Note 17 for these disclosures. Determining Fair Value When the Volume and Level of Activity for the Asset or Liability Have Significantly Decreased and Identifying Transactions That Are Not Orderly Effective April 1, 2009, PPL and its subsidiaries prospectively adopted accounting guidance that: • provides additional direction for estimating fair value when
the volume and level of activity for the asset or liability have significantly decreased;
• includes guidance on identifying circumstances that indicate a transaction is not orderly; and
• emphasizes that the objective of a fair value measurement remains the same; that is, fair value is the price that would be received to sell an asset or paid to transfer a liability in an orderly transaction between market participants at the measurement date under current market conditions.
Comparative disclosures are required only for periods ending after initial adoption. The adoption did not have a material impact on PPL and its subsidiaries' financial statements. Recognition and Presentation of Other-Than-Temporary Impairments Effective April 1, 2009, PPL and its subsidiaries retrospectively adopted accounting guidance that modified the requirement that an entity have the intent and ability to hold an impaired debt security to recovery in order to conclude an impairment was temporary. Under this guidance, an impairment of a debt security is other than temporary if (1) an entity has the intent to sell the security, (2) it is more likely than not that an entity will be required to sell the security before recovery, or (3) an entity does not expect to recover the entire amortized cost basis of the security, referred to as a credit loss. In addition, this guidance changes the recording of an other-than-temporary impairment on a debt security if the reason for the other-than-temporary impairment is the recognition of a credit loss. In this situation, the other-than-temporary impairment will be separated into the credit loss component,
123
which is recognized in earnings, and the remainder of the other-than-temporary impairment, which is recorded in OCI. For a debt security held at the beginning of the period of adoption for which an other-than-temporary impairment was previously recognized, if an entity does not intend to sell the debt security and it is not more likely than not that the entity will be required to sell the debt security before recovery of its amortized cost basis, the cumulative effect of applying this guidance was recognized as an adjustment to the opening balance of retained earnings with a corresponding adjustment to AOCI. This guidance affects the accounting for PPL's and PPL Energy Supply's investments in debt securities in the NDT funds. Prior to its application, PPL and PPL Energy Supply were unable to demonstrate the ability to hold an impaired debt security in the NDT funds until recovery; therefore, an unrealized loss on a debt security always represented an other-than-temporary impairment that required a current period charge to earnings. Based on the application of this guidance, certain unrealized losses on investments in debt securities are no longer considered other-than-temporary impairments and will be recorded to OCI. Related SEC guidance was also amended to no longer apply to debt securities. As a result of the adoption, PPL and PPL Energy Supply recorded an immaterial cumulative effect adjustment to the opening balance of retained earnings with a corresponding reduction to AOCI. The FASB Accounting Standards Codification™ and the Hierarchy of Generally Accepted Accounting Principles Beginning with the period ended September 30, 2009, PPL and its subsidiaries adopted accounting guidance that establishes the FASB Accounting Standards CodificationTM (ASC) as the primary source of authoritative GAAP, other than guidance issued by the SEC. This guidance eliminates the previous GAAP hierarchy of accounting and reporting guidance and replaces it with two levels of literature: authoritative and non-authoritative, and organizes GAAP pronouncements in a consistent manner by accounting topic. The adoption did not impact PPL and its subsidiaries' results of operations, cash flows or financial positions since the ASC did not change existing GAAP. Employers' Disclosures about Pensions and Other Postretirement Benefits Effective December 31, 2009, PPL and its subsidiaries prospectively adopted accounting guidance that requires an employer to enhance its disclosures about plan assets of defined benefit plans to provide users of financial statements with an understanding of: • how investment allocation decisions are made, including the
factors that are pertinent to an understanding of investment policies and strategies;
• the major classes of plan assets; • the inputs and valuation techniques used to measure the fair
value of plan assets;
• the effect of fair value measurements using significant unobservable inputs (Level 3) on changes in plan assets for the period; and
• significant concentrations of risk within plan assets. This guidance was issued to provide greater transparency within disclosures; therefore, the adoption did not have a material impact on PPL and its subsidiaries' financial statements. The enhanced disclosures are presented in Note 12. New Accounting Guidance Pending Adoption See Note 22 for a discussion of new accounting guidance pending adoption. 2. Segment and Related Information (PPL and PPL Energy Supply) PPL's reportable segments are Supply, International Delivery and Pennsylvania Delivery. The Supply segment primarily consists of the domestic energy marketing and trading activities, as well as the generation and development operations of PPL Energy Supply. In 2009 and 2007, PPL Energy Supply sold or agreed to sell certain Supply segment businesses. See Notes 8 and 9 for additional information. The International Delivery segment consists primarily of the electricity distribution operations in the U.K. In 2007, PPL completed the sale of its Latin American businesses. In 2008, the International Delivery segment recognized income tax benefits and miscellaneous expenses in Discontinued Operations in connection with the dissolution of certain Latin American holding companies. In 2009, the International Delivery segment recognized $24 million of income tax expense in Discontinued Operations related to a correction of the calculation of tax bases of the Latin American businesses sold in 2007. See Note 9 for additional information. The Pennsylvania Delivery segment includes the regulated electric delivery operations of PPL Electric. This segment also included the gas delivery operations of PPL Gas Utilities prior to its sale in October 2008. See Note 9 for additional information. The operating results of the Long Island generation business, the majority of the Maine hydroelectric generation business, the Latin American businesses and the natural gas distribution and propane businesses have been classified as Discontinued Operations on the Statements of Income. Therefore, with the exception of net income attributable to PPL/PPL Energy Supply, the operating results from these businesses have been excluded from the income statement data tables below. PPL Energy Supply's reportable segments are Supply and International Delivery. The International Delivery segment at the PPL Energy Supply level is consistent with the International Delivery segment at the PPL level. The Supply segment information reported at the PPL Energy Supply level will not agree with the Supply segment information reported at the PPL level because additional Supply segment functions exist at PPL that are outside of PPL Energy Supply. Furthermore, certain
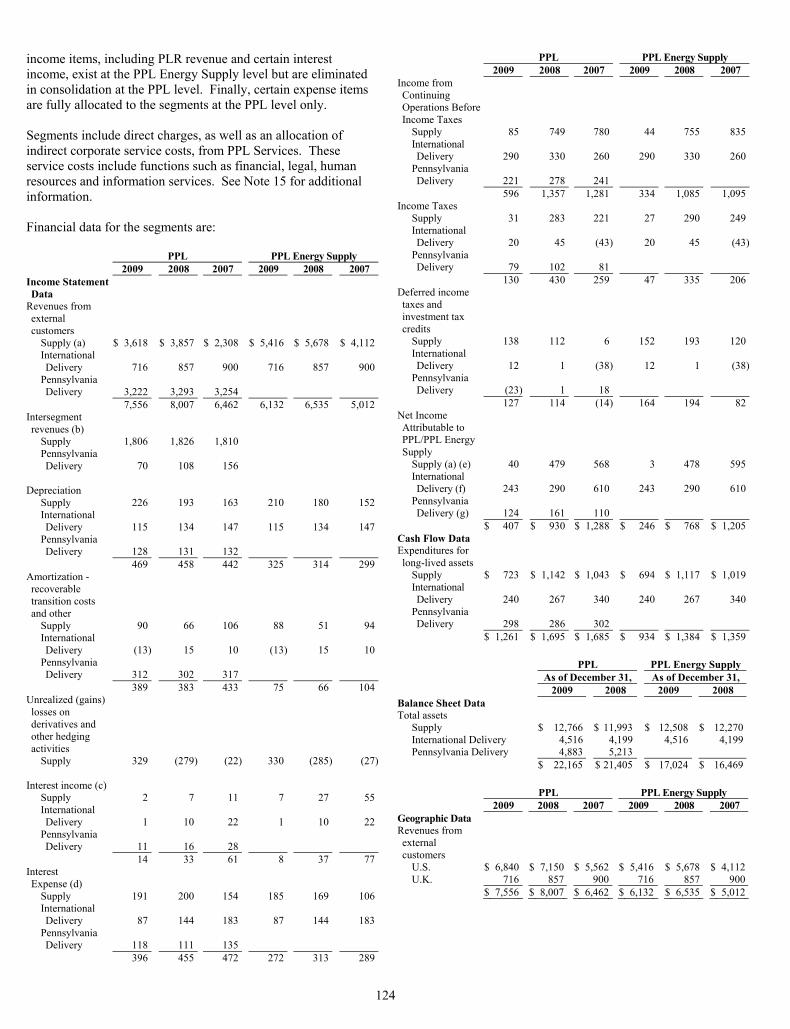
124
income items, including PLR revenue and certain interest income, exist at the PPL Energy Supply level but are eliminated in consolidation at the PPL level. Finally, certain expense items are fully allocated to the segments at the PPL level only. Segments include direct charges, as well as an allocation of indirect corporate service costs, from PPL Services. These service costs include functions such as financial, legal, human resources and information services. See Note 15 for additional information. Financial data for the segments are:
PPL PPL Energy Supply 2009 2008 2007 2009 2008 2007
Income Statement Data
Revenues from external customers
Supply (a) $ 3,618 $ 3,857 $ 2,308 $ 5,416 $ 5,678 $ 4,112International Delivery 716 857 900 716 857 900
Pennsylvania Delivery 3,222 3,293 3,254
7,556 8,007 6,462 6,132 6,535 5,012Intersegment revenues (b)
Supply 1,806 1,826 1,810 Pennsylvania Delivery 70 108 156
Depreciation
Supply 226 193 163 210 180 152International Delivery 115 134 147 115 134 147
Pennsylvania Delivery 128 131 132
469 458 442 325 314 299Amortization - recoverable transition costs and other
Supply 90 66 106 88 51 94International Delivery (13) 15 10 (13) 15 10
Pennsylvania Delivery 312 302 317
389 383 433 75 66 104Unrealized (gains) losses on derivatives and other hedging activities
Supply 329 (279) (22) 330 (285) (27) Interest income (c)
Supply 2 7 11 7 27 55International Delivery 1 10 22 1 10 22
Pennsylvania Delivery 11 16 28
14 33 61 8 37 77Interest Expense (d)
Supply 191 200 154 185 169 106International Delivery 87 144 183 87 144 183
Pennsylvania Delivery 118 111 135
396 455 472 272 313 289
PPL PPL Energy Supply 2009 2008 2007 2009 2008 2007
Income from Continuing Operations Before Income Taxes
Supply 85 749 780 44 755 835International Delivery 290 330 260 290 330 260
Pennsylvania Delivery 221 278 241
596 1,357 1,281 334 1,085 1,095Income Taxes
Supply 31 283 221 27 290 249International Delivery 20 45 (43) 20 45 (43)
Pennsylvania Delivery 79 102 81
130 430 259 47 335 206Deferred income taxes and investment tax credits
Supply 138 112 6 152 193 120International Delivery 12 1 (38) 12 1 (38)
Pennsylvania Delivery (23) 1 18
127 114 (14) 164 194 82Net Income Attributable to PPL/PPL Energy Supply
Supply (a) (e) 40 479 568 3 478 595International Delivery (f) 243 290 610 243 290 610
Pennsylvania Delivery (g) 124 161 110
$ 407 $ 930 $ 1,288 $ 246 $ 768 $ 1,205Cash Flow Data Expenditures for long-lived assets
Supply $ 723 $ 1,142 $ 1,043 $ 694 $ 1,117 $ 1,019International Delivery 240 267 340 240 267 340
Pennsylvania Delivery 298 286 302
$ 1,261 $ 1,695 $ 1,685 $ 934 $ 1,384 $ 1,359 PPL PPL Energy Supply As of December 31, As of December 31, 2009 2008 2009 2008 Balance Sheet Data Total assets
Supply $ 12,766 $ 11,993 $ 12,508 $ 12,270International Delivery 4,516 4,199 4,516 4,199Pennsylvania Delivery 4,883 5,213
$ 22,165 $ 21,405 $ 17,024 $ 16,469
PPL PPL Energy Supply 2009 2008 2007 2009 2008 2007
Geographic Data Revenues from external customers
U.S. $ 6,840 $ 7,150 $ 5,562 $ 5,416 $ 5,678 $ 4,112U.K. 716 857 900 716 857 900
$ 7,556 $ 8,007 $ 6,462 $ 6,132 $ 6,535 $ 5,012
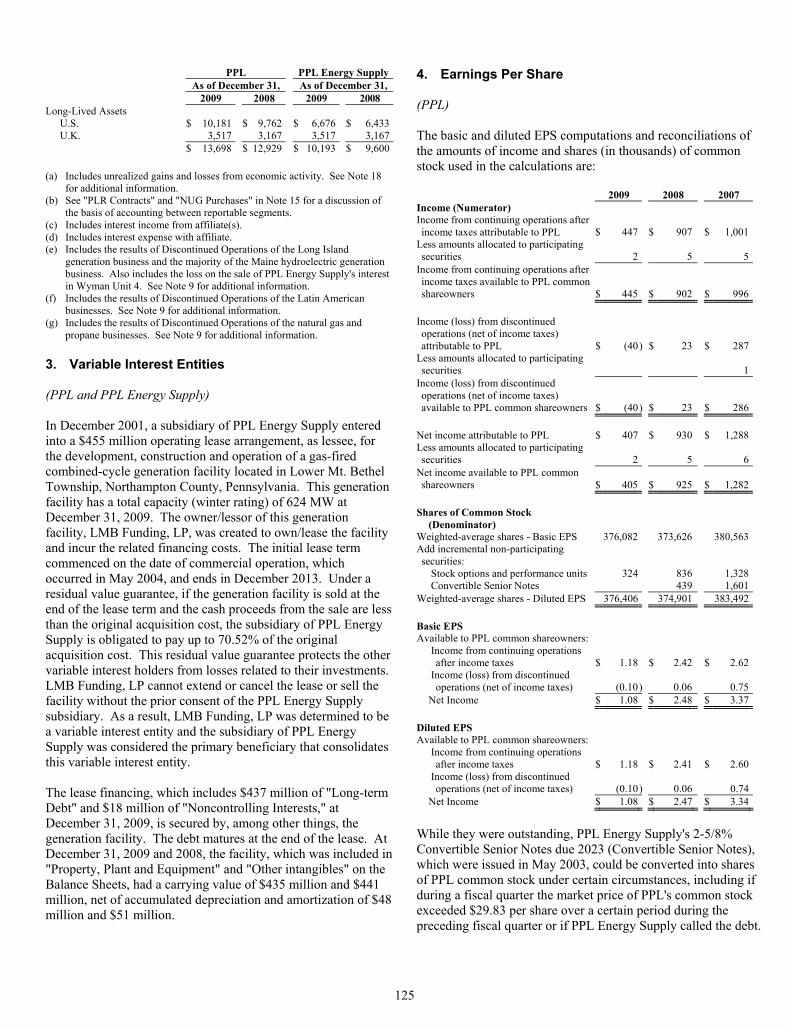
125
PPL PPL Energy Supply As of December 31, As of December 31, 2009 2008 2009 2008
Long-Lived Assets U.S. $ 10,181 $ 9,762 $ 6,676 $ 6,433U.K. 3,517 3,167 3,517 3,167
$ 13,698 $ 12,929 $ 10,193 $ 9,600 (a) Includes unrealized gains and losses from economic activity. See Note 18
for additional information. (b) See "PLR Contracts" and "NUG Purchases" in Note 15 for a discussion of
the basis of accounting between reportable segments. (c) Includes interest income from affiliate(s). (d) Includes interest expense with affiliate. (e) Includes the results of Discontinued Operations of the Long Island
generation business and the majority of the Maine hydroelectric generation business. Also includes the loss on the sale of PPL Energy Supply's interest in Wyman Unit 4. See Note 9 for additional information.
(f) Includes the results of Discontinued Operations of the Latin American businesses. See Note 9 for additional information.
(g) Includes the results of Discontinued Operations of the natural gas and propane businesses. See Note 9 for additional information.
3. Variable Interest Entities (PPL and PPL Energy Supply) In December 2001, a subsidiary of PPL Energy Supply entered into a $455 million operating lease arrangement, as lessee, for the development, construction and operation of a gas-fired combined-cycle generation facility located in Lower Mt. Bethel Township, Northampton County, Pennsylvania. This generation facility has a total capacity (winter rating) of 624 MW at December 31, 2009. The owner/lessor of this generation facility, LMB Funding, LP, was created to own/lease the facility and incur the related financing costs. The initial lease term commenced on the date of commercial operation, which occurred in May 2004, and ends in December 2013. Under a residual value guarantee, if the generation facility is sold at the end of the lease term and the cash proceeds from the sale are less than the original acquisition cost, the subsidiary of PPL Energy Supply is obligated to pay up to 70.52% of the original acquisition cost. This residual value guarantee protects the other variable interest holders from losses related to their investments. LMB Funding, LP cannot extend or cancel the lease or sell the facility without the prior consent of the PPL Energy Supply subsidiary. As a result, LMB Funding, LP was determined to be a variable interest entity and the subsidiary of PPL Energy Supply was considered the primary beneficiary that consolidates this variable interest entity. The lease financing, which includes $437 million of "Long-term Debt" and $18 million of "Noncontrolling Interests," at December 31, 2009, is secured by, among other things, the generation facility. The debt matures at the end of the lease. At December 31, 2009 and 2008, the facility, which was included in "Property, Plant and Equipment" and "Other intangibles" on the Balance Sheets, had a carrying value of $435 million and $441 million, net of accumulated depreciation and amortization of $48 million and $51 million.
4. Earnings Per Share (PPL) The basic and diluted EPS computations and reconciliations of the amounts of income and shares (in thousands) of common stock used in the calculations are: 2009 2008 2007 Income (Numerator) Income from continuing operations after income taxes attributable to PPL $ 447 $ 907 $ 1,001
Less amounts allocated to participating securities 2 5 5
Income from continuing operations after income taxes available to PPL common shareowners $ 445 $ 902 $ 996
Income (loss) from discontinued operations (net of income taxes) attributable to PPL $ (40 ) $ 23 $ 287
Less amounts allocated to participating securities 1
Income (loss) from discontinued operations (net of income taxes) available to PPL common shareowners $ (40 ) $ 23 $ 286
Net income attributable to PPL $ 407 $ 930 $ 1,288Less amounts allocated to participating securities 2 5 6
Net income available to PPL common shareowners $ 405 $ 925 $ 1,282
Shares of Common Stock
(Denominator) Weighted-average shares - Basic EPS 376,082 373,626 380,563Add incremental non-participating securities:
Stock options and performance units 324 836 1,328Convertible Senior Notes 439 1,601
Weighted-average shares - Diluted EPS 376,406 374,901 383,492 Basic EPS Available to PPL common shareowners:
Income from continuing operations after income taxes $ 1.18 $ 2.42 $ 2.62
Income (loss) from discontinued operations (net of income taxes) (0.10 ) 0.06 0.75
Net Income $ 1.08 $ 2.48 $ 3.37 Diluted EPS Available to PPL common shareowners:
Income from continuing operations after income taxes $ 1.18 $ 2.41 $ 2.60
Income (loss) from discontinued operations (net of income taxes) (0.10 ) 0.06 0.74
Net Income $ 1.08 $ 2.47 $ 3.34
While they were outstanding, PPL Energy Supply's 2-5/8% Convertible Senior Notes due 2023 (Convertible Senior Notes), which were issued in May 2003, could be converted into shares of PPL common stock under certain circumstances, including if during a fiscal quarter the market price of PPL's common stock exceeded $29.83 per share over a certain period during the preceding fiscal quarter or if PPL Energy Supply called the debt.
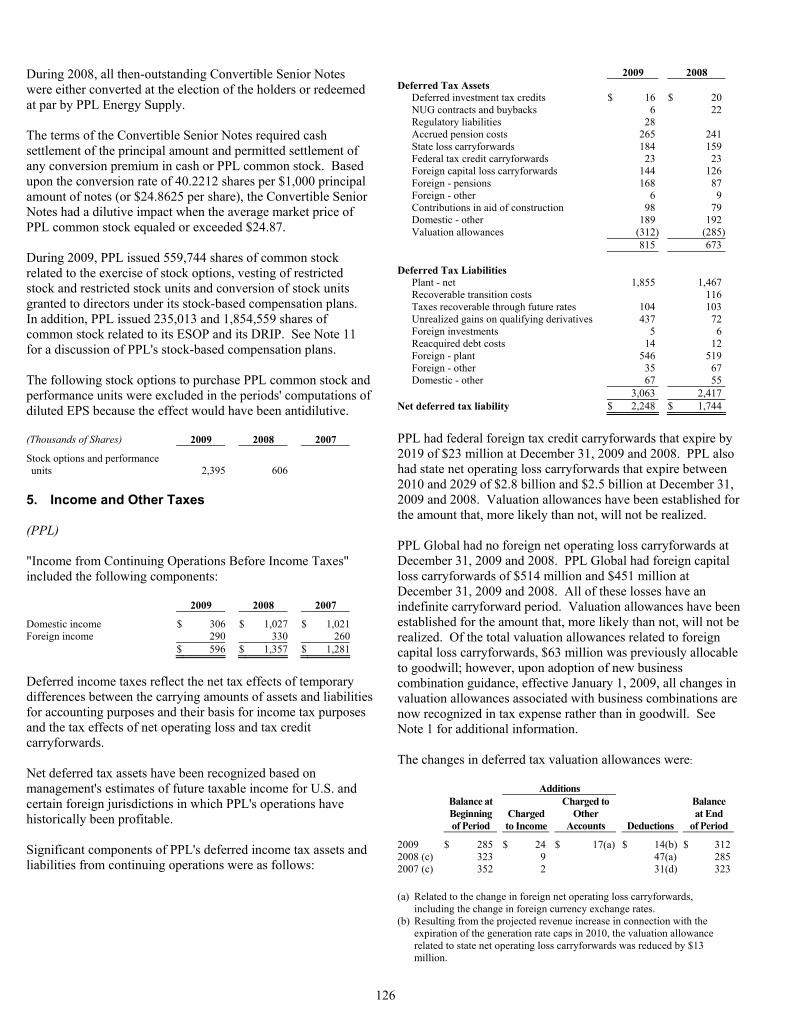
126
During 2008, all then-outstanding Convertible Senior Notes were either converted at the election of the holders or redeemed at par by PPL Energy Supply. The terms of the Convertible Senior Notes required cash settlement of the principal amount and permitted settlement of any conversion premium in cash or PPL common stock. Based upon the conversion rate of 40.2212 shares per $1,000 principal amount of notes (or $24.8625 per share), the Convertible Senior Notes had a dilutive impact when the average market price of PPL common stock equaled or exceeded $24.87. During 2009, PPL issued 559,744 shares of common stock related to the exercise of stock options, vesting of restricted stock and restricted stock units and conversion of stock units granted to directors under its stock-based compensation plans. In addition, PPL issued 235,013 and 1,854,559 shares of common stock related to its ESOP and its DRIP. See Note 11 for a discussion of PPL's stock-based compensation plans. The following stock options to purchase PPL common stock and performance units were excluded in the periods' computations of diluted EPS because the effect would have been antidilutive. (Thousands of Shares) 2009 2008 2007
Stock options and performance units 2,395 606
5. Income and Other Taxes (PPL) "Income from Continuing Operations Before Income Taxes" included the following components: 2009 2008 2007
Domestic income $ 306 $ 1,027 $ 1,021Foreign income 290 330 260 $ 596 $ 1,357 $ 1,281
Deferred income taxes reflect the net tax effects of temporary differences between the carrying amounts of assets and liabilities for accounting purposes and their basis for income tax purposes and the tax effects of net operating loss and tax credit carryforwards. Net deferred tax assets have been recognized based on management's estimates of future taxable income for U.S. and certain foreign jurisdictions in which PPL's operations have historically been profitable. Significant components of PPL's deferred income tax assets and liabilities from continuing operations were as follows:
2009 2008
Deferred Tax Assets Deferred investment tax credits $ 16 $ 20NUG contracts and buybacks 6 22Regulatory liabilities 28 Accrued pension costs 265 241State loss carryforwards 184 159Federal tax credit carryforwards 23 23Foreign capital loss carryforwards 144 126Foreign - pensions 168 87Foreign - other 6 9Contributions in aid of construction 98 79Domestic - other 189 192Valuation allowances (312) (285) 815 673
Deferred Tax Liabilities
Plant - net 1,855 1,467Recoverable transition costs 116Taxes recoverable through future rates 104 103Unrealized gains on qualifying derivatives 437 72Foreign investments 5 6Reacquired debt costs 14 12Foreign - plant 546 519Foreign - other 35 67Domestic - other 67 55 3,063 2,417
Net deferred tax liability $ 2,248 $ 1,744
PPL had federal foreign tax credit carryforwards that expire by 2019 of $23 million at December 31, 2009 and 2008. PPL also had state net operating loss carryforwards that expire between 2010 and 2029 of $2.8 billion and $2.5 billion at December 31, 2009 and 2008. Valuation allowances have been established for the amount that, more likely than not, will not be realized. PPL Global had no foreign net operating loss carryforwards at December 31, 2009 and 2008. PPL Global had foreign capital loss carryforwards of $514 million and $451 million at December 31, 2009 and 2008. All of these losses have an indefinite carryforward period. Valuation allowances have been established for the amount that, more likely than not, will not be realized. Of the total valuation allowances related to foreign capital loss carryforwards, $63 million was previously allocable to goodwill; however, upon adoption of new business combination guidance, effective January 1, 2009, all changes in valuation allowances associated with business combinations are now recognized in tax expense rather than in goodwill. See Note 1 for additional information. The changes in deferred tax valuation allowances were:
Additions
Balance at Beginning of Period
Charged to Income
Charged to Other
Accounts Deductions
Balance at End
of Period
2009 $ 285 $ 24 $ 17(a) $ 14(b) $ 3122008 (c) 323 9 47(a) 2852007 (c) 352 2 31(d) 323 (a) Related to the change in foreign net operating loss carryforwards,
including the change in foreign currency exchange rates. (b) Resulting from the projected revenue increase in connection with the
expiration of the generation rate caps in 2010, the valuation allowance related to state net operating loss carryforwards was reduced by $13 million.
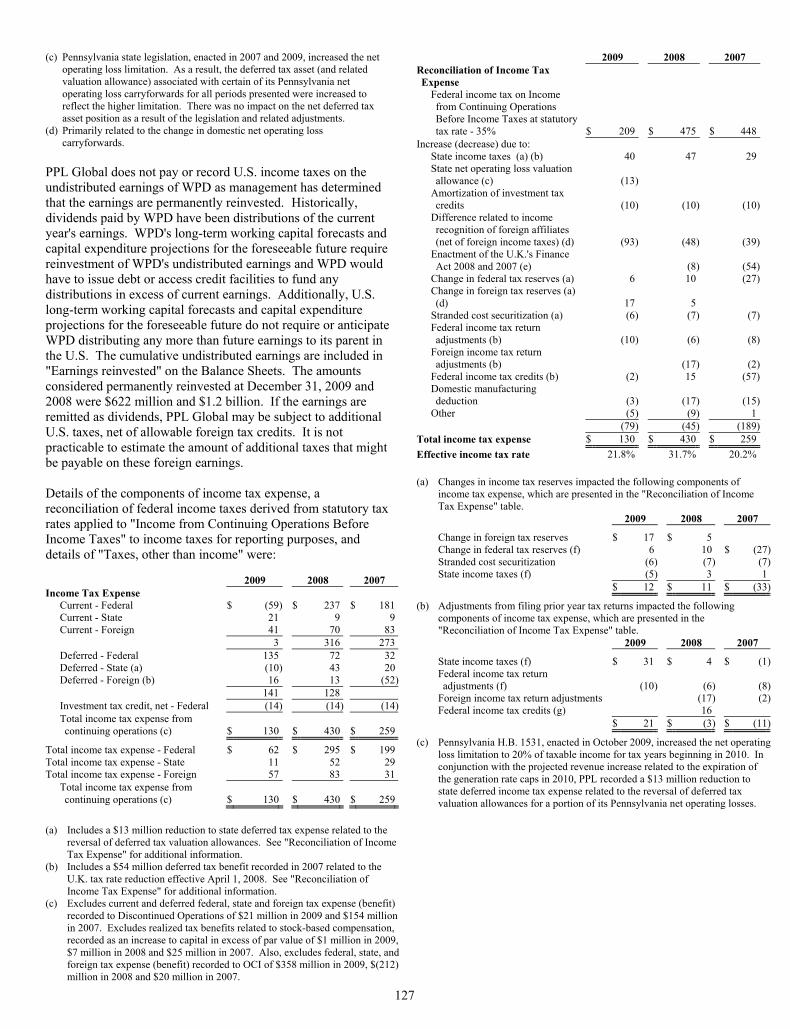
127
(c) Pennsylvania state legislation, enacted in 2007 and 2009, increased the net operating loss limitation. As a result, the deferred tax asset (and related valuation allowance) associated with certain of its Pennsylvania net operating loss carryforwards for all periods presented were increased to reflect the higher limitation. There was no impact on the net deferred tax asset position as a result of the legislation and related adjustments.
(d) Primarily related to the change in domestic net operating loss carryforwards.
PPL Global does not pay or record U.S. income taxes on the undistributed earnings of WPD as management has determined that the earnings are permanently reinvested. Historically, dividends paid by WPD have been distributions of the current year's earnings. WPD's long-term working capital forecasts and capital expenditure projections for the foreseeable future require reinvestment of WPD's undistributed earnings and WPD would have to issue debt or access credit facilities to fund any distributions in excess of current earnings. Additionally, U.S. long-term working capital forecasts and capital expenditure projections for the foreseeable future do not require or anticipate WPD distributing any more than future earnings to its parent in the U.S. The cumulative undistributed earnings are included in "Earnings reinvested" on the Balance Sheets. The amounts considered permanently reinvested at December 31, 2009 and 2008 were $622 million and $1.2 billion. If the earnings are remitted as dividends, PPL Global may be subject to additional U.S. taxes, net of allowable foreign tax credits. It is not practicable to estimate the amount of additional taxes that might be payable on these foreign earnings. Details of the components of income tax expense, a reconciliation of federal income taxes derived from statutory tax rates applied to "Income from Continuing Operations Before Income Taxes" to income taxes for reporting purposes, and details of "Taxes, other than income" were: 2009 2008 2007 Income Tax Expense
Current - Federal $ (59) $ 237 $ 181Current - State 21 9 9Current - Foreign 41 70 83 3 316 273Deferred - Federal 135 72 32Deferred - State (a) (10) 43 20Deferred - Foreign (b) 16 13 (52) 141 128 Investment tax credit, net - Federal (14) (14) (14)Total income tax expense from continuing operations (c) $ 130 $ 430 $ 259
Total income tax expense - Federal $ 62 $ 295 $ 199Total income tax expense - State 11 52 29Total income tax expense - Foreign 57 83 31
Total income tax expense from continuing operations (c) $ 130 $ 430 $ 259
(a) Includes a $13 million reduction to state deferred tax expense related to the
reversal of deferred tax valuation allowances. See "Reconciliation of Income Tax Expense" for additional information.
(b) Includes a $54 million deferred tax benefit recorded in 2007 related to the U.K. tax rate reduction effective April 1, 2008. See "Reconciliation of Income Tax Expense" for additional information.
(c) Excludes current and deferred federal, state and foreign tax expense (benefit) recorded to Discontinued Operations of $21 million in 2009 and $154 million in 2007. Excludes realized tax benefits related to stock-based compensation, recorded as an increase to capital in excess of par value of $1 million in 2009, $7 million in 2008 and $25 million in 2007. Also, excludes federal, state, and foreign tax expense (benefit) recorded to OCI of $358 million in 2009, $(212)million in 2008 and $20 million in 2007.
2009 2008 2007 Reconciliation of Income Tax Expense
Federal income tax on Income from Continuing Operations Before Income Taxes at statutory tax rate - 35% $ 209 $ 475 $ 448
Increase (decrease) due to: State income taxes (a) (b) 40 47 29State net operating loss valuation allowance (c) (13 )
Amortization of investment tax credits (10 ) (10) (10)
Difference related to income recognition of foreign affiliates (net of foreign income taxes) (d) (93 ) (48) (39)
Enactment of the U.K.'s Finance Act 2008 and 2007 (e) (8) (54)
Change in federal tax reserves (a) 6 10 (27)Change in foreign tax reserves (a) (d) 17 5
Stranded cost securitization (a) (6 ) (7) (7)Federal income tax return adjustments (b) (10 ) (6) (8)
Foreign income tax return adjustments (b) (17) (2)
Federal income tax credits (b) (2 ) 15 (57)Domestic manufacturing deduction (3 ) (17) (15)
Other (5 ) (9) 1 (79 ) (45) (189)
Total income tax expense $ 130 $ 430 $ 259Effective income tax rate 21.8% 31.7% 20.2% (a) Changes in income tax reserves impacted the following components of
income tax expense, which are presented in the "Reconciliation of Income Tax Expense" table.
2009 2008 2007
Change in foreign tax reserves $ 17 $ 5 Change in federal tax reserves (f) 6 10 $ (27)Stranded cost securitization (6) (7) (7)State income taxes (f) (5) 3 1
$ 12 $ 11 $ (33)
(b) Adjustments from filing prior year tax returns impacted the following components of income tax expense, which are presented in the "Reconciliation of Income Tax Expense" table.
2009 2008 2007
State income taxes (f) $ 31 $ 4 $ (1)Federal income tax return adjustments (f) (10) (6) (8)
Foreign income tax return adjustments (17) (2)Federal income tax credits (g) 16
$ 21 $ (3) $ (11)
(c) Pennsylvania H.B. 1531, enacted in October 2009, increased the net operating loss limitation to 20% of taxable income for tax years beginning in 2010. In conjunction with the projected revenue increase related to the expiration of the generation rate caps in 2010, PPL recorded a $13 million reduction to state deferred income tax expense related to the reversal of deferred tax valuation allowances for a portion of its Pennsylvania net operating losses.
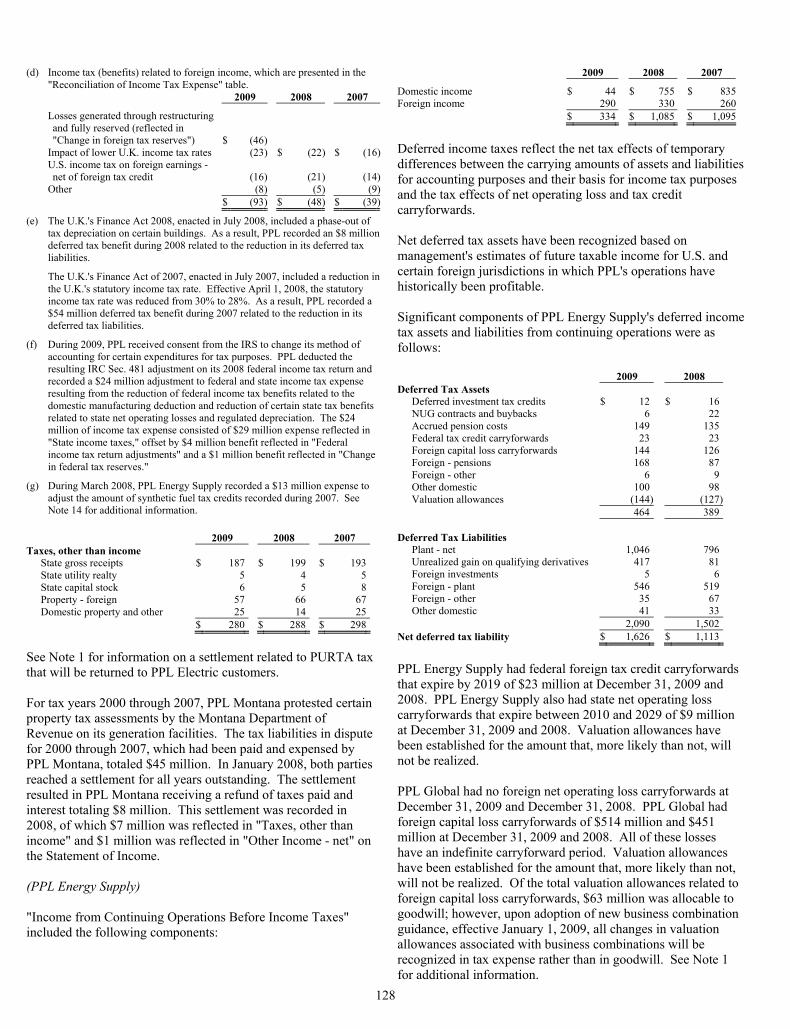
128
(d) Income tax (benefits) related to foreign income, which are presented in the
"Reconciliation of Income Tax Expense" table. 2009 2008 2007
Losses generated through restructuring and fully reserved (reflected in "Change in foreign tax reserves") $ (46 )
Impact of lower U.K. income tax rates (23 ) $ (22) $ (16) U.S. income tax on foreign earnings -
net of foreign tax credit (16 ) (21) (14) Other (8 ) (5) (9)
$ (93 ) $ (48) $ (39)
(e) The U.K.'s Finance Act 2008, enacted in July 2008, included a phase-out of tax depreciation on certain buildings. As a result, PPL recorded an $8 million deferred tax benefit during 2008 related to the reduction in its deferred tax liabilities.
The U.K.'s Finance Act of 2007, enacted in July 2007, included a reduction in the U.K.'s statutory income tax rate. Effective April 1, 2008, the statutory income tax rate was reduced from 30% to 28%. As a result, PPL recorded a $54 million deferred tax benefit during 2007 related to the reduction in its deferred tax liabilities.
(f) During 2009, PPL received consent from the IRS to change its method of accounting for certain expenditures for tax purposes. PPL deducted the resulting IRC Sec. 481 adjustment on its 2008 federal income tax return and recorded a $24 million adjustment to federal and state income tax expense resulting from the reduction of federal income tax benefits related to the domestic manufacturing deduction and reduction of certain state tax benefits related to state net operating losses and regulated depreciation. The $24 million of income tax expense consisted of $29 million expense reflected in "State income taxes," offset by $4 million benefit reflected in "Federal income tax return adjustments" and a $1 million benefit reflected in "Change in federal tax reserves."
(g) During March 2008, PPL Energy Supply recorded a $13 million expense to adjust the amount of synthetic fuel tax credits recorded during 2007. See Note 14 for additional information.
2009 2008 2007
Taxes, other than income State gross receipts $ 187 $ 199 $ 193State utility realty 5 4 5State capital stock 6 5 8Property - foreign 57 66 67Domestic property and other 25 14 25 $ 280 $ 288 $ 298
See Note 1 for information on a settlement related to PURTA tax that will be returned to PPL Electric customers. For tax years 2000 through 2007, PPL Montana protested certain property tax assessments by the Montana Department of Revenue on its generation facilities. The tax liabilities in dispute for 2000 through 2007, which had been paid and expensed by PPL Montana, totaled $45 million. In January 2008, both parties reached a settlement for all years outstanding. The settlement resulted in PPL Montana receiving a refund of taxes paid and interest totaling $8 million. This settlement was recorded in 2008, of which $7 million was reflected in "Taxes, other than income" and $1 million was reflected in "Other Income - net" on the Statement of Income. (PPL Energy Supply) "Income from Continuing Operations Before Income Taxes" included the following components:
2009 2008 2007
Domestic income $ 44 $ 755 $ 835Foreign income 290 330 260 $ 334 $ 1,085 $ 1,095
Deferred income taxes reflect the net tax effects of temporary differences between the carrying amounts of assets and liabilities for accounting purposes and their basis for income tax purposes and the tax effects of net operating loss and tax credit carryforwards. Net deferred tax assets have been recognized based on management's estimates of future taxable income for U.S. and certain foreign jurisdictions in which PPL's operations have historically been profitable. Significant components of PPL Energy Supply's deferred income tax assets and liabilities from continuing operations were as follows: 2009 2008 Deferred Tax Assets
Deferred investment tax credits $ 12 $ 16NUG contracts and buybacks 6 22Accrued pension costs 149 135Federal tax credit carryforwards 23 23Foreign capital loss carryforwards 144 126Foreign - pensions 168 87Foreign - other 6 9Other domestic 100 98Valuation allowances (144) (127) 464 389
Deferred Tax Liabilities
Plant - net 1,046 796Unrealized gain on qualifying derivatives 417 81Foreign investments 5 6Foreign - plant 546 519Foreign - other 35 67Other domestic 41 33
2,090 1,502Net deferred tax liability $ 1,626 $ 1,113
PPL Energy Supply had federal foreign tax credit carryforwards that expire by 2019 of $23 million at December 31, 2009 and 2008. PPL Energy Supply also had state net operating loss carryforwards that expire between 2010 and 2029 of $9 million at December 31, 2009 and 2008. Valuation allowances have been established for the amount that, more likely than not, will not be realized. PPL Global had no foreign net operating loss carryforwards at December 31, 2009 and December 31, 2008. PPL Global had foreign capital loss carryforwards of $514 million and $451 million at December 31, 2009 and 2008. All of these losses have an indefinite carryforward period. Valuation allowances have been established for the amount that, more likely than not, will not be realized. Of the total valuation allowances related to foreign capital loss carryforwards, $63 million was allocable to goodwill; however, upon adoption of new business combination guidance, effective January 1, 2009, all changes in valuation allowances associated with business combinations will be recognized in tax expense rather than in goodwill. See Note 1 for additional information.
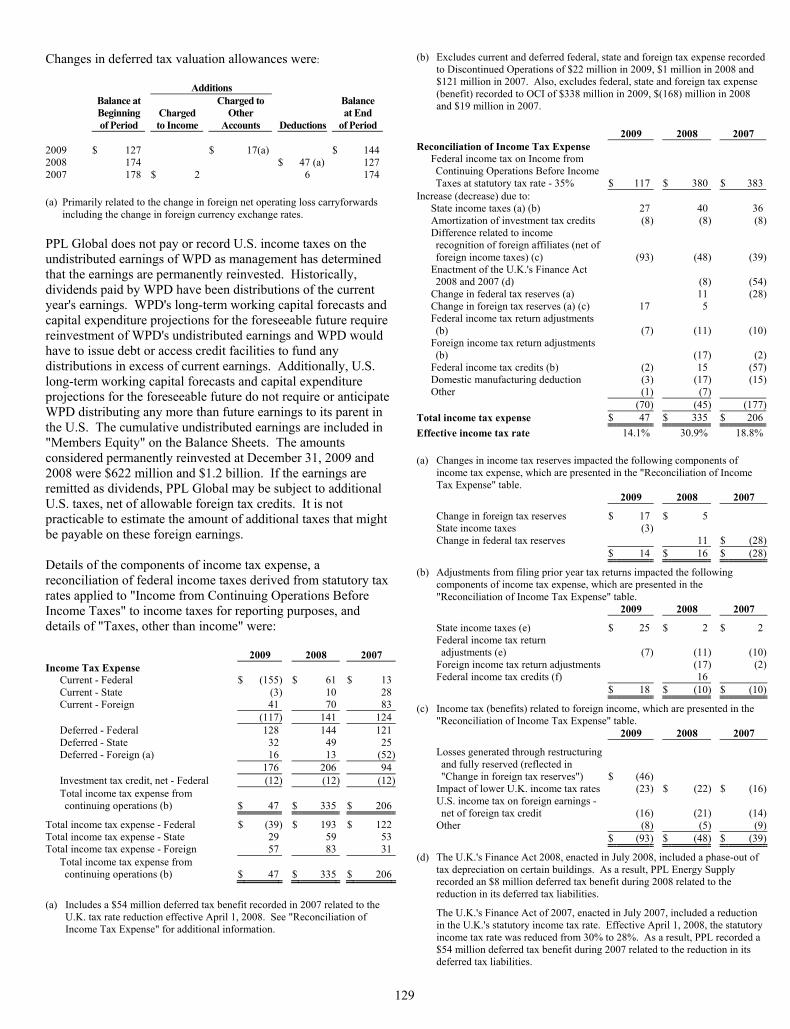
129
Changes in deferred tax valuation allowances were:
Additions
Balance at Beginning of Period
Charged to Income
Charged to Other
Accounts Deductions
Balance at End
of Period 2009 $ 127 $ 17(a) $ 1442008 174 $ 47 (a) 1272007 178 $ 2 6 174 (a) Primarily related to the change in foreign net operating loss carryforwards
including the change in foreign currency exchange rates. PPL Global does not pay or record U.S. income taxes on the undistributed earnings of WPD as management has determined that the earnings are permanently reinvested. Historically, dividends paid by WPD have been distributions of the current year's earnings. WPD's long-term working capital forecasts and capital expenditure projections for the foreseeable future require reinvestment of WPD's undistributed earnings and WPD would have to issue debt or access credit facilities to fund any distributions in excess of current earnings. Additionally, U.S. long-term working capital forecasts and capital expenditure projections for the foreseeable future do not require or anticipate WPD distributing any more than future earnings to its parent in the U.S. The cumulative undistributed earnings are included in "Members Equity" on the Balance Sheets. The amounts considered permanently reinvested at December 31, 2009 and 2008 were $622 million and $1.2 billion. If the earnings are remitted as dividends, PPL Global may be subject to additional U.S. taxes, net of allowable foreign tax credits. It is not practicable to estimate the amount of additional taxes that might be payable on these foreign earnings. Details of the components of income tax expense, a reconciliation of federal income taxes derived from statutory tax rates applied to "Income from Continuing Operations Before Income Taxes" to income taxes for reporting purposes, and details of "Taxes, other than income" were: 2009 2008 2007 Income Tax Expense
Current - Federal $ (155) $ 61 $ 13Current - State (3) 10 28Current - Foreign 41 70 83 (117) 141 124Deferred - Federal 128 144 121Deferred - State 32 49 25Deferred - Foreign (a) 16 13 (52) 176 206 94Investment tax credit, net - Federal (12) (12) (12)Total income tax expense from continuing operations (b) $ 47 $ 335 $ 206
Total income tax expense - Federal $ (39) $ 193 $ 122Total income tax expense - State 29 59 53Total income tax expense - Foreign 57 83 31
Total income tax expense from continuing operations (b) $ 47 $ 335 $ 206
(a) Includes a $54 million deferred tax benefit recorded in 2007 related to the
U.K. tax rate reduction effective April 1, 2008. See "Reconciliation of Income Tax Expense" for additional information.
(b) Excludes current and deferred federal, state and foreign tax expense recorded to Discontinued Operations of $22 million in 2009, $1 million in 2008 and $121 million in 2007. Also, excludes federal, state and foreign tax expense (benefit) recorded to OCI of $338 million in 2009, $(168) million in 2008 and $19 million in 2007.
2009 2008 2007
Reconciliation of Income Tax Expense Federal income tax on Income from Continuing Operations Before Income Taxes at statutory tax rate - 35% $ 117 $ 380 $ 383
Increase (decrease) due to: State income taxes (a) (b) 27 40 36Amortization of investment tax credits (8) (8) (8)Difference related to income recognition of foreign affiliates (net of foreign income taxes) (c) (93) (48) (39)
Enactment of the U.K.'s Finance Act 2008 and 2007 (d) (8) (54)
Change in federal tax reserves (a) 11 (28)Change in foreign tax reserves (a) (c) 17 5 Federal income tax return adjustments (b) (7) (11) (10)
Foreign income tax return adjustments (b) (17) (2)
Federal income tax credits (b) (2) 15 (57)Domestic manufacturing deduction (3) (17) (15)Other (1) (7)
(70) (45) (177)Total income tax expense $ 47 $ 335 $ 206Effective income tax rate 14.1% 30.9% 18.8% (a) Changes in income tax reserves impacted the following components of
income tax expense, which are presented in the "Reconciliation of Income Tax Expense" table.
2009 2008 2007
Change in foreign tax reserves $ 17 $ 5 State income taxes (3) Change in federal tax reserves 11 $ (28)
$ 14 $ 16 $ (28)
(b) Adjustments from filing prior year tax returns impacted the following components of income tax expense, which are presented in the "Reconciliation of Income Tax Expense" table.
2009 2008 2007
State income taxes (e) $ 25 $ 2 $ 2Federal income tax return adjustments (e) (7) (11) (10)
Foreign income tax return adjustments (17) (2)Federal income tax credits (f) 16
$ 18 $ (10) $ (10)
(c) Income tax (benefits) related to foreign income, which are presented in the "Reconciliation of Income Tax Expense" table.
2009 2008 2007
Losses generated through restructuring and fully reserved (reflected in "Change in foreign tax reserves") $ (46)
Impact of lower U.K. income tax rates (23) $ (22) $ (16)U.S. income tax on foreign earnings - net of foreign tax credit (16) (21) (14)
Other (8) (5) (9) $ (93) $ (48) $ (39)
(d) The U.K.'s Finance Act 2008, enacted in July 2008, included a phase-out of tax depreciation on certain buildings. As a result, PPL Energy Supply recorded an $8 million deferred tax benefit during 2008 related to the reduction in its deferred tax liabilities.
The U.K.'s Finance Act of 2007, enacted in July 2007, included a reduction in the U.K.'s statutory income tax rate. Effective April 1, 2008, the statutory income tax rate was reduced from 30% to 28%. As a result, PPL recorded a $54 million deferred tax benefit during 2007 related to the reduction in its deferred tax liabilities.
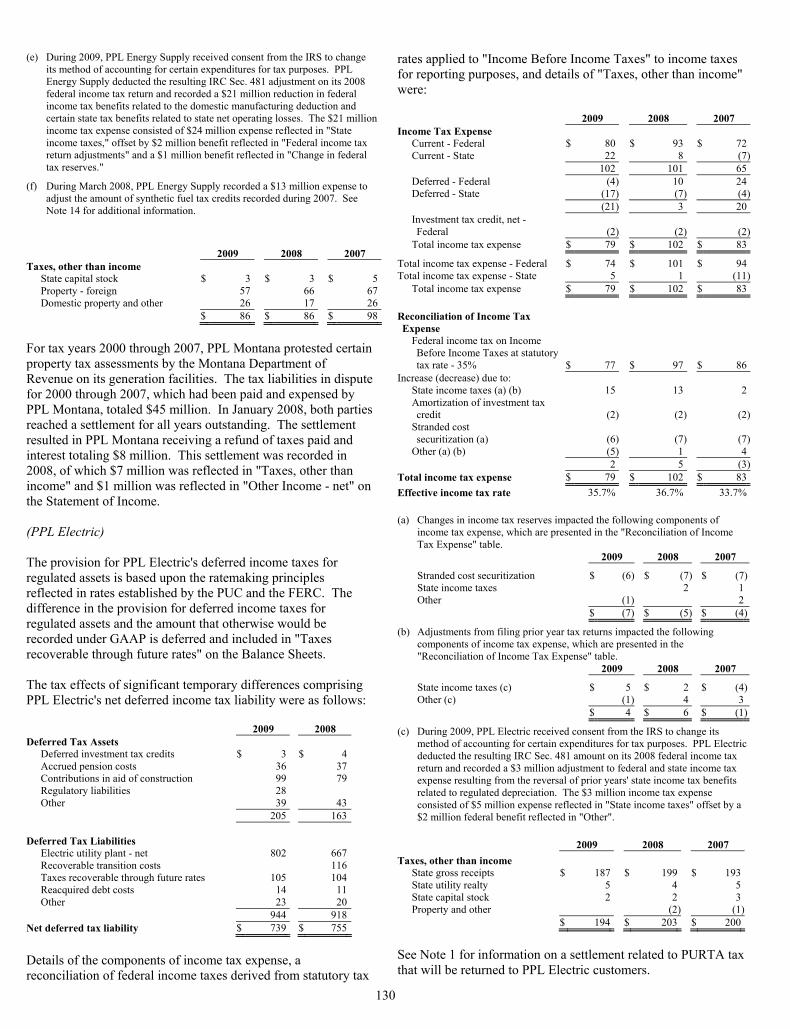
130
(e) During 2009, PPL Energy Supply received consent from the IRS to change its method of accounting for certain expenditures for tax purposes. PPL Energy Supply deducted the resulting IRC Sec. 481 adjustment on its 2008 federal income tax return and recorded a $21 million reduction in federal income tax benefits related to the domestic manufacturing deduction and certain state tax benefits related to state net operating losses. The $21 million income tax expense consisted of $24 million expense reflected in "State income taxes," offset by $2 million benefit reflected in "Federal income tax return adjustments" and a $1 million benefit reflected in "Change in federal tax reserves."
(f) During March 2008, PPL Energy Supply recorded a $13 million expense to adjust the amount of synthetic fuel tax credits recorded during 2007. See Note 14 for additional information.
2009 2008 2007 Taxes, other than income
State capital stock $ 3 $ 3 $ 5Property - foreign 57 66 67Domestic property and other 26 17 26
$ 86 $ 86 $ 98
For tax years 2000 through 2007, PPL Montana protested certain property tax assessments by the Montana Department of Revenue on its generation facilities. The tax liabilities in dispute for 2000 through 2007, which had been paid and expensed by PPL Montana, totaled $45 million. In January 2008, both parties reached a settlement for all years outstanding. The settlement resulted in PPL Montana receiving a refund of taxes paid and interest totaling $8 million. This settlement was recorded in 2008, of which $7 million was reflected in "Taxes, other than income" and $1 million was reflected in "Other Income - net" on the Statement of Income. (PPL Electric) The provision for PPL Electric's deferred income taxes for regulated assets is based upon the ratemaking principles reflected in rates established by the PUC and the FERC. The difference in the provision for deferred income taxes for regulated assets and the amount that otherwise would be recorded under GAAP is deferred and included in "Taxes recoverable through future rates" on the Balance Sheets. The tax effects of significant temporary differences comprising PPL Electric's net deferred income tax liability were as follows: 2009 2008 Deferred Tax Assets
Deferred investment tax credits $ 3 $ 4Accrued pension costs 36 37Contributions in aid of construction 99 79Regulatory liabilities 28 Other 39 43 205 163
Deferred Tax Liabilities
Electric utility plant - net 802 667Recoverable transition costs 116Taxes recoverable through future rates 105 104Reacquired debt costs 14 11Other 23 20 944 918
Net deferred tax liability $ 739 $ 755
Details of the components of income tax expense, a reconciliation of federal income taxes derived from statutory tax
rates applied to "Income Before Income Taxes" to income taxes for reporting purposes, and details of "Taxes, other than income" were: 2009 2008 2007 Income Tax Expense
Current - Federal $ 80 $ 93 $ 72Current - State 22 8 (7)
102 101 65Deferred - Federal (4) 10 24Deferred - State (17) (7) (4)
(21) 3 20Investment tax credit, net - Federal (2) (2) (2)
Total income tax expense $ 79 $ 102 $ 83
Total income tax expense - Federal $ 74 $ 101 $ 94Total income tax expense - State 5 1 (11)
Total income tax expense $ 79 $ 102 $ 83
Reconciliation of Income Tax Expense
Federal income tax on Income Before Income Taxes at statutory tax rate - 35% $ 77 $ 97 $ 86
Increase (decrease) due to: State income taxes (a) (b) 15 13 2Amortization of investment tax credit (2) (2) (2)
Stranded cost securitization (a) (6) (7) (7)
Other (a) (b) (5) 1 4 2 5 (3)Total income tax expense $ 79 $ 102 $ 83Effective income tax rate 35.7% 36.7% 33.7% (a) Changes in income tax reserves impacted the following components of
income tax expense, which are presented in the "Reconciliation of Income Tax Expense" table.
2009 2008 2007
Stranded cost securitization $ (6) $ (7) $ (7)State income taxes 2 1 Other (1) 2
$ (7) $ (5) $ (4)
(b) Adjustments from filing prior year tax returns impacted the following components of income tax expense, which are presented in the "Reconciliation of Income Tax Expense" table.
2009 2008 2007
State income taxes (c) $ 5 $ 2 $ (4)Other (c) (1) 4 3
$ 4 $ 6 $ (1)
(c) During 2009, PPL Electric received consent from the IRS to change its method of accounting for certain expenditures for tax purposes. PPL Electric deducted the resulting IRC Sec. 481 amount on its 2008 federal income tax return and recorded a $3 million adjustment to federal and state income tax expense resulting from the reversal of prior years' state income tax benefits related to regulated depreciation. The $3 million income tax expense consisted of $5 million expense reflected in "State income taxes" offset by a $2 million federal benefit reflected in "Other".
2009 2008 2007 Taxes, other than income
State gross receipts $ 187 $ 199 $ 193State utility realty 5 4 5State capital stock 2 2 3Property and other (2) (1)
$ 194 $ 203 $ 200
See Note 1 for information on a settlement related to PURTA tax that will be returned to PPL Electric customers.
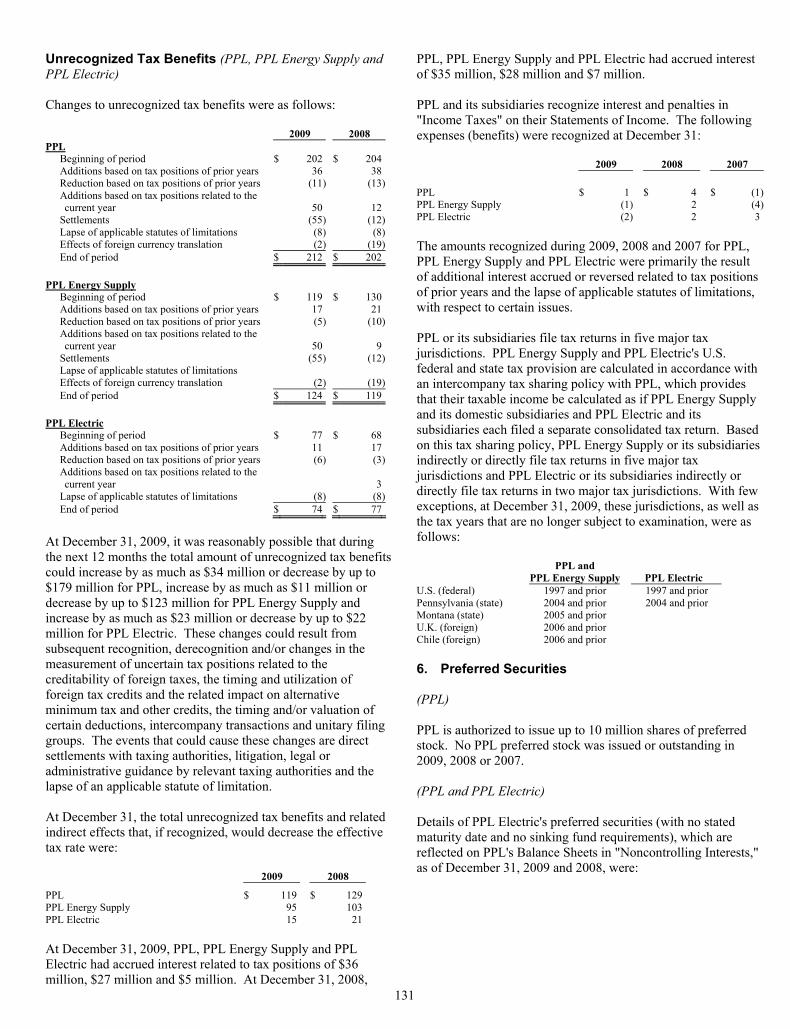
131
Unrecognized Tax Benefits (PPL, PPL Energy Supply and PPL Electric) Changes to unrecognized tax benefits were as follows: 2009 2008 PPL
Beginning of period $ 202 $ 204Additions based on tax positions of prior years 36 38Reduction based on tax positions of prior years (11) (13)Additions based on tax positions related to the current year 50 12
Settlements (55) (12)Lapse of applicable statutes of limitations (8) (8)Effects of foreign currency translation (2) (19)End of period $ 212 $ 202
PPL Energy Supply Beginning of period $ 119 $ 130Additions based on tax positions of prior years 17 21Reduction based on tax positions of prior years (5) (10)Additions based on tax positions related to the current year 50 9
Settlements (55) (12)Lapse of applicable statutes of limitations Effects of foreign currency translation (2) (19)End of period $ 124 $ 119
PPL Electric
Beginning of period $ 77 $ 68Additions based on tax positions of prior years 11 17Reduction based on tax positions of prior years (6) (3)Additions based on tax positions related to the current year 3
Lapse of applicable statutes of limitations (8) (8)End of period $ 74 $ 77
At December 31, 2009, it was reasonably possible that during the next 12 months the total amount of unrecognized tax benefits could increase by as much as $34 million or decrease by up to $179 million for PPL, increase by as much as $11 million or decrease by up to $123 million for PPL Energy Supply and increase by as much as $23 million or decrease by up to $22 million for PPL Electric. These changes could result from subsequent recognition, derecognition and/or changes in the measurement of uncertain tax positions related to the creditability of foreign taxes, the timing and utilization of foreign tax credits and the related impact on alternative minimum tax and other credits, the timing and/or valuation of certain deductions, intercompany transactions and unitary filing groups. The events that could cause these changes are direct settlements with taxing authorities, litigation, legal or administrative guidance by relevant taxing authorities and the lapse of an applicable statute of limitation. At December 31, the total unrecognized tax benefits and related indirect effects that, if recognized, would decrease the effective tax rate were:
2009 2008
PPL $ 119 $ 129PPL Energy Supply 95 103PPL Electric 15 21 At December 31, 2009, PPL, PPL Energy Supply and PPL Electric had accrued interest related to tax positions of $36 million, $27 million and $5 million. At December 31, 2008,
PPL, PPL Energy Supply and PPL Electric had accrued interest of $35 million, $28 million and $7 million. PPL and its subsidiaries recognize interest and penalties in "Income Taxes" on their Statements of Income. The following expenses (benefits) were recognized at December 31: 2009 2008 2007 PPL $ 1 $ 4 $ (1)PPL Energy Supply (1) 2 (4)PPL Electric (2) 2 3 The amounts recognized during 2009, 2008 and 2007 for PPL, PPL Energy Supply and PPL Electric were primarily the result of additional interest accrued or reversed related to tax positions of prior years and the lapse of applicable statutes of limitations, with respect to certain issues. PPL or its subsidiaries file tax returns in five major tax jurisdictions. PPL Energy Supply and PPL Electric's U.S. federal and state tax provision are calculated in accordance with an intercompany tax sharing policy with PPL, which provides that their taxable income be calculated as if PPL Energy Supply and its domestic subsidiaries and PPL Electric and its subsidiaries each filed a separate consolidated tax return. Based on this tax sharing policy, PPL Energy Supply or its subsidiaries indirectly or directly file tax returns in five major tax jurisdictions and PPL Electric or its subsidiaries indirectly or directly file tax returns in two major tax jurisdictions. With few exceptions, at December 31, 2009, these jurisdictions, as well as the tax years that are no longer subject to examination, were as follows:
PPL and
PPL Energy Supply PPL Electric U.S. (federal) 1997 and prior 1997 and prior Pennsylvania (state) 2004 and prior 2004 and prior Montana (state) 2005 and prior U.K. (foreign) 2006 and prior Chile (foreign) 2006 and prior 6. Preferred Securities (PPL) PPL is authorized to issue up to 10 million shares of preferred stock. No PPL preferred stock was issued or outstanding in 2009, 2008 or 2007. (PPL and PPL Electric) Details of PPL Electric's preferred securities (with no stated maturity date and no sinking fund requirements), which are reflected on PPL's Balance Sheets in "Noncontrolling Interests," as of December 31, 2009 and 2008, were:
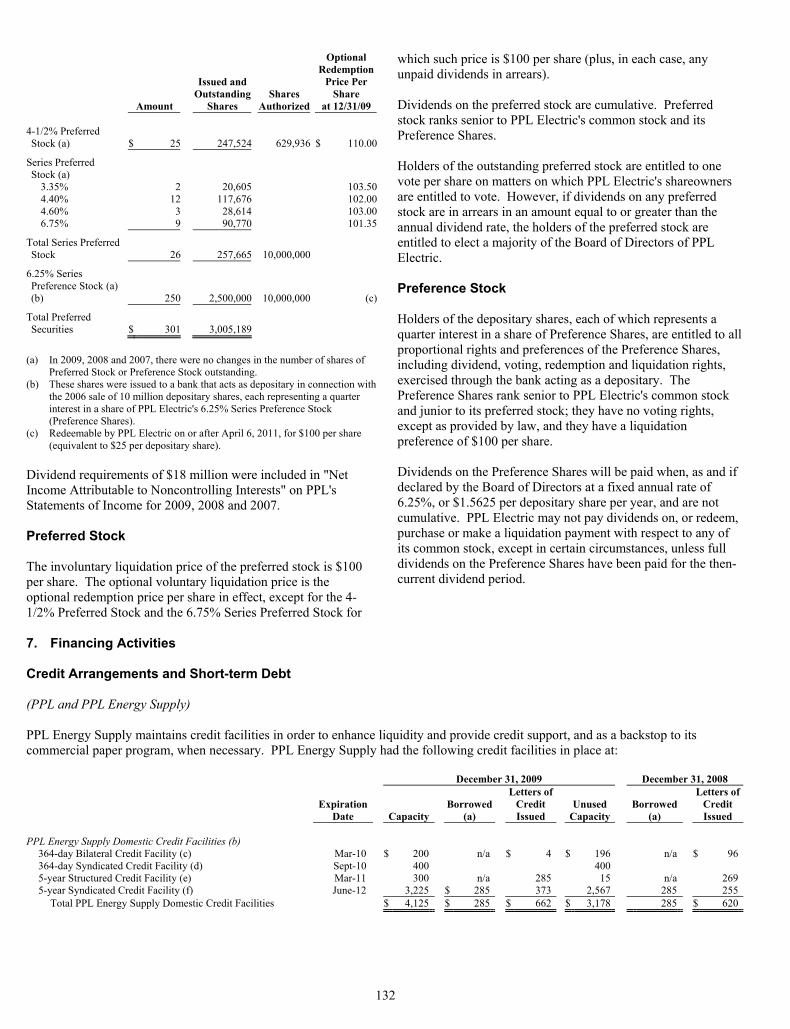
132
Amount
Issued and Outstanding
Shares Shares
Authorized
Optional Redemption
Price Per Share
at 12/31/09 4-1/2% Preferred Stock (a) $ 25 247,524 629,936 $ 110.00
Series Preferred Stock (a)
3.35% 2 20,605 103.504.40% 12 117,676 102.004.60% 3 28,614 103.006.75% 9 90,770 101.35
Total Series Preferred Stock 26 257,665 10,000,000
6.25% Series Preference Stock (a) (b) 250 2,500,000 10,000,000 (c)
Total Preferred Securities $ 301 3,005,189
(a) In 2009, 2008 and 2007, there were no changes in the number of shares of
Preferred Stock or Preference Stock outstanding. (b) These shares were issued to a bank that acts as depositary in connection with
the 2006 sale of 10 million depositary shares, each representing a quarter interest in a share of PPL Electric's 6.25% Series Preference Stock (Preference Shares).
(c) Redeemable by PPL Electric on or after April 6, 2011, for $100 per share (equivalent to $25 per depositary share).
Dividend requirements of $18 million were included in "Net Income Attributable to Noncontrolling Interests" on PPL's Statements of Income for 2009, 2008 and 2007. Preferred Stock The involuntary liquidation price of the preferred stock is $100 per share. The optional voluntary liquidation price is the optional redemption price per share in effect, except for the 4-1/2% Preferred Stock and the 6.75% Series Preferred Stock for
which such price is $100 per share (plus, in each case, any unpaid dividends in arrears). Dividends on the preferred stock are cumulative. Preferred stock ranks senior to PPL Electric's common stock and its Preference Shares. Holders of the outstanding preferred stock are entitled to one vote per share on matters on which PPL Electric's shareowners are entitled to vote. However, if dividends on any preferred stock are in arrears in an amount equal to or greater than the annual dividend rate, the holders of the preferred stock are entitled to elect a majority of the Board of Directors of PPL Electric. Preference Stock Holders of the depositary shares, each of which represents a quarter interest in a share of Preference Shares, are entitled to all proportional rights and preferences of the Preference Shares, including dividend, voting, redemption and liquidation rights, exercised through the bank acting as a depositary. The Preference Shares rank senior to PPL Electric's common stock and junior to its preferred stock; they have no voting rights, except as provided by law, and they have a liquidation preference of $100 per share. Dividends on the Preference Shares will be paid when, as and if declared by the Board of Directors at a fixed annual rate of 6.25%, or $1.5625 per depositary share per year, and are not cumulative. PPL Electric may not pay dividends on, or redeem, purchase or make a liquidation payment with respect to any of its common stock, except in certain circumstances, unless full dividends on the Preference Shares have been paid for the then-current dividend period.
7. Financing Activities Credit Arrangements and Short-term Debt (PPL and PPL Energy Supply) PPL Energy Supply maintains credit facilities in order to enhance liquidity and provide credit support, and as a backstop to its commercial paper program, when necessary. PPL Energy Supply had the following credit facilities in place at: December 31, 2009 December 31, 2008
Expiration
Date Capacity Borrowed
(a)
Letters of Credit Issued
Unused Capacity
Borrowed (a)
Letters of Credit Issued
PPL Energy Supply Domestic Credit Facilities (b)
364-day Bilateral Credit Facility (c) Mar-10 $ 200 n/a $ 4 $ 196 n/a $ 96364-day Syndicated Credit Facility (d) Sept-10 400 400 5-year Structured Credit Facility (e) Mar-11 300 n/a 285 15 n/a 2695-year Syndicated Credit Facility (f) June-12 3,225 $ 285 373 2,567 285 255
Total PPL Energy Supply Domestic Credit Facilities $ 4,125 $ 285 $ 662 $ 3,178 285 $ 620
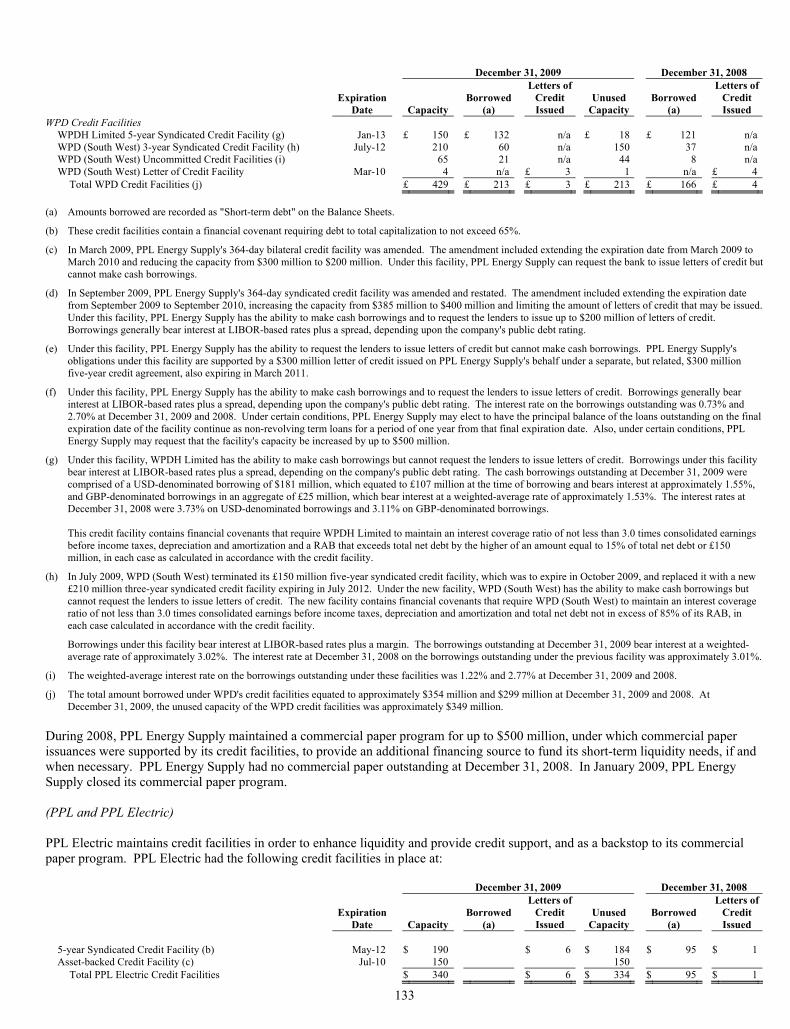
133
December 31, 2009 December 31, 2008
Expiration
Date Capacity Borrowed
(a)
Letters of Credit Issued
Unused Capacity
Borrowed (a)
Letters of Credit Issued
WPD Credit Facilities WPDH Limited 5-year Syndicated Credit Facility (g) Jan-13 £ 150 £ 132 n/a £ 18 £ 121 n/aWPD (South West) 3-year Syndicated Credit Facility (h) July-12 210 60 n/a 150 37 n/aWPD (South West) Uncommitted Credit Facilities (i) 65 21 n/a 44 8 n/aWPD (South West) Letter of Credit Facility Mar-10 4 n/a £ 3 1 n/a £ 4
Total WPD Credit Facilities (j) £ 429 £ 213 £ 3 £ 213 £ 166 £ 4 (a) Amounts borrowed are recorded as "Short-term debt" on the Balance Sheets.
(b) These credit facilities contain a financial covenant requiring debt to total capitalization to not exceed 65%.
(c) In March 2009, PPL Energy Supply's 364-day bilateral credit facility was amended. The amendment included extending the expiration date from March 2009 to March 2010 and reducing the capacity from $300 million to $200 million. Under this facility, PPL Energy Supply can request the bank to issue letters of credit but cannot make cash borrowings.
(d) In September 2009, PPL Energy Supply's 364-day syndicated credit facility was amended and restated. The amendment included extending the expiration date from September 2009 to September 2010, increasing the capacity from $385 million to $400 million and limiting the amount of letters of credit that may be issued. Under this facility, PPL Energy Supply has the ability to make cash borrowings and to request the lenders to issue up to $200 million of letters of credit. Borrowings generally bear interest at LIBOR-based rates plus a spread, depending upon the company's public debt rating.
(e) Under this facility, PPL Energy Supply has the ability to request the lenders to issue letters of credit but cannot make cash borrowings. PPL Energy Supply's obligations under this facility are supported by a $300 million letter of credit issued on PPL Energy Supply's behalf under a separate, but related, $300 million five-year credit agreement, also expiring in March 2011.
(f) Under this facility, PPL Energy Supply has the ability to make cash borrowings and to request the lenders to issue letters of credit. Borrowings generally bear interest at LIBOR-based rates plus a spread, depending upon the company's public debt rating. The interest rate on the borrowings outstanding was 0.73% and 2.70% at December 31, 2009 and 2008. Under certain conditions, PPL Energy Supply may elect to have the principal balance of the loans outstanding on the final expiration date of the facility continue as non-revolving term loans for a period of one year from that final expiration date. Also, under certain conditions, PPL Energy Supply may request that the facility's capacity be increased by up to $500 million.
(g) Under this facility, WPDH Limited has the ability to make cash borrowings but cannot request the lenders to issue letters of credit. Borrowings under this facility bear interest at LIBOR-based rates plus a spread, depending on the company's public debt rating. The cash borrowings outstanding at December 31, 2009 were comprised of a USD-denominated borrowing of $181 million, which equated to £107 million at the time of borrowing and bears interest at approximately 1.55%, and GBP-denominated borrowings in an aggregate of £25 million, which bear interest at a weighted-average rate of approximately 1.53%. The interest rates at December 31, 2008 were 3.73% on USD-denominated borrowings and 3.11% on GBP-denominated borrowings. This credit facility contains financial covenants that require WPDH Limited to maintain an interest coverage ratio of not less than 3.0 times consolidated earnings before income taxes, depreciation and amortization and a RAB that exceeds total net debt by the higher of an amount equal to 15% of total net debt or £150 million, in each case as calculated in accordance with the credit facility.
(h) In July 2009, WPD (South West) terminated its £150 million five-year syndicated credit facility, which was to expire in October 2009, and replaced it with a new £210 million three-year syndicated credit facility expiring in July 2012. Under the new facility, WPD (South West) has the ability to make cash borrowings but cannot request the lenders to issue letters of credit. The new facility contains financial covenants that require WPD (South West) to maintain an interest coverage ratio of not less than 3.0 times consolidated earnings before income taxes, depreciation and amortization and total net debt not in excess of 85% of its RAB, in each case calculated in accordance with the credit facility.
Borrowings under this facility bear interest at LIBOR-based rates plus a margin. The borrowings outstanding at December 31, 2009 bear interest at a weighted-average rate of approximately 3.02%. The interest rate at December 31, 2008 on the borrowings outstanding under the previous facility was approximately 3.01%.
(i) The weighted-average interest rate on the borrowings outstanding under these facilities was 1.22% and 2.77% at December 31, 2009 and 2008.
(j) The total amount borrowed under WPD's credit facilities equated to approximately $354 million and $299 million at December 31, 2009 and 2008. At December 31, 2009, the unused capacity of the WPD credit facilities was approximately $349 million.
During 2008, PPL Energy Supply maintained a commercial paper program for up to $500 million, under which commercial paper issuances were supported by its credit facilities, to provide an additional financing source to fund its short-term liquidity needs, if and when necessary. PPL Energy Supply had no commercial paper outstanding at December 31, 2008. In January 2009, PPL Energy Supply closed its commercial paper program. (PPL and PPL Electric) PPL Electric maintains credit facilities in order to enhance liquidity and provide credit support, and as a backstop to its commercial paper program. PPL Electric had the following credit facilities in place at: December 31, 2009 December 31, 2008
Expiration
Date Capacity Borrowed
(a)
Letters of Credit Issued
Unused Capacity
Borrowed (a)
Letters of Credit Issued
5-year Syndicated Credit Facility (b) May-12 $ 190 $ 6 $ 184 $ 95 $ 1Asset-backed Credit Facility (c) Jul-10 150 150
Total PPL Electric Credit Facilities $ 340 $ 6 $ 334 $ 95 $ 1
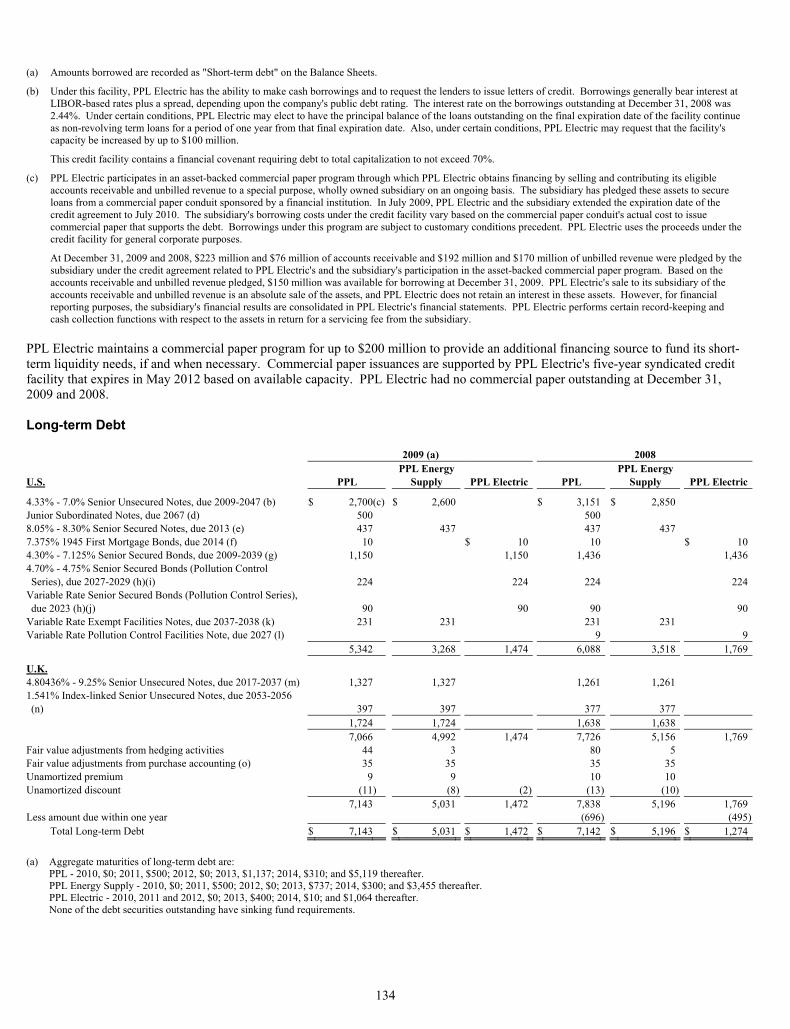
134
(a) Amounts borrowed are recorded as "Short-term debt" on the Balance Sheets.
(b) Under this facility, PPL Electric has the ability to make cash borrowings and to request the lenders to issue letters of credit. Borrowings generally bear interest at LIBOR-based rates plus a spread, depending upon the company's public debt rating. The interest rate on the borrowings outstanding at December 31, 2008 was 2.44%. Under certain conditions, PPL Electric may elect to have the principal balance of the loans outstanding on the final expiration date of the facility continue as non-revolving term loans for a period of one year from that final expiration date. Also, under certain conditions, PPL Electric may request that the facility's capacity be increased by up to $100 million.
This credit facility contains a financial covenant requiring debt to total capitalization to not exceed 70%.
(c) PPL Electric participates in an asset-backed commercial paper program through which PPL Electric obtains financing by selling and contributing its eligible accounts receivable and unbilled revenue to a special purpose, wholly owned subsidiary on an ongoing basis. The subsidiary has pledged these assets to secure loans from a commercial paper conduit sponsored by a financial institution. In July 2009, PPL Electric and the subsidiary extended the expiration date of the credit agreement to July 2010. The subsidiary's borrowing costs under the credit facility vary based on the commercial paper conduit's actual cost to issue commercial paper that supports the debt. Borrowings under this program are subject to customary conditions precedent. PPL Electric uses the proceeds under the credit facility for general corporate purposes.
At December 31, 2009 and 2008, $223 million and $76 million of accounts receivable and $192 million and $170 million of unbilled revenue were pledged by the subsidiary under the credit agreement related to PPL Electric's and the subsidiary's participation in the asset-backed commercial paper program. Based on the accounts receivable and unbilled revenue pledged, $150 million was available for borrowing at December 31, 2009. PPL Electric's sale to its subsidiary of the accounts receivable and unbilled revenue is an absolute sale of the assets, and PPL Electric does not retain an interest in these assets. However, for financial reporting purposes, the subsidiary's financial results are consolidated in PPL Electric's financial statements. PPL Electric performs certain record-keeping and cash collection functions with respect to the assets in return for a servicing fee from the subsidiary.
PPL Electric maintains a commercial paper program for up to $200 million to provide an additional financing source to fund its short-term liquidity needs, if and when necessary. Commercial paper issuances are supported by PPL Electric's five-year syndicated credit facility that expires in May 2012 based on available capacity. PPL Electric had no commercial paper outstanding at December 31, 2009 and 2008. Long-term Debt 2009 (a) 2008
U.S. PPL PPL Energy
Supply PPL Electric PPL PPL Energy
Supply PPL Electric
4.33% - 7.0% Senior Unsecured Notes, due 2009-2047 (b) $ 2,700(c) $ 2,600 $ 3,151 $ 2,850 Junior Subordinated Notes, due 2067 (d) 500 500 8.05% - 8.30% Senior Secured Notes, due 2013 (e) 437 437 437 437 7.375% 1945 First Mortgage Bonds, due 2014 (f) 10 $ 10 10 $ 104.30% - 7.125% Senior Secured Bonds, due 2009-2039 (g) 1,150 1,150 1,436 1,4364.70% - 4.75% Senior Secured Bonds (Pollution Control Series), due 2027-2029 (h)(i) 224 224 224 224
Variable Rate Senior Secured Bonds (Pollution Control Series), due 2023 (h)(j) 90 90 90 90
Variable Rate Exempt Facilities Notes, due 2037-2038 (k) 231 231 231 231 Variable Rate Pollution Control Facilities Note, due 2027 (l) 9 9 5,342 3,268 1,474 6,088 3,518 1,769
U.K. 4.80436% - 9.25% Senior Unsecured Notes, due 2017-2037 (m) 1,327 1,327 1,261 1,261 1.541% Index-linked Senior Unsecured Notes, due 2053-2056 (n) 397 397 377 377
1,724 1,724 1,638 1,638 7,066 4,992 1,474 7,726 5,156 1,769Fair value adjustments from hedging activities 44 3 80 5 Fair value adjustments from purchase accounting (o) 35 35 35 35 Unamortized premium 9 9 10 10 Unamortized discount (11) (8) (2) (13 ) (10) 7,143 5,031 1,472 7,838 5,196 1,769Less amount due within one year (696 ) (495)
Total Long-term Debt $ 7,143 $ 5,031 $ 1,472 $ 7,142 $ 5,196 $ 1,274
(a) Aggregate maturities of long-term debt are:
PPL - 2010, $0; 2011, $500; 2012, $0; 2013, $1,137; 2014, $310; and $5,119 thereafter. PPL Energy Supply - 2010, $0; 2011, $500; 2012, $0; 2013, $737; 2014, $300; and $3,455 thereafter. PPL Electric - 2010, 2011 and 2012, $0; 2013, $400; 2014, $10; and $1,064 thereafter. None of the debt securities outstanding have sinking fund requirements.

135
(b) Includes $300 million of 5.70% REset Put Securities due 2035 (REPSSM). The REPS bear interest at a rate of 5.70% per annum to, but excluding, October 15, 2015 (Remarketing Date). The REPS are required to be put by existing holders on the Remarketing Date either for (a) purchase and remarketing by a designated remarketing dealer or (b) repurchase by PPL Energy Supply. If the remarketing dealer elects to purchase the REPS for remarketing, it will purchase the REPS at 100% of the principal amount, and the REPS will bear interest on and after the Remarketing Date at a new fixed rate per annum determined in the remarketing. PPL Energy Supply has the right to terminate the remarketing process. If the remarketing is terminated at the option of PPL Energy Supply or under certain other circumstances, including the occurrence of an event of default by PPL Energy Supply under the related indenture or a failed remarketing for certain specified reasons, PPL Energy Supply will be required to pay the remarketing dealer a settlement amount as calculated in accordance with the related remarketing agreement.
Also includes $250 million of notes that may be redeemed at par beginning in July 2011.
In March 2009, PPL Energy Supply completed tender offers to purchase up to $250 million aggregate principal amount of certain of its outstanding senior notes in order to reduce future interest expense. Pursuant to the offers, PPL Energy Supply purchased approximately $100 million aggregate principal amount of its 6.00% Senior Notes due 2036 for $77 million, plus accrued interest, and approximately $150 million aggregate principal amount of its 6.20% Senior Notes due 2016 for $143 million, plus accrued interest. In connection with the extinguishment of these notes, PPL and PPL Energy Supply recorded a net gain of $25 million, which is reflected in "Other Income - net" on the Statement of Income for 2009. PPL recorded an additional net gain of $4 million in "Other Income - net" on the Statement of Income as a result of reclassifying gains and losses on related cash flow hedges from AOCI into earnings.
(c) Includes $100 million of notes that may be redeemed at par beginning in July 2012. In March 2009, PPL Capital Funding retired the entire $201 million of its 4.33% Notes Exchange Series A upon maturity.
(d) The notes bear interest at 6.70% into March 2017, at which time the notes will bear interest at three-month LIBOR plus 2.665%, reset quarterly, until maturity. Interest payments may be deferred, from time to time, on one or more occasions for up to ten consecutive years. The notes may be redeemed at par beginning in March 2017. In connection with the issuance of the notes, PPL and PPL Capital Funding entered into a Replacement Capital Covenant, in which PPL and PPL Capital Funding agreed for the benefit of holders of a designated series of unsecured long-term indebtedness of PPL or PPL Capital Funding ranking senior to the notes that (i) PPL Capital Funding will not redeem or purchase the notes, or otherwise satisfy, discharge or defease the principal amount of the notes and (ii) neither PPL nor any of its other subsidiaries will purchase the notes before the end of March 2037, except, subject to certain limitations, to the extent that the applicable redemption or repurchase price or principal amount defeased does not exceed a specified amount of proceeds from the sale of qualifying replacement capital securities during the 180-day period prior to the date of that redemption, repurchase or defeasance. The designated series of covered debt benefiting from the Replacement Capital Covenant at December 31, 2009 and 2008 was PPL Capital Funding's 6.85% Senior Notes due 2047.
(e) Represents lease financing consolidated through a variable interest entity. See Note 3 for additional information.
(f) The 1945 First Mortgage Bonds were issued under, and secured by, the lien of the 1945 First Mortgage Bond Indenture. In December 2008, PPL Electric completed an in-substance defeasance of the First Mortgage Bonds by depositing sufficient funds with the trustee solely to satisfy the principal and remaining interest obligations on the bonds when due. The amount of funds on deposit with the trustee was $14 million at December 31, 2009 and $15 million at December 31, 2008, and is recorded as restricted cash, primarily in other noncurrent assets on the Balance Sheets. Also in December 2008, PPL Electric discharged the lien under the 1945 First Mortgage Bond Indenture, which covered substantially all electric distribution plant and certain transmission plant owned by PPL Electric.
(g) The senior secured bonds are secured by the lien of the 2001 Senior Secured Bond Indenture, which covers substantially all electric distribution plant and certain transmission plant owned by PPL Electric.
In May 2009, PPL Electric issued $300 million of 6.25% First Mortgage Bonds due 2039 (6.25% Bonds). The 6.25% Bonds may be redeemed any time prior to maturity at PPL Electric's option at make-whole redemption prices. PPL Electric received proceeds of $296 million, net of a discount and underwriting fees, from the issuance of the 6.25% Bonds. Approximately $86 million of the proceeds were used in August 2009 to partially fund the repayment at maturity of $486 million aggregate principal amount of PPL Electric's Senior Secured Bonds, 6-1/4% Series. The balance of such repayment was funded from the issuance in October 2008 of $400 million of 7.125% Senior Secured Bonds due 2013. The balance of the proceeds from the issuance of the 6.25% Bonds was used for general corporate purposes, including capital expenditures.
In December 2009, PPL Electric Utilities redeemed the entire $100 million aggregate principal amount of its 4.30% Senior Secured Bonds due 2013. PPL Electric paid a premium of $9 million in connection with the redemption. The total loss on the redemption of approximately $10 million pre-tax, which includes unamortized fees and discounts, is reflected in "Regulatory assets" and "Other regulatory and noncurrent assets" on the Balance Sheets of PPL and PPL Electric at December 31, 2009 as an unamortized loss on reacquired debt and will be amortized through the original maturity of the debt. Additionally, PPL recorded a net gain of approximately $4 million pre-tax in "Other Income - net" on the Statement of Income as a result of reclassifying gains and losses on related cash flow and fair value hedges from AOCI and Long-term Debt into earnings.
(h) PPL Electric issued a series of its senior secured bonds to secure its obligations to make payments with respect to each series of Pollution Control Bonds that were issued by the LCIDA and the PEDFA on behalf of PPL Electric. These senior secured bonds were issued in the same principal amount, contain payment and redemption provisions that correspond to and bear the same interest rate as such Pollution Control Bonds. These senior secured bonds were issued under the 2001 Senior Secured Bond Indenture and are secured as noted in (g) above.
(i) The senior secured bonds may be redeemed at par beginning in 2015.
(j) The related Pollution Control Bonds are structured as variable-rate remarketable bonds. PPL Electric may convert the interest rate on the bonds from time to time to a commercial paper rate, daily rate, weekly rate or a term rate of at least one year. The bonds are subject to mandatory purchase under certain circumstances, including upon conversion to a different interest rate mode. To the extent that a purchase is required prior to the maturity date, PPL Electric has the ability and intent to refinance the bonds on a long-term basis. At December 31, 2009 and 2008, the bonds were in a term rate mode and bear interest at 4.85% until October 2010, at which time the bonds will be remarketed based upon the interest rate mode elected by PPL Electric.
(k) The PEDFA issued Exempt Facilities Revenue Bonds on behalf of PPL Energy Supply in December 2007 (Series 2007 Bonds) and December 2008 (Series 2008 Bonds). In connection with the issuances of such bonds, PPL Energy Supply entered into loan agreements with the PEDFA pursuant to which the PEDFA loaned to PPL Energy Supply the proceeds of the bonds on payment terms that correspond to those of the bonds. PPL Investment Corp. acted as initial purchaser of the Series 2008 Bonds upon issuance. At December 31, 2008, the Series 2007 Bonds and the Series 2008 Bonds bore interest at 3.20% and 5.50%.
In April 2009, the PEDFA issued $231 million aggregate principal amount of Exempt Facilities Revenue Refunding Bonds, Series 2009A and 2009B due 2038 and Series 2009C due 2037 (PPL Energy Supply, LLC Project), on behalf of PPL Energy Supply. The Series 2009A bonds, in an aggregate principal amount of $100 million, and the Series 2009B bonds, in an aggregate principal amount of $50 million, were issued by the PEDFA in order to refund $150 million aggregate principal amount of Exempt Facilities Revenue Bonds, Series 2008A and 2008B (PPL Energy Supply, LLC Project) due 2038 that were issued by the PEDFA in December 2008 on behalf of PPL Energy Supply, and for which PPL Investment Corp. acted as initial purchaser. The Series 2009C bonds, in an aggregate principal amount of $81 million, were issued in order to refund $81 million aggregate principal amount of Exempt Facilities Revenue Bonds, Series 2007 (PPL Energy Supply, LLC Project) due 2037 that were issued by the PEDFA in December 2007 on behalf of PPL Energy Supply. Among other things, the completed refundings were able to
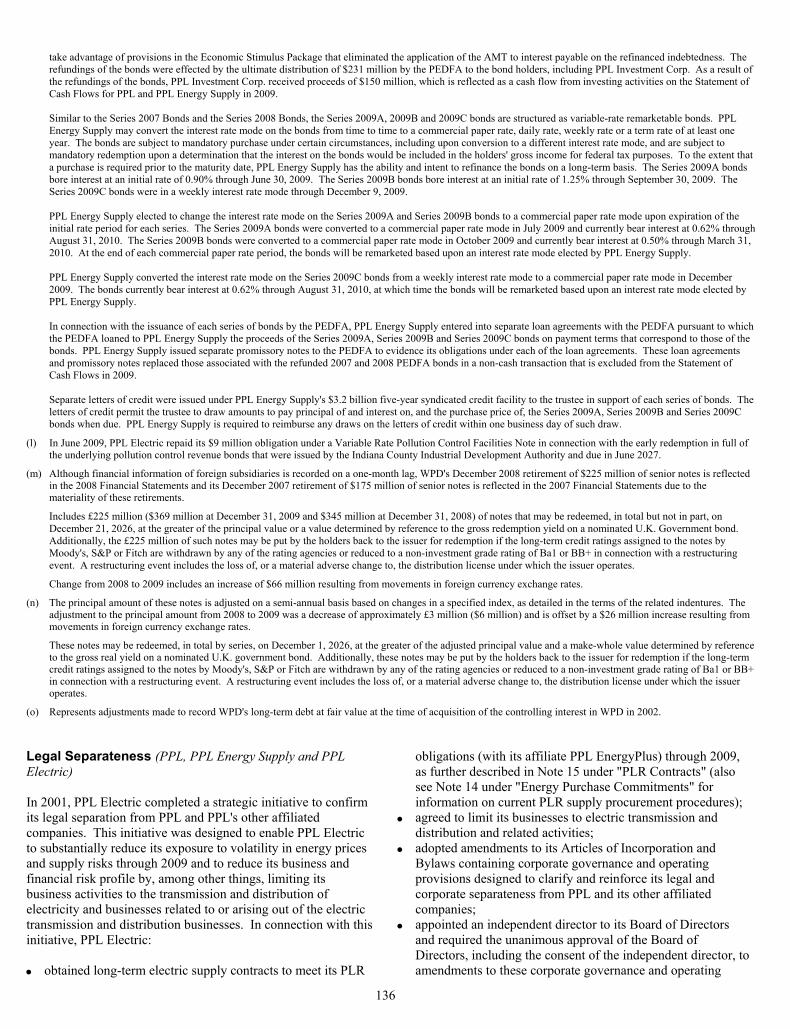
136
take advantage of provisions in the Economic Stimulus Package that eliminated the application of the AMT to interest payable on the refinanced indebtedness. The refundings of the bonds were effected by the ultimate distribution of $231 million by the PEDFA to the bond holders, including PPL Investment Corp. As a result of the refundings of the bonds, PPL Investment Corp. received proceeds of $150 million, which is reflected as a cash flow from investing activities on the Statement of Cash Flows for PPL and PPL Energy Supply in 2009. Similar to the Series 2007 Bonds and the Series 2008 Bonds, the Series 2009A, 2009B and 2009C bonds are structured as variable-rate remarketable bonds. PPL Energy Supply may convert the interest rate mode on the bonds from time to time to a commercial paper rate, daily rate, weekly rate or a term rate of at least one year. The bonds are subject to mandatory purchase under certain circumstances, including upon conversion to a different interest rate mode, and are subject to mandatory redemption upon a determination that the interest on the bonds would be included in the holders' gross income for federal tax purposes. To the extent that a purchase is required prior to the maturity date, PPL Energy Supply has the ability and intent to refinance the bonds on a long-term basis. The Series 2009A bonds bore interest at an initial rate of 0.90% through June 30, 2009. The Series 2009B bonds bore interest at an initial rate of 1.25% through September 30, 2009. The Series 2009C bonds were in a weekly interest rate mode through December 9, 2009. PPL Energy Supply elected to change the interest rate mode on the Series 2009A and Series 2009B bonds to a commercial paper rate mode upon expiration of the initial rate period for each series. The Series 2009A bonds were converted to a commercial paper rate mode in July 2009 and currently bear interest at 0.62% through August 31, 2010. The Series 2009B bonds were converted to a commercial paper rate mode in October 2009 and currently bear interest at 0.50% through March 31, 2010. At the end of each commercial paper rate period, the bonds will be remarketed based upon an interest rate mode elected by PPL Energy Supply. PPL Energy Supply converted the interest rate mode on the Series 2009C bonds from a weekly interest rate mode to a commercial paper rate mode in December 2009. The bonds currently bear interest at 0.62% through August 31, 2010, at which time the bonds will be remarketed based upon an interest rate mode elected by PPL Energy Supply. In connection with the issuance of each series of bonds by the PEDFA, PPL Energy Supply entered into separate loan agreements with the PEDFA pursuant to which the PEDFA loaned to PPL Energy Supply the proceeds of the Series 2009A, Series 2009B and Series 2009C bonds on payment terms that correspond to those of the bonds. PPL Energy Supply issued separate promissory notes to the PEDFA to evidence its obligations under each of the loan agreements. These loan agreements and promissory notes replaced those associated with the refunded 2007 and 2008 PEDFA bonds in a non-cash transaction that is excluded from the Statement of Cash Flows in 2009. Separate letters of credit were issued under PPL Energy Supply's $3.2 billion five-year syndicated credit facility to the trustee in support of each series of bonds. The letters of credit permit the trustee to draw amounts to pay principal of and interest on, and the purchase price of, the Series 2009A, Series 2009B and Series 2009C bonds when due. PPL Energy Supply is required to reimburse any draws on the letters of credit within one business day of such draw.
(l) In June 2009, PPL Electric repaid its $9 million obligation under a Variable Rate Pollution Control Facilities Note in connection with the early redemption in full of the underlying pollution control revenue bonds that were issued by the Indiana County Industrial Development Authority and due in June 2027.
(m) Although financial information of foreign subsidiaries is recorded on a one-month lag, WPD's December 2008 retirement of $225 million of senior notes is reflected in the 2008 Financial Statements and its December 2007 retirement of $175 million of senior notes is reflected in the 2007 Financial Statements due to the materiality of these retirements.
Includes £225 million ($369 million at December 31, 2009 and $345 million at December 31, 2008) of notes that may be redeemed, in total but not in part, on December 21, 2026, at the greater of the principal value or a value determined by reference to the gross redemption yield on a nominated U.K. Government bond. Additionally, the £225 million of such notes may be put by the holders back to the issuer for redemption if the long-term credit ratings assigned to the notes by Moody's, S&P or Fitch are withdrawn by any of the rating agencies or reduced to a non-investment grade rating of Ba1 or BB+ in connection with a restructuring event. A restructuring event includes the loss of, or a material adverse change to, the distribution license under which the issuer operates.
Change from 2008 to 2009 includes an increase of $66 million resulting from movements in foreign currency exchange rates.
(n) The principal amount of these notes is adjusted on a semi-annual basis based on changes in a specified index, as detailed in the terms of the related indentures. The adjustment to the principal amount from 2008 to 2009 was a decrease of approximately £3 million ($6 million) and is offset by a $26 million increase resulting from movements in foreign currency exchange rates.
These notes may be redeemed, in total by series, on December 1, 2026, at the greater of the adjusted principal value and a make-whole value determined by reference to the gross real yield on a nominated U.K. government bond. Additionally, these notes may be put by the holders back to the issuer for redemption if the long-term credit ratings assigned to the notes by Moody's, S&P or Fitch are withdrawn by any of the rating agencies or reduced to a non-investment grade rating of Ba1 or BB+ in connection with a restructuring event. A restructuring event includes the loss of, or a material adverse change to, the distribution license under which the issuer operates.
(o) Represents adjustments made to record WPD's long-term debt at fair value at the time of acquisition of the controlling interest in WPD in 2002. Legal Separateness (PPL, PPL Energy Supply and PPL Electric) In 2001, PPL Electric completed a strategic initiative to confirm its legal separation from PPL and PPL's other affiliated companies. This initiative was designed to enable PPL Electric to substantially reduce its exposure to volatility in energy prices and supply risks through 2009 and to reduce its business and financial risk profile by, among other things, limiting its business activities to the transmission and distribution of electricity and businesses related to or arising out of the electric transmission and distribution businesses. In connection with this initiative, PPL Electric: • obtained long-term electric supply contracts to meet its PLR
obligations (with its affiliate PPL EnergyPlus) through 2009, as further described in Note 15 under "PLR Contracts" (also see Note 14 under "Energy Purchase Commitments" for information on current PLR supply procurement procedures);
• agreed to limit its businesses to electric transmission and distribution and related activities;
• adopted amendments to its Articles of Incorporation and Bylaws containing corporate governance and operating provisions designed to clarify and reinforce its legal and corporate separateness from PPL and its other affiliated companies;
• appointed an independent director to its Board of Directors and required the unanimous approval of the Board of Directors, including the consent of the independent director, to amendments to these corporate governance and operating
137
provisions or to the commencement of any insolvency proceedings, including any filing of a voluntary petition in bankruptcy or other similar actions.
In addition, in connection with the issuance of certain series of bonds, PPL Electric entered into a compliance administration agreement with an independent compliance administrator to review, on a semi-annual basis, its compliance with the corporate governance and operating requirements contained in its Articles of Incorporation and Bylaws. Such series of bonds are no longer outstanding and the compliance administration agreement has terminated, but PPL Electric continues to comply with the corporate separateness provisions in its Articles of Incorporation and Bylaws. The enhancements to PPL Electric's legal separation from its affiliates are intended to minimize the risk that a court would order PPL Electric's assets and liabilities to be substantively consolidated with those of PPL or another affiliate of PPL in the event that PPL or another PPL affiliate were to become a debtor in a bankruptcy case. Based on these various measures, PPL Electric was able to issue and maintain a higher level of debt and use it to replace higher cost equity, thereby maintaining a lower total cost of capital. Nevertheless, if PPL or another PPL affiliate were to become a debtor in a bankruptcy case, there can be no assurance that a court would not order PPL Electric's assets and liabilities to be consolidated with those of PPL or such other PPL affiliate. The subsidiaries of PPL are separate legal entities. PPL's subsidiaries are not liable for the debts of PPL. Accordingly, creditors of PPL may not satisfy their debts from the assets of the subsidiaries absent a specific contractual undertaking by a subsidiary to pay PPL's creditors or as required by applicable law or regulation. Similarly, absent a specific contractual undertaking or as required by applicable law or regulation, PPL is not liable for the debts of its subsidiaries. Accordingly, creditors of PPL's subsidiaries may not satisfy their debts from the assets of PPL absent a specific contractual undertaking by PPL to pay the creditors of its subsidiaries or as required by applicable law or regulation. Similarly, the subsidiaries of PPL Energy Supply and PPL Electric are separate legal entities. These subsidiaries are not liable for the debts of PPL Energy Supply and PPL Electric. Accordingly, creditors of PPL Energy Supply and PPL Electric may not satisfy their debts from the assets of their subsidiaries absent a specific contractual undertaking by a subsidiary to pay the creditors or as required by applicable law or regulation. In addition, absent a specific contractual undertaking or as required by applicable law or regulation, PPL Energy Supply and PPL Electric are not liable for the debts of their subsidiaries. Accordingly, creditors of these subsidiaries may not satisfy their debts from the assets of PPL Energy Supply or PPL Electric absent a specific contractual undertaking by that parent to pay the creditors of its subsidiaries or as required by applicable law or regulation.
Common Stock Repurchase Program (PPL) In June 2007, PPL's Board of Directors authorized the repurchase by PPL of up to $750 million of its common stock. A total of 15,732,708 shares were repurchased for $750 million, excluding related fees, under the plan during 2008 and 2007. These purchases were primarily recorded as a reduction to "Capital in excess of par value" on the Balance Sheet. Distributions, Capital Contributions and Related Restrictions (PPL) In February 2009, PPL announced an increase to its quarterly common stock dividend, effective April 1, 2009, to 34.5 cents per share (equivalent to $1.38 per annum). Future dividends, declared at the discretion of the Board of Directors, will be dependent upon future earnings, cash flows, financial requirements and other factors. Neither PPL Capital Funding nor PPL may declare or pay any cash dividend or distribution on its capital stock during any period in which PPL Capital Funding defers interest payments on its 2007 Series A Junior Subordinated Notes due 2067. At December 31, 2009, no interest payments were deferred. (PPL and PPL Energy Supply) The PPL Montana Colstrip lease places certain restrictions on PPL Montana's ability to declare dividends. At this time, PPL believes that these covenants will not limit PPL's or PPL Energy Supply's ability to operate as desired and will not affect their ability to meet any of their cash obligations. WPD subsidiaries also have financing arrangements that limit their ability to pay dividends. However, PPL does not, at this time, expect that any of such limitations would significantly impact PPL's or PPL Energy Supply's ability to meet their cash obligations. (PPL Energy Supply) During 2009, PPL Energy Supply distributed $943 million to its parent company, PPL Energy Funding, and received cash capital contributions of $50 million. (PPL and PPL Electric) As discussed in Note 6, PPL Electric may not pay dividends on its common stock, except in certain circumstances, unless full dividends have been paid on the Preference Shares for the then-current dividend period. The quarterly dividend rate for PPL Electric's Preference Shares is $1.5625 per share. PPL Electric has declared and paid dividends on its outstanding Preference Shares since issuance. Dividends on the Preference Shares are not cumulative and future dividends, declared at the discretion of PPL Electric's Board of Directors, will be dependent upon future earnings, cash flows, financial requirements and other factors. PPL Electric is subject to Section 305(a) of the Federal Power Act, which makes it unlawful for a public utility to make or pay a dividend from any funds "properly included in capital
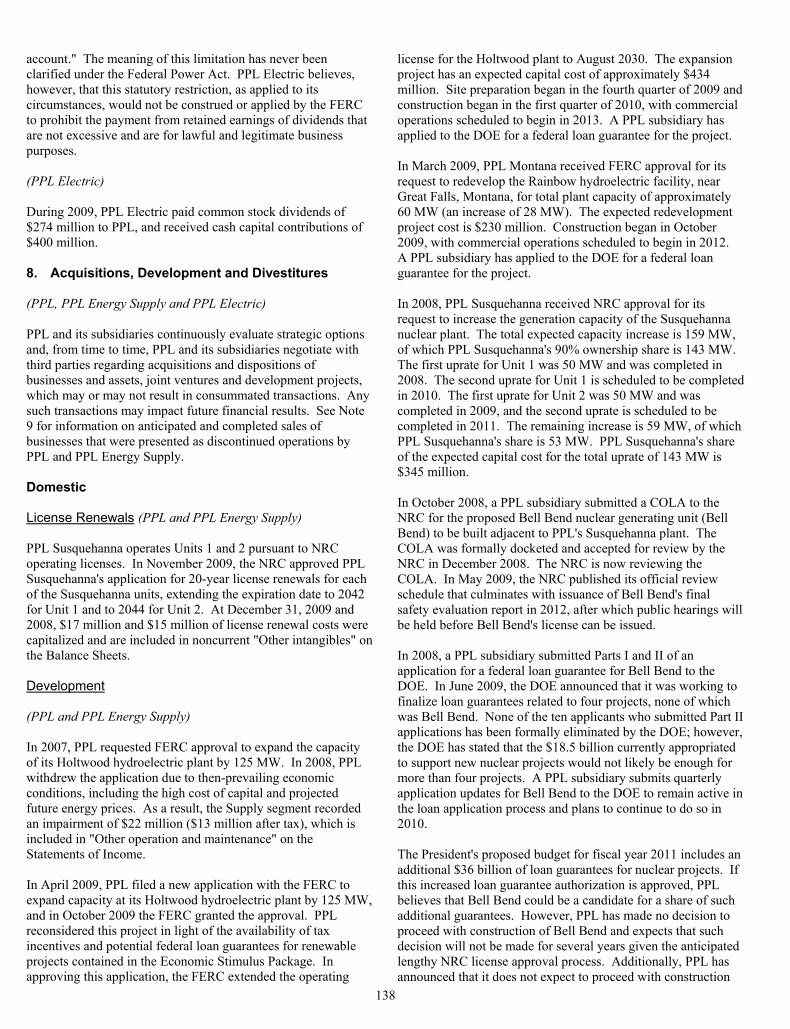
138
account." The meaning of this limitation has never been clarified under the Federal Power Act. PPL Electric believes, however, that this statutory restriction, as applied to its circumstances, would not be construed or applied by the FERC to prohibit the payment from retained earnings of dividends that are not excessive and are for lawful and legitimate business purposes. (PPL Electric) During 2009, PPL Electric paid common stock dividends of $274 million to PPL, and received cash capital contributions of $400 million. 8. Acquisitions, Development and Divestitures (PPL, PPL Energy Supply and PPL Electric) PPL and its subsidiaries continuously evaluate strategic options and, from time to time, PPL and its subsidiaries negotiate with third parties regarding acquisitions and dispositions of businesses and assets, joint ventures and development projects, which may or may not result in consummated transactions. Any such transactions may impact future financial results. See Note 9 for information on anticipated and completed sales of businesses that were presented as discontinued operations by PPL and PPL Energy Supply. Domestic License Renewals (PPL and PPL Energy Supply) PPL Susquehanna operates Units 1 and 2 pursuant to NRC operating licenses. In November 2009, the NRC approved PPL Susquehanna's application for 20-year license renewals for each of the Susquehanna units, extending the expiration date to 2042 for Unit 1 and to 2044 for Unit 2. At December 31, 2009 and 2008, $17 million and $15 million of license renewal costs were capitalized and are included in noncurrent "Other intangibles" on the Balance Sheets. Development (PPL and PPL Energy Supply) In 2007, PPL requested FERC approval to expand the capacity of its Holtwood hydroelectric plant by 125 MW. In 2008, PPL withdrew the application due to then-prevailing economic conditions, including the high cost of capital and projected future energy prices. As a result, the Supply segment recorded an impairment of $22 million ($13 million after tax), which is included in "Other operation and maintenance" on the Statements of Income. In April 2009, PPL filed a new application with the FERC to expand capacity at its Holtwood hydroelectric plant by 125 MW, and in October 2009 the FERC granted the approval. PPL reconsidered this project in light of the availability of tax incentives and potential federal loan guarantees for renewable projects contained in the Economic Stimulus Package. In approving this application, the FERC extended the operating
license for the Holtwood plant to August 2030. The expansion project has an expected capital cost of approximately $434 million. Site preparation began in the fourth quarter of 2009 and construction began in the first quarter of 2010, with commercial operations scheduled to begin in 2013. A PPL subsidiary has applied to the DOE for a federal loan guarantee for the project. In March 2009, PPL Montana received FERC approval for its request to redevelop the Rainbow hydroelectric facility, near Great Falls, Montana, for total plant capacity of approximately 60 MW (an increase of 28 MW). The expected redevelopment project cost is $230 million. Construction began in October 2009, with commercial operations scheduled to begin in 2012. A PPL subsidiary has applied to the DOE for a federal loan guarantee for the project. In 2008, PPL Susquehanna received NRC approval for its request to increase the generation capacity of the Susquehanna nuclear plant. The total expected capacity increase is 159 MW, of which PPL Susquehanna's 90% ownership share is 143 MW. The first uprate for Unit 1 was 50 MW and was completed in 2008. The second uprate for Unit 1 is scheduled to be completed in 2010. The first uprate for Unit 2 was 50 MW and was completed in 2009, and the second uprate is scheduled to be completed in 2011. The remaining increase is 59 MW, of which PPL Susquehanna's share is 53 MW. PPL Susquehanna's share of the expected capital cost for the total uprate of 143 MW is $345 million. In October 2008, a PPL subsidiary submitted a COLA to the NRC for the proposed Bell Bend nuclear generating unit (Bell Bend) to be built adjacent to PPL's Susquehanna plant. The COLA was formally docketed and accepted for review by the NRC in December 2008. The NRC is now reviewing the COLA. In May 2009, the NRC published its official review schedule that culminates with issuance of Bell Bend's final safety evaluation report in 2012, after which public hearings will be held before Bell Bend's license can be issued. In 2008, a PPL subsidiary submitted Parts I and II of an application for a federal loan guarantee for Bell Bend to the DOE. In June 2009, the DOE announced that it was working to finalize loan guarantees related to four projects, none of which was Bell Bend. None of the ten applicants who submitted Part II applications has been formally eliminated by the DOE; however, the DOE has stated that the $18.5 billion currently appropriated to support new nuclear projects would not likely be enough for more than four projects. A PPL subsidiary submits quarterly application updates for Bell Bend to the DOE to remain active in the loan application process and plans to continue to do so in 2010. The President's proposed budget for fiscal year 2011 includes an additional $36 billion of loan guarantees for nuclear projects. If this increased loan guarantee authorization is approved, PPL believes that Bell Bend could be a candidate for a share of such additional guarantees. However, PPL has made no decision to proceed with construction of Bell Bend and expects that such decision will not be made for several years given the anticipated lengthy NRC license approval process. Additionally, PPL has announced that it does not expect to proceed with construction
139
absent a joint arrangement with other interested parties and a federal loan guarantee or other acceptable financing. PPL and its subsidiaries are authorized by PPL's Board of Directors to spend up to $111 million on the COLA and other permits necessary for construction. At December 31, 2009 and 2008, $77 million and $58 million of costs associated with the licensing application were capitalized and are included in noncurrent "Other intangibles" on the Balance Sheets, as PPL believes it is probable that these costs are ultimately recoverable following approval by the NRC either through construction of the new nuclear unit, transfer of the COLA rights to a joint venture, or sale of the COLA rights to another party. (PPL and PPL Electric) In June 2007, the PJM directed the construction of a new 150-mile, 500-kilovolt transmission line between the Susquehanna substation in Pennsylvania and the Roseland substation in New Jersey that it identified as essential to long-term reliability of the mid-Atlantic electricity grid. The PJM determined that the line is needed to prevent potential overloads that could occur in the next decade on several existing transmission lines in the interconnected PJM system. The PJM has directed PPL Electric to construct the portion of the Susquehanna-Roseland line in Pennsylvania and has directed Public Service Electric & Gas Company to construct the portion of the line in New Jersey, in each case by June 1, 2012. PPL Electric's estimated share of the project costs at December 31, 2009 was $510 million. This project is pending certain regulatory approvals. PPL Electric has identified the approximately 100-mile route for the Pennsylvania portion of the line. In February 2010, the PUC and the New Jersey Board of Public Utilities approved the project. In addition, both companies are working with the National Park Service to obtain any approvals that may be required to route the line through the Delaware Water Gap National Recreation Area. PPL Electric cannot predict the ultimate outcome or timing of the National Park Service approval. However, PPL Electric currently anticipates delays in the approval process which will affect the PJM-directed in-service date and projected costs of the line. PPL Electric also cannot predict what action, if any, the PJM might take in the event of a delay to its scheduled in-service date for the new line. (PPL and PPL Energy Supply) Sale of Telecommunication Operations In the first quarter of 2007, PPL completed a review of strategic options for the transport operations of its domestic telecommunications subsidiary, which offered fiber optic capacity to other telecommunications companies and enterprise customers. The operating results of this subsidiary were included in the Supply segment. Due to significant capital requirements for the telecommunication operations and competing capital needs in PPL's core electricity supply and delivery businesses, PPL decided to market these operations. The transport operations did not meet the criteria for discontinued operations on the Statement of Income because there were not separate and distinguishable cash flows, among
other factors. In August 2007, PPL sold its telecommunication operations. In connection with the sale, in 2007 PPL and PPL Energy Supply recorded impairments of $39 million ($23 million after tax) of the telecommunication assets based on their estimated fair value. The impairments are included in "Energy-related businesses" expenses on the Statement of Income. PPL realized net proceeds of $47 million from the sale. Acquisition of a Long-term Tolling Agreement In 2008, PPL EnergyPlus acquired the rights to an existing long-term tolling agreement associated with the capacity and energy of Ironwood. The tolling agreement extends through 2021 and is considered to contain an operating lease for accounting purposes. As a result of this agreement, PPL EnergyPlus recognized an intangible asset. See Note 10 for additional information on the lease. 9. Discontinued Operations (PPL and PPL Energy Supply) Anticipated Sale of Long Island Generation Business As a result of management's ongoing strategic review of PPL's non-core asset portfolio, in May 2009, PPL Generation signed a definitive agreement to sell its Long Island generation business, which is included in the Supply segment, for approximately $135 million in cash, adjusted for working capital at the sale date and subject to reduction monthly, effective September 1, 2009. The Long Island Power Authority has contracted with PPL Energy Supply subsidiaries to purchase all of this business' capacity and ancillary services as part of tolling agreements that expire in 2017 and 2018. Each agreement is considered to contain a lease for accounting purposes. These tolling agreements will be transferred to the purchaser upon completion of the sale. The Long Island generation business met the held for sale criteria in the second quarter of 2009. As a result, net assets held for sale with a carrying amount of $189 million were written down to their estimated fair value (less cost to sell) of $137 million at June 30, 2009, resulting in a pre-tax impairment charge of $52 million ($34 million after tax). At both September 30 and December 31, 2009, the estimated fair value (less cost to sell) was remeasured and additional impairments totaling $10 million ($3 million after tax) were recorded. In addition, $2 million ($1 million after tax) of goodwill allocated to this business was written off in 2009. The impairment charges recognized in the third and fourth quarters of 2009 had no significant impact on earnings, as such amounts were substantially offset by tolling revenues from the Long Island generation assets. These charges are included in "Income (Loss) from Discontinued Operations (net of income taxes)" on the 2009 Statement of Income. Closing of the sale is expected to occur on or about February 26, 2010. After adjusting for the delayed closing provisions, proceeds will approximate $125 million, excluding working capital.
140
Following are the components of Discontinued Operations in the Statements of Income. 2009 2008 2007
Operating revenues $ 24 $ 26 $ 28Operating expenses (a) 73 8 8Operating income (loss) (49 ) 18 20Interest expense (b) 4 3 2Income (loss) before income taxes (53 ) 15 18Income taxes (20 ) 5 8Income (Loss) from Discontinued Operations $ (33 ) $ 10 $ 10
(a) 2009 includes impairments to the carrying value of the business. (b) Represents allocated interest expense based upon debt attributable to PPL's
Long Island generation business. The major classes of assets reported as held for sale on the Balance Sheet at December 31, 2009 were $41 million of PP&E and an $86 million net investment in a direct-financing lease (corresponding amounts at December 31, 2008, were $88 million of PP&E and a $104 million net investment in a direct-financing lease, which have not been reclassified on the Balance Sheet as of that date). Sale of Maine Hydroelectric Generation Business In 2004, PPL Maine entered into an agreement with a coalition of government agencies and private groups to sell three of its hydroelectric facilities in Maine. Under the agreement, a non-profit organization designated by the coalition received a five-year option to purchase the hydroelectric facilities for $25 million and, if the option was exercised, PPL Maine would receive rights to increase energy output at its other Maine hydroelectric facilities. The coalition announced plans to remove or bypass the subject facilities to restore runs of Atlantic salmon and other migratory fish to the Penobscot River. In June 2008, the coalition notified PPL Maine of its intent to exercise the purchase option. The agreement requires updates to its representations and warranties, and is subject to approvals by the FERC and other regulatory agencies. In November 2008, PPL Maine and the coalition requested the FERC, the U.S. Army Corps of Engineers and the Maine DEP to approve the transfer of ownership of the three facilities. Certain of these required approvals have been obtained, but PPL cannot predict whether or when all of them will be obtained. As a result, these three Maine hydroelectric facilities did not meet the held for sale criteria at December 31, 2009. In July 2009, indirectly related to the above potential sale and as a result of management's ongoing strategic review of PPL's non-core asset portfolio, PPL Maine signed a definitive agreement to sell the majority of its hydroelectric generation business, which was included in the Supply segment. PPL completed this sale in November 2009 for $81 million in cash, adjusted for working capital. The assets sold in this transaction included five hydroelectric facilities and PPL's 50% equity interest in a sixth hydroelectric facility, which had been accounted for as an equity investment, as well as the rights to increase energy output at these facilities if the potential sale of the three other hydroelectric facilities (discussed above) is completed. PPL's interest in these six facilities represented a total of 30 MW of
electric generating capacity. As a result of this sale, PPL recorded a gain of $38 million ($22 million after tax), reflected in "Income (Loss) from Discontinued Operations (net of income taxes)" on the 2009 Statement of Income. In addition, upon completion of the sale of the three other hydroelectric facilities noted above, PPL will receive $14 million in contingent consideration and record an associated additional after-tax gain of between $7 and $9 million. Following are the components of Discontinued Operations in the Statements of Income. 2009 2008 2007
Operating revenues $ 5 $ 11 $ 8Operating expenses (a) (34 ) 3 4Operating income 39 8 4Other income-net 3 2 2Interest expense (b) 1 1 Income before income taxes 41 9 6Income taxes 17 4 4Income from Discontinued Operations $ 24 $ 5 $ 2
(a) 2009 includes the gain recorded on the sale. (b) Represents allocated interest expense based upon debt attributable to the
Maine hydroelectric generation business. Upon completion of the sale, $23 million of PP&E, an $18 million equity method investment and $1 million of allocated goodwill were removed from the Balance Sheet. Sale of Interest in Wyman Unit 4 As a result of management's ongoing strategic review of PPL's non-core asset portfolio, in December 2009, PPL Maine sold its 8.33% ownership interest in the 610 MW Wyman Unit 4 generating station, an oil-fired plant located in Yarmouth, Maine. PPL's interest in the plant was included in the Supply segment. In connection with the sale, PPL recorded a loss of $6 million ($4 million after tax). This charge is included in "Income (Loss) from Discontinued Operations (net of income taxes)" on the 2009 Statement of Income. PPL's share of the results of operations for the years 2007 - 2009 was insignificant. Sale of Latin American Businesses In March 2007, PPL completed a review of strategic options for its Latin American businesses and announced its intention to sell its regulated electricity delivery businesses in Chile, El Salvador and Bolivia, which were included in the International Delivery segment. In April 2007, PPL agreed to sell its Bolivian businesses. As a result, in 2007, PPL recorded impairments totaling $37 million ($20 million after tax) to reflect the estimated fair value of the businesses at the date of the agreement. This sale was completed in July 2007. In May 2007, PPL completed the sale of its El Salvadoran business for $180 million in cash. PPL recorded a gain of $94 million ($89 million after tax) as a result of the sale. In November 2007, PPL completed the sale of its Chilean business for $660 million in cash and recorded a related gain of $306 million ($197 million after tax).
141
In 2008, PPL Global recognized income tax benefits and miscellaneous expenses in Discontinued Operations in connection with the dissolution of certain Latin American holding companies. This process was substantially completed in 2008. In 2009, PPL identified a correction to the previously computed tax bases of the Latin American businesses. The most significant adjustment related to the sale of the El Salvadoran business and was largely due to returns of capital in certain prior years that had not been reflected in the calculated tax basis. As a result, PPL and PPL Energy Supply recorded $24 million of additional income tax expense in 2009, which is reflected on the Statement of Income in "Income (Loss) from Discontinued Operations (net of income taxes)." The additional expense is not considered by management to be material to the financial statements of PPL and PPL Energy Supply for the years ended 2007 and 2009. Following are the components of Discontinued Operations in the Statements of Income. 2009 2008 2007
Operating revenues $ 529Operating expenses (a) $ 2 497Operating income (loss) (2 ) 32Other income - net (1 ) 15Interest expense (b) 25Income (Loss) before income taxes (3 ) 22Income taxes (c) $ 27 (8 ) (5)Gain on sale of businesses (net of tax expense of $114 million) 286
Income (Loss) from Discontinued Operations (27 ) 5 313
Income from Discontinued Operations Attributable to Noncontrolling Interests 6
Income (Loss) from Discontinued Operations Attributable to PPL/PPL Energy Supply $ (27 ) $ 5 $ 307
(a) 2007 includes the impairments to the carrying value of the Bolivian
businesses. Also included are fees associated with the divestiture of the Latin American businesses of $12 million ($7 million after tax).
(b) 2007 includes $5 million of allocated interest expense based on the discontinued operation's share of the net assets of PPL Energy Supply.
(c) 2009 includes the $24 million income tax adjustment referred to above. 2008 includes $6 million from the recognition of a previously unrecognized tax benefit associated with a prior year tax position. 2007 includes U.S. deferred tax charges of $7 million. As a result of PPL's decision to sell its Latin American businesses, it no longer qualified for the permanently reinvested exception to recording deferred taxes.
(PPL) Sale of Gas and Propane Businesses In July 2007, PPL completed a review of strategic options for its natural gas distribution and propane businesses and announced its intention to sell these businesses, which were included in the Pennsylvania Delivery segment. Based on the expectation that the natural gas distribution and propane assets would be sold and an assessment of prevailing market conditions, an impairment charge of $22 million and an associated income tax benefit of $1 million were recorded in 2007. In March 2008, PPL signed a definitive agreement to sell these businesses for $268 million in cash, adjusted for working capital at the sale date, pursuant to a stock purchase agreement. PPL completed the sale in October 2008. Sale proceeds of $303 million, including estimated working capital, were contributed to PPL Energy Supply through its parent, PPL Energy Funding. In 2008, PPL recorded impairment and other charges related to the sale totaling $10 million ($6 million after tax). Also in 2008, PPL Gas Utilities paid a $3 million ($2 million after tax) premium to prepay the entire $10 million aggregate principal of its 8.70% Senior Notes due December 2022. In the first quarter of 2009, PPL recognized an insignificant charge in Discontinued Operations in connection with the settlement of the working capital adjustment. Following are the components in Discontinued Operations in the Statements of Income. 2008 2007
Operating revenues $ 162 $ 218 Operating expenses (a) 154 211 Operating income 8 7 Other income - net (3 ) Interest expense (b) 4 6 Income before income taxes 1 1 Income taxes (c) (2 ) 33 Income (Loss) from Discontinued Operations $ 3 $ (32 )
(a) 2008 and 2007 include impairment and other charges related to the sale of
$10 million and $22 million. (b) 2008 and 2007 include $3 million and $5 million of allocated interest
expense based upon debt attributable to PPL's natural gas distribution and propane businesses.
(c) As a result of classifying the natural gas distribution and propane businesses as Discontinued Operations in 2007, PPL recorded a deferred income tax charge of $23 million related to its book/tax basis difference in the investment in these assets.
142
10. Leases (PPL and PPL Energy Supply) Lessee Transactions Tolling Agreement In 2008, PPL EnergyPlus acquired the rights to an existing long-term tolling agreement for the capacity and energy of Ironwood. Under the agreement, PPL EnergyPlus has control over the plant's dispatch into the electricity grid and will supply the natural gas necessary to operate the plant. The tolling agreement extends through 2021 and is considered to contain an operating lease for accounting purposes. The fixed payments under the tolling agreement are subject to adjustment based upon changes to the facility capacity rating, which may occur up to twice per year. Certain costs within the tolling agreement, primarily non-lease costs, are subject to escalation. Colstrip Generating Plant In July 2000, PPL Montana sold its interest in the Colstrip generating plants to owner lessors who are leasing a 50% interest in Colstrip Units 1 and 2 and a 30% interest in Unit 3 back to PPL Montana under four 36-year non-cancelable leases. This transaction is accounted for as a sale-leaseback and classified as an operating lease. These leases provide two renewal options based on the economic useful life of the generation assets. PPL Montana currently amortizes material leasehold improvements over no more than the remaining life of the original leases. PPL Montana is required to pay all expenses associated with the operations of the generation units. The leases place certain restrictions on PPL Montana's ability to incur additional debt, sell assets and declare dividends and require PPL Montana to maintain certain financial ratios related to cash flow and net worth. There are no residual value guarantees in these leases. However, upon an event of default or an event of loss, PPL Montana could be required to pay a termination value of amounts sufficient to allow the lessor to repay amounts owing on the lessor notes and make the lessor whole for its equity investment and anticipated return on investment. The events of default include payment defaults, breaches of representations or covenants, acceleration of other indebtedness of PPL Montana, change in control of PPL Montana and certain bankruptcy events. The termination value was estimated to be $734 million at December 31, 2009. Kerr Dam At December 31, 2009, PPL Montana continued to participate in a lease arrangement with the Confederated Salish and Kootenai Tribes of the Flathead Reservation. Under a joint operating license, issued by the FERC to Montana Power in 1985, and subsequently to PPL Montana as a result of the purchase of Kerr Dam from Montana Power, PPL Montana is responsible to make payments to the tribes, for the use of their property. This agreement, subject to escalation based upon inflation, extends until the end of the license term in 2035. Between 2015 and 2025, the tribes have the option to purchase, hold and operate the
project, which would result in the termination of this leasing arrangement. Other Leases PPL and its subsidiaries have entered into various agreements for the lease of office space, land and other equipment. Rent - Operating Leases Rent expense for PPL's and PPL Energy Supply's operating leases was $86 million, $73 million and $54 million in 2009, 2008 and 2007. Total future minimum rental payments for all operating leases are estimated to be: 2010 $ 108 2011 109 2012 107 2013 112 2014 111 Thereafter 421 $ 968 (a)
(a) Includes $9 million in aggregate of future minimum lease payments
related to the Long Island generation business. See Note 9 for additional information on the anticipated sale of this business.
Lessor Transactions A PPL Energy Supply subsidiary is the lessor, for accounting purposes, of each of the Shoreham and Edgewood plants (collectively with related tolling agreements, the Long Island generation business). In May 2009, PPL Generation signed a definitive agreement to sell the Long Island generation business. The tolling agreements related to these plants, accounted for as containing leases, will be transferred to the purchaser upon completion of the sale. See Note 9 for additional information. Direct Financing Lease The lease related to the Shoreham plant is classified as a direct-financing lease. Rental income received during 2009 and 2007 was $14 million and $13 million in 2008. Total future minimum lease payments are estimated at $16 million for each of the years from 2010 through 2014. Substantially all of these lease payments are no longer expected to be received subsequent to the anticipated sale of the Long Island generation business. Operating Lease The lease related to the Edgewood plant is classified as an operating lease. At December 31, 2009, total minimum future rentals under this lease were estimated to be $25 million, including $3 million per year for 2010 through 2014. These minimum future rentals are no longer expected to be received subsequent to the anticipated sale of the Long Island generation business.
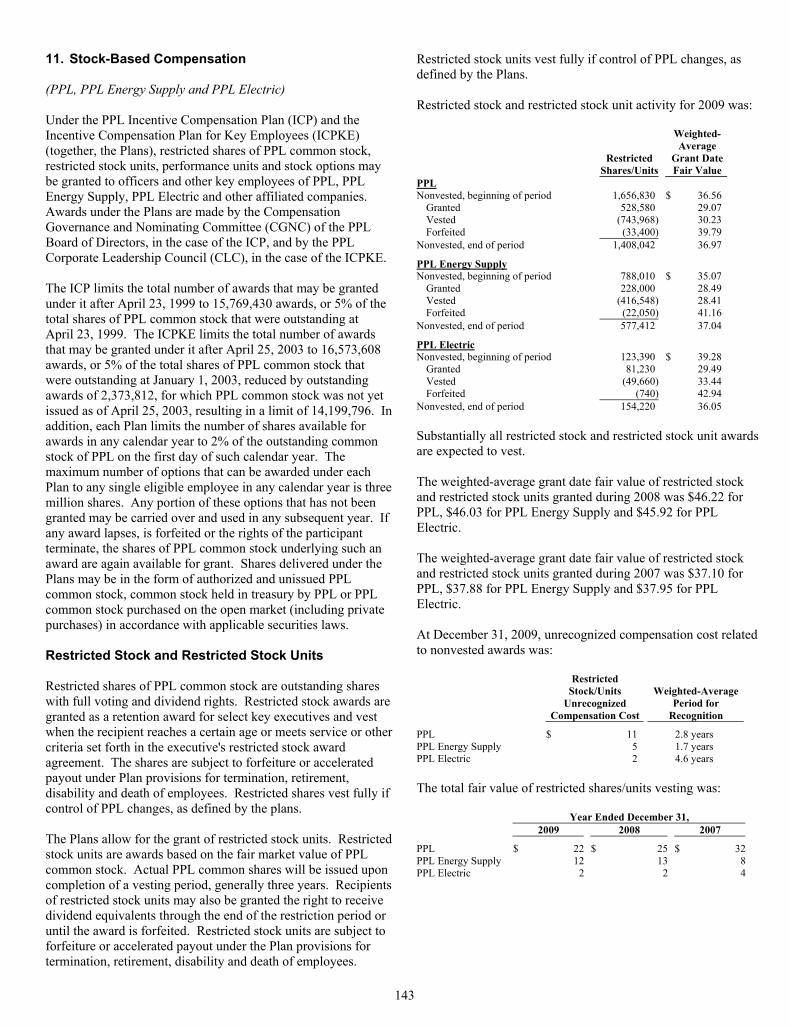
143
11. Stock-Based Compensation (PPL, PPL Energy Supply and PPL Electric) Under the PPL Incentive Compensation Plan (ICP) and the Incentive Compensation Plan for Key Employees (ICPKE) (together, the Plans), restricted shares of PPL common stock, restricted stock units, performance units and stock options may be granted to officers and other key employees of PPL, PPL Energy Supply, PPL Electric and other affiliated companies. Awards under the Plans are made by the Compensation Governance and Nominating Committee (CGNC) of the PPL Board of Directors, in the case of the ICP, and by the PPL Corporate Leadership Council (CLC), in the case of the ICPKE. The ICP limits the total number of awards that may be granted under it after April 23, 1999 to 15,769,430 awards, or 5% of the total shares of PPL common stock that were outstanding at April 23, 1999. The ICPKE limits the total number of awards that may be granted under it after April 25, 2003 to 16,573,608 awards, or 5% of the total shares of PPL common stock that were outstanding at January 1, 2003, reduced by outstanding awards of 2,373,812, for which PPL common stock was not yet issued as of April 25, 2003, resulting in a limit of 14,199,796. In addition, each Plan limits the number of shares available for awards in any calendar year to 2% of the outstanding common stock of PPL on the first day of such calendar year. The maximum number of options that can be awarded under each Plan to any single eligible employee in any calendar year is three million shares. Any portion of these options that has not been granted may be carried over and used in any subsequent year. If any award lapses, is forfeited or the rights of the participant terminate, the shares of PPL common stock underlying such an award are again available for grant. Shares delivered under the Plans may be in the form of authorized and unissued PPL common stock, common stock held in treasury by PPL or PPL common stock purchased on the open market (including private purchases) in accordance with applicable securities laws. Restricted Stock and Restricted Stock Units Restricted shares of PPL common stock are outstanding shares with full voting and dividend rights. Restricted stock awards are granted as a retention award for select key executives and vest when the recipient reaches a certain age or meets service or other criteria set forth in the executive's restricted stock award agreement. The shares are subject to forfeiture or accelerated payout under Plan provisions for termination, retirement, disability and death of employees. Restricted shares vest fully if control of PPL changes, as defined by the plans. The Plans allow for the grant of restricted stock units. Restricted stock units are awards based on the fair market value of PPL common stock. Actual PPL common shares will be issued upon completion of a vesting period, generally three years. Recipients of restricted stock units may also be granted the right to receive dividend equivalents through the end of the restriction period or until the award is forfeited. Restricted stock units are subject to forfeiture or accelerated payout under the Plan provisions for termination, retirement, disability and death of employees.
Restricted stock units vest fully if control of PPL changes, as defined by the Plans. Restricted stock and restricted stock unit activity for 2009 was:
Restricted
Shares/Units
Weighted-Average
Grant Date Fair Value
PPL Nonvested, beginning of period 1,656,830 $ 36.56
Granted 528,580 29.07 Vested (743,968) 30.23 Forfeited (33,400) 39.79
Nonvested, end of period 1,408,042 36.97
PPL Energy Supply Nonvested, beginning of period 788,010 $ 35.07
Granted 228,000 28.49 Vested (416,548) 28.41 Forfeited (22,050) 41.16
Nonvested, end of period 577,412 37.04
PPL Electric Nonvested, beginning of period 123,390 $ 39.28
Granted 81,230 29.49 Vested (49,660) 33.44 Forfeited (740) 42.94
Nonvested, end of period 154,220 36.05 Substantially all restricted stock and restricted stock unit awards are expected to vest. The weighted-average grant date fair value of restricted stock and restricted stock units granted during 2008 was $46.22 for PPL, $46.03 for PPL Energy Supply and $45.92 for PPL Electric. The weighted-average grant date fair value of restricted stock and restricted stock units granted during 2007 was $37.10 for PPL, $37.88 for PPL Energy Supply and $37.95 for PPL Electric. At December 31, 2009, unrecognized compensation cost related to nonvested awards was:
Restricted Stock/Units
Unrecognized Compensation Cost
Weighted-Average Period for
Recognition
PPL $ 11 2.8 years PPL Energy Supply 5 1.7 years PPL Electric 2 4.6 years The total fair value of restricted shares/units vesting was: Year Ended December 31, 2009 2008 2007
PPL $ 22 $ 25 $ 32 PPL Energy Supply 12 13 8 PPL Electric 2 2 4
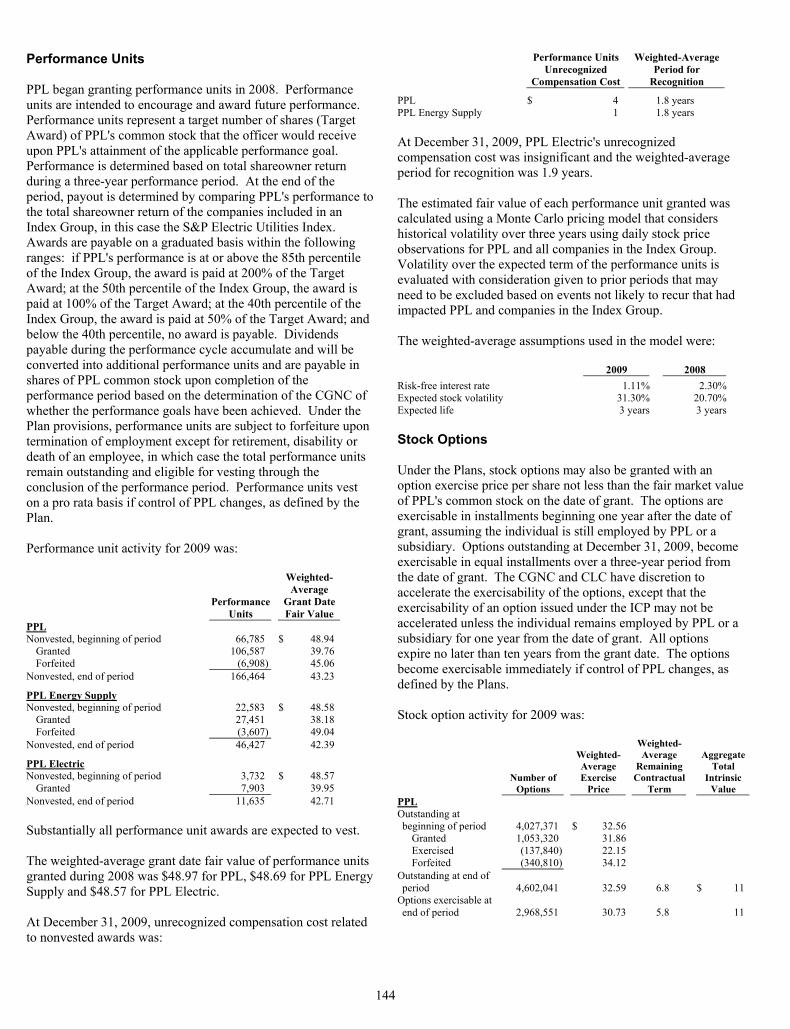
144
Performance Units PPL began granting performance units in 2008. Performance units are intended to encourage and award future performance. Performance units represent a target number of shares (Target Award) of PPL's common stock that the officer would receive upon PPL's attainment of the applicable performance goal. Performance is determined based on total shareowner return during a three-year performance period. At the end of the period, payout is determined by comparing PPL's performance to the total shareowner return of the companies included in an Index Group, in this case the S&P Electric Utilities Index. Awards are payable on a graduated basis within the following ranges: if PPL's performance is at or above the 85th percentile of the Index Group, the award is paid at 200% of the Target Award; at the 50th percentile of the Index Group, the award is paid at 100% of the Target Award; at the 40th percentile of the Index Group, the award is paid at 50% of the Target Award; and below the 40th percentile, no award is payable. Dividends payable during the performance cycle accumulate and will be converted into additional performance units and are payable in shares of PPL common stock upon completion of the performance period based on the determination of the CGNC of whether the performance goals have been achieved. Under the Plan provisions, performance units are subject to forfeiture upon termination of employment except for retirement, disability or death of an employee, in which case the total performance units remain outstanding and eligible for vesting through the conclusion of the performance period. Performance units vest on a pro rata basis if control of PPL changes, as defined by the Plan. Performance unit activity for 2009 was:
Performance
Units
Weighted-Average
Grant Date Fair Value
PPL Nonvested, beginning of period 66,785 $ 48.94
Granted 106,587 39.76 Forfeited (6,908) 45.06
Nonvested, end of period 166,464 43.23
PPL Energy Supply Nonvested, beginning of period 22,583 $ 48.58
Granted 27,451 38.18 Forfeited (3,607) 49.04
Nonvested, end of period 46,427 42.39
PPL Electric Nonvested, beginning of period 3,732 $ 48.57
Granted 7,903 39.95 Nonvested, end of period 11,635 42.71 Substantially all performance unit awards are expected to vest. The weighted-average grant date fair value of performance units granted during 2008 was $48.97 for PPL, $48.69 for PPL Energy Supply and $48.57 for PPL Electric. At December 31, 2009, unrecognized compensation cost related to nonvested awards was:
Performance Units Unrecognized
Compensation Cost
Weighted-Average Period for
Recognition
PPL $ 4 1.8 years PPL Energy Supply 1 1.8 years At December 31, 2009, PPL Electric's unrecognized compensation cost was insignificant and the weighted-average period for recognition was 1.9 years. The estimated fair value of each performance unit granted was calculated using a Monte Carlo pricing model that considers historical volatility over three years using daily stock price observations for PPL and all companies in the Index Group. Volatility over the expected term of the performance units is evaluated with consideration given to prior periods that may need to be excluded based on events not likely to recur that had impacted PPL and companies in the Index Group. The weighted-average assumptions used in the model were:
2009 2008 Risk-free interest rate 1.11% 2.30%Expected stock volatility 31.30% 20.70%Expected life 3 years 3 years Stock Options Under the Plans, stock options may also be granted with an option exercise price per share not less than the fair market value of PPL's common stock on the date of grant. The options are exercisable in installments beginning one year after the date of grant, assuming the individual is still employed by PPL or a subsidiary. Options outstanding at December 31, 2009, become exercisable in equal installments over a three-year period from the date of grant. The CGNC and CLC have discretion to accelerate the exercisability of the options, except that the exercisability of an option issued under the ICP may not be accelerated unless the individual remains employed by PPL or a subsidiary for one year from the date of grant. All options expire no later than ten years from the grant date. The options become exercisable immediately if control of PPL changes, as defined by the Plans. Stock option activity for 2009 was:
Number of
Options
Weighted-Average Exercise
Price
Weighted-Average
Remaining Contractual
Term
Aggregate Total
Intrinsic Value
PPL Outstanding at beginning of period 4,027,371 $ 32.56
Granted 1,053,320 31.86 Exercised (137,840) 22.15 Forfeited (340,810) 34.12
Outstanding at end of period 4,602,041 32.59 6.8 $ 11
Options exercisable at end of period 2,968,551 30.73 5.8 11
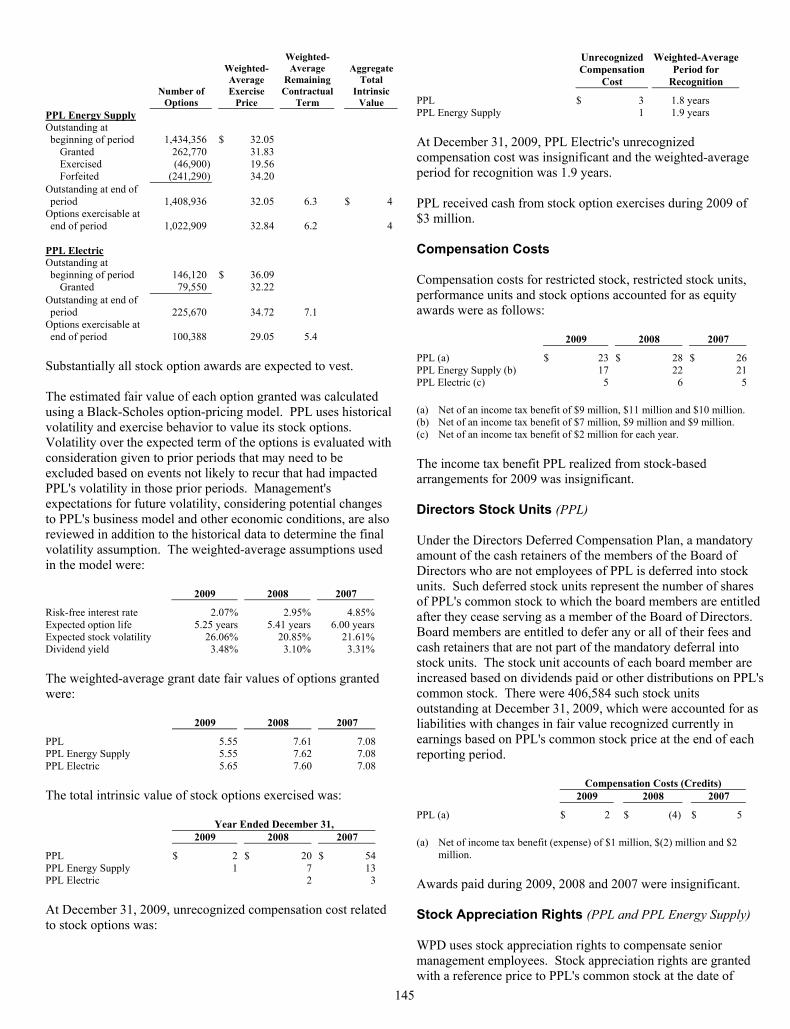
145
Number of
Options
Weighted-Average Exercise
Price
Weighted-Average
Remaining Contractual
Term
Aggregate Total
Intrinsic Value
PPL Energy Supply Outstanding at beginning of period 1,434,356 $ 32.05
Granted 262,770 31.83 Exercised (46,900) 19.56 Forfeited (241,290) 34.20
Outstanding at end of period 1,408,936 32.05 6.3 $ 4
Options exercisable at end of period 1,022,909 32.84 6.2 4
PPL Electric Outstanding at beginning of period 146,120 $ 36.09
Granted 79,550 32.22 Outstanding at end of period 225,670 34.72 7.1
Options exercisable at end of period 100,388 29.05 5.4
Substantially all stock option awards are expected to vest. The estimated fair value of each option granted was calculated using a Black-Scholes option-pricing model. PPL uses historical volatility and exercise behavior to value its stock options. Volatility over the expected term of the options is evaluated with consideration given to prior periods that may need to be excluded based on events not likely to recur that had impacted PPL's volatility in those prior periods. Management's expectations for future volatility, considering potential changes to PPL's business model and other economic conditions, are also reviewed in addition to the historical data to determine the final volatility assumption. The weighted-average assumptions used in the model were:
2009 2008 2007
Risk-free interest rate 2.07% 2.95% 4.85%Expected option life 5.25 years 5.41 years 6.00 yearsExpected stock volatility 26.06% 20.85% 21.61%Dividend yield 3.48% 3.10% 3.31% The weighted-average grant date fair values of options granted were: 2009 2008 2007
PPL 5.55 7.61 7.08 PPL Energy Supply 5.55 7.62 7.08 PPL Electric 5.65 7.60 7.08 The total intrinsic value of stock options exercised was: Year Ended December 31, 2009 2008 2007
PPL $ 2 $ 20 $ 54 PPL Energy Supply 1 7 13 PPL Electric 2 3 At December 31, 2009, unrecognized compensation cost related to stock options was:
Unrecognized Compensation
Cost
Weighted-AveragePeriod for
Recognition
PPL $ 3 1.8 years PPL Energy Supply 1 1.9 years At December 31, 2009, PPL Electric's unrecognized compensation cost was insignificant and the weighted-average period for recognition was 1.9 years. PPL received cash from stock option exercises during 2009 of $3 million. Compensation Costs Compensation costs for restricted stock, restricted stock units, performance units and stock options accounted for as equity awards were as follows: 2009 2008 2007
PPL (a) $ 23 $ 28 $ 26 PPL Energy Supply (b) 17 22 21 PPL Electric (c) 5 6 5 (a) Net of an income tax benefit of $9 million, $11 million and $10 million. (b) Net of an income tax benefit of $7 million, $9 million and $9 million. (c) Net of an income tax benefit of $2 million for each year. The income tax benefit PPL realized from stock-based arrangements for 2009 was insignificant. Directors Stock Units (PPL) Under the Directors Deferred Compensation Plan, a mandatory amount of the cash retainers of the members of the Board of Directors who are not employees of PPL is deferred into stock units. Such deferred stock units represent the number of shares of PPL's common stock to which the board members are entitled after they cease serving as a member of the Board of Directors. Board members are entitled to defer any or all of their fees and cash retainers that are not part of the mandatory deferral into stock units. The stock unit accounts of each board member are increased based on dividends paid or other distributions on PPL's common stock. There were 406,584 such stock units outstanding at December 31, 2009, which were accounted for as liabilities with changes in fair value recognized currently in earnings based on PPL's common stock price at the end of each reporting period. Compensation Costs (Credits) 2009 2008 2007
PPL (a) $ 2 $ (4) $ 5 (a) Net of income tax benefit (expense) of $1 million, $(2) million and $2
million. Awards paid during 2009, 2008 and 2007 were insignificant. Stock Appreciation Rights (PPL and PPL Energy Supply) WPD uses stock appreciation rights to compensate senior management employees. Stock appreciation rights are granted with a reference price to PPL's common stock at the date of
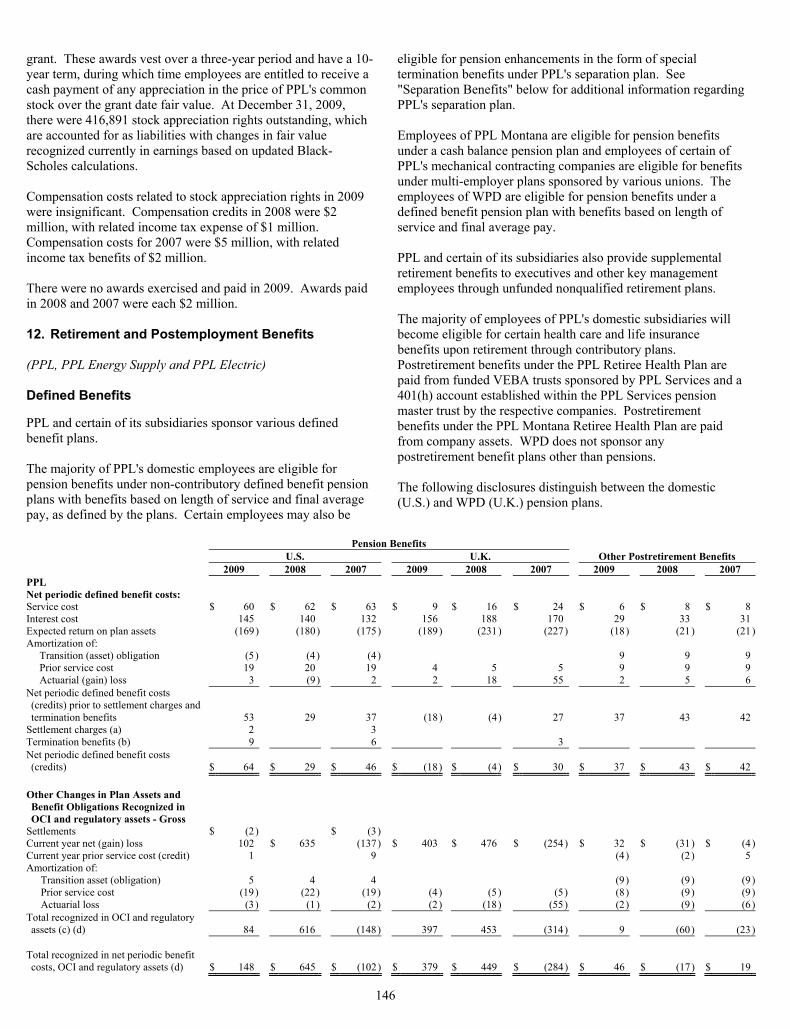
146
grant. These awards vest over a three-year period and have a 10-year term, during which time employees are entitled to receive a cash payment of any appreciation in the price of PPL's common stock over the grant date fair value. At December 31, 2009, there were 416,891 stock appreciation rights outstanding, which are accounted for as liabilities with changes in fair value recognized currently in earnings based on updated Black-Scholes calculations. Compensation costs related to stock appreciation rights in 2009 were insignificant. Compensation credits in 2008 were $2 million, with related income tax expense of $1 million. Compensation costs for 2007 were $5 million, with related income tax benefits of $2 million. There were no awards exercised and paid in 2009. Awards paid in 2008 and 2007 were each $2 million. 12. Retirement and Postemployment Benefits (PPL, PPL Energy Supply and PPL Electric) Defined Benefits PPL and certain of its subsidiaries sponsor various defined benefit plans. The majority of PPL's domestic employees are eligible for pension benefits under non-contributory defined benefit pension plans with benefits based on length of service and final average pay, as defined by the plans. Certain employees may also be
eligible for pension enhancements in the form of special termination benefits under PPL's separation plan. See "Separation Benefits" below for additional information regarding PPL's separation plan. Employees of PPL Montana are eligible for pension benefits under a cash balance pension plan and employees of certain of PPL's mechanical contracting companies are eligible for benefits under multi-employer plans sponsored by various unions. The employees of WPD are eligible for pension benefits under a defined benefit pension plan with benefits based on length of service and final average pay. PPL and certain of its subsidiaries also provide supplemental retirement benefits to executives and other key management employees through unfunded nonqualified retirement plans. The majority of employees of PPL's domestic subsidiaries will become eligible for certain health care and life insurance benefits upon retirement through contributory plans. Postretirement benefits under the PPL Retiree Health Plan are paid from funded VEBA trusts sponsored by PPL Services and a 401(h) account established within the PPL Services pension master trust by the respective companies. Postretirement benefits under the PPL Montana Retiree Health Plan are paid from company assets. WPD does not sponsor any postretirement benefit plans other than pensions. The following disclosures distinguish between the domestic (U.S.) and WPD (U.K.) pension plans.
Pension Benefits
U.S. U.K. Other Postretirement Benefits 2009 2008 2007 2009 2008 2007 2009 2008 2007 PPL Net periodic defined benefit costs: Service cost $ 60 $ 62 $ 63 $ 9 $ 16 $ 24 $ 6 $ 8 $ 8Interest cost 145 140 132 156 188 170 29 33 31Expected return on plan assets (169 ) (180) (175) (189) (231) (227 ) (18 ) (21) (21)Amortization of:
Transition (asset) obligation (5 ) (4) (4) 9 9 9Prior service cost 19 20 19 4 5 5 9 9 9Actuarial (gain) loss 3 (9) 2 2 18 55 2 5 6
Net periodic defined benefit costs (credits) prior to settlement charges and termination benefits 53 29 37 (18) (4) 27 37 43 42
Settlement charges (a) 2 3 Termination benefits (b) 9 6 3 Net periodic defined benefit costs (credits) $ 64 $ 29 $ 46 $ (18) $ (4) $ 30 $ 37 $ 43 $ 42
Other Changes in Plan Assets and Benefit Obligations Recognized in OCI and regulatory assets - Gross
Settlements $ (2 ) $ (3) Current year net (gain) loss 102 $ 635 (137) $ 403 $ 476 $ (254 ) $ 32 $ (31) $ (4)Current year prior service cost (credit) 1 9 (4 ) (2) 5Amortization of:
Transition asset (obligation) 5 4 4 (9 ) (9) (9)Prior service cost (19 ) (22) (19) (4) (5) (5 ) (8 ) (9) (9)Actuarial loss (3 ) (1) (2) (2) (18) (55 ) (2 ) (9) (6)
Total recognized in OCI and regulatory assets (c) (d) 84 616 (148) 397 453 (314 ) 9 (60) (23)
Total recognized in net periodic benefit costs, OCI and regulatory assets (d) $ 148 $ 645 $ (102) $ 379 $ 449 $ (284 ) $ 46 $ (17) $ 19
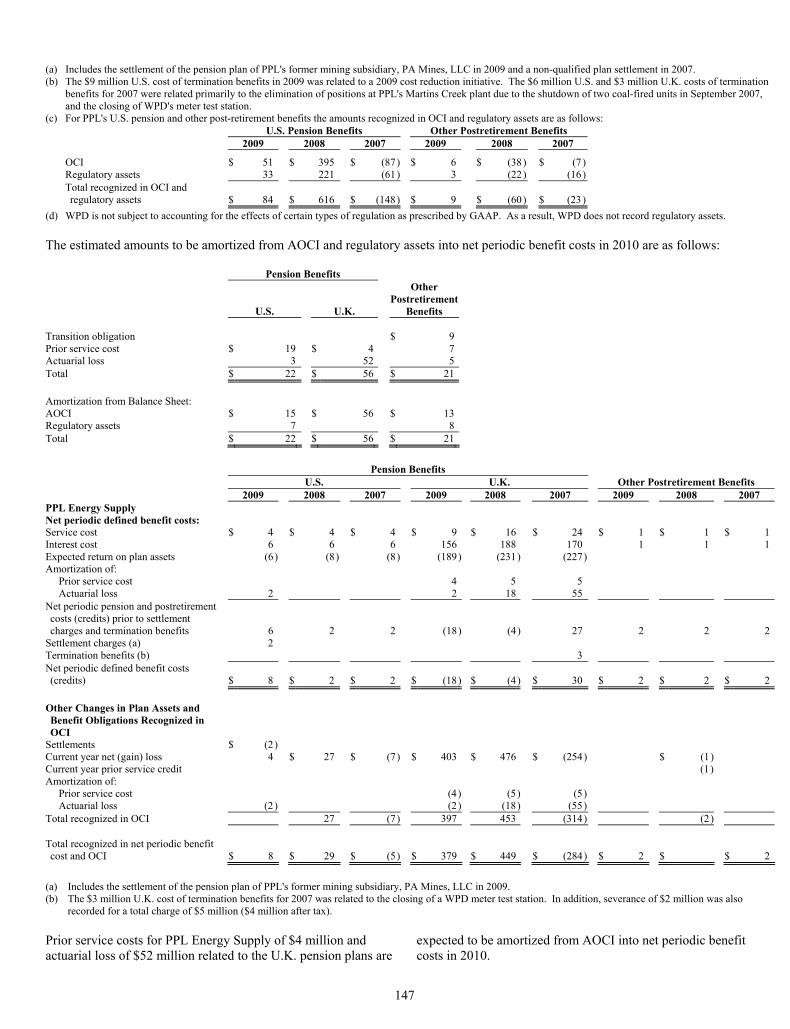
147
(a) Includes the settlement of the pension plan of PPL's former mining subsidiary, PA Mines, LLC in 2009 and a non-qualified plan settlement in 2007. (b) The $9 million U.S. cost of termination benefits in 2009 was related to a 2009 cost reduction initiative. The $6 million U.S. and $3 million U.K. costs of termination
benefits for 2007 were related primarily to the elimination of positions at PPL's Martins Creek plant due to the shutdown of two coal-fired units in September 2007, and the closing of WPD's meter test station.
(c) For PPL's U.S. pension and other post-retirement benefits the amounts recognized in OCI and regulatory assets are as follows: U.S. Pension Benefits Other Postretirement Benefits 2009 2008 2007 2009 2008 2007
OCI $ 51 $ 395 $ (87) $ 6 $ (38) $ (7 ) Regulatory assets 33 221 (61) 3 (22) (16 ) Total recognized in OCI and
regulatory assets $ 84 $ 616 $ (148) $ 9 $ (60) $ (23 ) (d) WPD is not subject to accounting for the effects of certain types of regulation as prescribed by GAAP. As a result, WPD does not record regulatory assets. The estimated amounts to be amortized from AOCI and regulatory assets into net periodic benefit costs in 2010 are as follows:
Pension Benefits
U.S. U.K.
Other Postretirement
Benefits Transition obligation $ 9Prior service cost $ 19 $ 4 7Actuarial loss 3 52 5Total $ 22 $ 56 $ 21 Amortization from Balance Sheet: AOCI $ 15 $ 56 $ 13Regulatory assets 7 8Total $ 22 $ 56 $ 21
Pension Benefits
U.S. U.K. Other Postretirement Benefits 2009 2008 2007 2009 2008 2007 2009 2008 2007 PPL Energy Supply Net periodic defined benefit costs: Service cost $ 4 $ 4 $ 4 $ 9 $ 16 $ 24 $ 1 $ 1 $ 1Interest cost 6 6 6 156 188 170 1 1 1Expected return on plan assets (6 ) (8) (8) (189) (231) (227 ) Amortization of:
Prior service cost 4 5 5 Actuarial loss 2 2 18 55
Net periodic pension and postretirement costs (credits) prior to settlement charges and termination benefits 6 2 2 (18) (4) 27 2 2 2
Settlement charges (a) 2 Termination benefits (b) 3 Net periodic defined benefit costs (credits) $ 8 $ 2 $ 2 $ (18) $ (4) $ 30 $ 2 $ 2 $ 2
Other Changes in Plan Assets and Benefit Obligations Recognized in OCI
Settlements $ (2 ) Current year net (gain) loss 4 $ 27 $ (7) $ 403 $ 476 $ (254 ) $ (1) Current year prior service credit (1) Amortization of:
Prior service cost (4) (5) (5 ) Actuarial loss (2 ) (2) (18) (55 )
Total recognized in OCI 27 (7) 397 453 (314 ) (2) Total recognized in net periodic benefit cost and OCI $ 8 $ 29 $ (5) $ 379 $ 449 $ (284 ) $ 2 $ $ 2
(a) Includes the settlement of the pension plan of PPL's former mining subsidiary, PA Mines, LLC in 2009. (b) The $3 million U.K. cost of termination benefits for 2007 was related to the closing of a WPD meter test station. In addition, severance of $2 million was also
recorded for a total charge of $5 million ($4 million after tax). Prior service costs for PPL Energy Supply of $4 million and actuarial loss of $52 million related to the U.K. pension plans are
expected to be amortized from AOCI into net periodic benefit costs in 2010.
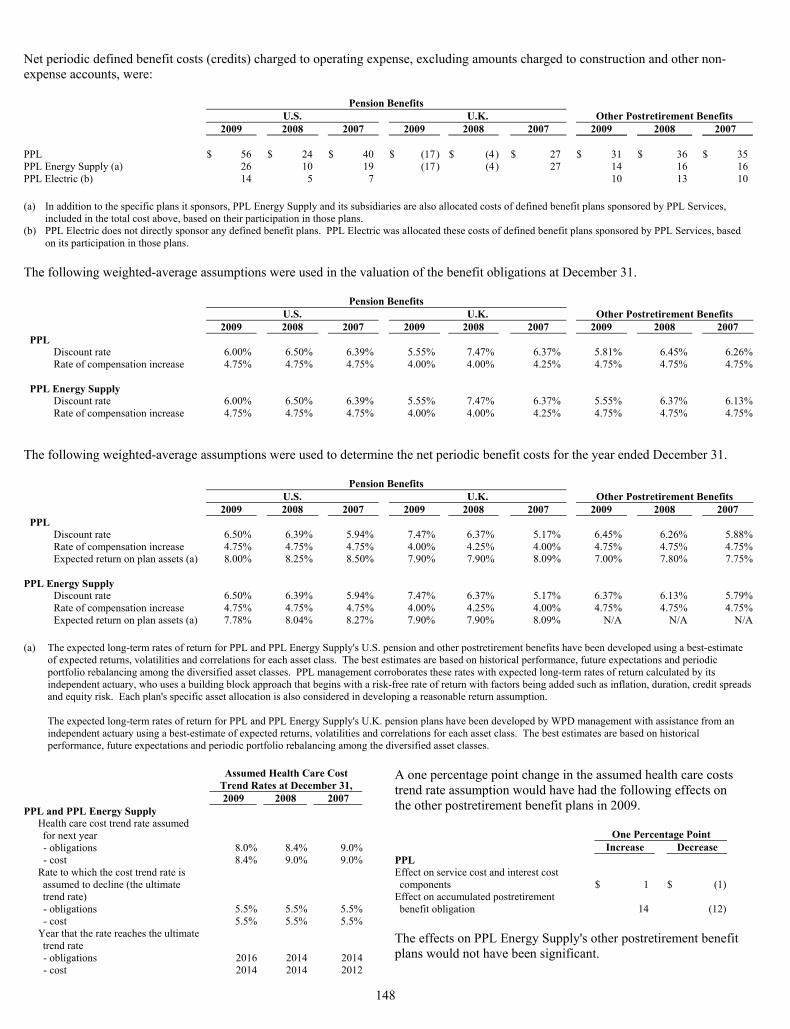
148
Net periodic defined benefit costs (credits) charged to operating expense, excluding amounts charged to construction and other non-expense accounts, were: Pension Benefits U.S. U.K. Other Postretirement Benefits 2009 2008 2007 2009 2008 2007 2009 2008 2007 PPL $ 56 $ 24 $ 40 $ (17) $ (4) $ 27 $ 31 $ 36 $ 35PPL Energy Supply (a) 26 10 19 (17) (4) 27 14 16 16PPL Electric (b) 14 5 7 10 13 10 (a) In addition to the specific plans it sponsors, PPL Energy Supply and its subsidiaries are also allocated costs of defined benefit plans sponsored by PPL Services,
included in the total cost above, based on their participation in those plans. (b) PPL Electric does not directly sponsor any defined benefit plans. PPL Electric was allocated these costs of defined benefit plans sponsored by PPL Services, based
on its participation in those plans. The following weighted-average assumptions were used in the valuation of the benefit obligations at December 31.
Pension Benefits U.S. U.K. Other Postretirement Benefits 2009 2008 2007 2009 2008 2007 2009 2008 2007
PPL Discount rate 6.00% 6.50% 6.39% 5.55% 7.47% 6.37% 5.81% 6.45% 6.26%Rate of compensation increase 4.75% 4.75% 4.75% 4.00% 4.00% 4.25% 4.75% 4.75% 4.75%
PPL Energy Supply Discount rate 6.00% 6.50% 6.39% 5.55% 7.47% 6.37% 5.55% 6.37% 6.13%Rate of compensation increase 4.75% 4.75% 4.75% 4.00% 4.00% 4.25% 4.75% 4.75% 4.75%
The following weighted-average assumptions were used to determine the net periodic benefit costs for the year ended December 31.
Pension Benefits U.S. U.K. Other Postretirement Benefits 2009 2008 2007 2009 2008 2007 2009 2008 2007
PPL Discount rate 6.50% 6.39% 5.94% 7.47% 6.37% 5.17% 6.45% 6.26% 5.88%Rate of compensation increase 4.75% 4.75% 4.75% 4.00% 4.25% 4.00% 4.75% 4.75% 4.75%Expected return on plan assets (a) 8.00% 8.25% 8.50% 7.90% 7.90% 8.09% 7.00% 7.80% 7.75%
PPL Energy Supply Discount rate 6.50% 6.39% 5.94% 7.47% 6.37% 5.17% 6.37% 6.13% 5.79%Rate of compensation increase 4.75% 4.75% 4.75% 4.00% 4.25% 4.00% 4.75% 4.75% 4.75%Expected return on plan assets (a) 7.78% 8.04% 8.27% 7.90% 7.90% 8.09% N/A N/A N/A
(a) The expected long-term rates of return for PPL and PPL Energy Supply's U.S. pension and other postretirement benefits have been developed using a best-estimate
of expected returns, volatilities and correlations for each asset class. The best estimates are based on historical performance, future expectations and periodic portfolio rebalancing among the diversified asset classes. PPL management corroborates these rates with expected long-term rates of return calculated by its independent actuary, who uses a building block approach that begins with a risk-free rate of return with factors being added such as inflation, duration, credit spreads and equity risk. Each plan's specific asset allocation is also considered in developing a reasonable return assumption. The expected long-term rates of return for PPL and PPL Energy Supply's U.K. pension plans have been developed by WPD management with assistance from an independent actuary using a best-estimate of expected returns, volatilities and correlations for each asset class. The best estimates are based on historical performance, future expectations and periodic portfolio rebalancing among the diversified asset classes.
Assumed Health Care Cost
Trend Rates at December 31, 2009 2008 2007 PPL and PPL Energy Supply
Health care cost trend rate assumed for next year
- obligations 8.0% 8.4% 9.0% - cost 8.4% 9.0% 9.0%Rate to which the cost trend rate is assumed to decline (the ultimate trend rate)
- obligations 5.5% 5.5% 5.5% - cost 5.5% 5.5% 5.5%Year that the rate reaches the ultimate trend rate
- obligations 2016 2014 2014 - cost 2014 2014 2012
A one percentage point change in the assumed health care costs trend rate assumption would have had the following effects on the other postretirement benefit plans in 2009.
One Percentage Point Increase Decrease
PPL Effect on service cost and interest cost components $ 1 $ (1)
Effect on accumulated postretirement benefit obligation
14 (12)
The effects on PPL Energy Supply's other postretirement benefit plans would not have been significant.
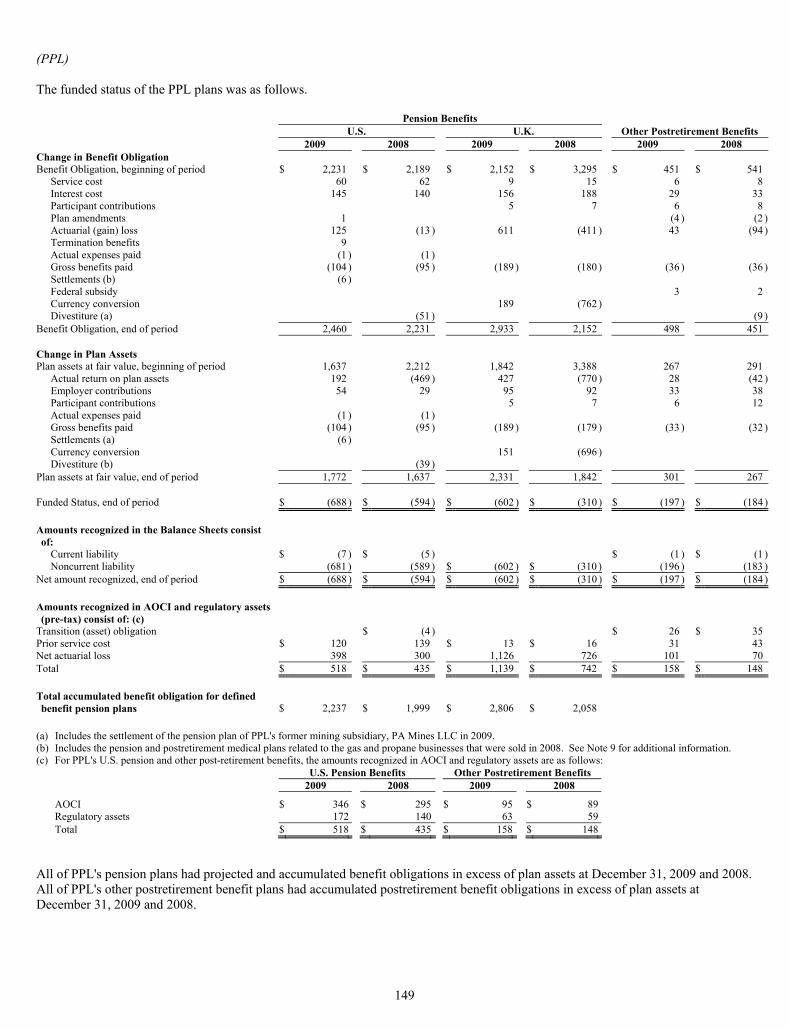
149
(PPL) The funded status of the PPL plans was as follows. Pension Benefits U.S. U.K. Other Postretirement Benefits 2009 2008 2009 2008 2009 2008 Change in Benefit Obligation Benefit Obligation, beginning of period $ 2,231 $ 2,189 $ 2,152 $ 3,295 $ 451 $ 541
Service cost 60 62 9 15 6 8Interest cost 145 140 156 188 29 33Participant contributions 5 7 6 8Plan amendments 1 (4 ) (2 )Actuarial (gain) loss 125 (13 ) 611 (411 ) 43 (94 )Termination benefits 9 Actual expenses paid (1 ) (1 ) Gross benefits paid (104 ) (95 ) (189 ) (180 ) (36 ) (36 )Settlements (b) (6 ) Federal subsidy 3 2Currency conversion 189 (762 ) Divestiture (a) (51 ) (9 )
Benefit Obligation, end of period 2,460 2,231 2,933 2,152 498 451 Change in Plan Assets Plan assets at fair value, beginning of period 1,637 2,212 1,842 3,388 267 291
Actual return on plan assets 192 (469 ) 427 (770 ) 28 (42 )Employer contributions 54 29 95 92 33 38Participant contributions 5 7 6 12Actual expenses paid (1 ) (1 ) Gross benefits paid (104 ) (95 ) (189 ) (179 ) (33 ) (32 )Settlements (a) (6 ) Currency conversion 151 (696 ) Divestiture (b) (39 )
Plan assets at fair value, end of period 1,772 1,637 2,331 1,842 301 267 Funded Status, end of period $ (688 ) $ (594 ) $ (602 ) $ (310 ) $ (197 ) $ (184 ) Amounts recognized in the Balance Sheets consist of:
Current liability $ (7 ) $ (5 ) $ (1 ) $ (1 )Noncurrent liability (681 ) (589 ) $ (602 ) $ (310 ) (196 ) (183 )
Net amount recognized, end of period $ (688 ) $ (594 ) $ (602 ) $ (310 ) $ (197 ) $ (184 ) Amounts recognized in AOCI and regulatory assets (pre-tax) consist of: (c)
Transition (asset) obligation $ (4 ) $ 26 $ 35Prior service cost $ 120 139 $ 13 $ 16 31 43Net actuarial loss 398 300 1,126 726 101 70Total $ 518 $ 435 $ 1,139 $ 742 $ 158 $ 148 Total accumulated benefit obligation for defined benefit pension plans $ 2,237 $ 1,999 $ 2,806 $ 2,058
(a) Includes the settlement of the pension plan of PPL's former mining subsidiary, PA Mines LLC in 2009. (b) Includes the pension and postretirement medical plans related to the gas and propane businesses that were sold in 2008. See Note 9 for additional information. (c) For PPL's U.S. pension and other post-retirement benefits, the amounts recognized in AOCI and regulatory assets are as follows: U.S. Pension Benefits Other Postretirement Benefits 2009 2008 2009 2008
AOCI $ 346 $ 295 $ 95 $ 89 Regulatory assets 172 140 63 59 Total $ 518 $ 435 $ 158 $ 148
All of PPL's pension plans had projected and accumulated benefit obligations in excess of plan assets at December 31, 2009 and 2008. All of PPL's other postretirement benefit plans had accumulated postretirement benefit obligations in excess of plan assets at December 31, 2009 and 2008.
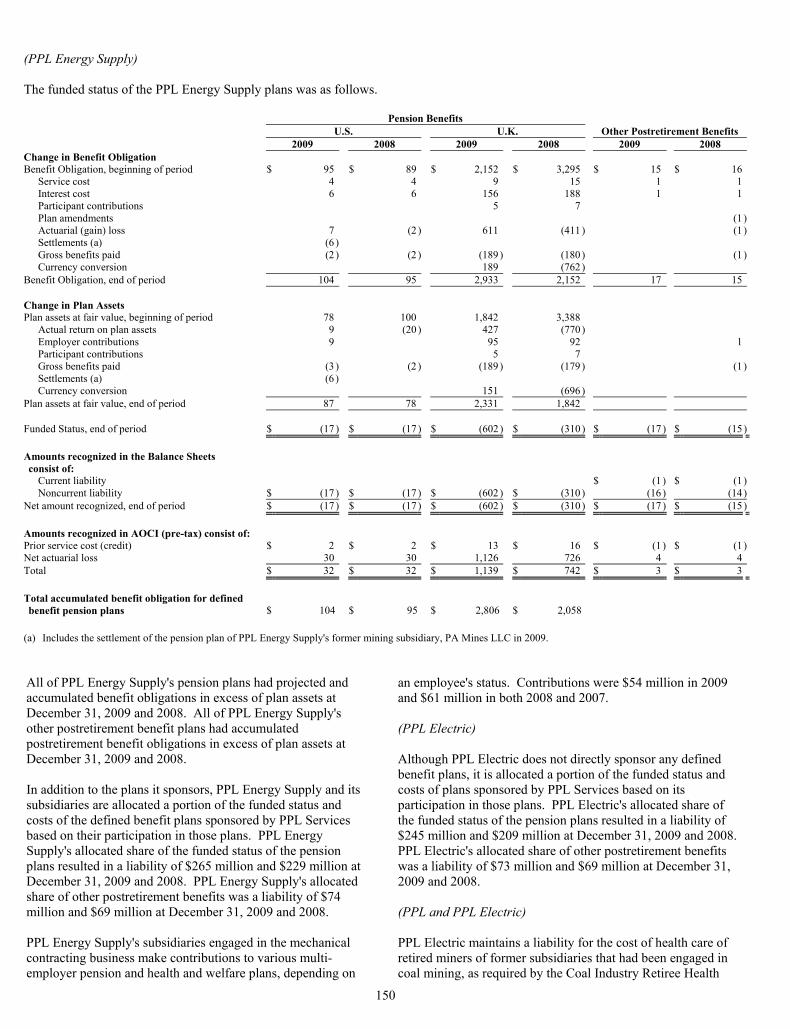
150
(PPL Energy Supply) The funded status of the PPL Energy Supply plans was as follows. Pension Benefits U.S. U.K. Other Postretirement Benefits 2009 2008 2009 2008 2009 2008 Change in Benefit Obligation Benefit Obligation, beginning of period $ 95 $ 89 $ 2,152 $ 3,295 $ 15 $ 16
Service cost 4 4 9 15 1 1Interest cost 6 6 156 188 1 1Participant contributions 5 7 Plan amendments (1 )Actuarial (gain) loss 7 (2 ) 611 (411 ) (1 )Settlements (a) (6 ) Gross benefits paid (2 ) (2 ) (189 ) (180 ) (1 )Currency conversion 189 (762 )
Benefit Obligation, end of period 104 95 2,933 2,152 17 15 Change in Plan Assets Plan assets at fair value, beginning of period 78 100 1,842 3,388
Actual return on plan assets 9 (20 ) 427 (770 ) Employer contributions 9 95 92 1Participant contributions 5 7 Gross benefits paid (3 ) (2 ) (189 ) (179 ) (1 )Settlements (a) (6 ) Currency conversion 151 (696 )
Plan assets at fair value, end of period 87 78 2,331 1,842 Funded Status, end of period $ (17 ) $ (17 ) $ (602 ) $ (310 ) $ (17 ) $ (15) Amounts recognized in the Balance Sheets consist of:
Current liability $ (1 ) $ (1 )Noncurrent liability $ (17 ) $ (17 ) $ (602 ) $ (310 ) (16 ) (14)
Net amount recognized, end of period $ (17 ) $ (17 ) $ (602 ) $ (310 ) $ (17 ) $ (15) Amounts recognized in AOCI (pre-tax) consist of: Prior service cost (credit) $ 2 $ 2 $ 13 $ 16 $ (1 ) $ (1 )Net actuarial loss 30 30 1,126 726 4 4Total $ 32 $ 32 $ 1,139 $ 742 $ 3 $ 3 Total accumulated benefit obligation for defined benefit pension plans $ 104 $ 95 $ 2,806 $ 2,058
(a) Includes the settlement of the pension plan of PPL Energy Supply's former mining subsidiary, PA Mines LLC in 2009. All of PPL Energy Supply's pension plans had projected and accumulated benefit obligations in excess of plan assets at December 31, 2009 and 2008. All of PPL Energy Supply's other postretirement benefit plans had accumulated postretirement benefit obligations in excess of plan assets at December 31, 2009 and 2008. In addition to the plans it sponsors, PPL Energy Supply and its subsidiaries are allocated a portion of the funded status and costs of the defined benefit plans sponsored by PPL Services based on their participation in those plans. PPL Energy Supply's allocated share of the funded status of the pension plans resulted in a liability of $265 million and $229 million at December 31, 2009 and 2008. PPL Energy Supply's allocated share of other postretirement benefits was a liability of $74 million and $69 million at December 31, 2009 and 2008. PPL Energy Supply's subsidiaries engaged in the mechanical contracting business make contributions to various multi-employer pension and health and welfare plans, depending on
an employee's status. Contributions were $54 million in 2009 and $61 million in both 2008 and 2007. (PPL Electric) Although PPL Electric does not directly sponsor any defined benefit plans, it is allocated a portion of the funded status and costs of plans sponsored by PPL Services based on its participation in those plans. PPL Electric's allocated share of the funded status of the pension plans resulted in a liability of $245 million and $209 million at December 31, 2009 and 2008. PPL Electric's allocated share of other postretirement benefits was a liability of $73 million and $69 million at December 31, 2009 and 2008. (PPL and PPL Electric) PPL Electric maintains a liability for the cost of health care of retired miners of former subsidiaries that had been engaged in coal mining, as required by the Coal Industry Retiree Health
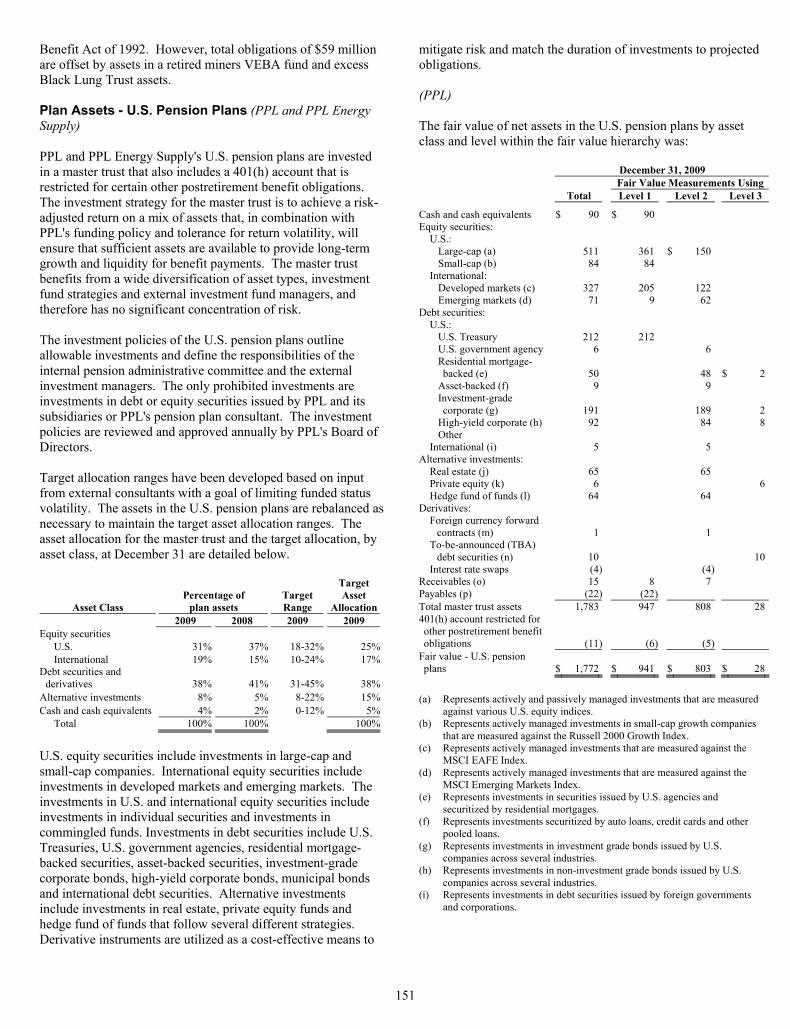
151
Benefit Act of 1992. However, total obligations of $59 million are offset by assets in a retired miners VEBA fund and excess Black Lung Trust assets. Plan Assets - U.S. Pension Plans (PPL and PPL Energy Supply) PPL and PPL Energy Supply's U.S. pension plans are invested in a master trust that also includes a 401(h) account that is restricted for certain other postretirement benefit obligations. The investment strategy for the master trust is to achieve a risk-adjusted return on a mix of assets that, in combination with PPL's funding policy and tolerance for return volatility, will ensure that sufficient assets are available to provide long-term growth and liquidity for benefit payments. The master trust benefits from a wide diversification of asset types, investment fund strategies and external investment fund managers, and therefore has no significant concentration of risk. The investment policies of the U.S. pension plans outline allowable investments and define the responsibilities of the internal pension administrative committee and the external investment managers. The only prohibited investments are investments in debt or equity securities issued by PPL and its subsidiaries or PPL's pension plan consultant. The investment policies are reviewed and approved annually by PPL's Board of Directors. Target allocation ranges have been developed based on input from external consultants with a goal of limiting funded status volatility. The assets in the U.S. pension plans are rebalanced as necessary to maintain the target asset allocation ranges. The asset allocation for the master trust and the target allocation, by asset class, at December 31 are detailed below.
Asset Class Percentage of
plan assets Target Range
Target Asset
Allocation 2009 2008 2009 2009
Equity securities U.S. 31% 37% 18-32% 25%International 19% 15% 10-24% 17%
Debt securities and derivatives 38% 41% 31-45% 38%
Alternative investments 8% 5% 8-22% 15%Cash and cash equivalents 4% 2% 0-12% 5%
Total 100% 100% 100%
U.S. equity securities include investments in large-cap and small-cap companies. International equity securities include investments in developed markets and emerging markets. The investments in U.S. and international equity securities include investments in individual securities and investments in commingled funds. Investments in debt securities include U.S. Treasuries, U.S. government agencies, residential mortgage-backed securities, asset-backed securities, investment-grade corporate bonds, high-yield corporate bonds, municipal bonds and international debt securities. Alternative investments include investments in real estate, private equity funds and hedge fund of funds that follow several different strategies. Derivative instruments are utilized as a cost-effective means to
mitigate risk and match the duration of investments to projected obligations. (PPL) The fair value of net assets in the U.S. pension plans by asset class and level within the fair value hierarchy was: December 31, 2009 Fair Value Measurements Using Total Level 1 Level 2 Level 3
Cash and cash equivalents $ 90 $ 90 Equity securities:
U.S.: Large-cap (a) 511 361 $ 150 Small-cap (b) 84 84
International: Developed markets (c) 327 205 122 Emerging markets (d) 71 9 62
Debt securities: U.S.:
U.S. Treasury 212 212 U.S. government agency 6 6 Residential mortgage-backed (e) 50 48 $ 2
Asset-backed (f) 9 9 Investment-grade corporate (g) 191 189 2
High-yield corporate (h) 92 84 8Other
International (i) 5 5 Alternative investments:
Real estate (j) 65 65 Private equity (k) 6 6Hedge fund of funds (l) 64 64
Derivatives: Foreign currency forward
contracts (m) 1 1 To-be-announced (TBA)
debt securities (n) 10 10Interest rate swaps (4) (4)
Receivables (o) 15 8 7 Payables (p) (22) (22) Total master trust assets 1,783 947 808 28401(h) account restricted for other postretirement benefit obligations (11) (6) (5)
Fair value - U.S. pension plans $ 1,772 $ 941 $ 803 $ 28
(a)
Represents actively and passively managed investments that are measured against various U.S. equity indices.
(b)
Represents actively managed investments in small-cap growth companies that are measured against the Russell 2000 Growth Index.
(c)
Represents actively managed investments that are measured against the MSCI EAFE Index.
(d)
Represents actively managed investments that are measured against the MSCI Emerging Markets Index.
(e)
Represents investments in securities issued by U.S. agencies and securitized by residential mortgages.
(f)
Represents investments securitized by auto loans, credit cards and other pooled loans.
(g)
Represents investments in investment grade bonds issued by U.S. companies across several industries.
(h)
Represents investments in non-investment grade bonds issued by U.S. companies across several industries.
(i)
Represents investments in debt securities issued by foreign governments and corporations.
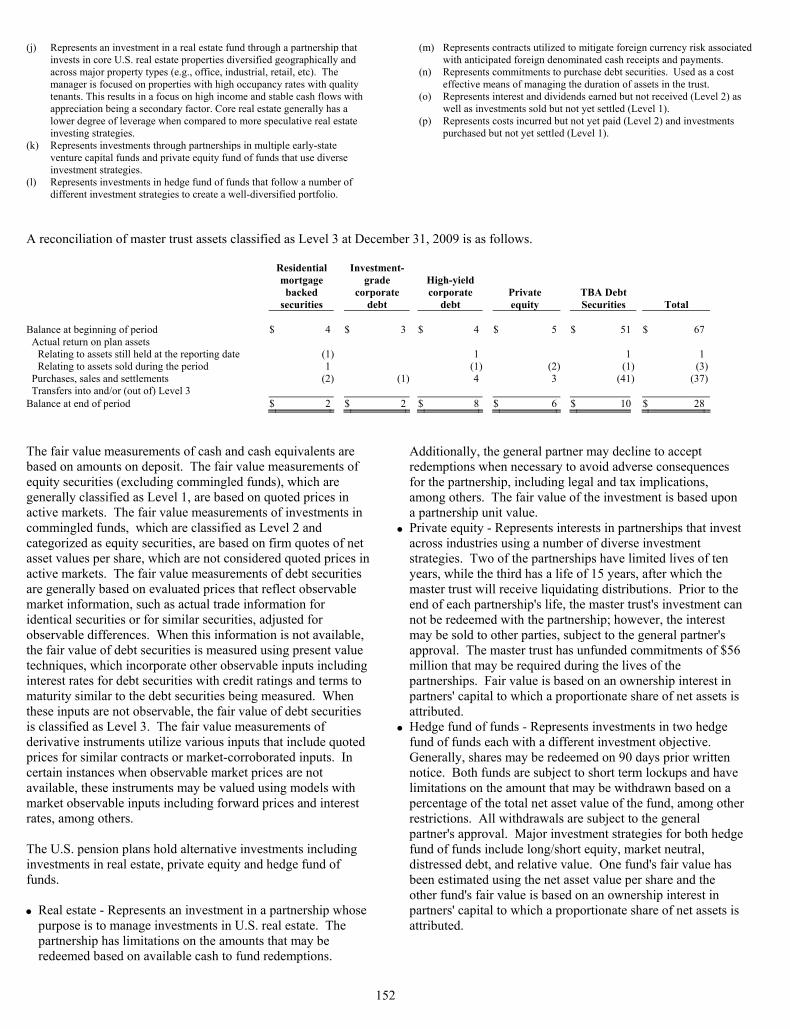
152
(j)
Represents an investment in a real estate fund through a partnership that invests in core U.S. real estate properties diversified geographically and across major property types (e.g., office, industrial, retail, etc). The manager is focused on properties with high occupancy rates with quality tenants. This results in a focus on high income and stable cash flows with appreciation being a secondary factor. Core real estate generally has a lower degree of leverage when compared to more speculative real estate investing strategies.
(k)
Represents investments through partnerships in multiple early-state venture capital funds and private equity fund of funds that use diverse investment strategies.
(l)
Represents investments in hedge fund of funds that follow a number of different investment strategies to create a well-diversified portfolio.
(m)
Represents contracts utilized to mitigate foreign currency risk associated with anticipated foreign denominated cash receipts and payments.
(n)
Represents commitments to purchase debt securities. Used as a cost effective means of managing the duration of assets in the trust.
(o)
Represents interest and dividends earned but not received (Level 2) as well as investments sold but not yet settled (Level 1).
(p)
Represents costs incurred but not yet paid (Level 2) and investments purchased but not yet settled (Level 1).
A reconciliation of master trust assets classified as Level 3 at December 31, 2009 is as follows.
Residential mortgage
backed securities
Investment-grade
corporate debt
High-yield corporate
debt Private equity
TBA Debt Securities Total
Balance at beginning of period $ 4 $ 3 $ 4 $ 5 $ 51 $ 67
Actual return on plan assets Relating to assets still held at the reporting date (1) 1 1 1 Relating to assets sold during the period 1 (1) (2) (1) (3)
Purchases, sales and settlements (2) (1) 4 3 (41) (37)Transfers into and/or (out of) Level 3
Balance at end of period $ 2 $ 2 $ 8 $ 6 $ 10 $ 28
The fair value measurements of cash and cash equivalents are based on amounts on deposit. The fair value measurements of equity securities (excluding commingled funds), which are generally classified as Level 1, are based on quoted prices in active markets. The fair value measurements of investments in commingled funds, which are classified as Level 2 and categorized as equity securities, are based on firm quotes of net asset values per share, which are not considered quoted prices in active markets. The fair value measurements of debt securities are generally based on evaluated prices that reflect observable market information, such as actual trade information for identical securities or for similar securities, adjusted for observable differences. When this information is not available, the fair value of debt securities is measured using present value techniques, which incorporate other observable inputs including interest rates for debt securities with credit ratings and terms to maturity similar to the debt securities being measured. When these inputs are not observable, the fair value of debt securities is classified as Level 3. The fair value measurements of derivative instruments utilize various inputs that include quoted prices for similar contracts or market-corroborated inputs. In certain instances when observable market prices are not available, these instruments may be valued using models with market observable inputs including forward prices and interest rates, among others. The U.S. pension plans hold alternative investments including investments in real estate, private equity and hedge fund of funds. • Real estate - Represents an investment in a partnership whose
purpose is to manage investments in U.S. real estate. The partnership has limitations on the amounts that may be redeemed based on available cash to fund redemptions.
Additionally, the general partner may decline to accept redemptions when necessary to avoid adverse consequences for the partnership, including legal and tax implications, among others. The fair value of the investment is based upon a partnership unit value.
• Private equity - Represents interests in partnerships that invest across industries using a number of diverse investment strategies. Two of the partnerships have limited lives of ten years, while the third has a life of 15 years, after which the master trust will receive liquidating distributions. Prior to the end of each partnership's life, the master trust's investment can not be redeemed with the partnership; however, the interest may be sold to other parties, subject to the general partner's approval. The master trust has unfunded commitments of $56 million that may be required during the lives of the partnerships. Fair value is based on an ownership interest in partners' capital to which a proportionate share of net assets is attributed.
• Hedge fund of funds - Represents investments in two hedge fund of funds each with a different investment objective. Generally, shares may be redeemed on 90 days prior written notice. Both funds are subject to short term lockups and have limitations on the amount that may be withdrawn based on a percentage of the total net asset value of the fund, among other restrictions. All withdrawals are subject to the general partner's approval. Major investment strategies for both hedge fund of funds include long/short equity, market neutral, distressed debt, and relative value. One fund's fair value has been estimated using the net asset value per share and the other fund's fair value is based on an ownership interest in partners' capital to which a proportionate share of net assets is attributed.
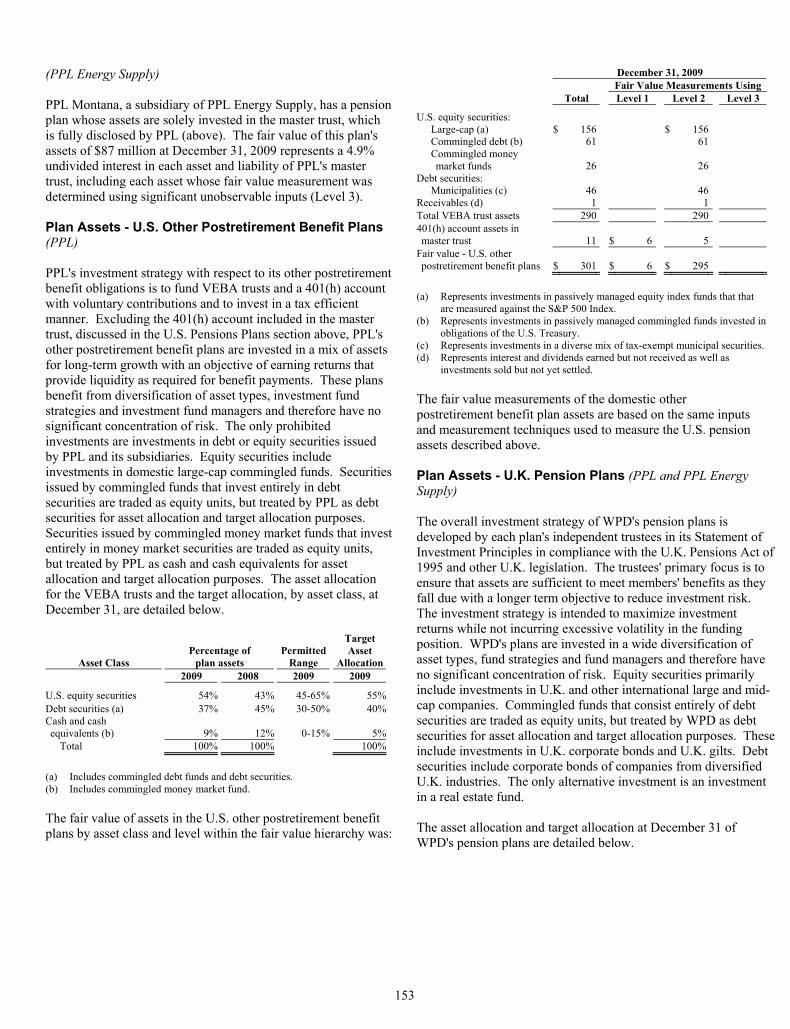
153
(PPL Energy Supply) PPL Montana, a subsidiary of PPL Energy Supply, has a pension plan whose assets are solely invested in the master trust, which is fully disclosed by PPL (above). The fair value of this plan's assets of $87 million at December 31, 2009 represents a 4.9% undivided interest in each asset and liability of PPL's master trust, including each asset whose fair value measurement was determined using significant unobservable inputs (Level 3). Plan Assets - U.S. Other Postretirement Benefit Plans (PPL) PPL's investment strategy with respect to its other postretirement benefit obligations is to fund VEBA trusts and a 401(h) account with voluntary contributions and to invest in a tax efficient manner. Excluding the 401(h) account included in the master trust, discussed in the U.S. Pensions Plans section above, PPL's other postretirement benefit plans are invested in a mix of assets for long-term growth with an objective of earning returns that provide liquidity as required for benefit payments. These plans benefit from diversification of asset types, investment fund strategies and investment fund managers and therefore have no significant concentration of risk. The only prohibited investments are investments in debt or equity securities issued by PPL and its subsidiaries. Equity securities include investments in domestic large-cap commingled funds. Securities issued by commingled funds that invest entirely in debt securities are traded as equity units, but treated by PPL as debt securities for asset allocation and target allocation purposes. Securities issued by commingled money market funds that invest entirely in money market securities are traded as equity units, but treated by PPL as cash and cash equivalents for asset allocation and target allocation purposes. The asset allocation for the VEBA trusts and the target allocation, by asset class, at December 31, are detailed below.
Asset Class Percentage of
plan assets Permitted
Range
Target Asset
Allocation 2009 2008 2009 2009
U.S. equity securities 54% 43% 45-65% 55%Debt securities (a) 37% 45% 30-50% 40%Cash and cash equivalents (b) 9% 12% 0-15% 5%
Total 100% 100% 100%
(a) Includes commingled debt funds and debt securities. (b) Includes commingled money market fund. The fair value of assets in the U.S. other postretirement benefit plans by asset class and level within the fair value hierarchy was:
December 31, 2009 Fair Value Measurements Using Total Level 1 Level 2 Level 3
U.S. equity securities: Large-cap (a) $ 156 $ 156 Commingled debt (b) 61 61 Commingled money market funds 26 26
Debt securities: Municipalities (c) 46 46
Receivables (d) 1 1 Total VEBA trust assets 290 290 401(h) account assets in master trust 11 $ 6 5
Fair value - U.S. other postretirement benefit plans $ 301 $ 6 $ 295
(a)
Represents investments in passively managed equity index funds that that are measured against the S&P 500 Index.
(b)
Represents investments in passively managed commingled funds invested in obligations of the U.S. Treasury.
(c) Represents investments in a diverse mix of tax-exempt municipal securities.(d)
Represents interest and dividends earned but not received as well as investments sold but not yet settled.
The fair value measurements of the domestic other postretirement benefit plan assets are based on the same inputs and measurement techniques used to measure the U.S. pension assets described above. Plan Assets - U.K. Pension Plans (PPL and PPL Energy Supply) The overall investment strategy of WPD's pension plans is developed by each plan's independent trustees in its Statement of Investment Principles in compliance with the U.K. Pensions Act of 1995 and other U.K. legislation. The trustees' primary focus is to ensure that assets are sufficient to meet members' benefits as they fall due with a longer term objective to reduce investment risk. The investment strategy is intended to maximize investment returns while not incurring excessive volatility in the funding position. WPD's plans are invested in a wide diversification of asset types, fund strategies and fund managers and therefore have no significant concentration of risk. Equity securities primarily include investments in U.K. and other international large and mid-cap companies. Commingled funds that consist entirely of debt securities are traded as equity units, but treated by WPD as debt securities for asset allocation and target allocation purposes. These include investments in U.K. corporate bonds and U.K. gilts. Debt securities include corporate bonds of companies from diversified U.K. industries. The only alternative investment is an investment in a real estate fund. The asset allocation and target allocation at December 31 of WPD's pension plans are detailed below.
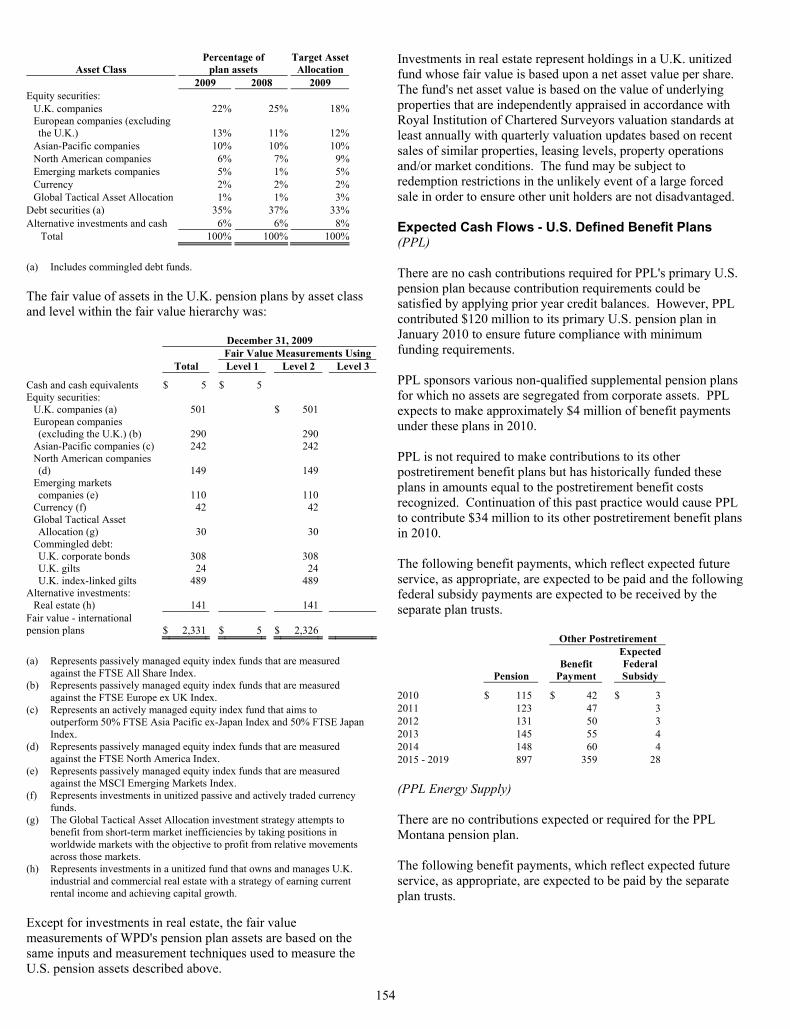
154
Asset Class Percentage of
plan assets Target Asset
Allocation 2009 2008 2009
Equity securities: U.K. companies 22% 25% 18%European companies (excluding the U.K.) 13% 11% 12%
Asian-Pacific companies 10% 10% 10%North American companies 6% 7% 9%Emerging markets companies 5% 1% 5%Currency 2% 2% 2%Global Tactical Asset Allocation 1% 1% 3%
Debt securities (a) 35% 37% 33%Alternative investments and cash 6% 6% 8%
Total 100% 100% 100%
(a) Includes commingled debt funds. The fair value of assets in the U.K. pension plans by asset class and level within the fair value hierarchy was: December 31, 2009 Fair Value Measurements Using Total Level 1 Level 2 Level 3
Cash and cash equivalents $ 5 $ 5 Equity securities:
U.K. companies (a) 501 $ 501 European companies (excluding the U.K.) (b) 290 290
Asian-Pacific companies (c) 242 242 North American companies (d) 149 149
Emerging markets companies (e) 110 110
Currency (f) 42 42 Global Tactical Asset Allocation (g) 30 30
Commingled debt: U.K. corporate bonds 308 308 U.K. gilts 24 24 U.K. index-linked gilts 489 489
Alternative investments: Real estate (h) 141 141
Fair value - international pension plans $ 2,331 $ 5 $ 2,326
(a)
Represents passively managed equity index funds that are measured against the FTSE All Share Index.
(b)
Represents passively managed equity index funds that are measured against the FTSE Europe ex UK Index.
(c)
Represents an actively managed equity index fund that aims to outperform 50% FTSE Asia Pacific ex-Japan Index and 50% FTSE Japan Index.
(d)
Represents passively managed equity index funds that are measured against the FTSE North America Index.
(e)
Represents passively managed equity index funds that are measured against the MSCI Emerging Markets Index.
(f)
Represents investments in unitized passive and actively traded currency funds.
(g)
The Global Tactical Asset Allocation investment strategy attempts to benefit from short-term market inefficiencies by taking positions in worldwide markets with the objective to profit from relative movements across those markets.
(h)
Represents investments in a unitized fund that owns and manages U.K. industrial and commercial real estate with a strategy of earning current rental income and achieving capital growth.
Except for investments in real estate, the fair value measurements of WPD's pension plan assets are based on the same inputs and measurement techniques used to measure the U.S. pension assets described above.
Investments in real estate represent holdings in a U.K. unitized fund whose fair value is based upon a net asset value per share. The fund's net asset value is based on the value of underlying properties that are independently appraised in accordance with Royal Institution of Chartered Surveyors valuation standards at least annually with quarterly valuation updates based on recent sales of similar properties, leasing levels, property operations and/or market conditions. The fund may be subject to redemption restrictions in the unlikely event of a large forced sale in order to ensure other unit holders are not disadvantaged. Expected Cash Flows - U.S. Defined Benefit Plans (PPL) There are no cash contributions required for PPL's primary U.S. pension plan because contribution requirements could be satisfied by applying prior year credit balances. However, PPL contributed $120 million to its primary U.S. pension plan in January 2010 to ensure future compliance with minimum funding requirements. PPL sponsors various non-qualified supplemental pension plans for which no assets are segregated from corporate assets. PPL expects to make approximately $4 million of benefit payments under these plans in 2010. PPL is not required to make contributions to its other postretirement benefit plans but has historically funded these plans in amounts equal to the postretirement benefit costs recognized. Continuation of this past practice would cause PPL to contribute $34 million to its other postretirement benefit plans in 2010. The following benefit payments, which reflect expected future service, as appropriate, are expected to be paid and the following federal subsidy payments are expected to be received by the separate plan trusts. Other Postretirement
Pension Benefit
Payment
Expected Federal Subsidy
2010 $ 115 $ 42 $ 32011 123 47 32012 131 50 32013 145 55 42014 148 60 42015 - 2019 897 359 28 (PPL Energy Supply) There are no contributions expected or required for the PPL Montana pension plan. The following benefit payments, which reflect expected future service, as appropriate, are expected to be paid by the separate plan trusts.
155
Pension Other
Postretirement
2010 $ 2 $ 1 2011 3 2 2012 4 2 2013 4 2 2014 5 2 2015 - 2019 36 13 Expected Cash Flows - U.K. Pension Plans (PPL and PPL Energy Supply) The pension plans of WPD are subject to formal actuarial valuations every three years, which are used to determine funding requirements. Future contributions were evaluated in accordance with the latest valuation performed as of March 31, 2007, in respect of WPD's principal pension scheme, to determine contribution requirements for 2009 and forward. WPD expects to make contributions of approximately $62 million in 2010. WPD is currently permitted to recover in rates approximately 65% of its deficit funding requirements for its primary pension plan. This recovery rate will increase to 76% effective April 1, 2010. The following benefit payments, which reflect expected future service, as appropriate, are expected to be paid by the separate plan trusts. Pension
2010 $ 161 2011 165 2012 170 2013 174 2014 179 2015 - 2019 974 (PPL, PPL Energy Supply and PPL Electric) Savings Plans Substantially all employees of PPL's domestic subsidiaries are eligible to participate in deferred savings plans (401(k)s). Employer contributions to the plans approximated the following.
2009 2008 2007
PPL $ 17 $ 17 $ 16 PPL Energy Supply 10 9 9 PPL Electric 4 4 4 Employee Stock Ownership Plan PPL sponsors a non-leveraged ESOP in which substantially all domestic employees, excluding those of PPL Montana and the mechanical contractors, are enrolled on the first day of the month following eligible employee status. Dividends paid on ESOP shares are treated as ordinary dividends by PPL. Under existing income tax laws, PPL is permitted to deduct the amount of those dividends for income tax purposes and to contribute the resulting tax savings (dividend-based contribution) to the ESOP. The dividend-based contribution is used to buy shares of PPL's common stock and is expressly conditioned upon the deductibility of the contribution for federal income tax purposes.
Contributions to the ESOP are allocated to eligible participants' accounts as of the end of each year, based 75% on shares held in existing participants' accounts and 25% on the eligible participants' compensation. Compensation expense for ESOP contributions was $8 million in 2009 and $7 million in 2008 and 2007. These amounts were offset by the dividend-based contribution tax savings and had no impact on PPL's earnings. ESOP shares outstanding at December 31, 2009, were 7,691,540 or 2% of total common shares outstanding, and are included in all EPS calculations. Postemployment Benefits Certain PPL subsidiaries provide health and life insurance benefits to disabled employees and income benefits to eligible spouses of deceased employees. Postemployment benefits charged to operating expenses were not significant for 2009, 2008 and 2007. Separation Benefits Certain PPL subsidiaries provide separation benefits to eligible employees. These benefits may be provided in the case of separations due to performance issues, loss of job related qualifications or organizational changes. Certain employees separated are eligible for cash severance payments, outplacement services, accelerated stock award vesting, continuation of group health and welfare coverage, and enhanced pension and postretirement medical benefits. The type and amount of benefits provided is based upon age, years of service and the nature of the separation. Separation benefits are recorded when such amounts are probable and estimable. In February 2009, PPL announced workforce reductions that resulted in the elimination of approximately 200 management and staff positions across PPL's domestic operations, or approximately 6% of PPL's non-union, domestic workforce. The charges noted below consisted primarily of enhanced pension and severance benefits under PPL's Pension Plan and Separation Policy and were recorded to "Other operation and maintenance" expense on the Statement of Income. As a result of the workforce reductions, PPL recorded a charge of $22 million ($13 million after tax) in 2009. PPL Energy Supply eliminated approximately 50 management and staff positions and recorded a charge of $13 million ($8 million after tax) in 2009. Included in this charge was $8 million ($4 million after tax) of allocated costs associated with the elimination of employees of PPL Services. PPL Electric eliminated approximately 50 management and staff positions and recorded a charge of $9 million ($5 million after tax) in 2009. Included in this charge was $3 million ($1 million after tax) of allocated costs associated with the elimination of employees of PPL Services. Separation benefits were not significant in 2008.
156
Separation benefits recorded in 2007 were related to the elimination of positions at PPL's Martins Creek plant due to the shutdown of two coal-fired units and the closing of WPD's meter test station. Total costs recorded were $13 million ($9 million after tax). These costs included $4 million of cash severance payments and enhanced pension benefits provided to domestic employees of $6 million and $3 million provided to WPD employees. See "Defined Benefits" above for more information. 13. Jointly Owned Facilities (PPL and PPL Energy Supply) At December 31, 2009 and 2008, subsidiaries of PPL and PPL Energy Supply owned interests in the facilities listed below. The Balance Sheets of PPL and PPL Energy Supply include the amounts noted in the following table.
Ownership
Interest Electric Plant
Other
Property
Accumulated Depreciation
Construction Work
in Progress December 31, 2009 PPL Generation Generating Stations
Susquehanna 90.00% $ 4,571 $ 3,475 $ 108Conemaugh 16.25% 206 99 9Keystone 12.34% 199 61 4
Merrill Creek Reservoir 8.37% $ 22 15
December 31, 2008 PPL Generation Generating Stations
Susquehanna 90.00% $ 4,513 $ 3,472 $ 111Conemaugh 16.25% 206 93 1Keystone 12.34% 105 58 64Wyman Unit 4 (a)
8.33% 15
7
Merrill Creek Reservoir 8.37% $ 22 14
(a)
See Note 9 for information regarding the December 2009 sale of this interest.
In addition to the interests mentioned above, PPL Montana had a 50% leasehold interest in Colstrip Units 1 and 2 and a 30% leasehold interest in Colstrip Unit 3 under operating leases. See Note 10 for additional information. At December 31, 2009 and 2008, NorthWestern owned a 30% leasehold interest in Colstrip Unit 4. PPL Montana and NorthWestern have a sharing agreement to govern each party's responsibilities regarding the operation of Colstrip Units 3 and 4, and each party is responsible for 15% of the respective operating and construction costs, regardless of whether a particular cost is specified to Colstrip Unit 3 or 4. Each PPL Generation subsidiary provides its own funding for its share of the facility. Each receives a portion of the total output of the generating stations equal to its percentage ownership. The share of fuel and other operating costs associated with the stations is included in the corresponding operating expenses on the Statements of Income.
14. Commitments and Contingencies Energy Purchases, Energy Sales and Other Commitments Energy Purchase Commitments (PPL and PPL Energy Supply) PPL and PPL Energy Supply enter into long-term purchase contracts to supply the fuel requirements for generation facilities. These contracts include commitments to purchase coal, emission allowances, limestone, natural gas, oil and nuclear fuel. These long-term contracts extend through 2019, excluding a limestone contract that extends through 2030. PPL and PPL Energy Supply also enter into long-term contracts for the storage and transportation of natural gas. The long-term natural gas storage contracts extend through 2015, and the long-term natural gas transportation contracts extend through 2032. Additionally, PPL and PPL Energy Supply have entered into long-term contracts to purchase power that extend through 2017, excluding long-term power purchase agreements for the full output of two wind farms that extend through 2027. As part of the purchase of generation assets from Montana Power, PPL Montana assumed a power purchase and power sales agreement, which expires at December 31, 2010. In accordance with purchase accounting guidelines, PPL Montana recorded a liability of $58 million as the fair value of the agreement at the acquisition date. The liability is being reduced over the term of the agreement as an adjustment to "Energy purchases" on the Statements of Income. At December 31, 2009, the $11 million unamortized balance of this liability was included in "Other current liabilities" on the Balance Sheet. At December 31, 2008, the unamortized balance of this liability was $24 million, of which $13 million was included in "Other current liabilities" and $11 million was included in "Other deferred credits and noncurrent liabilities" on the Balance Sheet. In 1998, PPL Electric recorded an $879 million loss accrual for above-market contracts with NUGs, due to deregulation of its generation business. Effective January 1999, PPL Electric began reducing this liability as an offset to "Energy purchases" on the Statements of Income. This reduction is based on the estimated timing of the purchases from the NUGs and projected market prices for this generation. The final NUG contract expires in 2014. In connection with PPL's corporate realignment in 2000, the remaining balance of this liability was transferred to PPL EnergyPlus. At December 31, 2009, the unamortized balance of this liability was $4 million, of which $1 million was included in "Other current liabilities" and $3 million was included in "Other deferred credits and noncurrent liabilities" on the Balance Sheet. At December 31, 2008, the unamortized balance of this liability was $29 million, of which $25 million was included in "Other current liabilities" and $4 million was included in "Other deferred credits and noncurrent liabilities" on the Balance Sheet. In 2008, PPL EnergyPlus acquired the rights to an existing long-term tolling agreement associated with the capacity and energy
157
of Ironwood. Under the agreement, PPL EnergyPlus has control over the plant's dispatch into the electricity grid and supplies the natural gas necessary to operate the plant. The tolling agreement extends through 2021. See Note 10 for additional information. (PPL and PPL Electric) From 2007 through October 2009, PPL Electric conducted six competitive solicitations to purchase electricity generation supply in 2010 for customers who do not choose an alternative supplier. Average generation supply prices (per MWh) for all six solicitations, including Pennsylvania gross receipts tax and an adjustment for line losses, were $99.48 for residential customers and $100.52 for small commercial and small industrial customers. In October 2009, PPL Electric purchased 2010 supply for fixed-price default service to large commercial and large industrial customers who elect to take that service. In November 2009, PPL Electric purchased supply to provide hourly default service to large commercial and industrial customers in 2010. In June 2009, the PUC approved PPL Electric's plan to purchase its PLR electricity supply for January 2011 through May 2013. In August and October 2009, PPL Electric conducted the first two of its 14 planned competitive solicitations. A third solicitation was conducted in January 2010. The solicitations include a mix of long-term and short-term purchases for customer supply, including contracts for load-following, spot, block and alternative energy credits. (PPL Energy Supply and PPL Electric) See Note 15 for information on the power supply agreements between PPL EnergyPlus and PPL Electric. Energy Sales Commitments (PPL and PPL Energy Supply) In connection with its marketing activities or hedging strategy for its power plants, PPL Energy Supply has entered into long-term power sales contracts that extend through 2023, excluding a long-term retail sales agreement for the full output from a solar generator that extends through 2034. All long-term contracts were executed at prices approximating market prices at the time of execution. (PPL Energy Supply and PPL Electric) See Note 15 for information on the power supply agreements between PPL EnergyPlus and PPL Electric. PPL Montana Hydroelectric License Commitments (PPL and PPL Energy Supply) PPL Montana owns and operates 11 hydroelectric facilities and one storage reservoir licensed by the FERC under long-term licenses pursuant to the Federal Power Act. Pursuant to Section 8(e) of the Federal Power Act, the FERC approved the transfer from Montana Power to PPL Montana of all pertinent licenses
and any amendments in connection with the Montana Asset Purchase Agreement. The Kerr Dam Project license (50-year term) was jointly issued by the FERC to Montana Power and the Confederated Salish and Kootenai Tribes of the Flathead Reservation in 1985, and requires Montana Power to hold and operate the project for 30 years (to 2015). The license requires Montana Power and PPL Montana, as successor to Montana Power, to continue to implement a plan to mitigate the impact of the Kerr Dam on fish, wildlife and their habitats. Under this arrangement, PPL Montana has a remaining commitment to spend $12 million between 2010 and 2015, in addition to the annual rent it pays to the tribes. Between 2015 and 2025, the tribes have the option to purchase, hold and operate the project for the remainder of the license term, which expires in 2035. PPL Montana entered into two Memoranda of Understanding (MOUs) with state, federal and private entities related to the issuance in 2000 of the FERC renewal license for the nine dams for the Missouri-Madison project. The MOUs are periodically updated and renewed and require PPL Montana to implement plans to mitigate the impact of its projects on fish, wildlife and their habitats, and to increase recreational opportunities. The MOUs were created to maximize collaboration between the parties and enhance the possibility to receive matching funds from relevant federal agencies. Under these arrangements, PPL Montana has a remaining commitment to spend $36 million between 2010 and 2040. Legal Matters (PPL, PPL Energy Supply and PPL Electric) PPL and its subsidiaries are involved in legal proceedings, claims and litigation in the ordinary course of business. PPL and its subsidiaries cannot predict the outcome of such matters, or whether such matters may result in material liabilities. (PPL and PPL Energy Supply) Montana Power Shareholders' Litigation In August 2001, a purported class-action lawsuit was filed by a group of Montana Power shareholders against Montana Power, the directors of Montana Power, certain advisors and consultants of Montana Power, and PPL Montana. The plaintiffs allege, among other things, that Montana Power failed to obtain shareholder approval for the sale of Montana Power's generation assets to PPL Montana in 1999, and that the sale was null and void. Among the remedies sought by the plaintiffs is the establishment of a "resulting and/or constructive trust" on both the generation assets and all profits earned by PPL Montana from the generation assets, plus interest on the amounts subject to the trust. This lawsuit is pending in the U.S. District Court of Montana, Butte Division. Settlement discussions resumed in June 2009. A proposed settlement of this lawsuit has been reached under which plaintiffs will receive approximately $115 million. Under the proposed settlement, PPL Montana is not required to pay any portion of this settlement amount. The proposed settlement was filed with the judge in November 2009
158
and is pending court approval. PPL and PPL Energy Supply cannot predict the outcome of this matter. Montana Hydroelectric Litigation In November 2004, PPL Montana, Avista Corporation (Avista) and PacifiCorp commenced an action for declaratory judgment in Montana First Judicial District Court seeking a determination that no lease payments or other compensation for their hydroelectric facilities' use and occupancy of streambeds in Montana can be collected by the State of Montana. This request was brought following the dismissal on jurisdictional grounds of the State of Montana's federal lawsuit seeking such payments or compensation in the U.S. District Court of Montana, Missoula Division. The State's federal lawsuit was founded on allegations that the beds of Montana's navigable rivers became state-owned trust property upon Montana's admission to statehood, and that the use of them for placement of dam structures, affiliated structures and reservoirs should, under a 1931 regulatory scheme enacted after all but one of the dams in question were constructed, trigger lease payments for use of land beneath. In July 2006, the Montana state court approved a stipulation by the State of Montana that it is not seeking lease payments or other compensation from PPL Montana for the period prior to PPL Montana's December 1999 acquisition of the hydroelectric facilities. In June and October 2007, Pacificorp and Avista, respectively, entered into settlement agreements with the State of Montana providing, in pertinent part, that each company would make prospective lease payments of $50,000 and $4 million per year for use of the State's navigable streambed (adjusted annually for inflation and subject to other future adjustments). Under these settlement agreements, the future annual payments resolved the State's claims for both past and future compensation. In the October 2007 trial of this matter, the State of Montana asserted that PPL Montana should make a prospective lease payment for use of the State's streambeds of $6 million per year (adjusted annually for inflation) and a retroactive compensation payment for the 2000-2006 period (including interest) of $41 million. PPL Montana vigorously contested both such assertions. In June 2008, the District Court issued a decision awarding compensation of approximately $34 million for prior years and approximately $6 million for 2007 compensation. The Court also deferred the determination of compensation for 2008 and future years to the Montana State Land Board. PPL Montana believes that the District Court's decision and a number of its pretrial rulings are erroneous. In October 2008, PPL Montana filed an appeal of the decision to the Montana Supreme Court and a stay of judgment, including a stay of the Land Board's authority to assess compensation for 2008 and future periods. Oral argument of the case was held before the Montana Supreme Court in September 2009. For 2007 and subsequent years, PPL's management believes it is probable that its hydroelectric projects will be subject to annual estimated compensation ranging from $3 million to $6 million. PPL Montana's loss accrual at December 31, 2009 was $9 million, of
which $8 million ($5 million after tax or $0.01 per share) was recorded in 2009. PPL Montana cannot predict the outcome of this matter. PJM/MISO Billing Dispute (PPL, PPL Energy Supply and PPL Electric) In September 2009, PJM reported that it had discovered a modeling error in the market-to-market power flow calculations between PJM and the Midwest ISO (MISO). The error was a result of incorrect modeling of certain generation resources that have an impact on power flows across the PJM/MISO border. PJM's preliminary estimate of the magnitude of the error is approximately $77 million. To date, the MISO does not agree with PJM's estimate. Informal settlement discussions on this issue have commenced. PPL participates in markets in both the MISO and PJM. The amount and timing of any payment by PJM to the MISO relating to this modeling error is uncertain, as is the method by which PJM or the MISO would allocate any such payment to PJM and the MISO participants. PPL cannot predict the outcome of this matter; however, the impact on PPL subsidiaries is not expected to be material. Regulatory Issues Pennsylvania Activities (PPL and PPL Electric) Certain Pennsylvania legislators proposed legislation in 2009 to extend PLR generation rate caps or otherwise limit cost recovery through rates for Pennsylvania utilities beyond their transition periods, which in PPL Electric's case was December 31, 2009. PPL and PPL Electric previously expressed strong concern regarding the adverse consequences of such legislation on customer service, system reliability, adequate future generation supply and PPL Electric's financial viability. As generation rate caps are set to expire for three other Pennsylvania electric delivery companies at the end of 2010, it is possible that a debate on rate caps, rate mitigation and the creation of a state power authority may resume in 2010. PPL and PPL Electric believe the enactment of legislation extending PPL Electric rate caps would be a violation of federal law and the U.S. Constitution. For several years, PPL and PPL Electric worked with Pennsylvania legislators, regulators and others to develop programs to help customers transition to market rates after 2009, including rate mitigation, educational and energy conservation programs. Two plans were proposed and approved by the PUC. Under the first plan, residential and small commercial customers could elect to pay additional amounts with their electric bills from mid-2008 through 2009, with such additional amounts, plus accrued interest of 6%, applied to their 2010 and 2011 electric bills. Approximately 123,000 customers enrolled in the program, and at December 31, 2009, PPL Electric has recorded a liability of $36 million related to this activity. Under the second plan, eligible residential and eligible small-business customers could elect to defer payment of any increase greater than 25% in their 2010 electric bills. Deferred amounts, plus 6% interest, will be paid by customers over a one- or two-year period, depending on their electricity use. All deferrals will be paid by the end of 2012.
159
Act 129 became effective in October 2008. The law creates an energy efficiency and conservation program and smart metering technology requirements, adopts new PLR electricity supply procurement rules, provides remedies for market misconduct, and makes changes to the existing Alternative Energy Portfolio Standard. The law also requires electric utilities to meet specified goals for reduction in customer electricity usage and peak demand by specified dates. Utilities not meeting the requirements of Act 129 are subject to significant penalties. Under Act 129, Electric Distribution Companies (EDCs) must develop and file an energy efficiency and conservation plan (EE&C Plan) with the PUC and contract with a conservation service provider to implement all or a portion of the EE&C Plan. Act 129 requires EDCs to cause reduced electricity consumption of 1% by 2011 and 3% by 2013, and reduced peak demand of 4.5% by 2013. EDCs will be able to recover the costs (capped at 2% of the EDC's 2006 revenue) of implementing their EE&C Plans. In October 2009, the PUC approved PPL Electric's EE&C Plan. The plan includes 14 programs, all of which are voluntary for customers. The plan includes a proposed rate mechanism for recovery of all costs incurred by PPL Electric to implement the plan. Act 129 also requires installation of smart meters for new construction, upon the request of consumers at their cost, or on a depreciation schedule not exceeding 15 years. Under Act 129, EDCs will be able to recover the costs of providing smart metering technology. In August 2009, PPL Electric filed its proposed smart meter technology procurement and installation plan with the PUC. All of PPL Electric's metered customers currently have smart meters installed at their service locations and PPL Electric's current advanced metering technology generally satisfies the requirements of Act 129 and does not need to be replaced. PPL Electric's smart meter plan proposes to study, test and pilot applications to enhance and expand smart meter capabilities. PPL Electric estimates these studies will cost approximately $62 million over the next five years. PPL Electric has proposed a rate mechanism for recovery of these costs. An Administrative Law Judge has issued a recommended decision generally approving PPL Electric's plan, but PPL Electric cannot predict whether the plan will be approved. Act 129 also requires the default service provider (DSP) to provide electric generation supply service to customers pursuant to a PUC-approved competitive procurement plan through auctions, requests for proposal and bilateral contracts at the sole discretion of the DSP. Act 129 requires a mix of spot market purchases, short-term contracts and long-term contracts (4 to 20 years, with long-term contracts limited to up to 25% of the load unless otherwise approved by the PUC). The DSP will be able to recover the costs associated with a competitive procurement plan. Under Act 129, the DSP competitive procurement plan must ensure adequate and reliable service "at least cost to customers" over time. Act 129 grants the PUC authority to extend long-term power contracts up to 20 years, if necessary, to achieve the "least cost" standard. The PUC has approved PPL Electric's procurement plan for the period January 1, 2011 through
May 31, 2013 and PPL Electric has begun purchasing under that plan. FERC Transmission Rates (PPL and PPL Electric) In August 2008, PPL Electric asked the FERC to change the method for calculating its transmission rates to formula-based rates to support continued investment in its transmission system. Under formula-based rates, a fixed earnings level is set for the utility, and the utility annually adjusts its transmission rates, subject to FERC review, to reflect cost changes. The process offers an opportunity for public input. The proposed rate design prevents over-recovery or under-recovery of the actual costs of providing transmission delivery service. This request would not affect generation charges or distribution rates. PPL Electric requested that the proposed rate take effect November 1, 2008. In October 2008, the FERC accepted the proposed rate for filing, effective November 1, 2008, subject to refund, and set the matter for hearing, but held the hearings in abeyance to establish settlement judge procedures. In May 2009, a settlement was reached by all interested parties which, among other things, reduced PPL Electric's return on equity to approximately 11.70%. PPL Electric was granted approval to implement the formula-based rate as established in the settlement, effective June 1, 2009. In August 2009, the FERC approved the settlement. See Note 1 for information on a true-up of these revenues. California ISO and Western Markets (PPL and PPL Energy Supply) Through its subsidiaries, PPL made $18 million of sales to the California ISO during the period October 2000 through June 2001, $17 million of which has not been paid to PPL subsidiaries. Given the myriad of electricity supply problems faced by California electric utilities and the California ISO, PPL cannot predict whether or when it will receive payment. At December 31, 2009, PPL continues to be fully reserved for non-payment for these sales. Regulatory proceedings arising out of the California electricity supply controversy have been filed at the FERC. The FERC has determined that all sellers of energy into markets operated by the California ISO and the California Power Exchange, including PPL Montana, should be subject to refund liability for the period beginning October 2, 2000 through June 20, 2001, but the FERC has not yet ruled on the exact amounts that the sellers, including PPL Montana, would be required to refund. In decisions in September 2004 and August 2006, the U.S. Court of Appeals for the Ninth Circuit held that the FERC had the additional legal authority to order refunds for periods prior to October 2, 2000, and ordered the FERC to determine whether or not it would be appropriate to grant such additional refunds. In February 2008, the FERC initiated proceedings to determine whether it would be appropriate to grant additional refunds. In November 2009, the FERC issued an order scheduling evidentiary hearings in 2010 on such refunds but has suspended certain of these proceedings and instituted settlement procedures.
160
In June 2003, the FERC took several actions as a result of a number of related investigations. The FERC terminated proceedings to consider whether to order refunds for spot market bilateral sales made in the Pacific Northwest, including sales made by PPL Montana, during the period December 2000 through June 2001. In August 2007, the U.S. Court of Appeals for the Ninth Circuit reversed the FERC's decision and ordered the FERC to consider additional evidence. The FERC also commenced additional investigations relating to "gaming" and bidding practices during 2000 and 2001, but neither PPL EnergyPlus nor PPL Montana believes it is a subject of these investigations. In February 2004, the Montana Public Service Commission initiated a limited investigation of the Montana retail electricity market for the years 2000 and 2001, focusing on how that market was affected by transactions involving the possible manipulation of the electricity grid in the western U.S. The investigation includes all public utilities and licensed electricity suppliers in Montana, including PPL Montana, as well as other entities that may possess relevant information. In June 2004, the Montana Attorney General served PPL Montana and more than 20 other companies with subpoenas requesting documents, and PPL Montana has provided responsive documents to the Montana Attorney General. While PPL and its subsidiaries believe that they have not engaged in any improper trading or marketing practices affecting the California and western markets, PPL cannot predict the outcome of the above-described investigations, lawsuits and proceedings or whether any PPL subsidiaries will be the target of any additional governmental investigations or named in other lawsuits or refund proceedings. PJM RPM Litigation (PPL, PPL Energy Supply and PPL Electric) In May 2008, a group of state public utility commissions, state consumer advocates, municipal entities and electric cooperatives, industrial end-use customers and a single electric distribution company (collectively, the RPM Buyers) filed a complaint before the FERC objecting to the prices for capacity under the PJM Reliability Pricing Model (RPM) that were set in the 2008-09, 2009-10 and 2010-11 RPM base residual auctions. The RPM Buyers requested that the FERC reset the rates paid to generators for capacity in those periods to a significantly lower level. Thus, the complaint requests that generators be paid less for those periods through refunds and/or prospective changes in rates. The relief requested in the complaint, if granted, could have a material effect on PPL, PPL Energy Supply and PPL Electric. PJM, PPL and numerous other parties have responded to the complaint, strongly opposing the relief sought by the RPM Buyers. In September 2008, the FERC entered an order denying the complaint. In August 2009, the RPM Buyers appealed the FERC's decision to the U.S. Court of Appeals for the Fourth Circuit. PPL cannot predict the outcome of this proceeding. In December 2008, the PJM submitted amendments to certain provisions governing its RPM capacity market. The amendments were intended to permit the compensation available to suppliers that provide capacity, like PPL Energy Supply, to
increase. The PJM sought approval of the amendments in time for them to be implemented for the May 2009 capacity auction (for service in June 2012 through May 2013). Numerous parties, including PPL, protested the PJM's filing. Certain of the protesting parties proposed changes to the capacity market auction that would result in a reduction in compensation to capacity suppliers. The changes proposed by the PJM and by other parties in response to the PJM proposals could significantly affect the compensation available to suppliers of capacity participating in future RPM auctions. In March 2009, the FERC entered an order approving in part and disapproving in part the changes proposed by the PJM. In August 2009, the FERC issued an order granting rehearing in part, denying rehearing in part and clarifying its March 2009 order. PPL cannot predict the outcome of this proceeding. No request for rehearing or appeal of the August 2009 order has been timely filed. FERC Market-Based Rate Authority (PPL and PPL Energy Supply) In December 1998, the FERC authorized PPL EnergyPlus to make wholesale sales of electric power and related products at market-based rates. In that order, the FERC directed PPL EnergyPlus to file an updated market analysis within three years after the order, and every three years thereafter. Since then, periodic market-based rate filings with the FERC have been made by PPL EnergyPlus, PPL Electric, PPL Montana and most of PPL Generation's subsidiaries. These filings consisted of a Western market-based rate filing for PPL Montana and an Eastern market-based rate filing for most of the other PPL subsidiaries in the PJM region. The next filings will be due later in 2010. Currently, a seller granted market-based rate authority by the FERC may enter into power contracts during an authorized time period. If the FERC determines that the market is not workably competitive or that the seller possesses market power or is not charging "just and reasonable" rates, it may institute prospective action, but any contracts entered into pursuant to the FERC's market-based rate authority remain in effect and are generally subject to a high standard of review before the FERC can order changes. Recent court decisions by the U.S. Court of Appeals for the Ninth Circuit have raised issues that may make it more difficult for the FERC to continue its program of promoting wholesale electricity competition through market-based rate authority. These court decisions permit retroactive refunds and a lower standard of review by the FERC for changing power contracts, and could have the effect of requiring the FERC in advance to review most, if not all, power contracts. In June 2008, the U.S. Supreme Court reversed one of the decisions of the U.S. Court of Appeals for the Ninth Circuit, thereby upholding the higher standard of review for modifying contracts. The FERC has not yet taken action in response to these recent court decisions. At this time, PPL cannot predict the impact of these court decisions on the FERC's future market-based rate authority program or on PPL's business.

161
IRS Synthetic Fuels Tax Credits (PPL and PPL Energy Supply) PPL, through its subsidiaries, had interests in two synthetic fuel production facilities: the Somerset facility, located in Pennsylvania, and the Tyrone facility, located in Kentucky. PPL received tax credits pursuant to Section 29/45K of the Internal Revenue Code based on the sale of synthetic fuel from these facilities. The Section 29/45K tax credit program expired at the end of 2007, and production of synthetic fuel at these facilities and all other synthetic fuel operations ceased as of December 31, 2007. The facilities were dismantled and retired in 2008. In April 2008, the IRS published the domestic first purchase price (DFPP) for 2007 indicating that the DFPP reference price increased above PPL's estimated price levels for 2007 and the inflation-adjusted phase-out range decreased from PPL's estimate for 2007. Therefore, PPL recorded an expense of $13 million ($0.04 per share, basic and diluted, for PPL) in 2008, to "Income Taxes" on the Statement of Income to account for this difference. Energy Policy Act of 2005 - Reliability Standards (PPL, PPL Energy Supply and PPL Electric) In August 2005, the Energy Policy Act of 2005 (the 2005 Energy Act) became law. The 2005 Energy Act substantially affects the regulation of energy companies, amends federal energy laws and provides the FERC with new oversight responsibilities. Among the important changes in this law is the appointment of the NERC to establish and enforce mandatory reliability standards (Reliability Standards) regarding the bulk power system. The FERC oversees this process and independently enforces the Reliability Standards. The Reliability Standards have the force and effect of law and apply to certain users of the bulk power electricity system, including electric utility companies, generators and marketers. The FERC has indicated it intends to enforce vigorously the Reliability Standards using, among other means, civil penalty authority. Under the Federal Power Act, the FERC may assess civil penalties of up to $1 million per day, per violation, for certain violations. The first group of Reliability Standards approved by the FERC became effective in June 2007. Since 2007, PPL Electric and certain subsidiaries of PPL Energy Supply have self-reported to the RFC potential violations of certain applicable reliability requirements and submitted accompanying mitigation plans, the resolutions of which potential violation reports are pending. Any RFC determination concerning the resolution of violations of the Reliability Standards remains subject to the approval of the NERC and the FERC. PPL Electric has reached agreement with the RFC concerning some, but not all, of the reliability matters reported by it to the RFC. PPL Electric and PPL Energy Supply cannot predict the outcome of these matters. In the course of implementing its program to ensure compliance with the Reliability Standards by those PPL affiliates subject to the standards, certain other instances of potential non-
compliance will continue to be identified from time to time. PPL cannot predict the fines or penalties that may be imposed. U.K. Overhead Electricity Networks (PPL and PPL Energy Supply) In 2002, for safety reasons, the U.K. Government issued guidance that low voltage overhead electricity networks within three meters horizontal clearance of a building should either be insulated or relocated. This imposed a retroactive requirement on existing assets that were built with lower clearances. In 2008, following extensive discussion, the U.K. Government determined that the U.K. electricity network should comply with the guidance issued. WPD estimates that the cost of compliance will be approximately $93 million. The projected expenditures over the next five years have been allowed to be recovered through rates and it is expected that expenditures beyond this five year period will also be recovered through rates. The Government has determined that WPD (South Wales) should comply by 2015 and WPD (South West) by 2018. In January 2009, to improve network reliability the U.K. Government enforced a regulation requiring network operators to implement a risk-based program over 25 years to clear trees within falling distance of key high-voltage overhead lines. WPD estimates that the cost of compliance will be approximately $107 million over the 25-year period. The projected expenditures over the next five years have been allowed to be recovered through rates and it is expected that expenditures beyond this five year period will also be recovered through rates. Environmental Matters - Domestic (PPL, PPL Energy Supply and PPL Electric) Due to the environmental issues discussed below or other environmental matters, PPL subsidiaries may be required to modify, curtail, replace or cease operating certain facilities or operations to comply with statutes, regulations and other requirements of regulatory bodies or courts. In this regard, PPL subsidiaries also may incur capital expenditures or operating expenses in amounts which are not now determinable, but could be significant. Air (PPL and PPL Energy Supply) The Clean Air Act addresses, among other things, emissions causing acid deposition, installation of best available control technologies for new or substantially modified sources, attainment of federal ambient air quality standards, toxic air emissions and visibility standards in the U.S. Amendments to the Clean Air Act requiring additional emission reductions are likely to continue to be proposed in the U.S. Congress. The Clean Air Act allows states to develop more stringent regulations and in some instances, as discussed below, Pennsylvania and Montana have done so. Clean Air Interstate Rule (CAIR) Citing its authority under the Clean Air Act, in 1997, the EPA developed new standards for ambient levels of ozone and fine
162
particulates in the U.S. To facilitate attainment of these standards, the EPA promulgated CAIR for 28 midwestern and eastern states, including Pennsylvania, to reduce sulfur dioxide emissions by about 50% by 2010 and to extend the current seasonal program for reduction in nitrogen oxides emissions to a year-round program starting in 2009. Starting in 2015, CAIR requires further reductions in the CAIR region, in sulfur dioxide of 30% from 2010 levels, and nitrogen oxides during the ozone season of approximately 17% from 2009 levels. CAIR allows these reductions to be achieved through cap-and-trade programs. In July 2008, the United States Court of Appeals for the D.C. Circuit (the U.S. Circuit Court) issued a ruling that invalidated CAIR in its entirety, including its cap-and-trade program. As a result of this decision, in 2008, PPL determined that all of the annual nitrogen oxide allowances purchased by PPL EnergyPlus pursuant to CAIR were no longer required, had no value and, therefore, recorded a pre-tax impairment charge of $33 million ($20 million after tax). Further, PPL EnergyPlus recorded in the third quarter 2008 an additional charge and corresponding reserve of $12 million pre-tax ($7 million after tax) related to its sale of certain annual nitrogen oxide allowance put options. These charges, recorded in PPL and PPL Energy Supply's Supply segment, are included in "Other operation and maintenance" expense on the Statement of Income. The U.S. Circuit Court's decision did not impact PPL EnergyPlus' seasonal nitrogen oxide allowances. In December 2008, the U.S. Circuit Court remanded CAIR to the EPA without vacating the cap-and-trade program, effectively reinstating, at least temporarily, CAIR and its requirements for annual-reduction of nitrogen oxides beginning in 2009 and for further reduction in sulfur dioxide by requiring the surrender of two acid rain allowances for every ton of sulfur dioxide emitted beginning in 2010. As a result of this December 2008 ruling and associated delivery of allowances under other option contracts that were not in dispute, the reserve recorded in the third quarter of 2008 of $12 million pre-tax ($7 million after-tax) related to certain annual nitrogen oxide allowance put options was revised in the fourth quarter of 2008 to $9 million pre-tax ($5 million after tax). See Note 17 for information on impairments recorded in 2009 related to sulfur dioxide emission allowances. To continue meeting the sulfur dioxide reduction requirements under the acid rain provisions of the Clean Air Act, and the reductions required by CAIR (remanded by the U.S. Circuit Court, but currently in place), PPL installed and is operating scrubbers at its Montour and Brunner Island plants. In addition, with respect to compliance with annual and ozone season nitrogen oxide reduction requirements, PPL utilizes SCRs and combustion controls at Montour Units 1 and 2, and combustion controls at Brunner Island Units 1, 2 and 3. Additional emission allowances, when needed, are purchased in the open market. The ultimate disposition of CAIR's cap-and-trade program and the value of annual nitrogen oxide allowances, as well as sulfur dioxide allowances, remain uncertain. If the EPA revises CAIR to require more stringent emission reductions or revises CAIR to
eliminate or limit the regional cap-and-trade program, the costs of compliance are not now determinable, but could be significant. Further reductions in sulfur dioxide and nitrogen oxide emissions, beyond those required by CAIR, could be required as a result of more stringent national ambient air quality standards for ozone, nitrogen dioxide, sulfur dioxide and fine particulates. If additional reductions were to be required, the costs are not now determinable, but could be significant. Mercury and other Hazardous Air Pollutants Citing its authority under the Clean Air Act, in May 2005, the EPA issued the Clean Air Act Mercury Regulations (CAMR) affecting coal-fired power plants. These regulations establish a cap-and-trade program to take effect in two phases, with the first phase to begin in January 2010, and the second, more stringent, phase to begin in January 2018. Because of a February 2008 decision by the U.S. Circuit Court of Appeals overturning CAMR, the EPA is proceeding to develop standards imposing MACT for mercury emissions and other hazardous air pollutants from electric generating units. Under a recent proposed settlement, the EPA is planning to issue final MACT standards by November 2011. In order to develop these standards, the EPA is collecting information from coal-and-oil-fired electric utility steam generating units. The costs of complying with the final MACT standards are not now determinable, but could be significant. Pennsylvania adopted mercury emission standards more stringent than CAMR. However, PPL challenged those rules under the provisions of the Pennsylvania Air Pollution Control Act in light of the federal court decision overturning CAMR, and in December 2009, the Pennsylvania Supreme Court declared the Pennsylvania mercury rules invalid and unenforceable. In 2006, Montana finalized its mercury emission rules that require, by 2010, every coal-fired generating plant in Montana to achieve reductions more stringent than CAMR's 2018 requirements. PPL has installed chemical injection systems to meet these requirements. Regional Haze and Visibility The Clean Air Visibility Rule was issued by the EPA in June 2005, to address regional haze or regionally-impaired visibility caused by multiple sources over a wide area. The rule requires Best Available Retrofit Technology (BART) for certain electric generating units. Under the BART rule, PPL submitted to the Pennsylvania DEP its analyses of the visibility impacts of particulate matter emissions from Martins Creek Units 3 and 4, Brunner Island Units 2 and 3 and Montour Units 1 and 2. No analysis was submitted for sulfur dioxide or nitrogen oxides because the EPA determined that meeting the requirements for CAIR also meets the BART requirements for those pollutants. PPL's analyses have shown that because PPL had already upgraded its particulate emissions controls at Montour Units 1 and 2 and Brunner Island Units 2 and 3 further controls are not justified as there would be little corresponding visibility
163
improvement. PPL has not received comments from the Pennsylvania DEP on these submissions. Also under the BART rule, PPL submitted to the EPA its analyses of the visibility impacts of sulfur dioxide, nitrogen oxides and particulate matter emissions for Colstrip Units 1 and 2 and Corette. PPL's analyses concluded that further reductions are not needed. The EPA responded to PPL's reports for Colstrip and Corette and requested further information and analysis. PPL completed further analysis and submitted addendums to its initial reports for Colstrip and Corette. In February 2009, PPL received an information request for additional data related to the Colstrip generating station non-BART affected emission sources. PPL responded to this request in March 2009. PPL has not received comments from the EPA on these submissions. PPL cannot predict whether any additional reductions will be required in Pennsylvania or Montana. If additional reductions are required, the costs are not now determinable, but could be significant. New Source Review (NSR) The EPA has reinitiated its NSR enforcement efforts. This initiative targets older, coal-fired power plants. The EPA has asserted that modification to these plants has increased their emissions and consequently they are subject to more stringent NSR requirements under the Clean Air Act. In April 2009, PPL received EPA information requests for its Montour and Brunner Island plants. PPL has met with the EPA and exchanged information regarding this matter. The requests are similar to those that PPL received several years ago for its Colstrip, Corette and Martins Creek plants. PPL's response to the request for Montour and Brunner Island is currently on hold pending further discussions with the EPA. PPL cannot predict the outcome of this matter. In January 2009, PPL and other companies that own or operate the Keystone plant received a notice of violation from the EPA alleging that certain projects were undertaken without proper NSR compliance. PPL cannot predict the outcome of this matter. States and environmental groups also have initiated enforcement actions and litigation alleging violations of the NSR regulations by coal-fired plants, and PPL is unable to predict whether such actions will be brought against any of PPL's plants. If PPL is found to have violated NSR regulations, PPL would, among other things, be required to install best available control technology for any pollutant found to have significantly increased due to a major plant modification. The costs to install and operate such technology are not now determinable, but could be significant. Pursuant to the 2007 U.S. Supreme Court decision on global climate change, as discussed below, the EPA is expected to regulate carbon dioxide emissions in 2010. Such regulation would subject carbon dioxide emissions to NSR regulations. As a result, in October 2009, the EPA published its proposal to
require large industrial facilities that annually emit at least 25,000 tons of greenhouse gases, including carbon dioxide, to obtain construction and operating permits covering significant increases in these emissions if the facility undergoes any major modification or during initial construction. If the modifications result in emissions increases exceeding certain thresholds, which the EPA has not yet established, the plant will need to conduct an analysis of, and possibly implement, best available control technology for carbon dioxide emissions. To date, the EPA has not provided official guidance, but has indicated that it may look at efficiency projects as possible Best Available Control Technology for carbon dioxide emissions. The implications of these developments are uncertain and any associated costs are not now determinable, but could be significant. Opacity From time to time environmental concerns are raised with respect to visible opacity of emissions from our power plants. PPL addresses these issues on a case by case basis. If it is determined that actions must be taken to address visible opacity issues, such actions could result in costs that are not now determinable, but could be significant. Global Climate Change There is concern nationally and internationally about global climate change and the possible contribution of greenhouse gas emissions including, most significantly, carbon dioxide from the combustion of fossil fuels. This has resulted in increased demands for carbon dioxide emission reductions by investors, environmental organizations, government agencies and the international community. These demands and concerns have led to increased federal legislative proposals, actions at regional, state and local levels, as well as litigation relating to greenhouse gas emissions. Of particular note, in April 2007, the U.S. Supreme Court held that the EPA has the authority to regulate greenhouse gas emissions from new motor vehicles under the Clean Air Act. More recently, in September 2009, the U.S. Court of Appeals for the Second Circuit reversed a federal district court's decision and ruled that several states and public interest groups, as well as the City of New York, could sue five electric utility companies under federal common law for allegedly causing a public nuisance as a result of their emissions of greenhouse gases. Additional litigation in federal and state courts over these issues is continuing. As a result of the 2007 Supreme Court's decision, in 2008, the EPA issued an "Advance Notice of Proposed Rulemaking," proposing alternative approaches to regulate carbon dioxide emissions. The EPA is moving forward with regulation of greenhouse gas emissions under the Clean Air Act. In 2009, the EPA also issued a rule, effective January 1, 2010, requiring economy-wide reporting of greenhouse gas emissions and in December 2009, issued a final endangerment finding that greenhouse gases contribute to air pollution and may endanger public health or welfare. The EPA's proposed light-duty vehicle emissions standards are expected to be finalized by March 31, 2010, leading to regulation of greenhouse gas emissions under the New Source Review provisions of the Clean Air Act.
164
Accordingly, unless Congress acts sooner, it appears likely that greenhouse gas emissions will be regulated by the EPA. In June 2009, the U.S. House of Representatives passed H.R. 2454, the American Clean Energy and Security Act of 2009. A key element affecting PPL includes a declining cap on carbon emissions beginning in 2012, which requires a three percent reduction in greenhouse gas emissions (below 2005 levels) by 2012, increasing to 83% by 2050. The legislation also would require that electric utilities meet a mandatory 20% renewable energy supply and energy efficiency requirement by 2020. In September 2009, S. 1733, the Clean Energy, Jobs and American Power Act, a comprehensive climate change bill, was introduced in the U.S. Senate. The Senate Committee on Environment and Public Works approved S.1733 in November 2009. Debate on climate legislation continues in Congress; however, given other competing legislative priorities, the timing and elements of any future legislation addressing greenhouse gas emission reductions and renewable energy requirements are uncertain. Renewable electricity standards are currently included in a separate Senate bill, S.1462, the American Clean Energy Leadership Act of 2009, which passed in the Senate Energy Committee in June 2009. Under this bill, electric utilities would be required by 2021 to meet a 15% standard through renewable sources of energy and energy efficiency. At the regional level, ten northeastern states signed a Memorandum of Understanding (MOU) agreeing to establish a greenhouse gas emission cap-and-trade program, called the Regional Greenhouse Gas Initiative (RGGI). The program commenced in January 2009 and calls for stabilization of carbon dioxide emissions, at base levels established in 2005, from electric power plants with capacity greater than 25 MW. The MOU also provides for a 10% reduction in carbon dioxide emissions from base levels by 2019. Pennsylvania has not stated an intention to join RGGI, but has enacted the Pennsylvania Climate Change Act of 2008 (PCCA). The PCCA established a Climate Change Advisory Committee to advise the DEP on the development of a Climate Change Action Plan. In December 2009, the Advisory Committee finalized its Climate Change Action Report which identifies specific actions that could result in reducing greenhouse gas emissions by 30% by 2020. Some of the proposed actions, such as a mandatory 5% efficiency improvement at power plants, could be technically unachievable. In addition, legislation has been introduced in the Pennsylvania House of Representatives that would, if enacted, significantly increase renewable and solar supply requirements. In the Western U.S., 11 states, including Montana, and Canadian provinces are members of the Western Climate Initiative (WCI). The WCI has established a goal of reducing carbon dioxide emissions 15% below 2005 levels by 2020 and is currently developing greenhouse gas emission allocations, offsets, and reporting recommendations. PPL has conducted an inventory of its carbon dioxide emissions and is continuing to evaluate options for reducing, avoiding, off-setting or sequestering its carbon dioxide emissions. In 2009,
PPL's power plants emitted in excess of approximately 25 million tons of carbon dioxide (based on PPL's equity share of these assets). PPL understands there are financial, regulatory and logistical uncertainties related to greenhouse gas reductions and the implementation of renewable energy mandates. These will need to be resolved before the impact of such requirements on PPL can be meaningfully estimated. Such uncertainties, among others, include the need to provide back-up supply to augment intermittent renewable generation, potential generation oversupply that could result from such renewable generation and back-up, impacts to the PJM capacity market and the need for substantial changes to transmission and distribution systems to accommodate renewable energy; which uncertainties are not directly addressed by the proposed legislation. PPL cannot predict at this time the effect on its future competitive position, results of operation, cash flows and financial position, of any greenhouse gas emission, renewable energy mandate or other global climate change requirements that may be adopted, although the costs to implement and comply with any such requirements could be significant. Water/Waste (PPL and PPL Energy Supply) Martins Creek Fly Ash Release In 2005, there was a release of approximately 100 million gallons of water containing fly ash from a disposal basin at the Martins Creek plant used in connection with the operation of the two 150 MW coal-fired generating units at the plant. This resulted in ash being deposited onto adjacent roadways and fields, and into a nearby creek and the Delaware River. The leak was stopped, and PPL determined that the release was caused by a failure in the disposal basin's discharge structure. PPL conducted extensive clean-up and completed studies, in conjunction with a group of natural resource trustees and the Delaware River Basin Commission, evaluating the effects of the release on the river's sediment, water quality and ecosystem. The Pennsylvania DEP filed a complaint in Pennsylvania Commonwealth Court against PPL Martins Creek and PPL Generation, alleging violations of various state laws and regulations and seeking penalties and injunctive relief. PPL and the Pennsylvania DEP have settled this matter. The settlement required a payment of $1.5 million in penalties and reimbursement of the DEP's costs. PPL made this payment in the second quarter of 2008. The settlement also requires PPL to submit a report on the completed studies of possible natural resource damages. PPL submitted the assessment report to the Pennsylvania and New Jersey regulatory agencies in 2007 and has continued discussing potential natural resource damages with the agencies. Through December 31, 2009, PPL Energy Supply has spent $28 million for remediation and related costs and an immaterial remediation liability remained. PPL and PPL Energy Supply cannot be certain of the outcome of the natural resource damage assessment or the associated costs, the outcome of any lawsuit that may be brought by citizens or businesses or the exact nature of any other regulatory or other legal actions that may be

165
initiated against PPL, PPL Energy Supply or their subsidiaries as a result of the disposal basin release. Basin Seepage - Pennsylvania Seepages have been detected at active and retired wastewater basins at various PPL plants, including the Montour and Brunner Island generating facilities. PPL has completed an assessment of some of the seepages at the Montour and Brunner Island facilities and is working with the Pennsylvania DEP to implement abatement measures for those seepages. PPL continues to assess other seepages at the Brunner Island facility. PPL currently plans to spend up to $64 million to upgrade and/or replace certain wastewater facilities in response to the seepages and for other facility changes. The potential additional cost to address the identified seepages or other seepages at all of PPL's Pennsylvania plants is not now determinable, but could be significant. Basin Seepage - Montana In May 2003, approximately 50 plaintiffs brought an action against PPL Montana and the other owners of the Colstrip plant alleging property damage from seepage from the freshwater and wastewater ponds at Colstrip. In July 2008, the plaintiffs and the owner-defendants remaining after dismissal of NorthWestern, due to its bankruptcy, executed a settlement agreement. PPL Montana's share of the settlement was approximately $8 million. In 2008, PPL Montana recorded an insignificant reserve for its share of potential additional settlements with three property owners living near the original plaintiffs but who were not parties to the lawsuit. In the fourth quarter of 2009, PPL Montana settled with two of these property owners. PPL Montana may incur additional costs related to the potential claims, including additional groundwater investigations and any related remedial measures, which are not now determinable, but could be significant. In 2007, six plaintiffs filed a separate lawsuit in the Montana Sixteenth Judicial District Court against the Colstrip plant owners asserting similar property damage claims as were asserted by the plaintiffs in the May 2003 complaint. The lawsuit is in its initial stages of discovery and investigation, and PPL Montana is unable to predict the outcome of these proceedings. PPL Montana has undertaken certain groundwater investigations and remediation at the Colstrip plant to address groundwater contamination alleged by the plaintiffs, as well as other groundwater contamination at the plant. PPL Montana may incur further costs based on the outcome of this lawsuit and its additional groundwater investigations and any related remedial measures, which are not now determinable, but could be significant. Other Issues In 2006, the EPA significantly decreased to 10 parts per billion (ppb), the drinking water standard related to arsenic. In Pennsylvania and Montana, this arsenic standard has been incorporated into the states' water quality standards and could result in more stringent limits to PPL's NPDES permits for its Pennsylvania and Montana plants. Recently, the EPA developed
a draft risk assessment of arsenic that increases the cancer risk exposure by more than 20 times, which would lower the current standard from 10 ppb to 0.1 ppb. If the lower standard became effective, very expensive treatment would be required to attempt to meet the standard and, at this time, there is no assurance that it could be achieved. The EPA finalized requirements in 2004 for new or modified cooling water intake structures. These requirements affect where generating facilities are built, establish intake design standards and could lead to requirements for cooling towers at new and modified power plants. Another rule, finalized in 2004, that addressed existing structures was withdrawn following a 2007 decision by the U.S. Court of Appeals for the Second Circuit. In 2008, however, the U.S. Supreme Court ruled that the EPA has discretion to use cost-benefit analysis in determining the best technology available for minimizing adverse environmental impact. The EPA is developing a new rule which is expected to be finalized in 2012. How the cost-benefit analysis will be employed, if incorporated, as well as other issues raised by the Second Circuit Court (not reviewed by the U.S. Supreme Court) and actions the states may take on their own could result in stricter standards for existing structures that could impose significant costs on PPL subsidiaries. In October 2009, the EPA released its Final Detailed Study of the Steam Electric Power Generating effluent limitations guidelines and standards. Draft regulations that would include revisions to the effluent limitations guidelines are expected to be published in September 2011, with final regulations to be effective September 2013. PPL expects the revised guidelines and standards to be more stringent than the current standards, which could result in more stringent discharge permit limits. PPL has signed a consent order with the Pennsylvania DEP under which it will take further actions to minimize the possibility of fish kills at its Brunner Island plant. Fish are attracted to warm water in power plant discharge channels, especially during cold weather. In the past, fish kills have occurred at Brunner Island when debris at intake pumps resulted in a unit trip or reduction in load, causing a sudden change in water temperature in the discharge channel when fish were present. In 2008, PPL paid a nominal penalty to the DEP for fish kills at Brunner Island that occurred in 2008 and 2007. PPL has committed to construct a barrier to prevent debris from entering the intake area. PPL expects to construct the debris barrier in 2010 at a cost of approximately $4 million. PPL has also committed to investigate alternatives to exclude fish from the discharge area. PPL will need to implement one of these fish exclusion alternatives if a fish kill occurs after the cooling towers become operational at Brunner Island in 2010. The EPA is considering establishing regulations under the Resource Conservation and Recovery Act (RCRA) that could impact the disposal and management of coal combustion products (CCPs), including ash and scrubber wastes and other by-products. Following the large ash release at a Tennessee Valley Authority site in Tennessee in December 2008 and subsequent widespread media coverage, the EPA, under pressure from certain environmental groups and legislators, has
166
committed to proposing CCP regulations. Draft regulations are expected in 2010. The EPA has been seeking information from the power industry as it considers whether or not to regulate CCPs as hazardous waste, and PPL has responded to the EPA's requests. The EPA conducted a follow-up inspection of PPL Montana's Colstrip plant and PPL's Martins Creek plant. PPL is implementing certain actions in response to recommendations from these inspections. In June 2009, the EPA's Office of Enforcement and Compliance Assurance issued a much broader information request to Colstrip and 18 other non-affiliated plants, seeking information under the RCRA, the Clean Water Act and the Emergency Planning and Community Right-to-Know Act. PPL responded to the EPA's broader information request. Although the EPA's enforcement office issued the request, the EPA has not necessarily concluded that the plants are in violation of any EPA requirements. The EPA conducted a multi-media inspection at Colstrip in August 2009 and has not yet issued a report from that inspection. PPL cannot predict at this time the outcome of these matters or the requirements of the EPA's regulations and what impact, if any, they would have on PPL's facilities, but the costs to PPL could be significant. Superfund and Other Remediation (PPL, PPL Energy Supply and PPL Electric) PPL Electric is a potentially responsible party at several sites listed by the EPA under the federal Superfund program, including the Columbia Gas Plant Site, the Metal Bank site and the Ward Transformer site. Clean-up actions have been or are being undertaken at all of these sites, the costs of which have not been significant to PPL. However, should the EPA require different or additional measures in the future, or should PPL's share of costs at multi-party sites increase significantly more than currently expected, the costs to PPL could be significant. PPL Electric has been remediating several sites that were not being addressed under another regulatory program such as Superfund, but for which PPL Electric may be liable for remediation. These include a number of coal gas manufacturing facilities formerly owned or operated by a predecessor to PPL Electric. Depending on the outcome of investigations at sites where investigations have not begun or have not been completed, the costs of remediation and other liabilities could be substantial. PPL and its subsidiaries also could incur other non-remediation costs at sites included in the consent orders or other contaminated sites, the costs of which are not now determinable, but could be significant. The EPA is evaluating the risks associated with naphthalene, a chemical by-product of coal gas manufacturing. As a result of the EPA's evaluation, individual states may establish stricter standards for water quality and soil cleanup. This could require several PPL subsidiaries to take more extensive assessment and remedial actions at former coal gas manufacturing facilities. The costs to PPL of complying with any such requirements are not now determinable, but could be significant.
(PPL and PPL Energy Supply) Under the Pennsylvania Clean Streams Law, subsidiaries of PPL Generation are obligated to remediate acid mine drainage at former mine sites and may be required to take additional steps to prevent potential acid mine drainage at previously capped refuse piles. One PPL Generation subsidiary is pumping mine water at two mine sites and treating water at one of these sites. Another PPL Generation subsidiary has installed a passive wetlands treatment system at a third site. At December 31, 2009, PPL Energy Supply had accrued a discounted liability of $24 million to cover the costs of pumping and treating groundwater at the two mine sites for 50 years and for operating and maintaining passive wetlands treatment at the third site. PPL Energy Supply discounted this liability based on risk-free rates at the time of the mine closures. The weighted average rate used was 8.04%. Expected undiscounted payments are estimated at $1 million for each of the years from 2010 through 2014, and $144 million for work after 2014. (PPL, PPL Energy Supply and PPL Electric) Future cleanup or remediation work at sites currently under review, or at sites not currently identified, may result in material additional operating costs for PPL subsidiaries that cannot be estimated at this time. Electric and Magnetic Fields (PPL, PPL Energy Supply and PPL Electric) Concerns have been expressed by some members of the public regarding potential health effects of power frequency EMFs, which are emitted by all devices carrying electricity, including electric transmission and distribution lines and substation equipment. Government officials in the U.S. and the U.K. have reviewed this issue. The U.S. National Institute of Environmental Health Sciences concluded in 2002 that, for most health outcomes, there is no evidence that EMFs cause adverse effects. The agency further noted that there is some epidemiological evidence of an association with childhood leukemia, but that the evidence is difficult to interpret without supporting laboratory evidence. The U.K. National Radiological Protection Board (part of the U.K. Health Protection Agency) concluded in 2004 that, while the research on EMFs does not provide a basis to find that EMFs cause any illness, there is a basis to consider precautionary measures beyond existing exposure guidelines. In April 2007, the Stakeholder Group on Extremely Low Frequency EMF, set up by the U.K. Government, issued its interim assessment which describes a number of options for reducing public exposure to EMFs. The U.K. Government responded to this assessment in October 2009, agreeing to some of the proposals, including a proposed voluntary code to optimally phase 132 kilovolt overhead lines to reduce public exposure to EMF where it is cost effective to do so. PPL and its subsidiaries believe the current efforts to determine whether EMFs cause adverse health effects should continue and are taking steps to reduce EMFs, where practical, in the design of new transmission and distribution facilities. PPL and its subsidiaries are unable to predict what effect, if any, the EMF issue might have on their operations and facilities
167
either in the U.S. or the U.K., and the associated cost, or what, if any, liabilities they might incur related to the EMF issue. Environmental Matters - WPD (PPL and PPL Energy Supply) WPD's distribution businesses are subject to environmental regulatory and statutory requirements. PPL believes that WPD has taken and continues to take measures to comply with the applicable laws and governmental regulations for the protection of the environment. The U.K. government has implemented a project to determine the impact of flooding on the U.K. utility infrastructure, including major electricity substations. WPD has agreed with the Ofgem to spend $28 million on flood prevention, which will be recovered through rates during the 5-year period commencing April 2010. U.K. legislation has been passed that imposes a duty on certain companies including WPD to report on climate change adaptation. It is expected that the first "Direction to Report" will be issued early in 2010 with reports due for submission at the end of the year. There are no other material legal or administrative proceedings pending against or related to WPD with respect to environmental matters. See "Environmental Matters - Domestic - Superfund and Other Remediation - Electric and Magnetic Fields" for a discussion of EMFs. Other Labor Unions (PPL, PPL Energy Supply and PPL Electric) At December 31, 2009, the breakdown of the total workforce that is represented by unions was:
Number of Employees
Percent of Total
Workforce
PPL 6,840 65% PPL Energy Supply 4,850 69% PPL Electric 1,570 72% In May 2010, PPL's bargaining agreement with its largest IBEW local expires. The agreement covers the following:
Number of Employees
Percent of Total
Workforce
PPL 3,200 31% PPL Energy Supply 1,210 17% PPL Electric 1,570 72% Negotiations commenced in February 2010. PPL cannot predict the outcome of the collective labor bargaining negotiations.
Nuclear Insurance (PPL and PPL Energy Supply) PPL Susquehanna is a member of certain insurance programs that provide coverage for property damage to members' nuclear generating stations. Facilities at the Susquehanna station are insured against property damage losses up to $2.75 billion under these programs. PPL Susquehanna is also a member of an insurance program that provides insurance coverage for the cost of replacement power during prolonged outages of nuclear units caused by certain specified conditions. Under the property and replacement power insurance programs, PPL Susquehanna could be assessed retroactive premiums in the event of the insurers' adverse loss experience. At December 31, 2009, this maximum assessment was $37 million. In the event of a nuclear incident at the Susquehanna station, PPL Susquehanna's public liability for claims resulting from such incident would be limited to $12.6 billion under provisions of The Price-Anderson Act Amendments under the Energy Policy Act of 2005. PPL Susquehanna is protected against this liability by a combination of commercial insurance and an industry assessment program. In the event of a nuclear incident at any of the reactors covered by The Price-Anderson Act Amendments under the Energy Policy Act of 2005, PPL Susquehanna could be assessed up to $235 million per incident, payable at $35 million per year. At December 31, 2009, the property, replacement power and nuclear incident insurers maintained an A.M. Best financial strength rating of A ("Excellent"). Guarantees and Other Assurances (PPL, PPL Energy Supply and PPL Electric) In the normal course of business, PPL, PPL Energy Supply and PPL Electric enter into agreements that provide financial performance assurance to third parties on behalf of certain subsidiaries. Such agreements include, for example, guarantees, stand-by letters of credit issued by financial institutions and surety bonds issued by insurance companies. These agreements are entered into primarily to support or enhance the creditworthiness attributed to a subsidiary on a stand-alone basis or to facilitate the commercial activities in which these subsidiaries enter. (PPL) PPL fully and unconditionally guarantees all of the debt securities of PPL Capital Funding. (PPL, PPL Energy Supply and PPL Electric) The table below details guarantees provided as of December 31, 2009. The total recorded liability at December 31, 2009 and 2008 was $3 million and $4 million. Other than as noted in the description for "WPD guarantee of pension and other obligations of unconsolidated entities," the probability of expected payment/performance under each of these guarantees is remote.
168
Exposure at December 31,
2009 (a) Expiration
Date
Description PPL Indemnifications for sale of PPL Gas Utilities
$ 300 PPL has provided indemnification to the purchaser of PPL Gas Utilities and Penn Fuel Propane, LLC for damages arising out of any breach of the representations, warranties and covenants under the related transaction agreement and for damages arising out of certain other matters, including certain pre-closing unknown environmental liabilities relating to former manufactured gas plant properties or off-site disposal sites, if any, outside of Pennsylvania. The indemnification provisions for most representations and warranties, including tax and environmental matters, are capped at 15% of the purchase price ($45 million), in the aggregate, and are triggered (i) only if the individual claim exceeds $50,000, and (ii) only if, and only to the extent that, in the aggregate, total claims exceed 1.5% of the purchase price ($4.5 million). The indemnification provisions for most representations and warranties expired on September 30, 2009 without any claims having been made. Certain representations and warranties, including those having to do with transaction authorization and title, survive indefinitely, are capped at the purchase price and are not subject to the above threshold or deductible. The indemnification provision for the tax matters representations survives for the duration of the applicable statute of limitations, and the indemnification provision for the environmental matters representations survives for a period of three years after the transaction closing. The indemnification relating to unknown environmental liabilities for manufactured gas plants and disposal sites outside of Pennsylvania could survive more than three years, but only with respect to applicable property or sites identified by the purchaser prior to the third anniversary of the transaction closing. The indemnification for covenants survives until the applicable covenant is performed and is not subject to any cap.
PPL Energy Supply (b) Letters of credit issued on behalf of
affiliates 17 2010 to 2011 Standby letter of credit arrangements under PPL Energy Supply's credit facilities
for the purposes of protecting various third parties against nonperformance by PPL. This is not a guarantee by PPL on a consolidated basis.
Retroactive premiums under nuclear insurance programs
37 PPL Susquehanna is contingently obligated to pay this amount related to potential retroactive premiums that could be assessed under its nuclear insurance programs. See "Nuclear Insurance" for additional information.
Nuclear claims under The Price-Anderson Act Amendments under The Energy Policy Act of 2005
235 This is the maximum amount PPL Susquehanna could be assessed for each incident at any of the nuclear reactors covered by this Act. See "Nuclear Insurance" for additional information.
Indemnifications for entities in liquidation and sales of assets
186 2010 to 2012 PPL Energy Supply's maximum exposure with respect to certain indemnifications and the expiration of the indemnifications cannot be estimated because, in the case of certain indemnification provisions, the maximum potential liability is not capped by the transaction documents and the expiration date is based on the applicable statute of limitations. The exposure and expiration dates noted are only for those cases in which the agreements provide for specific limits. In connection with the liquidation of wholly owned subsidiaries that have been deconsolidated upon turning the entities over to the liquidators, certain affiliates of PPL Global have agreed to indemnify the liquidators, directors and/or the entities themselves for any liabilities or expenses arising during the liquidation process, including liabilities and expenses of the entities placed into liquidation. In some cases, the indemnifications are limited to a maximum amount that is based on distributions made from the subsidiary to its parent either prior or subsequent to being placed into liquidation. In other cases, the maximum amount of the indemnifications is not explicitly stated in the agreements. The indemnifications generally expire two to seven years subsequent to the date of dissolution of the entities. The exposure noted only includes those cases in which the agreements provide for a specific limit on the amount of the indemnification, and the expiration date was based on an estimate of the dissolution date of the entities. In 2009, $212 million of previously disclosed exposure expired.
In connection with their sales of various businesses, WPD and its affiliates have provided the purchasers with indemnifications that are standard for such transactions, including indemnifications for certain pre-existing liabilities and environmental and tax matters. In addition, in connection with certain of these sales, WPD and its affiliates have agreed to continue their obligations under existing third-party guarantees, either for a set period of time following the transactions or upon the condition that the purchasers make reasonable efforts to terminate the guarantees. Finally, WPD and its affiliates remain secondarily responsible for lease payments under certain leases that they have assigned to third parties.
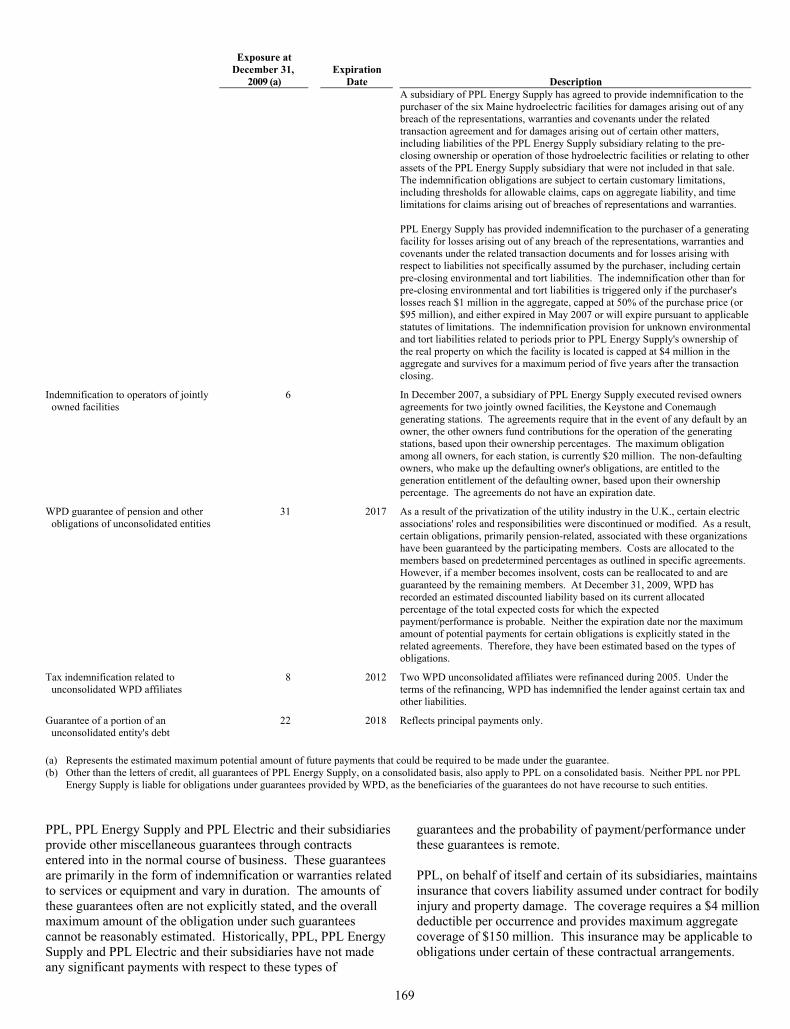
169
Exposure at December 31,
2009 (a) Expiration
Date
Description A subsidiary of PPL Energy Supply has agreed to provide indemnification to the
purchaser of the six Maine hydroelectric facilities for damages arising out of any breach of the representations, warranties and covenants under the related transaction agreement and for damages arising out of certain other matters, including liabilities of the PPL Energy Supply subsidiary relating to the pre-closing ownership or operation of those hydroelectric facilities or relating to other assets of the PPL Energy Supply subsidiary that were not included in that sale. The indemnification obligations are subject to certain customary limitations, including thresholds for allowable claims, caps on aggregate liability, and time limitations for claims arising out of breaches of representations and warranties.
PPL Energy Supply has provided indemnification to the purchaser of a generating facility for losses arising out of any breach of the representations, warranties and covenants under the related transaction documents and for losses arising with respect to liabilities not specifically assumed by the purchaser, including certain pre-closing environmental and tort liabilities. The indemnification other than for pre-closing environmental and tort liabilities is triggered only if the purchaser's losses reach $1 million in the aggregate, capped at 50% of the purchase price (or $95 million), and either expired in May 2007 or will expire pursuant to applicable statutes of limitations. The indemnification provision for unknown environmental and tort liabilities related to periods prior to PPL Energy Supply's ownership of the real property on which the facility is located is capped at $4 million in the aggregate and survives for a maximum period of five years after the transaction closing.
Indemnification to operators of jointly owned facilities
6 In December 2007, a subsidiary of PPL Energy Supply executed revised owners agreements for two jointly owned facilities, the Keystone and Conemaugh generating stations. The agreements require that in the event of any default by an owner, the other owners fund contributions for the operation of the generating stations, based upon their ownership percentages. The maximum obligation among all owners, for each station, is currently $20 million. The non-defaulting owners, who make up the defaulting owner's obligations, are entitled to the generation entitlement of the defaulting owner, based upon their ownership percentage. The agreements do not have an expiration date.
WPD guarantee of pension and other obligations of unconsolidated entities
31 2017 As a result of the privatization of the utility industry in the U.K., certain electric associations' roles and responsibilities were discontinued or modified. As a result, certain obligations, primarily pension-related, associated with these organizations have been guaranteed by the participating members. Costs are allocated to the members based on predetermined percentages as outlined in specific agreements. However, if a member becomes insolvent, costs can be reallocated to and are guaranteed by the remaining members. At December 31, 2009, WPD has recorded an estimated discounted liability based on its current allocated percentage of the total expected costs for which the expected payment/performance is probable. Neither the expiration date nor the maximum amount of potential payments for certain obligations is explicitly stated in the related agreements. Therefore, they have been estimated based on the types of obligations.
Tax indemnification related to unconsolidated WPD affiliates
8 2012 Two WPD unconsolidated affiliates were refinanced during 2005. Under the terms of the refinancing, WPD has indemnified the lender against certain tax and other liabilities.
Guarantee of a portion of an unconsolidated entity's debt
22 2018 Reflects principal payments only.
(a) Represents the estimated maximum potential amount of future payments that could be required to be made under the guarantee. (b) Other than the letters of credit, all guarantees of PPL Energy Supply, on a consolidated basis, also apply to PPL on a consolidated basis. Neither PPL nor PPL
Energy Supply is liable for obligations under guarantees provided by WPD, as the beneficiaries of the guarantees do not have recourse to such entities. PPL, PPL Energy Supply and PPL Electric and their subsidiaries provide other miscellaneous guarantees through contracts entered into in the normal course of business. These guarantees are primarily in the form of indemnification or warranties related to services or equipment and vary in duration. The amounts of these guarantees often are not explicitly stated, and the overall maximum amount of the obligation under such guarantees cannot be reasonably estimated. Historically, PPL, PPL Energy Supply and PPL Electric and their subsidiaries have not made any significant payments with respect to these types of
guarantees and the probability of payment/performance under these guarantees is remote. PPL, on behalf of itself and certain of its subsidiaries, maintains insurance that covers liability assumed under contract for bodily injury and property damage. The coverage requires a $4 million deductible per occurrence and provides maximum aggregate coverage of $150 million. This insurance may be applicable to obligations under certain of these contractual arrangements.
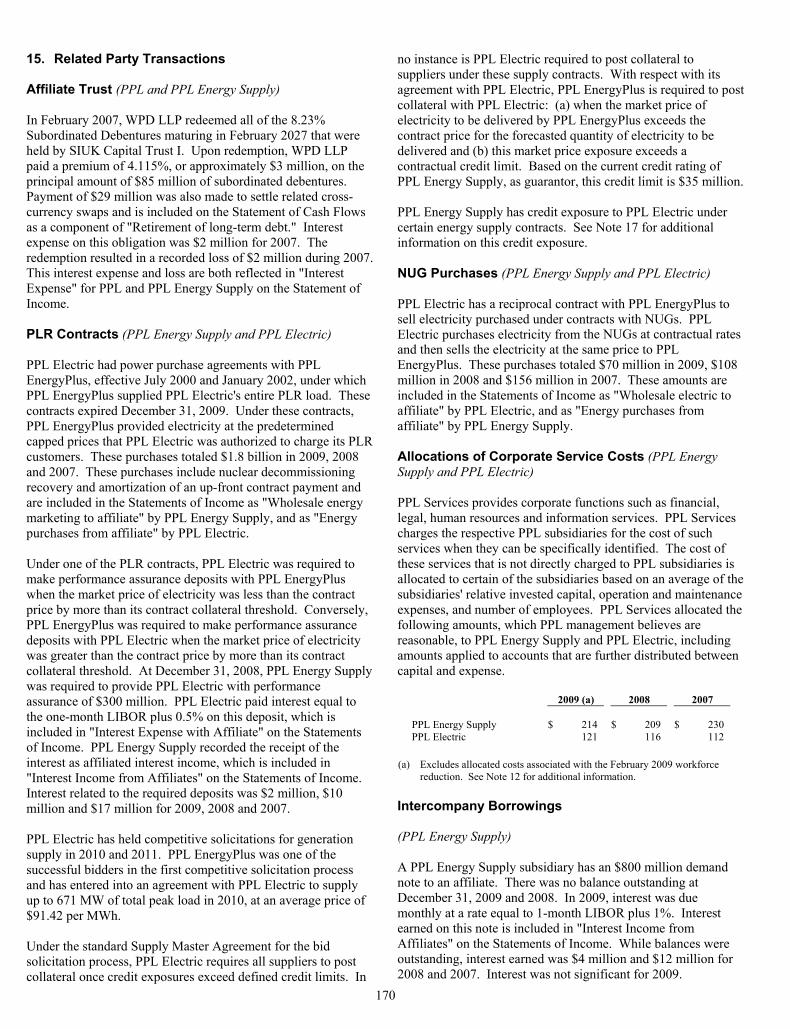
170
15. Related Party Transactions Affiliate Trust (PPL and PPL Energy Supply) In February 2007, WPD LLP redeemed all of the 8.23% Subordinated Debentures maturing in February 2027 that were held by SIUK Capital Trust I. Upon redemption, WPD LLP paid a premium of 4.115%, or approximately $3 million, on the principal amount of $85 million of subordinated debentures. Payment of $29 million was also made to settle related cross-currency swaps and is included on the Statement of Cash Flows as a component of "Retirement of long-term debt." Interest expense on this obligation was $2 million for 2007. The redemption resulted in a recorded loss of $2 million during 2007. This interest expense and loss are both reflected in "Interest Expense" for PPL and PPL Energy Supply on the Statement of Income. PLR Contracts (PPL Energy Supply and PPL Electric) PPL Electric had power purchase agreements with PPL EnergyPlus, effective July 2000 and January 2002, under which PPL EnergyPlus supplied PPL Electric's entire PLR load. These contracts expired December 31, 2009. Under these contracts, PPL EnergyPlus provided electricity at the predetermined capped prices that PPL Electric was authorized to charge its PLR customers. These purchases totaled $1.8 billion in 2009, 2008 and 2007. These purchases include nuclear decommissioning recovery and amortization of an up-front contract payment and are included in the Statements of Income as "Wholesale energy marketing to affiliate" by PPL Energy Supply, and as "Energy purchases from affiliate" by PPL Electric. Under one of the PLR contracts, PPL Electric was required to make performance assurance deposits with PPL EnergyPlus when the market price of electricity was less than the contract price by more than its contract collateral threshold. Conversely, PPL EnergyPlus was required to make performance assurance deposits with PPL Electric when the market price of electricity was greater than the contract price by more than its contract collateral threshold. At December 31, 2008, PPL Energy Supply was required to provide PPL Electric with performance assurance of $300 million. PPL Electric paid interest equal to the one-month LIBOR plus 0.5% on this deposit, which is included in "Interest Expense with Affiliate" on the Statements of Income. PPL Energy Supply recorded the receipt of the interest as affiliated interest income, which is included in "Interest Income from Affiliates" on the Statements of Income. Interest related to the required deposits was $2 million, $10 million and $17 million for 2009, 2008 and 2007. PPL Electric has held competitive solicitations for generation supply in 2010 and 2011. PPL EnergyPlus was one of the successful bidders in the first competitive solicitation process and has entered into an agreement with PPL Electric to supply up to 671 MW of total peak load in 2010, at an average price of $91.42 per MWh. Under the standard Supply Master Agreement for the bid solicitation process, PPL Electric requires all suppliers to post collateral once credit exposures exceed defined credit limits. In
no instance is PPL Electric required to post collateral to suppliers under these supply contracts. With respect with its agreement with PPL Electric, PPL EnergyPlus is required to post collateral with PPL Electric: (a) when the market price of electricity to be delivered by PPL EnergyPlus exceeds the contract price for the forecasted quantity of electricity to be delivered and (b) this market price exposure exceeds a contractual credit limit. Based on the current credit rating of PPL Energy Supply, as guarantor, this credit limit is $35 million. PPL Energy Supply has credit exposure to PPL Electric under certain energy supply contracts. See Note 17 for additional information on this credit exposure. NUG Purchases (PPL Energy Supply and PPL Electric) PPL Electric has a reciprocal contract with PPL EnergyPlus to sell electricity purchased under contracts with NUGs. PPL Electric purchases electricity from the NUGs at contractual rates and then sells the electricity at the same price to PPL EnergyPlus. These purchases totaled $70 million in 2009, $108 million in 2008 and $156 million in 2007. These amounts are included in the Statements of Income as "Wholesale electric to affiliate" by PPL Electric, and as "Energy purchases from affiliate" by PPL Energy Supply. Allocations of Corporate Service Costs (PPL Energy Supply and PPL Electric) PPL Services provides corporate functions such as financial, legal, human resources and information services. PPL Services charges the respective PPL subsidiaries for the cost of such services when they can be specifically identified. The cost of these services that is not directly charged to PPL subsidiaries is allocated to certain of the subsidiaries based on an average of the subsidiaries' relative invested capital, operation and maintenance expenses, and number of employees. PPL Services allocated the following amounts, which PPL management believes are reasonable, to PPL Energy Supply and PPL Electric, including amounts applied to accounts that are further distributed between capital and expense. 2009 (a) 2008 2007
PPL Energy Supply $ 214 $ 209 $ 230 PPL Electric 121 116 112
(a) Excludes allocated costs associated with the February 2009 workforce
reduction. See Note 12 for additional information. Intercompany Borrowings (PPL Energy Supply) A PPL Energy Supply subsidiary has an $800 million demand note to an affiliate. There was no balance outstanding at December 31, 2009 and 2008. In 2009, interest was due monthly at a rate equal to 1-month LIBOR plus 1%. Interest earned on this note is included in "Interest Income from Affiliates" on the Statements of Income. While balances were outstanding, interest earned was $4 million and $12 million for 2008 and 2007. Interest was not significant for 2009.
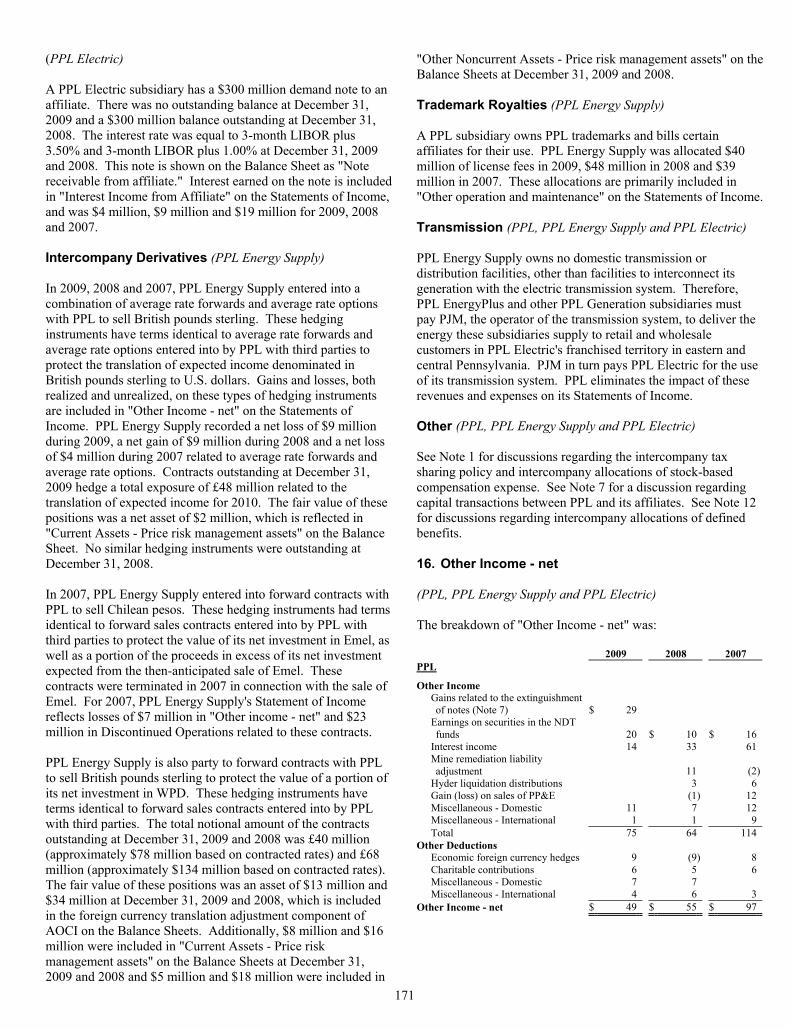
171
(PPL Electric) A PPL Electric subsidiary has a $300 million demand note to an affiliate. There was no outstanding balance at December 31, 2009 and a $300 million balance outstanding at December 31, 2008. The interest rate was equal to 3-month LIBOR plus 3.50% and 3-month LIBOR plus 1.00% at December 31, 2009 and 2008. This note is shown on the Balance Sheet as "Note receivable from affiliate." Interest earned on the note is included in "Interest Income from Affiliate" on the Statements of Income, and was $4 million, $9 million and $19 million for 2009, 2008 and 2007. Intercompany Derivatives (PPL Energy Supply) In 2009, 2008 and 2007, PPL Energy Supply entered into a combination of average rate forwards and average rate options with PPL to sell British pounds sterling. These hedging instruments have terms identical to average rate forwards and average rate options entered into by PPL with third parties to protect the translation of expected income denominated in British pounds sterling to U.S. dollars. Gains and losses, both realized and unrealized, on these types of hedging instruments are included in "Other Income - net" on the Statements of Income. PPL Energy Supply recorded a net loss of $9 million during 2009, a net gain of $9 million during 2008 and a net loss of $4 million during 2007 related to average rate forwards and average rate options. Contracts outstanding at December 31, 2009 hedge a total exposure of £48 million related to the translation of expected income for 2010. The fair value of these positions was a net asset of $2 million, which is reflected in "Current Assets - Price risk management assets" on the Balance Sheet. No similar hedging instruments were outstanding at December 31, 2008. In 2007, PPL Energy Supply entered into forward contracts with PPL to sell Chilean pesos. These hedging instruments had terms identical to forward sales contracts entered into by PPL with third parties to protect the value of its net investment in Emel, as well as a portion of the proceeds in excess of its net investment expected from the then-anticipated sale of Emel. These contracts were terminated in 2007 in connection with the sale of Emel. For 2007, PPL Energy Supply's Statement of Income reflects losses of $7 million in "Other income - net" and $23 million in Discontinued Operations related to these contracts. PPL Energy Supply is also party to forward contracts with PPL to sell British pounds sterling to protect the value of a portion of its net investment in WPD. These hedging instruments have terms identical to forward sales contracts entered into by PPL with third parties. The total notional amount of the contracts outstanding at December 31, 2009 and 2008 was £40 million (approximately $78 million based on contracted rates) and £68 million (approximately $134 million based on contracted rates). The fair value of these positions was an asset of $13 million and $34 million at December 31, 2009 and 2008, which is included in the foreign currency translation adjustment component of AOCI on the Balance Sheets. Additionally, $8 million and $16 million were included in "Current Assets - Price risk management assets" on the Balance Sheets at December 31, 2009 and 2008 and $5 million and $18 million were included in
"Other Noncurrent Assets - Price risk management assets" on the Balance Sheets at December 31, 2009 and 2008. Trademark Royalties (PPL Energy Supply) A PPL subsidiary owns PPL trademarks and bills certain affiliates for their use. PPL Energy Supply was allocated $40 million of license fees in 2009, $48 million in 2008 and $39 million in 2007. These allocations are primarily included in "Other operation and maintenance" on the Statements of Income. Transmission (PPL, PPL Energy Supply and PPL Electric) PPL Energy Supply owns no domestic transmission or distribution facilities, other than facilities to interconnect its generation with the electric transmission system. Therefore, PPL EnergyPlus and other PPL Generation subsidiaries must pay PJM, the operator of the transmission system, to deliver the energy these subsidiaries supply to retail and wholesale customers in PPL Electric's franchised territory in eastern and central Pennsylvania. PJM in turn pays PPL Electric for the use of its transmission system. PPL eliminates the impact of these revenues and expenses on its Statements of Income. Other (PPL, PPL Energy Supply and PPL Electric) See Note 1 for discussions regarding the intercompany tax sharing policy and intercompany allocations of stock-based compensation expense. See Note 7 for a discussion regarding capital transactions between PPL and its affiliates. See Note 12 for discussions regarding intercompany allocations of defined benefits. 16. Other Income - net (PPL, PPL Energy Supply and PPL Electric) The breakdown of "Other Income - net" was: 2009 2008 2007 PPL
Other Income Gains related to the extinguishment of notes (Note 7) $ 29
Earnings on securities in the NDT funds 20 $ 10 $ 16
Interest income 14 33 61 Mine remediation liability adjustment 11 (2)
Hyder liquidation distributions 3 6 Gain (loss) on sales of PP&E (1) 12 Miscellaneous - Domestic 11 7 12 Miscellaneous - International 1 1 9 Total 75 64 114
Other Deductions Economic foreign currency hedges 9 (9) 8 Charitable contributions 6 5 6 Miscellaneous - Domestic 7 7 Miscellaneous - International 4 6 3
Other Income - net $ 49 $ 55 $ 97
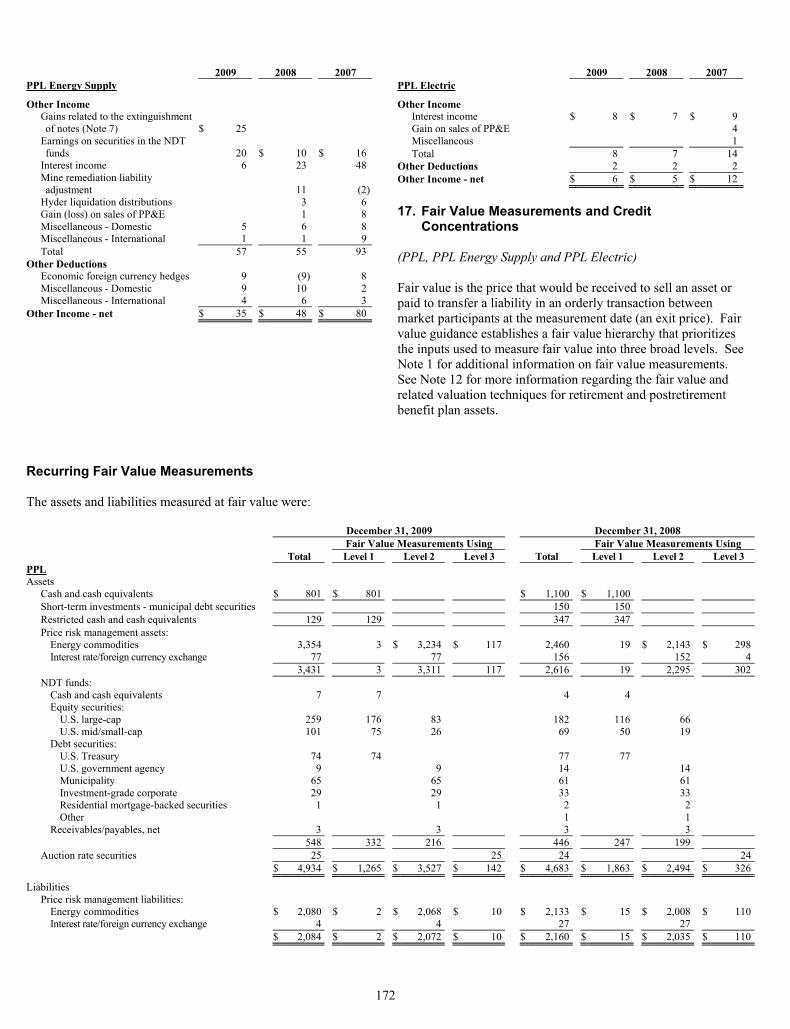
172
2009 2008 2007 PPL Energy Supply
Other Income Gains related to the extinguishment of notes (Note 7) $ 25
Earnings on securities in the NDT funds 20 $ 10 $ 16
Interest income 6 23 48 Mine remediation liability adjustment 11 (2)
Hyder liquidation distributions 3 6 Gain (loss) on sales of PP&E 1 8 Miscellaneous - Domestic 5 6 8 Miscellaneous - International 1 1 9 Total 57 55 93
Other Deductions Economic foreign currency hedges 9 (9) 8 Miscellaneous - Domestic 9 10 2 Miscellaneous - International 4 6 3
Other Income - net $ 35 $ 48 $ 80
2009 2008 2007 PPL Electric
Other Income Interest income $ 8 $ 7 $ 9 Gain on sales of PP&E 4 Miscellaneous 1 Total 8 7 14
Other Deductions 2 2 2 Other Income - net $ 6 $ 5 $ 12
17. Fair Value Measurements and Credit
Concentrations (PPL, PPL Energy Supply and PPL Electric) Fair value is the price that would be received to sell an asset or paid to transfer a liability in an orderly transaction between market participants at the measurement date (an exit price). Fair value guidance establishes a fair value hierarchy that prioritizes the inputs used to measure fair value into three broad levels. See Note 1 for additional information on fair value measurements. See Note 12 for more information regarding the fair value and related valuation techniques for retirement and postretirement benefit plan assets.
Recurring Fair Value Measurements The assets and liabilities measured at fair value were: December 31, 2009 December 31, 2008 Fair Value Measurements Using Fair Value Measurements Using Total Level 1 Level 2 Level 3 Total Level 1 Level 2 Level 3 PPL Assets
Cash and cash equivalents $ 801 $ 801 $ 1,100 $ 1,100 Short-term investments - municipal debt securities 150 150 Restricted cash and cash equivalents 129 129 347 347 Price risk management assets:
Energy commodities 3,354 3 $ 3,234 $ 117 2,460 19 $ 2,143 $ 298Interest rate/foreign currency exchange 77 77 156 152 4
3,431 3 3,311 117 2,616 19 2,295 302NDT funds:
Cash and cash equivalents 7 7 4 4 Equity securities:
U.S. large-cap 259 176 83 182 116 66 U.S. mid/small-cap 101 75 26 69 50 19
Debt securities: U.S. Treasury 74 74 77 77 U.S. government agency 9 9 14 14 Municipality 65 65 61 61 Investment-grade corporate 29 29 33 33 Residential mortgage-backed securities 1 1 2 2 Other 1 1
Receivables/payables, net 3 3 3 3 548 332 216 446 247 199
Auction rate securities 25 25 24 24 $ 4,934 $ 1,265 $ 3,527 $ 142 $ 4,683 $ 1,863 $ 2,494 $ 326
Liabilities Price risk management liabilities:
Energy commodities $ 2,080 $ 2 $ 2,068 $ 10 $ 2,133 $ 15 $ 2,008 $ 110Interest rate/foreign currency exchange 4 4 27 27
$ 2,084 $ 2 $ 2,072 $ 10 $ 2,160 $ 15 $ 2,035 $ 110
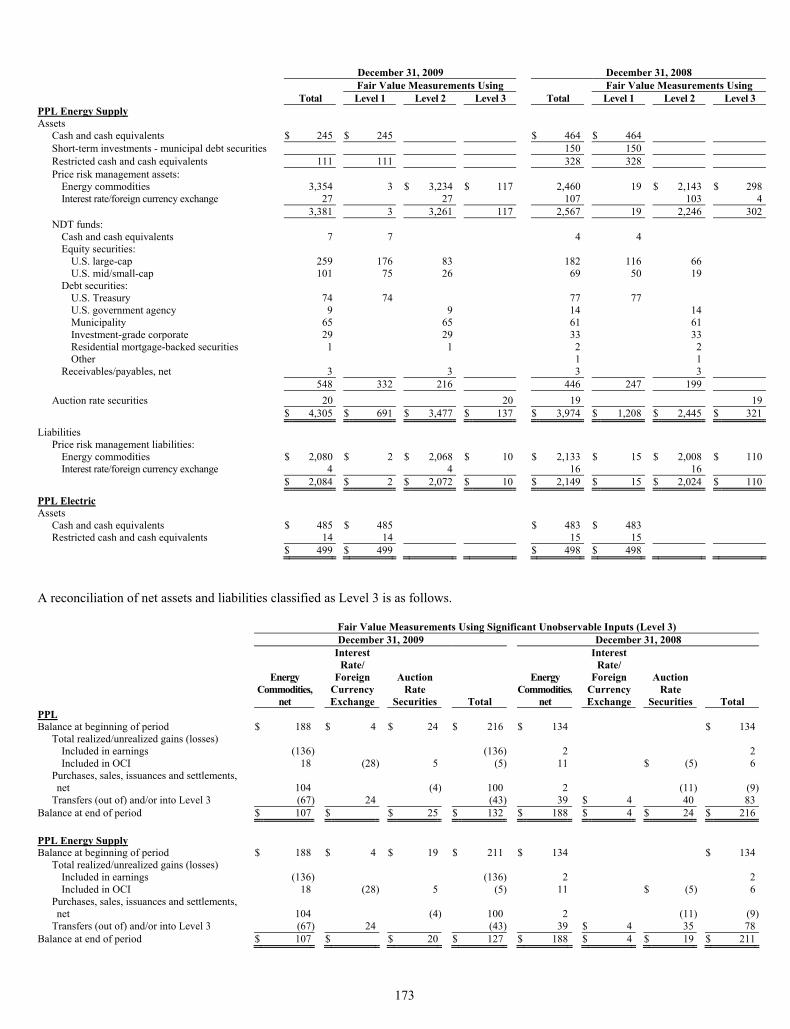
173
December 31, 2009 December 31, 2008 Fair Value Measurements Using Fair Value Measurements Using Total Level 1 Level 2 Level 3 Total Level 1 Level 2 Level 3 PPL Energy Supply Assets
Cash and cash equivalents $ 245 $ 245 $ 464 $ 464 Short-term investments - municipal debt securities 150 150 Restricted cash and cash equivalents 111 111 328 328 Price risk management assets:
Energy commodities 3,354 3 $ 3,234 $ 117 2,460 19 $ 2,143 $ 298Interest rate/foreign currency exchange 27 27 107 103 4
3,381 3 3,261 117 2,567 19 2,246 302NDT funds:
Cash and cash equivalents 7 7 4 4 Equity securities:
U.S. large-cap 259 176 83 182 116 66 U.S. mid/small-cap 101 75 26 69 50 19
Debt securities: U.S. Treasury 74 74 77 77 U.S. government agency 9 9 14 14 Municipality 65 65 61 61 Investment-grade corporate 29 29 33 33 Residential mortgage-backed securities 1 1 2 2 Other 1 1
Receivables/payables, net 3 3 3 3 548 332 216 446 247 199
Auction rate securities 20 20 19 19 $ 4,305 $ 691 $ 3,477 $ 137 $ 3,974 $ 1,208 $ 2,445 $ 321
Liabilities Price risk management liabilities:
Energy commodities $ 2,080 $ 2 $ 2,068 $ 10 $ 2,133 $ 15 $ 2,008 $ 110Interest rate/foreign currency exchange 4 4 16 16
$ 2,084 $ 2 $ 2,072 $ 10 $ 2,149 $ 15 $ 2,024 $ 110
PPL Electric Assets
Cash and cash equivalents $ 485 $ 485 $ 483 $ 483 Restricted cash and cash equivalents 14 14 15 15 $ 499 $ 499 $ 498 $ 498
A reconciliation of net assets and liabilities classified as Level 3 is as follows. Fair Value Measurements Using Significant Unobservable Inputs (Level 3)
December 31, 2009 December 31, 2008
Energy Commodities,
net
Interest Rate/
Foreign Currency Exchange
Auction Rate
Securities Total
Energy Commodities,
net
Interest Rate/
Foreign Currency Exchange
Auction Rate
Securities Total PPL Balance at beginning of period $ 188 $ 4 $ 24 $ 216 $ 134 $ 134
Total realized/unrealized gains (losses) Included in earnings (136) (136) 2 2Included in OCI 18 (28) 5 (5) 11 $ (5) 6
Purchases, sales, issuances and settlements, net 104 (4) 100 2 (11) (9)
Transfers (out of) and/or into Level 3 (67) 24 (43) 39 $ 4 40 83Balance at end of period $ 107 $ $ 25 $ 132 $ 188 $ 4 $ 24 $ 216 PPL Energy Supply Balance at beginning of period $ 188 $ 4 $ 19 $ 211 $ 134 $ 134
Total realized/unrealized gains (losses) Included in earnings (136) (136) 2 2Included in OCI 18 (28) 5 (5) 11 $ (5) 6
Purchases, sales, issuances and settlements, net 104 (4) 100 2 (11) (9)
Transfers (out of) and/or into Level 3 (67) 24 (43) 39 $ 4 35 78Balance at end of period $ 107 $ $ 20 $ 127 $ 188 $ 4 $ 19 $ 211
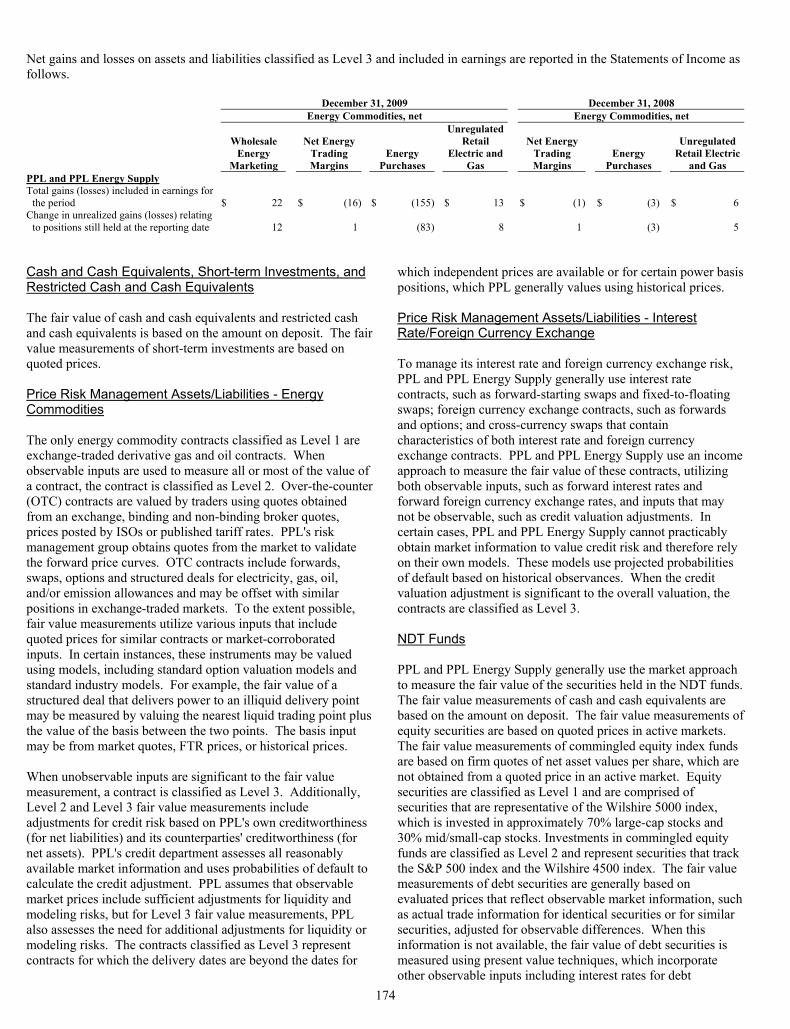
174
Net gains and losses on assets and liabilities classified as Level 3 and included in earnings are reported in the Statements of Income as follows. December 31, 2009 December 31, 2008 Energy Commodities, net Energy Commodities, net
Wholesale Energy
Marketing
Net Energy Trading Margins
Energy Purchases
Unregulated Retail
Electric and Gas
Net Energy Trading Margins
Energy Purchases
Unregulated Retail Electric
and Gas PPL and PPL Energy Supply Total gains (losses) included in earnings for
the period $ 22 $ (16) $ (155) $ 13 $ (1) $ (3) $ 6 Change in unrealized gains (losses) relating
to positions still held at the reporting date 12 1 (83) 8 1 (3) 5 Cash and Cash Equivalents, Short-term Investments, and Restricted Cash and Cash Equivalents The fair value of cash and cash equivalents and restricted cash and cash equivalents is based on the amount on deposit. The fair value measurements of short-term investments are based on quoted prices. Price Risk Management Assets/Liabilities - Energy Commodities The only energy commodity contracts classified as Level 1 are exchange-traded derivative gas and oil contracts. When observable inputs are used to measure all or most of the value of a contract, the contract is classified as Level 2. Over-the-counter (OTC) contracts are valued by traders using quotes obtained from an exchange, binding and non-binding broker quotes, prices posted by ISOs or published tariff rates. PPL's risk management group obtains quotes from the market to validate the forward price curves. OTC contracts include forwards, swaps, options and structured deals for electricity, gas, oil, and/or emission allowances and may be offset with similar positions in exchange-traded markets. To the extent possible, fair value measurements utilize various inputs that include quoted prices for similar contracts or market-corroborated inputs. In certain instances, these instruments may be valued using models, including standard option valuation models and standard industry models. For example, the fair value of a structured deal that delivers power to an illiquid delivery point may be measured by valuing the nearest liquid trading point plus the value of the basis between the two points. The basis input may be from market quotes, FTR prices, or historical prices. When unobservable inputs are significant to the fair value measurement, a contract is classified as Level 3. Additionally, Level 2 and Level 3 fair value measurements include adjustments for credit risk based on PPL's own creditworthiness (for net liabilities) and its counterparties' creditworthiness (for net assets). PPL's credit department assesses all reasonably available market information and uses probabilities of default to calculate the credit adjustment. PPL assumes that observable market prices include sufficient adjustments for liquidity and modeling risks, but for Level 3 fair value measurements, PPL also assesses the need for additional adjustments for liquidity or modeling risks. The contracts classified as Level 3 represent contracts for which the delivery dates are beyond the dates for
which independent prices are available or for certain power basis positions, which PPL generally values using historical prices. Price Risk Management Assets/Liabilities - Interest Rate/Foreign Currency Exchange To manage its interest rate and foreign currency exchange risk, PPL and PPL Energy Supply generally use interest rate contracts, such as forward-starting swaps and fixed-to-floating swaps; foreign currency exchange contracts, such as forwards and options; and cross-currency swaps that contain characteristics of both interest rate and foreign currency exchange contracts. PPL and PPL Energy Supply use an income approach to measure the fair value of these contracts, utilizing both observable inputs, such as forward interest rates and forward foreign currency exchange rates, and inputs that may not be observable, such as credit valuation adjustments. In certain cases, PPL and PPL Energy Supply cannot practicably obtain market information to value credit risk and therefore rely on their own models. These models use projected probabilities of default based on historical observances. When the credit valuation adjustment is significant to the overall valuation, the contracts are classified as Level 3. NDT Funds PPL and PPL Energy Supply generally use the market approach to measure the fair value of the securities held in the NDT funds. The fair value measurements of cash and cash equivalents are based on the amount on deposit. The fair value measurements of equity securities are based on quoted prices in active markets. The fair value measurements of commingled equity index funds are based on firm quotes of net asset values per share, which are not obtained from a quoted price in an active market. Equity securities are classified as Level 1 and are comprised of securities that are representative of the Wilshire 5000 index, which is invested in approximately 70% large-cap stocks and 30% mid/small-cap stocks. Investments in commingled equity funds are classified as Level 2 and represent securities that track the S&P 500 index and the Wilshire 4500 index. The fair value measurements of debt securities are generally based on evaluated prices that reflect observable market information, such as actual trade information for identical securities or for similar securities, adjusted for observable differences. When this information is not available, the fair value of debt securities is measured using present value techniques, which incorporate other observable inputs including interest rates for debt
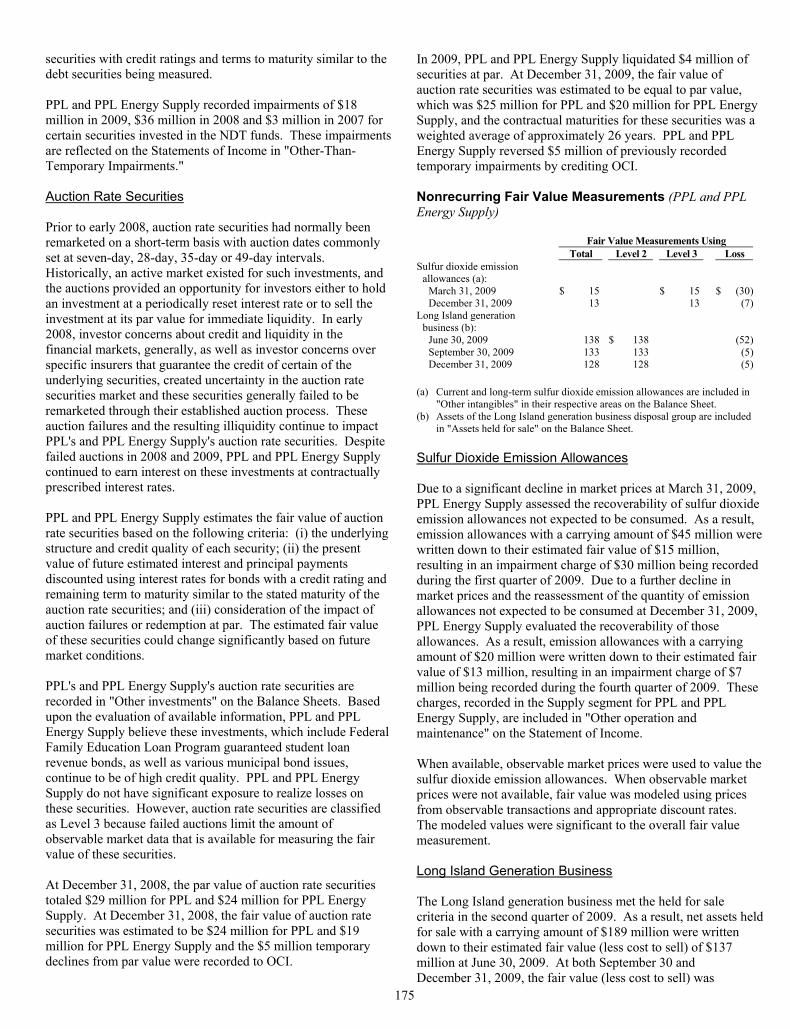
175
securities with credit ratings and terms to maturity similar to the debt securities being measured. PPL and PPL Energy Supply recorded impairments of $18 million in 2009, $36 million in 2008 and $3 million in 2007 for certain securities invested in the NDT funds. These impairments are reflected on the Statements of Income in "Other-Than-Temporary Impairments." Auction Rate Securities Prior to early 2008, auction rate securities had normally been remarketed on a short-term basis with auction dates commonly set at seven-day, 28-day, 35-day or 49-day intervals. Historically, an active market existed for such investments, and the auctions provided an opportunity for investors either to hold an investment at a periodically reset interest rate or to sell the investment at its par value for immediate liquidity. In early 2008, investor concerns about credit and liquidity in the financial markets, generally, as well as investor concerns over specific insurers that guarantee the credit of certain of the underlying securities, created uncertainty in the auction rate securities market and these securities generally failed to be remarketed through their established auction process. These auction failures and the resulting illiquidity continue to impact PPL's and PPL Energy Supply's auction rate securities. Despite failed auctions in 2008 and 2009, PPL and PPL Energy Supply continued to earn interest on these investments at contractually prescribed interest rates. PPL and PPL Energy Supply estimates the fair value of auction rate securities based on the following criteria: (i) the underlying structure and credit quality of each security; (ii) the present value of future estimated interest and principal payments discounted using interest rates for bonds with a credit rating and remaining term to maturity similar to the stated maturity of the auction rate securities; and (iii) consideration of the impact of auction failures or redemption at par. The estimated fair value of these securities could change significantly based on future market conditions. PPL's and PPL Energy Supply's auction rate securities are recorded in "Other investments" on the Balance Sheets. Based upon the evaluation of available information, PPL and PPL Energy Supply believe these investments, which include Federal Family Education Loan Program guaranteed student loan revenue bonds, as well as various municipal bond issues, continue to be of high credit quality. PPL and PPL Energy Supply do not have significant exposure to realize losses on these securities. However, auction rate securities are classified as Level 3 because failed auctions limit the amount of observable market data that is available for measuring the fair value of these securities. At December 31, 2008, the par value of auction rate securities totaled $29 million for PPL and $24 million for PPL Energy Supply. At December 31, 2008, the fair value of auction rate securities was estimated to be $24 million for PPL and $19 million for PPL Energy Supply and the $5 million temporary declines from par value were recorded to OCI.
In 2009, PPL and PPL Energy Supply liquidated $4 million of securities at par. At December 31, 2009, the fair value of auction rate securities was estimated to be equal to par value, which was $25 million for PPL and $20 million for PPL Energy Supply, and the contractual maturities for these securities was a weighted average of approximately 26 years. PPL and PPL Energy Supply reversed $5 million of previously recorded temporary impairments by crediting OCI. Nonrecurring Fair Value Measurements (PPL and PPL Energy Supply)
Fair Value Measurements Using Total Level 2 Level 3 Loss
Sulfur dioxide emission allowances (a):
March 31, 2009 $ 15 $ 15 $ (30)December 31, 2009 13 13 (7)
Long Island generation business (b):
June 30, 2009 138 $ 138 (52)September 30, 2009 133 133 (5)December 31, 2009 128 128 (5)
(a) Current and long-term sulfur dioxide emission allowances are included in
"Other intangibles" in their respective areas on the Balance Sheet. (b) Assets of the Long Island generation business disposal group are included
in "Assets held for sale" on the Balance Sheet. Sulfur Dioxide Emission Allowances Due to a significant decline in market prices at March 31, 2009, PPL Energy Supply assessed the recoverability of sulfur dioxide emission allowances not expected to be consumed. As a result, emission allowances with a carrying amount of $45 million were written down to their estimated fair value of $15 million, resulting in an impairment charge of $30 million being recorded during the first quarter of 2009. Due to a further decline in market prices and the reassessment of the quantity of emission allowances not expected to be consumed at December 31, 2009, PPL Energy Supply evaluated the recoverability of those allowances. As a result, emission allowances with a carrying amount of $20 million were written down to their estimated fair value of $13 million, resulting in an impairment charge of $7 million being recorded during the fourth quarter of 2009. These charges, recorded in the Supply segment for PPL and PPL Energy Supply, are included in "Other operation and maintenance" on the Statement of Income. When available, observable market prices were used to value the sulfur dioxide emission allowances. When observable market prices were not available, fair value was modeled using prices from observable transactions and appropriate discount rates. The modeled values were significant to the overall fair value measurement. Long Island Generation Business The Long Island generation business met the held for sale criteria in the second quarter of 2009. As a result, net assets held for sale with a carrying amount of $189 million were written down to their estimated fair value (less cost to sell) of $137 million at June 30, 2009. At both September 30 and December 31, 2009, the fair value (less cost to sell) was
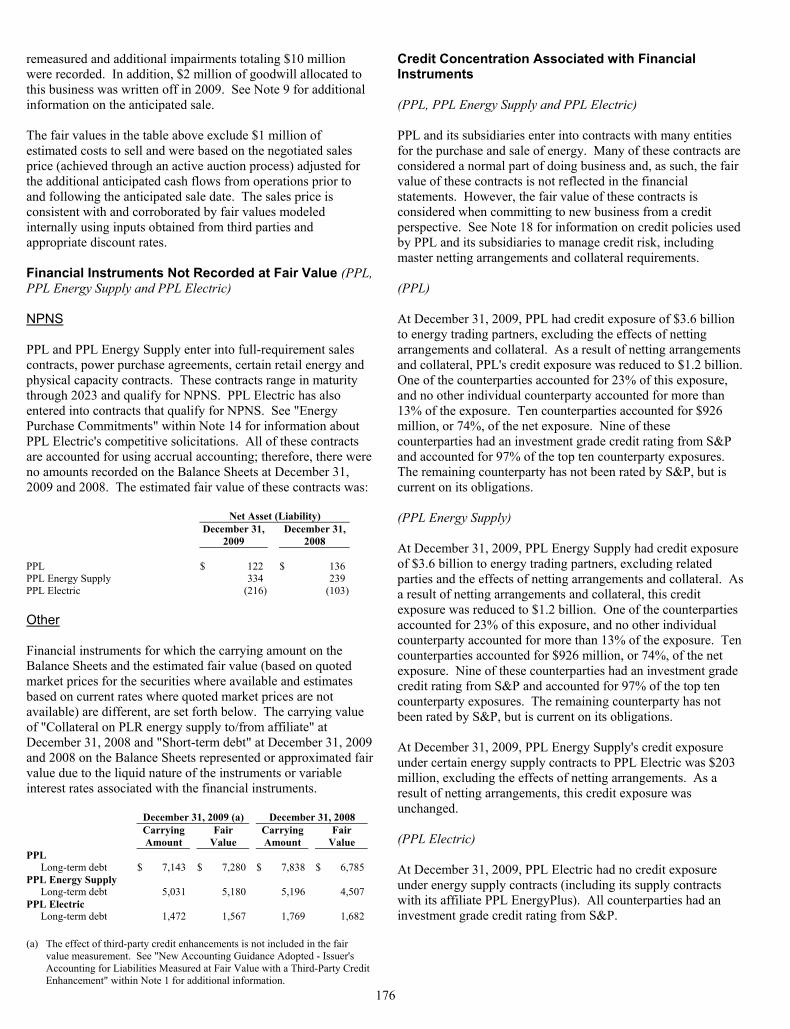
176
remeasured and additional impairments totaling $10 million were recorded. In addition, $2 million of goodwill allocated to this business was written off in 2009. See Note 9 for additional information on the anticipated sale. The fair values in the table above exclude $1 million of estimated costs to sell and were based on the negotiated sales price (achieved through an active auction process) adjusted for the additional anticipated cash flows from operations prior to and following the anticipated sale date. The sales price is consistent with and corroborated by fair values modeled internally using inputs obtained from third parties and appropriate discount rates. Financial Instruments Not Recorded at Fair Value (PPL, PPL Energy Supply and PPL Electric) NPNS PPL and PPL Energy Supply enter into full-requirement sales contracts, power purchase agreements, certain retail energy and physical capacity contracts. These contracts range in maturity through 2023 and qualify for NPNS. PPL Electric has also entered into contracts that qualify for NPNS. See "Energy Purchase Commitments" within Note 14 for information about PPL Electric's competitive solicitations. All of these contracts are accounted for using accrual accounting; therefore, there were no amounts recorded on the Balance Sheets at December 31, 2009 and 2008. The estimated fair value of these contracts was: Net Asset (Liability)
December 31,
2009 December 31,
2008 PPL $ 122 $ 136PPL Energy Supply 334 239PPL Electric (216) (103) Other Financial instruments for which the carrying amount on the Balance Sheets and the estimated fair value (based on quoted market prices for the securities where available and estimates based on current rates where quoted market prices are not available) are different, are set forth below. The carrying value of "Collateral on PLR energy supply to/from affiliate" at December 31, 2008 and "Short-term debt" at December 31, 2009 and 2008 on the Balance Sheets represented or approximated fair value due to the liquid nature of the instruments or variable interest rates associated with the financial instruments.
December 31, 2009 (a) December 31, 2008
Carrying Amount
Fair Value
Carrying Amount
Fair Value
PPL Long-term debt $ 7,143 $ 7,280 $ 7,838 $ 6,785
PPL Energy Supply Long-term debt 5,031 5,180 5,196 4,507
PPL Electric Long-term debt 1,472 1,567 1,769 1,682
(a) The effect of third-party credit enhancements is not included in the fair
value measurement. See "New Accounting Guidance Adopted - Issuer's Accounting for Liabilities Measured at Fair Value with a Third-Party Credit Enhancement" within Note 1 for additional information.
Credit Concentration Associated with Financial Instruments (PPL, PPL Energy Supply and PPL Electric) PPL and its subsidiaries enter into contracts with many entities for the purchase and sale of energy. Many of these contracts are considered a normal part of doing business and, as such, the fair value of these contracts is not reflected in the financial statements. However, the fair value of these contracts is considered when committing to new business from a credit perspective. See Note 18 for information on credit policies used by PPL and its subsidiaries to manage credit risk, including master netting arrangements and collateral requirements. (PPL) At December 31, 2009, PPL had credit exposure of $3.6 billion to energy trading partners, excluding the effects of netting arrangements and collateral. As a result of netting arrangements and collateral, PPL's credit exposure was reduced to $1.2 billion. One of the counterparties accounted for 23% of this exposure, and no other individual counterparty accounted for more than 13% of the exposure. Ten counterparties accounted for $926 million, or 74%, of the net exposure. Nine of these counterparties had an investment grade credit rating from S&P and accounted for 97% of the top ten counterparty exposures. The remaining counterparty has not been rated by S&P, but is current on its obligations. (PPL Energy Supply) At December 31, 2009, PPL Energy Supply had credit exposure of $3.6 billion to energy trading partners, excluding related parties and the effects of netting arrangements and collateral. As a result of netting arrangements and collateral, this credit exposure was reduced to $1.2 billion. One of the counterparties accounted for 23% of this exposure, and no other individual counterparty accounted for more than 13% of the exposure. Ten counterparties accounted for $926 million, or 74%, of the net exposure. Nine of these counterparties had an investment grade credit rating from S&P and accounted for 97% of the top ten counterparty exposures. The remaining counterparty has not been rated by S&P, but is current on its obligations. At December 31, 2009, PPL Energy Supply's credit exposure under certain energy supply contracts to PPL Electric was $203 million, excluding the effects of netting arrangements. As a result of netting arrangements, this credit exposure was unchanged. (PPL Electric) At December 31, 2009, PPL Electric had no credit exposure under energy supply contracts (including its supply contracts with its affiliate PPL EnergyPlus). All counterparties had an investment grade credit rating from S&P.

177
18. Derivative Instruments and Hedging Activities Risk Management Objectives (PPL, PPL Energy Supply and PPL Electric) PPL has a risk management policy approved by the Board of Directors to manage market risk and counterparty credit risk. The RMC, comprised of senior management and chaired by the Chief Risk Officer, oversees the risk management function. Key risk control activities designed to ensure compliance with the risk policy and detailed programs include, but are not limited to, credit review and approval, validation of transactions and market prices, verification of risk and transaction limits, VaR analyses, portfolio stress tests, gross margin at risk analyses, sensitivity analyses, and daily portfolio reporting, including open positions, determinations of fair value, and other risk management metrics. Market risk is the potential loss PPL and its subsidiaries may incur as a result of price changes associated with a particular financial or commodity instrument. PPL and PPL Energy Supply are exposed to market risk from: • commodity price basis and volumetric risks for energy and
energy-related products associated with the sale of electricity from its generating assets and other electricity marketing activities and the purchase of fuel and fuel-related commodities for generating assets, as well as for proprietary trading activities;
• interest rate and price risk associated with debt used to finance operations, as well as debt and equity securities in NDT funds and defined benefit plans; and
• foreign currency exchange rate risk associated with investments in U.K. affiliates, as well as purchases of equipment in currencies other than U.S. dollars.
PPL and PPL Energy Supply utilize forward contracts, futures contracts, options, swaps and structured deals such as tolling agreements as part of the risk management strategy to minimize unanticipated fluctuations in earnings caused by changes in commodity prices, interest rates and foreign currency exchange rates. All derivatives are recognized on the balance sheet at their fair value, unless they qualify for NPNS. PPL and PPL Electric are exposed to market price and volumetric risks from PPL Electric's obligation as the PLR to its customers. It has mitigated that risk with the fixed-price PLR agreement with PPL EnergyPlus, which expired at the end of 2009, and by entering into supply agreements for its customers for 2010 and 2011. Credit risk is the potential loss PPL and its subsidiaries may incur due to a counterparty's non-performance, including defaults on payments and energy commodity deliveries. PPL and PPL Energy Supply are exposed to credit risk from: • commodity derivatives with its energy trading partners, which
include other energy companies, fuel suppliers, and financial institutions;
• interest rate derivatives with financial institutions; and
• foreign currency derivatives with financial institutions. PPL and PPL Electric are exposed to credit risk from PPL Electric's supply agreements for its customers for 2010 and 2011. The majority of the credit risk stems from PPL Energy Supply's and PPL Electric's commodity derivatives for multi-year contracts for energy sales and purchases. If the counterparties fail to perform their obligations under such contracts and PPL and its subsidiaries could not replace the sales or purchases at the same prices as those under the defaulted contracts, PPL would incur financial losses. Those losses would be recognized immediately or through lower revenues or higher costs in future years, depending on the accounting treatment for the defaulted contracts. PPL and its subsidiaries have credit policies to manage their credit risk, including the use of an established credit approval process, daily monitoring of counterparty positions, and the use of master netting agreements. These agreements generally include credit mitigation provisions, such as margin, prepayment or collateral requirements. PPL and its subsidiaries may request the additional credit assurance, in certain circumstances, in the event that the counterparties' credit ratings fall below investment grade or their exposures exceed an established credit limit. See Note 17 for credit concentration associated with financial instruments. PPL's and PPL Energy Supply's obligation to return counterparty cash collateral under master netting arrangements was $355 million and $22 million at December 31, 2009 and 2008. PPL Electric had no obligation to return cash collateral to PPL Energy Supply under master netting arrangements at December 31, 2009 and an obligation of $300 million at December 31, 2008. See Note 15 for additional information. At December 31, 2009, PPL, PPL Energy Supply and PPL Electric had not posted any cash collateral under master netting arrangements. At December 31, 2008, PPL and PPL Electric had not posted any cash collateral under master netting arrangements and PPL Energy Supply only had posted the $300 million noted above. Commodity Price Risk (Non-trading) (PPL and PPL Energy Supply) Commodity price and basis risks are among PPL's and PPL Energy Supply's most significant risks due to the level of investment that PPL and PPL Energy Supply maintain in their generation assets, as well as the extent of their marketing and proprietary trading activities. Several factors influence price levels and volatilities. These factors include, but are not limited to, seasonal changes in demand, weather conditions, available generating assets within regions, transportation availability and reliability within and between regions, market liquidity, and the nature and extent of current and potential federal and state regulations.
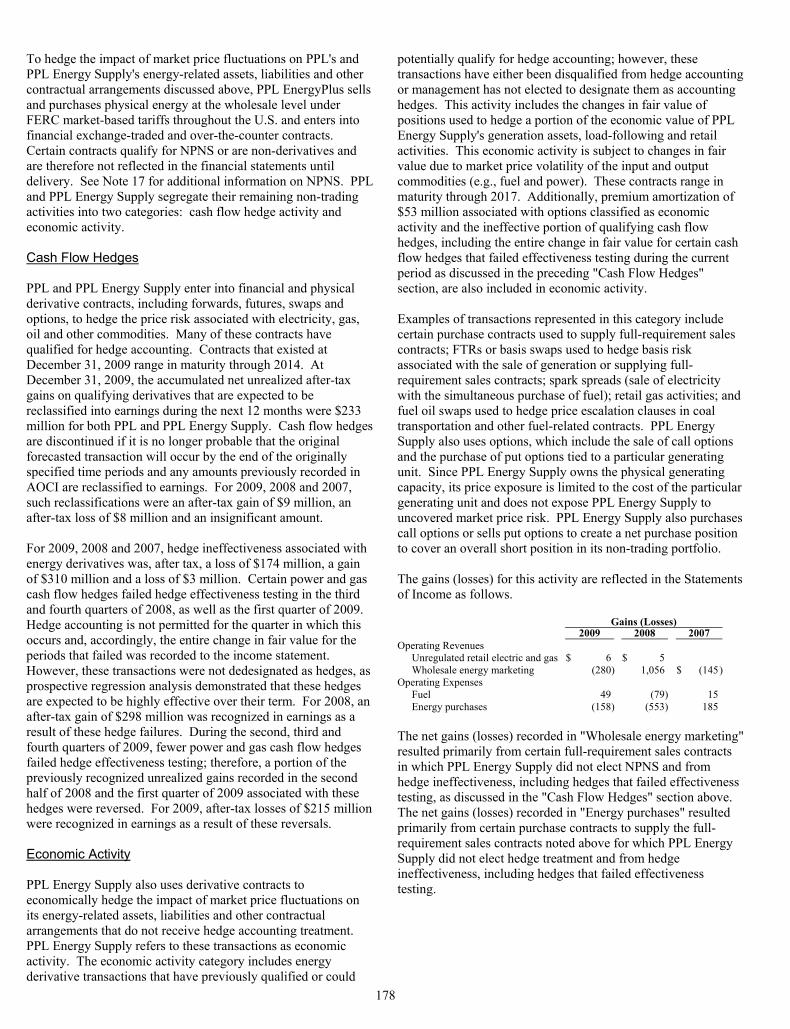
178
To hedge the impact of market price fluctuations on PPL's and PPL Energy Supply's energy-related assets, liabilities and other contractual arrangements discussed above, PPL EnergyPlus sells and purchases physical energy at the wholesale level under FERC market-based tariffs throughout the U.S. and enters into financial exchange-traded and over-the-counter contracts. Certain contracts qualify for NPNS or are non-derivatives and are therefore not reflected in the financial statements until delivery. See Note 17 for additional information on NPNS. PPL and PPL Energy Supply segregate their remaining non-trading activities into two categories: cash flow hedge activity and economic activity. Cash Flow Hedges PPL and PPL Energy Supply enter into financial and physical derivative contracts, including forwards, futures, swaps and options, to hedge the price risk associated with electricity, gas, oil and other commodities. Many of these contracts have qualified for hedge accounting. Contracts that existed at December 31, 2009 range in maturity through 2014. At December 31, 2009, the accumulated net unrealized after-tax gains on qualifying derivatives that are expected to be reclassified into earnings during the next 12 months were $233 million for both PPL and PPL Energy Supply. Cash flow hedges are discontinued if it is no longer probable that the original forecasted transaction will occur by the end of the originally specified time periods and any amounts previously recorded in AOCI are reclassified to earnings. For 2009, 2008 and 2007, such reclassifications were an after-tax gain of $9 million, an after-tax loss of $8 million and an insignificant amount. For 2009, 2008 and 2007, hedge ineffectiveness associated with energy derivatives was, after tax, a loss of $174 million, a gain of $310 million and a loss of $3 million. Certain power and gas cash flow hedges failed hedge effectiveness testing in the third and fourth quarters of 2008, as well as the first quarter of 2009. Hedge accounting is not permitted for the quarter in which this occurs and, accordingly, the entire change in fair value for the periods that failed was recorded to the income statement. However, these transactions were not dedesignated as hedges, as prospective regression analysis demonstrated that these hedges are expected to be highly effective over their term. For 2008, an after-tax gain of $298 million was recognized in earnings as a result of these hedge failures. During the second, third and fourth quarters of 2009, fewer power and gas cash flow hedges failed hedge effectiveness testing; therefore, a portion of the previously recognized unrealized gains recorded in the second half of 2008 and the first quarter of 2009 associated with these hedges were reversed. For 2009, after-tax losses of $215 million were recognized in earnings as a result of these reversals. Economic Activity PPL Energy Supply also uses derivative contracts to economically hedge the impact of market price fluctuations on its energy-related assets, liabilities and other contractual arrangements that do not receive hedge accounting treatment. PPL Energy Supply refers to these transactions as economic activity. The economic activity category includes energy derivative transactions that have previously qualified or could
potentially qualify for hedge accounting; however, these transactions have either been disqualified from hedge accounting or management has not elected to designate them as accounting hedges. This activity includes the changes in fair value of positions used to hedge a portion of the economic value of PPL Energy Supply's generation assets, load-following and retail activities. This economic activity is subject to changes in fair value due to market price volatility of the input and output commodities (e.g., fuel and power). These contracts range in maturity through 2017. Additionally, premium amortization of $53 million associated with options classified as economic activity and the ineffective portion of qualifying cash flow hedges, including the entire change in fair value for certain cash flow hedges that failed effectiveness testing during the current period as discussed in the preceding "Cash Flow Hedges" section, are also included in economic activity. Examples of transactions represented in this category include certain purchase contracts used to supply full-requirement sales contracts; FTRs or basis swaps used to hedge basis risk associated with the sale of generation or supplying full-requirement sales contracts; spark spreads (sale of electricity with the simultaneous purchase of fuel); retail gas activities; and fuel oil swaps used to hedge price escalation clauses in coal transportation and other fuel-related contracts. PPL Energy Supply also uses options, which include the sale of call options and the purchase of put options tied to a particular generating unit. Since PPL Energy Supply owns the physical generating capacity, its price exposure is limited to the cost of the particular generating unit and does not expose PPL Energy Supply to uncovered market price risk. PPL Energy Supply also purchases call options or sells put options to create a net purchase position to cover an overall short position in its non-trading portfolio. The gains (losses) for this activity are reflected in the Statements of Income as follows. Gains (Losses) 2009 2008 2007 Operating Revenues
Unregulated retail electric and gas $ 6 $ 5 Wholesale energy marketing (280) 1,056 $ (145)
Operating Expenses Fuel 49 (79) 15Energy purchases (158) (553) 185
The net gains (losses) recorded in "Wholesale energy marketing" resulted primarily from certain full-requirement sales contracts in which PPL Energy Supply did not elect NPNS and from hedge ineffectiveness, including hedges that failed effectiveness testing, as discussed in the "Cash Flow Hedges" section above. The net gains (losses) recorded in "Energy purchases" resulted primarily from certain purchase contracts to supply the full-requirement sales contracts noted above for which PPL Energy Supply did not elect hedge treatment and from hedge ineffectiveness, including hedges that failed effectiveness testing.
179
Commodity Price Risk (Trading) (PPL and PPL Energy Supply) PPL Energy Supply also executes energy contracts to take advantage of market opportunities. As a result, PPL Energy Supply may at times create a net open position in its portfolio that could result in significant losses if prices do not move in the manner or direction anticipated. PPL Energy Supply's trading activity is shown in "Net energy trading margins" on the Statements of Income. Commodity Volumetric Activity (PPL and PPL Energy Supply) PPL Energy Supply currently employs four primary strategies to maximize the value of its wholesale energy portfolio. As further discussed below, these strategies include the sales of baseload generation, optimization of intermediate and peaking generation, marketing activities, and proprietary trading activities. Sales of Baseload Generation PPL Energy Supply has a formal hedging program for its baseload generation fleet, which includes 7,370 MW of generating capacity. The objective of this program is to provide a reasonable level of near-term cash flow and earnings certainty for the next three years while preserving upside potential of power price increases over the medium term; however, in certain instances, PPL Energy Supply will sell power and purchase fuel beyond this three-year period. PPL Energy Supply sells its expected generation output on a forward basis using both derivative and non-derivative instruments. Both are included in the following tables. The following table presents the expected sales, in GWh, of baseload generation based on current forecasted assumptions for 2010-2014. These expected sales could be impacted by several factors, including plant availability. 2010 2011 2012 2013 2014
52,114 52,087 56,130 55,184 55,504 The following table presents the percentage of expected baseload generation sales shown above that has been sold forward under fixed-price contracts and the related percentage of fuel that has been purchased or committed at December 31, 2009. Derivative Total Power Fuel Purchases (c) Year Sales (a) Sales (b) Coal Nuclear
2010 91% 99% 99% 100%2011 80% 88% 89% 100%2012 48% 55% 70% 100%2013 6% 13% 57% 100%2014 1% 5% 51% 100% (a) Excludes non-derivative contracts and contracts that qualify for NPNS.
Volumes for option contracts factor in the probability of an option being exercised and may be less than the notional amount of the option. Percentages are based on fixed-price contracts only.
(b) Amount represents derivative and non-derivative contracts. Volumes for option contracts factor in the probability of an option being exercised and may be less than the notional amount of the option. Percentages are based on fixed-price contracts only.
(c) Coal and nuclear contracts receive accrual accounting treatment, as they are not derivative contracts. Percentages are based on both fixed- and variable-priced contracts.
In addition to the fuel purchases above, PPL Energy Supply attempts to economically hedge the fuel price risk that is within its fuel-related contracts and coal transportation contracts, which are tied to changes in crude oil or diesel prices. The following table presents the volumes (in thousands of barrels) of derivative contracts used in support of this strategy at December 31, 2009.
Contract Type 2010 2011 2012
Oil Swaps 420 408 180 Optimization of Intermediate and Peaking Generation In addition to its baseload generation activities, PPL Energy Supply attempts to optimize the overall value of its intermediate and peaking fleet, which includes 4,349 MW of gas and oil-fired generation. PPL Energy Supply uses both option and non-option contracts to support this strategy. The following table presents the volumes of derivative contracts used in support of this strategy at December 31, 2009.
Units 2010
Net Power Sales: Options (a) GWh 507 Non-option contracts (b) GWh 1,156
Net Fuel Sales:
Non-option contracts (c) Barrels 145,000 Net Power/Fuel Purchases:
Non-option contracts Bcf 9.3 (a) Volumes for option contracts factor in the probability of an option being
exercised and may be less than the notional amount of the option. (b) Included in these volumes are exercised option contracts that converted to
non-option derivative contracts. (c) Represents the forward sale of physical oil inventory with a January 2010
delivery. Marketing Activities PPL Energy Supply's marketing portfolio is comprised of full-requirement sales contracts and their related supply contracts, retail gas and electricity sales contracts and other marketing activities. The full-requirement sales contracts and their related supply contracts make up a significant component of the marketing portfolio. The obligations under the full-requirement sales contracts include supplying a bundled product of energy, capacity, RECs, and other ancillary products. PPL Energy Supply uses a variety of strategies to hedge its full-requirement sales contracts, including purchasing energy at a liquid trading hub or directly at the load delivery zone, purchasing capacity and RECs in the market and supplying the energy, capacity and RECs with its generation. RECs are not derivatives and are excluded from the table below. The following table presents the volumes of (sales)/purchase contracts, excluding FTRs, basis and capacity contracts, used in support of these activities at December 31, 2009.
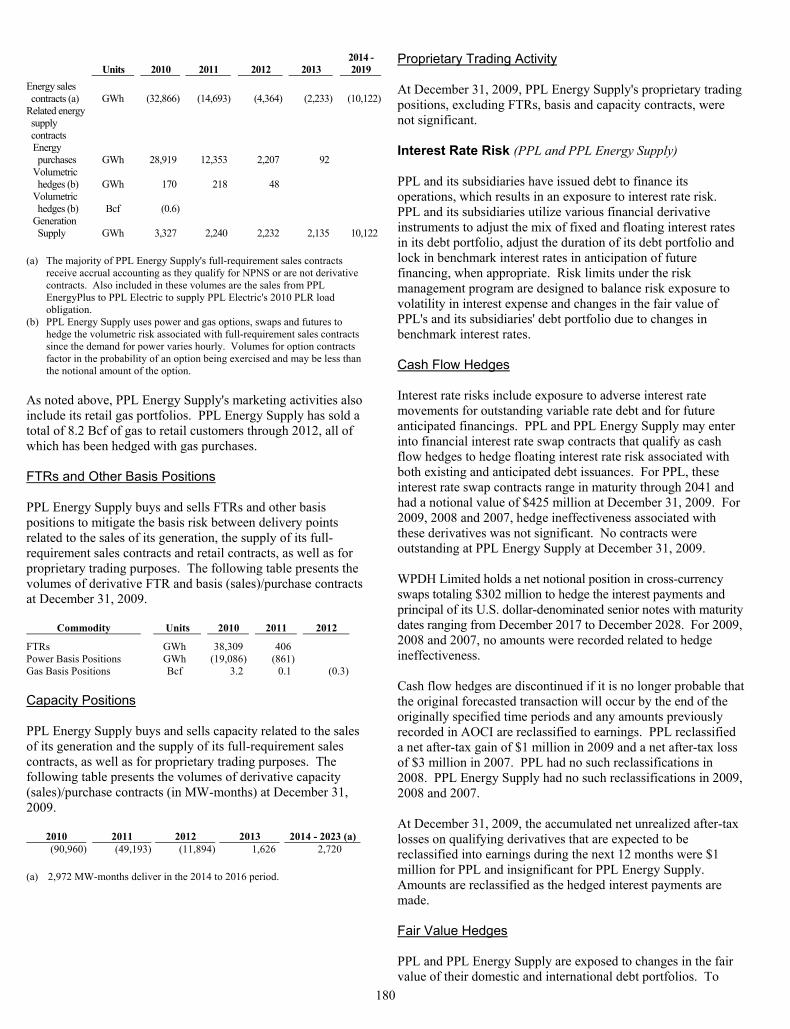
180
Units 2010 2011 2012 2013 2014 - 2019
Energy sales contracts (a) GWh (32,866) (14,693) (4,364) (2,233) (10,122)
Related energy supply contracts Energy purchases GWh 28,919 12,353 2,207 92
Volumetric hedges (b) GWh 170 218 48
Volumetric hedges (b) Bcf (0.6)
Generation Supply GWh 3,327 2,240 2,232 2,135 10,122
(a) The majority of PPL Energy Supply's full-requirement sales contracts
receive accrual accounting as they qualify for NPNS or are not derivative contracts. Also included in these volumes are the sales from PPL EnergyPlus to PPL Electric to supply PPL Electric's 2010 PLR load obligation.
(b) PPL Energy Supply uses power and gas options, swaps and futures to hedge the volumetric risk associated with full-requirement sales contracts since the demand for power varies hourly. Volumes for option contracts factor in the probability of an option being exercised and may be less than the notional amount of the option.
As noted above, PPL Energy Supply's marketing activities also include its retail gas portfolios. PPL Energy Supply has sold a total of 8.2 Bcf of gas to retail customers through 2012, all of which has been hedged with gas purchases. FTRs and Other Basis Positions PPL Energy Supply buys and sells FTRs and other basis positions to mitigate the basis risk between delivery points related to the sales of its generation, the supply of its full-requirement sales contracts and retail contracts, as well as for proprietary trading purposes. The following table presents the volumes of derivative FTR and basis (sales)/purchase contracts at December 31, 2009.
Commodity Units 2010 2011 2012
FTRs GWh 38,309 406Power Basis Positions GWh (19,086 ) (861) Gas Basis Positions Bcf 3.2 0.1 (0.3) Capacity Positions PPL Energy Supply buys and sells capacity related to the sales of its generation and the supply of its full-requirement sales contracts, as well as for proprietary trading purposes. The following table presents the volumes of derivative capacity (sales)/purchase contracts (in MW-months) at December 31, 2009.
2010 2011 2012 2013 2014 - 2023 (a)(90,960) (49,193) (11,894) 1,626 2,720
(a) 2,972 MW-months deliver in the 2014 to 2016 period.
Proprietary Trading Activity At December 31, 2009, PPL Energy Supply's proprietary trading positions, excluding FTRs, basis and capacity contracts, were not significant. Interest Rate Risk (PPL and PPL Energy Supply) PPL and its subsidiaries have issued debt to finance its operations, which results in an exposure to interest rate risk. PPL and its subsidiaries utilize various financial derivative instruments to adjust the mix of fixed and floating interest rates in its debt portfolio, adjust the duration of its debt portfolio and lock in benchmark interest rates in anticipation of future financing, when appropriate. Risk limits under the risk management program are designed to balance risk exposure to volatility in interest expense and changes in the fair value of PPL's and its subsidiaries' debt portfolio due to changes in benchmark interest rates. Cash Flow Hedges Interest rate risks include exposure to adverse interest rate movements for outstanding variable rate debt and for future anticipated financings. PPL and PPL Energy Supply may enter into financial interest rate swap contracts that qualify as cash flow hedges to hedge floating interest rate risk associated with both existing and anticipated debt issuances. For PPL, these interest rate swap contracts range in maturity through 2041 and had a notional value of $425 million at December 31, 2009. For 2009, 2008 and 2007, hedge ineffectiveness associated with these derivatives was not significant. No contracts were outstanding at PPL Energy Supply at December 31, 2009. WPDH Limited holds a net notional position in cross-currency swaps totaling $302 million to hedge the interest payments and principal of its U.S. dollar-denominated senior notes with maturity dates ranging from December 2017 to December 2028. For 2009, 2008 and 2007, no amounts were recorded related to hedge ineffectiveness. Cash flow hedges are discontinued if it is no longer probable that the original forecasted transaction will occur by the end of the originally specified time periods and any amounts previously recorded in AOCI are reclassified to earnings. PPL reclassified a net after-tax gain of $1 million in 2009 and a net after-tax loss of $3 million in 2007. PPL had no such reclassifications in 2008. PPL Energy Supply had no such reclassifications in 2009, 2008 and 2007. At December 31, 2009, the accumulated net unrealized after-tax losses on qualifying derivatives that are expected to be reclassified into earnings during the next 12 months were $1 million for PPL and insignificant for PPL Energy Supply. Amounts are reclassified as the hedged interest payments are made. Fair Value Hedges PPL and PPL Energy Supply are exposed to changes in the fair value of their domestic and international debt portfolios. To
181
manage this risk, PPL and PPL Energy Supply may enter into financial contracts to hedge fluctuations in the fair value of existing debt issuances due to changes in benchmark interest rates. At December 31, 2009, PPL held contracts that range in maturity through 2047 and had a notional value of $750 million. PPL Energy Supply did not hold any such contracts at December 31, 2009. PPL and PPL Energy Supply did not recognize any gains or losses resulting from the ineffective portion of fair value hedges or from a portion of the hedging instrument being excluded from the assessment of hedge effectiveness for 2009, 2008 and 2007. Additionally, PPL recognized a net after-tax gain of $4 million from hedges of debt issuances that no longer qualified as fair value hedges for 2009, while the amounts were not significant for 2008 and 2007. PPL Energy Supply did not recognize any gains or losses resulting from hedges of debt issuances that no longer qualified as fair value hedges for 2009, 2008 and 2007. Foreign Currency Risk (PPL and PPL Energy Supply) PPL and PPL Energy Supply are exposed to foreign currency risk, primarily through investments in U.K. affiliates. In addition, PPL's and PPL Energy Supply's domestic operations may make purchases of equipment in currencies other than U.S. dollars. PPL and PPL Energy Supply have adopted a foreign currency risk management program designed to hedge certain foreign currency exposures, including firm commitments, recognized assets or liabilities, anticipated transactions and net investments. In addition, PPL and PPL Energy Supply enter into financial instruments to protect against foreign currency translation risk of expected earnings. Cash Flow Hedges PPL and PPL Energy Supply may enter into foreign currency derivatives associated with foreign currency-denominated debt and the exchange rate associated with firm commitments denominated in foreign currencies; however, at December 31, 2009, there were no existing contracts of this nature. Amounts previously classified in AOCI are reclassified as the hedged interest payments are made and as the related equipment is depreciated. Cash flow hedges are discontinued if it is no longer probable that the original forecasted transaction will occur by the end of the originally specified time periods and any amounts previously recorded in AOCI are reclassified to earnings. There were no such reclassifications during 2009, 2008 and 2007. Fair Value Hedges PPL and PPL Energy Supply enter into foreign currency forward contracts to hedge the exchange rates associated with firm commitments denominated in foreign currencies; however, at December 31, 2009, there were no existing contracts of this nature. PPL and PPL Energy Supply did not recognize any gains or losses resulting from the ineffective portion of fair value hedges or from a portion of the hedging instrument being excluded from the assessment of hedge effectiveness for 2009,
2008 and 2007. Additionally, PPL and PPL Energy Supply did not recognize any gains or losses resulting from hedges of firm commitments that no longer qualified as fair value hedges for 2009, 2008 and 2007. Net Investment Hedges PPL and PPL Energy Supply may enter into foreign currency contracts to protect the value of a portion of their net investment in WPD. The total notional amount of the contracts outstanding at December 31, 2009 was £40 million (approximately $78 million based on contracted rates). The settlement dates of these contracts range from March 2010 through June 2011. At December 31, 2009, the fair value of these positions was a net asset of $13 million. For 2009, 2008 and 2007, PPL and PPL Energy Supply recognized after tax net investment hedge losses of $5 million, gains of $20 million and $2 million in the foreign currency translation adjustment component of OCI. At December 31, 2009, PPL and PPL Energy Supply had $11 million of accumulated net investment hedge gains, after tax, that were included in the foreign currency translation adjustment component of AOCI compared with $16 million of gains at December 31, 2008. See Note 15 for additional information. Economic Activity PPL and PPL Energy Supply may enter into foreign currency contracts as an economic hedge of anticipated earnings denominated in British pounds sterling. At December 31, 2009, the total exposure hedged was £48 million and the net fair value of these positions was a net asset of $2 million. These contracts had termination dates ranging from January 2010 to June 2010. No similar hedging instruments were outstanding at December 31, 2008. Gains and losses, both realized and unrealized, on these contracts are included in "Other Income - net" on the Statements of Income. For 2009, PPL and PPL Energy Supply recorded net losses of $9 million. For 2008 and 2007, PPL and PPL Energy Supply recorded net gains of $9 million and net losses of $4 million related to similar average rate forwards and average rate options. See Note 15 for additional information. Accounting and Reporting (PPL, PPL Energy Supply and PPL Electric) All derivative instruments are recorded at fair value on the balance sheet as an asset or liability (unless they qualify for NPNS), and changes in the derivatives' fair value are recognized currently in earnings unless specific hedge accounting criteria are met. See Note 17 for additional information on NPNS. PPL and its subsidiaries have elected not to offset net derivative positions in the financial statements. Accordingly, PPL and its subsidiaries do not offset such derivative positions against the fair value of amounts (or amounts that approximate fair value) recognized for the right to reclaim cash collateral (a receivable) or the obligation to return cash collateral (a payable) under master netting arrangements.

182
Gains and losses associated with non-trading bilateral sales of electricity at major market delivery points are netted with purchases that offset the sales at those same delivery points. A major market delivery point is any delivery point with liquid pricing available. PPL and PPL Energy Supply reflect their net realized and unrealized gains and losses associated with all derivatives that are held for trading purposes in the "Net energy trading margins" line on the Statements of Income. The circumstances and intent existing at the time that derivative contracts are entered into are used to determine their accounting designation, which is subsequently verified by an independent internal group on a daily basis. The following summarizes the guidelines that have been provided to the marketers who are responsible for contract designation for derivative energy contracts. • Any wholesale and retail contracts to sell electricity and the
related capacity that do not meet the definition of a derivative receive accrual accounting.
• Physical electricity-only transactions can receive cash flow
hedge treatment if all of the qualifications are met. • Physical capacity-only transactions to sell excess capacity
from PPL's and PPL Energy Supply's generation qualify for NPNS. The forward value of these transactions is not recorded in the financial statements and has no earnings impact until delivery.
• Any physical energy sale or purchase not intended to hedge
an economic exposure is considered speculative, with unrealized gains or losses recorded immediately through earnings.
• Financial transactions that can be settled in cash do not
qualify for NPNS because they do not require physical delivery. These transactions can receive cash flow hedge treatment if they lock in the cash flows PPL and PPL Energy Supply will receive or pay for energy expected to be sold or purchased in the spot market.
• PPL and PPL Energy Supply purchase FTRs for both
proprietary trading activities and hedging purposes. FTRs, although economically effective as electricity basis hedges, do not currently qualify for hedge accounting treatment. Unrealized and realized gains and losses from FTRs that were entered into for trading purposes are recorded in "Net energy trading margins" on the Statements of Income. Unrealized and realized gains and losses from FTRs that were entered into for hedging purposes are recorded in "Energy purchases" on the Statements of Income.
• Physical and financial transactions for gas and oil to meet fuel and retail requirements can receive cash flow hedge treatment if they lock in the price PPL and PPL Energy Supply will pay and meet the definition of a derivative.
• Certain option contracts may receive hedge accounting
treatment. Those that are not eligible are marked to fair value through earnings.
Unrealized gains or losses on cash flow hedges are recorded in OCI, excluding ineffectiveness that is recognized immediately in earnings. These unrealized gains and losses become realized when the contracts settle and are recognized in earnings when the hedged transactions occur. The following is a summary of certain guidelines that have been provided to PPL's Finance Department, which is responsible for contract designation for interest rate and foreign currency derivatives. • Transactions to lock in an interest rate prior to a debt
issuance can be designated as cash flow hedges. Any unrealized gains or losses on transactions receiving cash flow hedge treatment are recorded in OCI and are amortized as a component of interest expense when the hedged transactions occur.
• Transactions entered into to hedge fluctuations in the fair
value of existing debt can be designated as fair value hedges. To the extent that the change in the fair value of the derivative offsets the change in the fair value of the existing debt, there is no earnings impact, as both changes are reflected in interest expense. Realized gains and losses over the life of the hedge are reflected in interest expense.
• Transactions entered into to hedge the value of a net
investment of foreign operations can be designated as net investment hedges. To the extent that the derivatives are highly effective at hedging the value of the net investment, gains and losses are recorded in the foreign currency translation adjustment component of OCI and will not be recorded in earnings until the investment is substantially liquidated.
• Derivative transactions that do not qualify for hedge
accounting treatment are marked to fair value through earnings. These transactions generally include hedges of earnings translation risk associated with subsidiaries that report their financial statements in a currency other than the U.S. dollar. As such, these transactions eliminate earnings volatility due solely to changes in foreign currency exchange rates.
(PPL and PPL Energy Supply) The following tables present the fair value and location of derivative instruments recorded on the Balance Sheets at December 31, 2009.
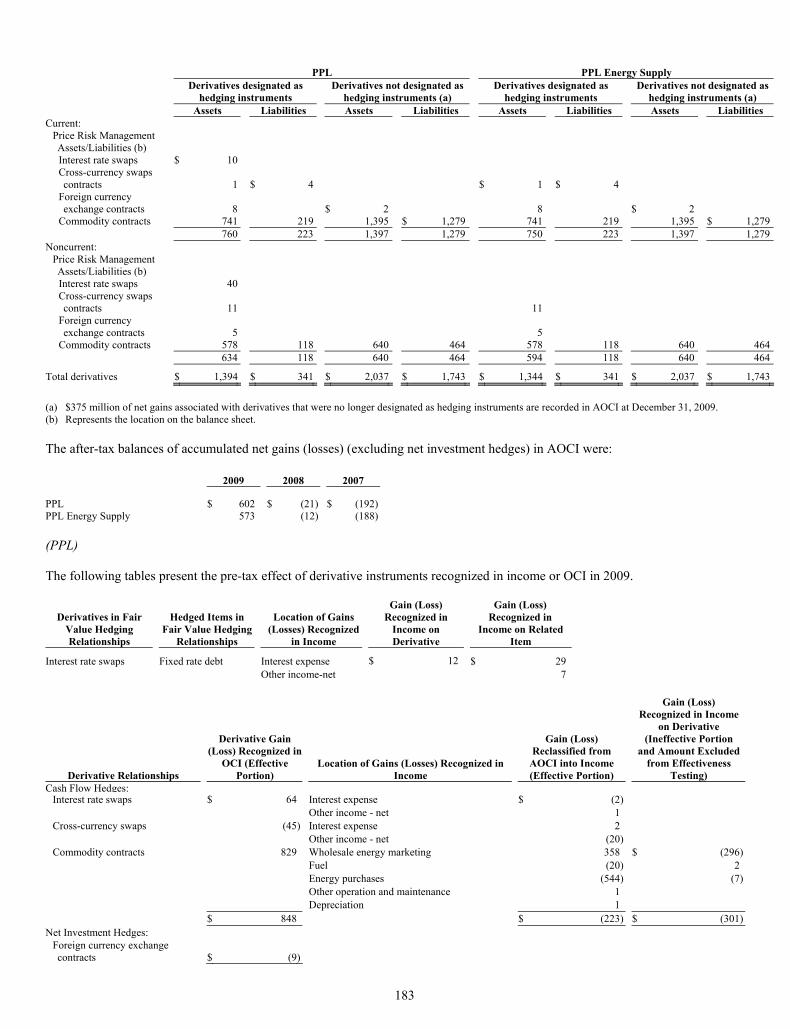
183
PPL PPL Energy Supply
Derivatives designated as
hedging instruments Derivatives not designated as
hedging instruments (a) Derivatives designated as
hedging instruments Derivatives not designated as
hedging instruments (a) Assets Liabilities Assets Liabilities Assets Liabilities Assets Liabilities
Current: Price Risk Management Assets/Liabilities (b) Interest rate swaps $ 10 Cross-currency swaps contracts 1 $ 4 $ 1 $ 4
Foreign currency exchange contracts 8 $ 2 8 $ 2
Commodity contracts 741 219 1,395 $ 1,279 741 219 1,395 $ 1,279 760 223 1,397 1,279 750 223 1,397 1,279Noncurrent:
Price Risk Management Assets/Liabilities (b) Interest rate swaps 40 Cross-currency swaps contracts 11 11
Foreign currency exchange contracts 5 5
Commodity contracts 578 118 640 464 578 118 640 464 634 118 640 464 594 118 640 464
Total derivatives $ 1,394 $ 341 $ 2,037 $ 1,743 $ 1,344 $ 341 $ 2,037 $ 1,743
(a) $375 million of net gains associated with derivatives that were no longer designated as hedging instruments are recorded in AOCI at December 31, 2009. (b) Represents the location on the balance sheet. The after-tax balances of accumulated net gains (losses) (excluding net investment hedges) in AOCI were: 2009 2008 2007 PPL $ 602 $ (21) $ (192) PPL Energy Supply 573 (12) (188) (PPL) The following tables present the pre-tax effect of derivative instruments recognized in income or OCI in 2009.
Derivatives in Fair Value Hedging Relationships
Hedged Items in Fair Value Hedging
Relationships
Location of Gains (Losses) Recognized
in Income
Gain (Loss) Recognized in
Income on Derivative
Gain (Loss) Recognized in
Income on Related Item
Interest rate swaps Fixed rate debt Interest expense $ 12 $ 29 Other income-net 7
Derivative Relationships
Derivative Gain (Loss) Recognized in
OCI (Effective Portion)
Location of Gains (Losses) Recognized in Income
Gain (Loss) Reclassified from
AOCI into Income (Effective Portion)
Gain (Loss) Recognized in Income
on Derivative (Ineffective Portion
and Amount Excluded from Effectiveness
Testing) Cash Flow Hedges:
Interest rate swaps $ 64 Interest expense $ (2) Other income - net 1 Cross-currency swaps (45) Interest expense 2 Other income - net (20) Commodity contracts 829 Wholesale energy marketing 358 $ (296) Fuel (20) 2 Energy purchases (544) (7) Other operation and maintenance 1 Depreciation 1 $ 848 $ (223) $ (301)
Net Investment Hedges: Foreign currency exchange contracts $ (9)
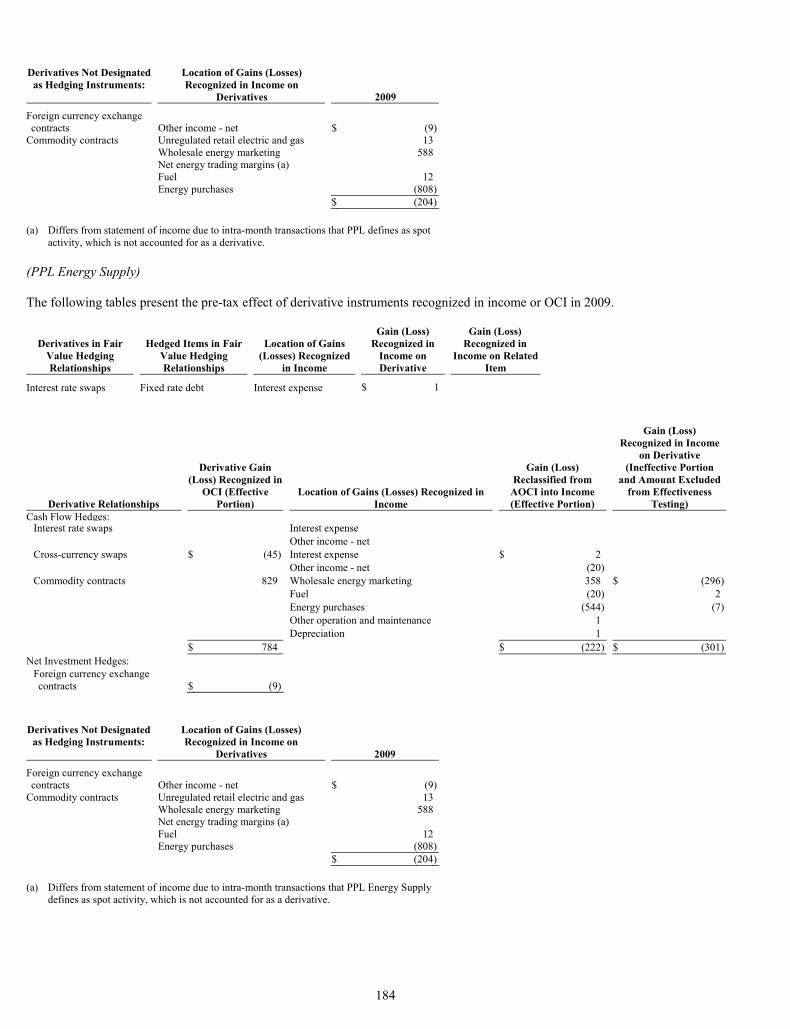
184
Derivatives Not Designated
as Hedging Instruments: Location of Gains (Losses)
Recognized in Income on Derivatives 2009
Foreign currency exchange contracts Other income - net $ (9)
Commodity contracts Unregulated retail electric and gas 13 Wholesale energy marketing 588 Net energy trading margins (a) Fuel 12
Energy purchases (808) $ (204) (a) Differs from statement of income due to intra-month transactions that PPL defines as spot
activity, which is not accounted for as a derivative. (PPL Energy Supply) The following tables present the pre-tax effect of derivative instruments recognized in income or OCI in 2009.
Derivatives in Fair Value Hedging Relationships
Hedged Items in Fair Value Hedging Relationships
Location of Gains (Losses) Recognized
in Income
Gain (Loss) Recognized in
Income on Derivative
Gain (Loss) Recognized in
Income on Related Item
Interest rate swaps Fixed rate debt Interest expense $ 1
Derivative Relationships
Derivative Gain (Loss) Recognized in
OCI (Effective Portion)
Location of Gains (Losses) Recognized in Income
Gain (Loss) Reclassified from
AOCI into Income (Effective Portion)
Gain (Loss) Recognized in Income
on Derivative (Ineffective Portion
and Amount Excluded from Effectiveness
Testing) Cash Flow Hedges:
Interest rate swaps Interest expense Other income - net Cross-currency swaps $ (45) Interest expense $ 2 Other income - net (20) Commodity contracts 829 Wholesale energy marketing 358 $ (296) Fuel (20) 2 Energy purchases (544) (7) Other operation and maintenance 1 Depreciation 1 $ 784 $ (222) $ (301)
Net Investment Hedges: Foreign currency exchange contracts $ (9)
Derivatives Not Designated
as Hedging Instruments: Location of Gains (Losses)
Recognized in Income on Derivatives 2009
Foreign currency exchange contracts Other income - net $ (9)
Commodity contracts Unregulated retail electric and gas 13 Wholesale energy marketing 588 Net energy trading margins (a) Fuel 12
Energy purchases (808) $ (204) (a) Differs from statement of income due to intra-month transactions that PPL Energy Supply
defines as spot activity, which is not accounted for as a derivative.
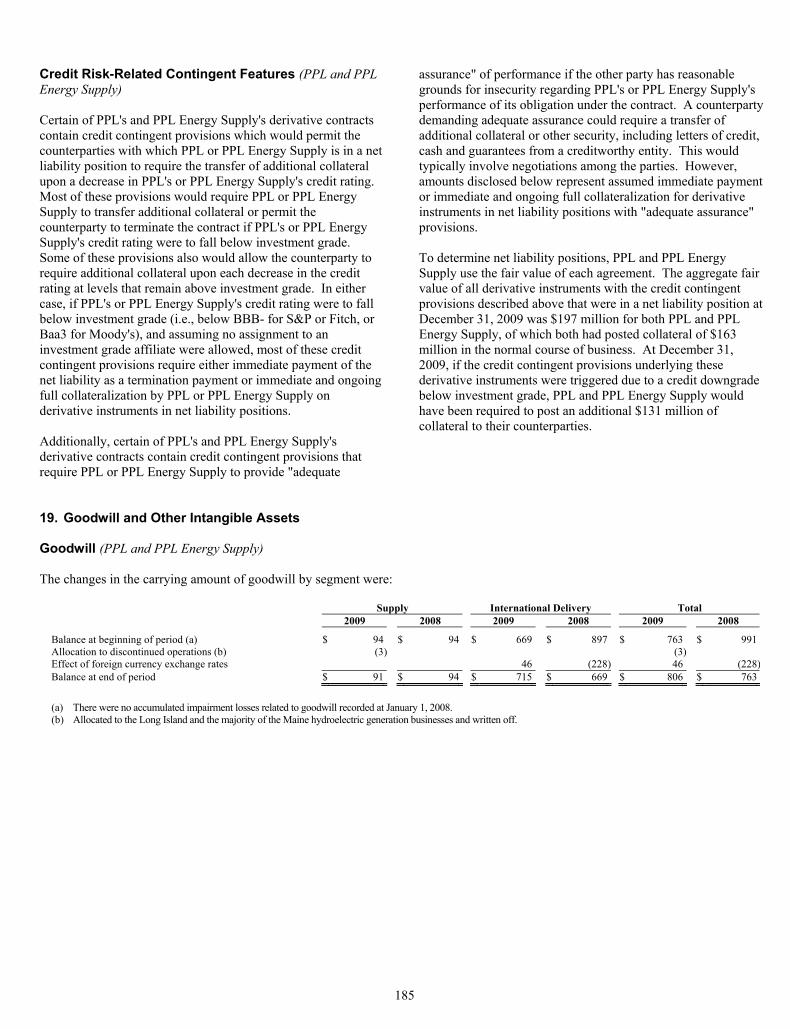
185
Credit Risk-Related Contingent Features (PPL and PPL Energy Supply) Certain of PPL's and PPL Energy Supply's derivative contracts contain credit contingent provisions which would permit the counterparties with which PPL or PPL Energy Supply is in a net liability position to require the transfer of additional collateral upon a decrease in PPL's or PPL Energy Supply's credit rating. Most of these provisions would require PPL or PPL Energy Supply to transfer additional collateral or permit the counterparty to terminate the contract if PPL's or PPL Energy Supply's credit rating were to fall below investment grade. Some of these provisions also would allow the counterparty to require additional collateral upon each decrease in the credit rating at levels that remain above investment grade. In either case, if PPL's or PPL Energy Supply's credit rating were to fall below investment grade (i.e., below BBB- for S&P or Fitch, or Baa3 for Moody's), and assuming no assignment to an investment grade affiliate were allowed, most of these credit contingent provisions require either immediate payment of the net liability as a termination payment or immediate and ongoing full collateralization by PPL or PPL Energy Supply on derivative instruments in net liability positions. Additionally, certain of PPL's and PPL Energy Supply's derivative contracts contain credit contingent provisions that require PPL or PPL Energy Supply to provide "adequate
assurance" of performance if the other party has reasonable grounds for insecurity regarding PPL's or PPL Energy Supply's performance of its obligation under the contract. A counterparty demanding adequate assurance could require a transfer of additional collateral or other security, including letters of credit, cash and guarantees from a creditworthy entity. This would typically involve negotiations among the parties. However, amounts disclosed below represent assumed immediate payment or immediate and ongoing full collateralization for derivative instruments in net liability positions with "adequate assurance" provisions. To determine net liability positions, PPL and PPL Energy Supply use the fair value of each agreement. The aggregate fair value of all derivative instruments with the credit contingent provisions described above that were in a net liability position at December 31, 2009 was $197 million for both PPL and PPL Energy Supply, of which both had posted collateral of $163 million in the normal course of business. At December 31, 2009, if the credit contingent provisions underlying these derivative instruments were triggered due to a credit downgrade below investment grade, PPL and PPL Energy Supply would have been required to post an additional $131 million of collateral to their counterparties.
19. Goodwill and Other Intangible Assets Goodwill (PPL and PPL Energy Supply) The changes in the carrying amount of goodwill by segment were:
Supply International Delivery Total 2009 2008 2009 2008 2009 2008
Balance at beginning of period (a) $ 94 $ 94 $ 669 $ 897 $ 763 $ 991Allocation to discontinued operations (b) (3) (3) Effect of foreign currency exchange rates 46 (228 ) 46 (228)Balance at end of period $ 91 $ 94 $ 715 $ 669 $ 806 $ 763
(a) There were no accumulated impairment losses related to goodwill recorded at January 1, 2008. (b) Allocated to the Long Island and the majority of the Maine hydroelectric generation businesses and written off.
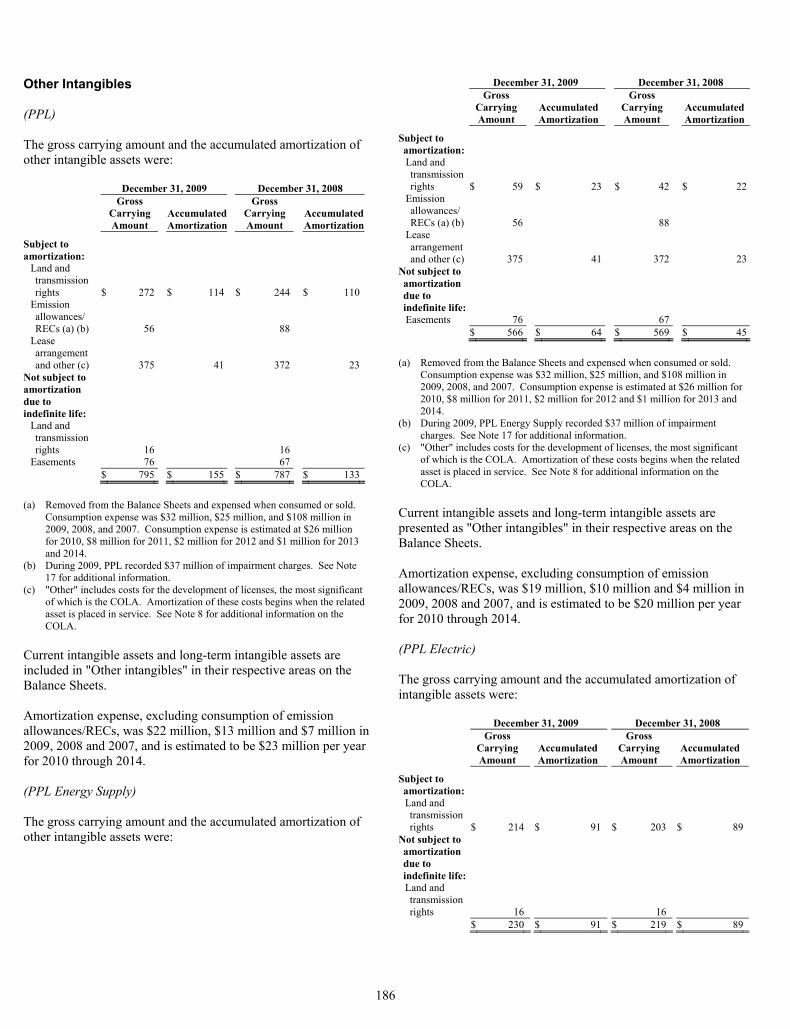
186
Other Intangibles (PPL) The gross carrying amount and the accumulated amortization of other intangible assets were: December 31, 2009 December 31, 2008
Gross Carrying Amount
Accumulated Amortization
Gross Carrying Amount
Accumulated Amortization
Subject to amortization:
Land and transmission rights $ 272 $ 114 $ 244 $ 110
Emission allowances/ RECs (a) (b) 56 88
Lease arrangement and other (c) 375 41 372 23
Not subject to amortization due to indefinite life:
Land and transmission rights 16 16
Easements 76 67 $ 795 $ 155 $ 787 $ 133
(a) Removed from the Balance Sheets and expensed when consumed or sold.
Consumption expense was $32 million, $25 million, and $108 million in 2009, 2008, and 2007. Consumption expense is estimated at $26 million for 2010, $8 million for 2011, $2 million for 2012 and $1 million for 2013 and 2014.
(b) During 2009, PPL recorded $37 million of impairment charges. See Note 17 for additional information.
(c) "Other" includes costs for the development of licenses, the most significant of which is the COLA. Amortization of these costs begins when the related asset is placed in service. See Note 8 for additional information on the COLA.
Current intangible assets and long-term intangible assets are included in "Other intangibles" in their respective areas on the Balance Sheets. Amortization expense, excluding consumption of emission allowances/RECs, was $22 million, $13 million and $7 million in 2009, 2008 and 2007, and is estimated to be $23 million per year for 2010 through 2014. (PPL Energy Supply) The gross carrying amount and the accumulated amortization of other intangible assets were:
December 31, 2009 December 31, 2008
Gross Carrying Amount
Accumulated Amortization
Gross Carrying Amount
Accumulated Amortization
Subject to amortization: Land and transmission rights $ 59 $ 23 $ 42 $ 22
Emission allowances/RECs (a) (b) 56 88
Lease arrangement and other (c) 375 41 372 23
Not subject to amortization due to indefinite life: Easements 76 67
$ 566 $ 64 $ 569 $ 45
(a) Removed from the Balance Sheets and expensed when consumed or sold.
Consumption expense was $32 million, $25 million, and $108 million in 2009, 2008, and 2007. Consumption expense is estimated at $26 million for 2010, $8 million for 2011, $2 million for 2012 and $1 million for 2013 and 2014.
(b) During 2009, PPL Energy Supply recorded $37 million of impairment charges. See Note 17 for additional information.
(c) "Other" includes costs for the development of licenses, the most significant of which is the COLA. Amortization of these costs begins when the related asset is placed in service. See Note 8 for additional information on the COLA.
Current intangible assets and long-term intangible assets are presented as "Other intangibles" in their respective areas on the Balance Sheets. Amortization expense, excluding consumption of emission allowances/RECs, was $19 million, $10 million and $4 million in 2009, 2008 and 2007, and is estimated to be $20 million per year for 2010 through 2014. (PPL Electric) The gross carrying amount and the accumulated amortization of intangible assets were: December 31, 2009 December 31, 2008
Gross Carrying Amount
Accumulated Amortization
Gross Carrying Amount
Accumulated Amortization
Subject to amortization: Land and transmission rights $ 214 $ 91 $ 203 $ 89
Not subject to amortization due to indefinite life: Land and transmission rights 16 16
$ 230 $ 91 $ 219 $ 89
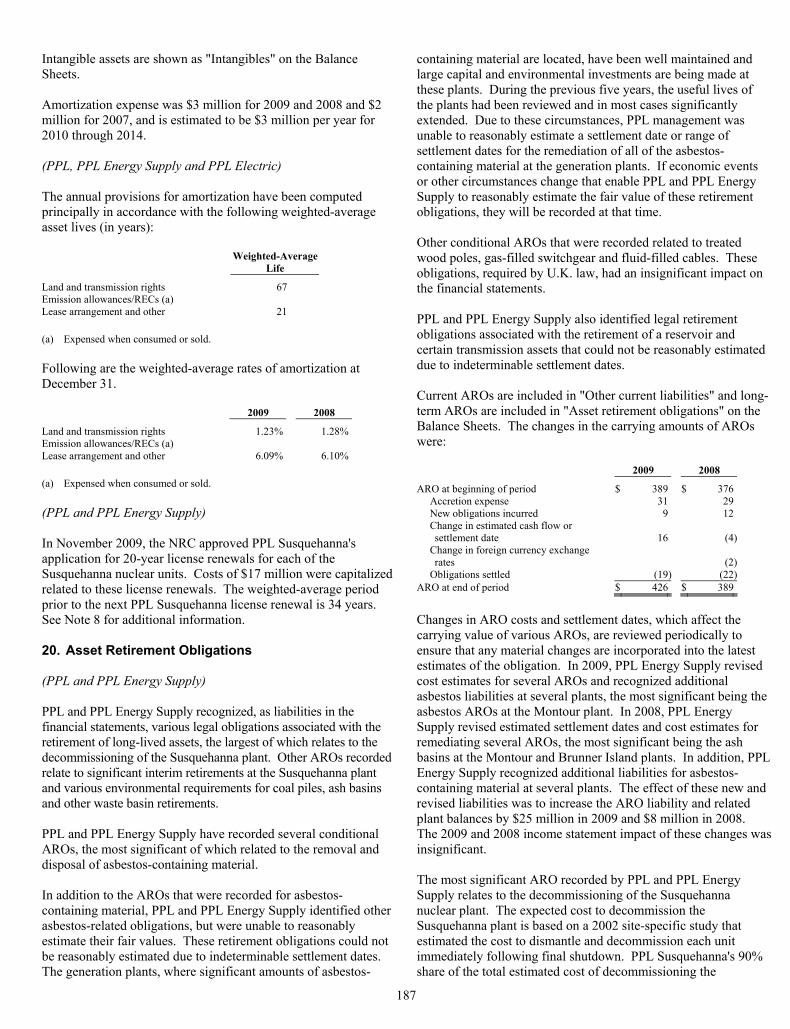
187
Intangible assets are shown as "Intangibles" on the Balance Sheets. Amortization expense was $3 million for 2009 and 2008 and $2 million for 2007, and is estimated to be $3 million per year for 2010 through 2014. (PPL, PPL Energy Supply and PPL Electric) The annual provisions for amortization have been computed principally in accordance with the following weighted-average asset lives (in years):
Weighted-Average
Life
Land and transmission rights 67 Emission allowances/RECs (a) Lease arrangement and other 21 (a) Expensed when consumed or sold. Following are the weighted-average rates of amortization at December 31.
2009 2008
Land and transmission rights 1.23% 1.28%Emission allowances/RECs (a) Lease arrangement and other 6.09% 6.10% (a) Expensed when consumed or sold. (PPL and PPL Energy Supply) In November 2009, the NRC approved PPL Susquehanna's application for 20-year license renewals for each of the Susquehanna nuclear units. Costs of $17 million were capitalized related to these license renewals. The weighted-average period prior to the next PPL Susquehanna license renewal is 34 years. See Note 8 for additional information. 20. Asset Retirement Obligations (PPL and PPL Energy Supply) PPL and PPL Energy Supply recognized, as liabilities in the financial statements, various legal obligations associated with the retirement of long-lived assets, the largest of which relates to the decommissioning of the Susquehanna plant. Other AROs recorded relate to significant interim retirements at the Susquehanna plant and various environmental requirements for coal piles, ash basins and other waste basin retirements. PPL and PPL Energy Supply have recorded several conditional AROs, the most significant of which related to the removal and disposal of asbestos-containing material. In addition to the AROs that were recorded for asbestos-containing material, PPL and PPL Energy Supply identified other asbestos-related obligations, but were unable to reasonably estimate their fair values. These retirement obligations could not be reasonably estimated due to indeterminable settlement dates. The generation plants, where significant amounts of asbestos-
containing material are located, have been well maintained and large capital and environmental investments are being made at these plants. During the previous five years, the useful lives of the plants had been reviewed and in most cases significantly extended. Due to these circumstances, PPL management was unable to reasonably estimate a settlement date or range of settlement dates for the remediation of all of the asbestos-containing material at the generation plants. If economic events or other circumstances change that enable PPL and PPL Energy Supply to reasonably estimate the fair value of these retirement obligations, they will be recorded at that time. Other conditional AROs that were recorded related to treated wood poles, gas-filled switchgear and fluid-filled cables. These obligations, required by U.K. law, had an insignificant impact on the financial statements. PPL and PPL Energy Supply also identified legal retirement obligations associated with the retirement of a reservoir and certain transmission assets that could not be reasonably estimated due to indeterminable settlement dates. Current AROs are included in "Other current liabilities" and long-term AROs are included in "Asset retirement obligations" on the Balance Sheets. The changes in the carrying amounts of AROs were:
2009 2008
ARO at beginning of period $ 389 $ 376Accretion expense 31 29New obligations incurred 9 12Change in estimated cash flow or settlement date 16 (4)
Change in foreign currency exchange rates (2)
Obligations settled (19) (22)ARO at end of period $ 426 $ 389
Changes in ARO costs and settlement dates, which affect the carrying value of various AROs, are reviewed periodically to ensure that any material changes are incorporated into the latest estimates of the obligation. In 2009, PPL Energy Supply revised cost estimates for several AROs and recognized additional asbestos liabilities at several plants, the most significant being the asbestos AROs at the Montour plant. In 2008, PPL Energy Supply revised estimated settlement dates and cost estimates for remediating several AROs, the most significant being the ash basins at the Montour and Brunner Island plants. In addition, PPL Energy Supply recognized additional liabilities for asbestos-containing material at several plants. The effect of these new and revised liabilities was to increase the ARO liability and related plant balances by $25 million in 2009 and $8 million in 2008. The 2009 and 2008 income statement impact of these changes was insignificant. The most significant ARO recorded by PPL and PPL Energy Supply relates to the decommissioning of the Susquehanna nuclear plant. The expected cost to decommission the Susquehanna plant is based on a 2002 site-specific study that estimated the cost to dismantle and decommission each unit immediately following final shutdown. PPL Susquehanna's 90% share of the total estimated cost of decommissioning the
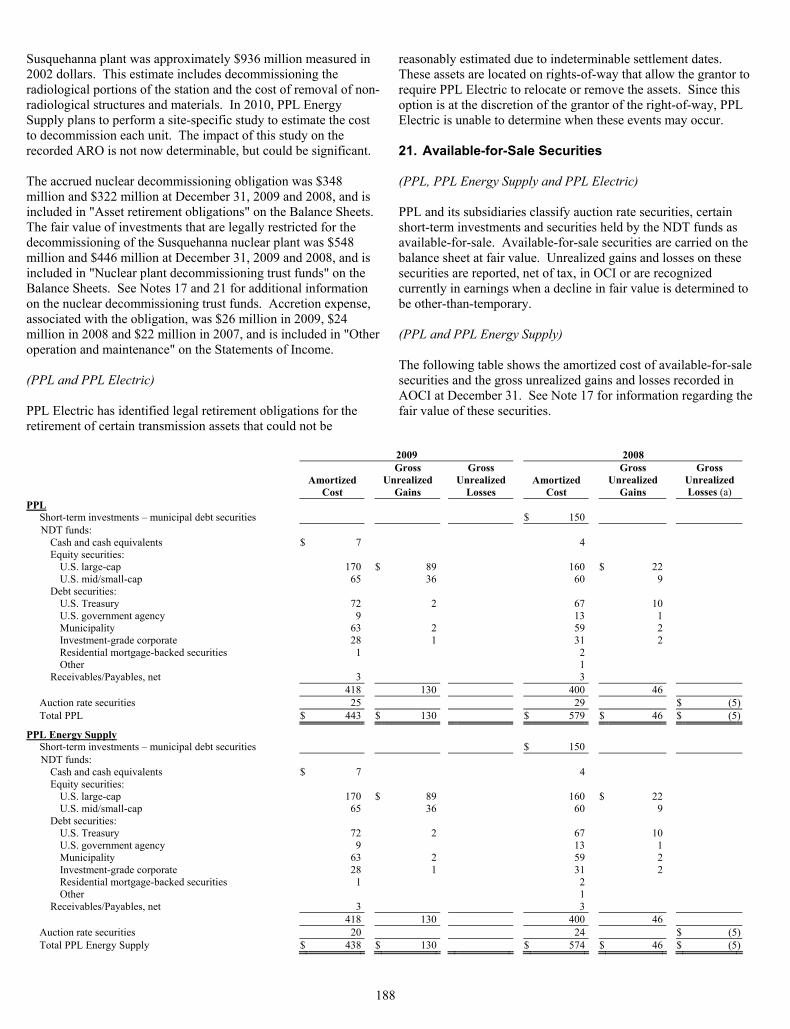
188
Susquehanna plant was approximately $936 million measured in 2002 dollars. This estimate includes decommissioning the radiological portions of the station and the cost of removal of non-radiological structures and materials. In 2010, PPL Energy Supply plans to perform a site-specific study to estimate the cost to decommission each unit. The impact of this study on the recorded ARO is not now determinable, but could be significant. The accrued nuclear decommissioning obligation was $348 million and $322 million at December 31, 2009 and 2008, and is included in "Asset retirement obligations" on the Balance Sheets. The fair value of investments that are legally restricted for the decommissioning of the Susquehanna nuclear plant was $548 million and $446 million at December 31, 2009 and 2008, and is included in "Nuclear plant decommissioning trust funds" on the Balance Sheets. See Notes 17 and 21 for additional information on the nuclear decommissioning trust funds. Accretion expense, associated with the obligation, was $26 million in 2009, $24 million in 2008 and $22 million in 2007, and is included in "Other operation and maintenance" on the Statements of Income. (PPL and PPL Electric) PPL Electric has identified legal retirement obligations for the retirement of certain transmission assets that could not be
reasonably estimated due to indeterminable settlement dates. These assets are located on rights-of-way that allow the grantor to require PPL Electric to relocate or remove the assets. Since this option is at the discretion of the grantor of the right-of-way, PPL Electric is unable to determine when these events may occur. 21. Available-for-Sale Securities (PPL, PPL Energy Supply and PPL Electric) PPL and its subsidiaries classify auction rate securities, certain short-term investments and securities held by the NDT funds as available-for-sale. Available-for-sale securities are carried on the balance sheet at fair value. Unrealized gains and losses on these securities are reported, net of tax, in OCI or are recognized currently in earnings when a decline in fair value is determined to be other-than-temporary. (PPL and PPL Energy Supply) The following table shows the amortized cost of available-for-sale securities and the gross unrealized gains and losses recorded in AOCI at December 31. See Note 17 for information regarding the fair value of these securities.
2009 2008
Amortized
Cost
Gross Unrealized
Gains
Gross Unrealized
Losses Amortized
Cost
Gross Unrealized
Gains
Gross Unrealized Losses (a)
PPL Short-term investments – municipal debt securities $ 150 NDT funds:
Cash and cash equivalents $ 7 4 Equity securities:
U.S. large-cap 170 $ 89 160 $ 22 U.S. mid/small-cap 65 36 60 9
Debt securities: U.S. Treasury 72 2 67 10 U.S. government agency 9 13 1 Municipality 63 2 59 2 Investment-grade corporate 28 1 31 2 Residential mortgage-backed securities 1 2 Other 1
Receivables/Payables, net 3 3 418 130 400 46
Auction rate securities 25 29 $ (5)Total PPL $ 443 $ 130 $ 579 $ 46 $ (5)
PPL Energy Supply Short-term investments – municipal debt securities $ 150 NDT funds:
Cash and cash equivalents $ 7 4 Equity securities:
U.S. large-cap 170 $ 89 160 $ 22 U.S. mid/small-cap 65 36 60 9
Debt securities: U.S. Treasury 72 2 67 10 U.S. government agency 9 13 1 Municipality 63 2 59 2 Investment-grade corporate 28 1 31 2 Residential mortgage-backed securities 1 2 Other 1
Receivables/Payables, net 3 3 418 130 400 46
Auction rate securities 20 24 $ (5)Total PPL Energy Supply $ 438 $ 130 $ 574 $ 46 $ (5)
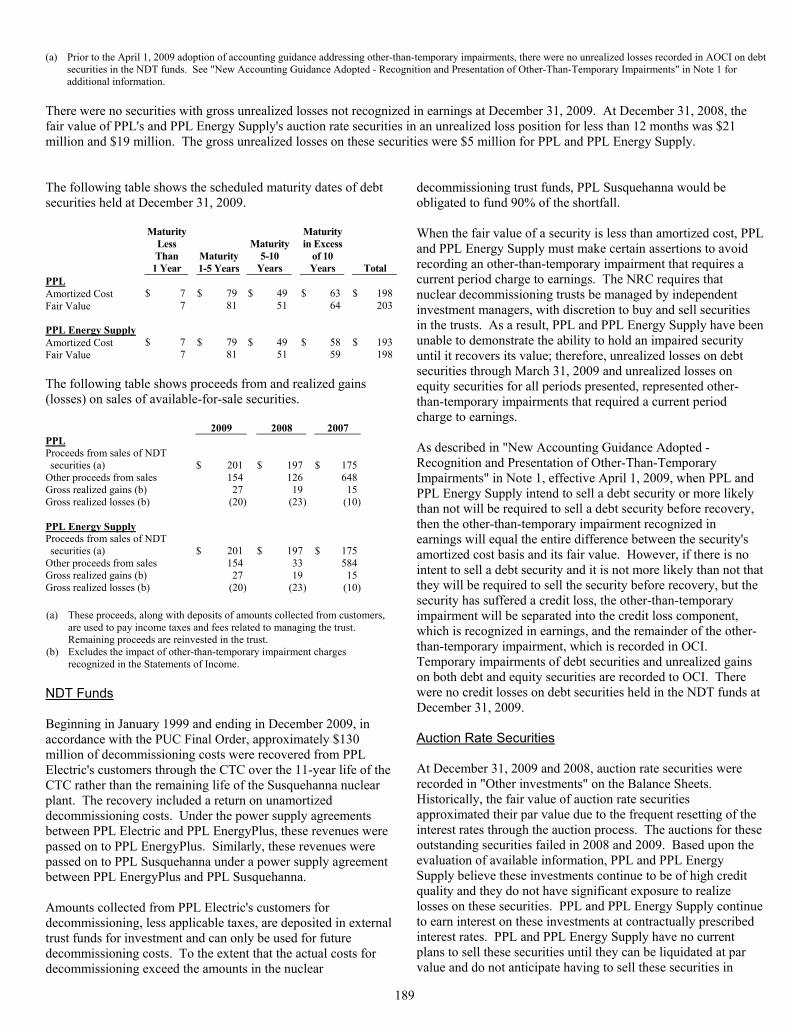
189
(a) Prior to the April 1, 2009 adoption of accounting guidance addressing other-than-temporary impairments, there were no unrealized losses recorded in AOCI on debt securities in the NDT funds. See "New Accounting Guidance Adopted - Recognition and Presentation of Other-Than-Temporary Impairments" in Note 1 for additional information.
There were no securities with gross unrealized losses not recognized in earnings at December 31, 2009. At December 31, 2008, the fair value of PPL's and PPL Energy Supply's auction rate securities in an unrealized loss position for less than 12 months was $21 million and $19 million. The gross unrealized losses on these securities were $5 million for PPL and PPL Energy Supply. The following table shows the scheduled maturity dates of debt securities held at December 31, 2009.
Maturity Less Than
1 Year Maturity 1-5 Years
Maturity 5-10
Years
Maturityin Excess
of 10 Years Total
PPL Amortized Cost $ 7 $ 79 $ 49 $ 63 $ 198Fair Value 7 81 51 64 203 PPL Energy Supply Amortized Cost $ 7 $ 79 $ 49 $ 58 $ 193Fair Value 7 81 51 59 198 The following table shows proceeds from and realized gains (losses) on sales of available-for-sale securities. 2009 2008 2007 PPL Proceeds from sales of NDT securities (a) $ 201 $ 197 $ 175
Other proceeds from sales 154 126 648Gross realized gains (b) 27 19 15Gross realized losses (b) (20) (23) (10) PPL Energy Supply Proceeds from sales of NDT securities (a) $ 201 $ 197 $ 175
Other proceeds from sales 154 33 584Gross realized gains (b) 27 19 15Gross realized losses (b) (20) (23) (10) (a) These proceeds, along with deposits of amounts collected from customers,
are used to pay income taxes and fees related to managing the trust. Remaining proceeds are reinvested in the trust.
(b) Excludes the impact of other-than-temporary impairment charges recognized in the Statements of Income.
NDT Funds Beginning in January 1999 and ending in December 2009, in accordance with the PUC Final Order, approximately $130 million of decommissioning costs were recovered from PPL Electric's customers through the CTC over the 11-year life of the CTC rather than the remaining life of the Susquehanna nuclear plant. The recovery included a return on unamortized decommissioning costs. Under the power supply agreements between PPL Electric and PPL EnergyPlus, these revenues were passed on to PPL EnergyPlus. Similarly, these revenues were passed on to PPL Susquehanna under a power supply agreement between PPL EnergyPlus and PPL Susquehanna. Amounts collected from PPL Electric's customers for decommissioning, less applicable taxes, are deposited in external trust funds for investment and can only be used for future decommissioning costs. To the extent that the actual costs for decommissioning exceed the amounts in the nuclear
decommissioning trust funds, PPL Susquehanna would be obligated to fund 90% of the shortfall. When the fair value of a security is less than amortized cost, PPL and PPL Energy Supply must make certain assertions to avoid recording an other-than-temporary impairment that requires a current period charge to earnings. The NRC requires that nuclear decommissioning trusts be managed by independent investment managers, with discretion to buy and sell securities in the trusts. As a result, PPL and PPL Energy Supply have been unable to demonstrate the ability to hold an impaired security until it recovers its value; therefore, unrealized losses on debt securities through March 31, 2009 and unrealized losses on equity securities for all periods presented, represented other-than-temporary impairments that required a current period charge to earnings. As described in "New Accounting Guidance Adopted - Recognition and Presentation of Other-Than-Temporary Impairments" in Note 1, effective April 1, 2009, when PPL and PPL Energy Supply intend to sell a debt security or more likely than not will be required to sell a debt security before recovery, then the other-than-temporary impairment recognized in earnings will equal the entire difference between the security's amortized cost basis and its fair value. However, if there is no intent to sell a debt security and it is not more likely than not that they will be required to sell the security before recovery, but the security has suffered a credit loss, the other-than-temporary impairment will be separated into the credit loss component, which is recognized in earnings, and the remainder of the other-than-temporary impairment, which is recorded in OCI. Temporary impairments of debt securities and unrealized gains on both debt and equity securities are recorded to OCI. There were no credit losses on debt securities held in the NDT funds at December 31, 2009. Auction Rate Securities At December 31, 2009 and 2008, auction rate securities were recorded in "Other investments" on the Balance Sheets. Historically, the fair value of auction rate securities approximated their par value due to the frequent resetting of the interest rates through the auction process. The auctions for these outstanding securities failed in 2008 and 2009. Based upon the evaluation of available information, PPL and PPL Energy Supply believe these investments continue to be of high credit quality and they do not have significant exposure to realize losses on these securities. PPL and PPL Energy Supply continue to earn interest on these investments at contractually prescribed interest rates. PPL and PPL Energy Supply have no current plans to sell these securities until they can be liquidated at par value and do not anticipate having to sell these securities in

190
order to fund operations or for any other purpose. As such, the decline in fair value noted below was deemed temporary due to general market conditions. At December 31, 2008, the estimated fair value of the auction rate securities was $5 million lower than par value for PPL and PPL Energy Supply. In 2008, unrealized losses of $5 million for both PPL and PPL Energy Supply were recorded to OCI. During 2009, PPL Energy Supply liquidated $4 million of these securities at par. At December 31, 2009, the estimated fair value was determined to approximate par value. As such, PPL and PPL Energy Supply reversed $5 million of previously recorded temporary impairments. See Note 17 for additional information on these securities, including fair value. Short-term Investments (PPL and PPL Energy Supply) In December 2008, the PEDFA issued $150 million aggregate principal amount of Exempt Facilities Revenue Bonds, Series 2008A and 2008B due 2038 (Series 2008 Bonds) on behalf of PPL Energy Supply. PPL Investment Corp. acted as the initial purchaser of the Series 2008 Bonds upon issuance. At December 31, 2008, these investments were reflected in "Short-term investments" on the Balance Sheet. In April 2009, PPL Investment Corp. received $150 million for its investment in the Series 2008 bonds when they were refunded by the PEDFA. See "Long-term Debt" in Note 7 for more information on the refundings. No realized or unrealized gains (losses) were recorded on these securities, as the difference between carrying value and fair value was insignificant. (PPL and PPL Electric) In October 2008, the PEDFA issued $90 million aggregate principal amount of Pollution Control Revenue Refunding Bonds, Series 2008 (PPL Electric Utilities Corporation Project) due 2023 (PPL Electric Series 2008 Bonds) on behalf of PPL Electric. PPL Electric acted as the initial purchaser of the PPL Electric Series 2008 Bonds upon issuance. PPL Electric remarketed the PPL Electric Series 2008 Bonds to unaffiliated investors in November 2008. No realized or unrealized gains (losses) were recorded in 2008 related to these securities, as the difference between carrying value and fair value was insignificant. 22. New Accounting Guidance Pending Adoption (PPL, PPL Energy Supply and PPL Electric) Accounting for Transfers of Financial Assets Effective January 1, 2010, PPL and its subsidiaries will adopt accounting guidance that was issued to revise the accounting for transfers of financial assets. This guidance: • eliminates the concept of a qualifying special-purpose entity
(QSPE); therefore, QSPEs will be subject to consolidation guidance;
• changes the requirements for the derecognition of financial
assets; • establishes new criteria for reporting the transfer of a
portion of a financial asset as a sale; • requires transferors to initially recognize, at fair value,
assets obtained and liabilities incurred as a result of a transfer accounted for as a sale; and
• requires enhanced disclosures to improve the transparency around transfers of financial assets and a transferor's continuing involvement.
Early adoption is prohibited. This guidance will be applied prospectively to new transfers of financial assets. Disclosures will be required for all transfers, including those entered into before the effective date. Comparative disclosures are encouraged, but not required, for periods in which these disclosures were not previously required. The January 1, 2010 adoption is not expected to have a significant impact on PPL and its subsidiaries; however, the impact in future periods could be material. Consolidation of Variable Interest Entities Effective January 1, 2010, PPL and its subsidiaries will adopt accounting guidance that was issued to replace the quantitative-based risks and rewards calculation for determining which entity, if any, has a controlling financial interest in a variable interest entity (VIE) and is the primary beneficiary. The primary beneficiary must consolidate the VIE. This guidance: • prescribes a qualitative approach focused on identifying
which entity has the power to direct the activities of a VIE that most significantly impact the VIE's economic performance and the obligation to absorb losses of or the right to receive benefits from the VIE that could potentially be significant to the VIE;
• requires ongoing assessments of whether an entity is the primary beneficiary of a VIE;
• requires enhanced disclosures to improve the transparency of an entity's involvement in a VIE;
• requires that all previous consolidation conclusions be reconsidered; and
• requires that QSPEs be evaluated for consolidation (resulting from the elimination of the QSPE concept in the guidance addressing accounting for transfers of financial assets).
If the initial application results in consolidation of a VIE, the assets, liabilities and noncontrolling interests of the VIE will be measured at their carrying amounts as if this guidance had been applied from the point in time the entity became the primary beneficiary of the VIE (unless the fair value option is elected). Any difference between the net amounts required to be recognized and the amount of any previously recognized interest will be reflected as a cumulative-effect adjustment to retained earnings. If initial application results in deconsolidation of a VIE, any retained interest in the VIE will be measured at its carrying value as if this guidance had been applied from the inception of the VIE. Early adoption is prohibited. Comparative disclosures are not required for periods in which these disclosures were not
191
previously required. PPL and its subsidiaries are assessing the potential impact of adoption to the financial statements. The January 1, 2010 adoption is not expected to have a significant impact on PPL and its subsidiaries; however, the impact in future periods could be material. Improving Disclosures about Fair Value Measurements Effective January 1, 2010, PPL and its subsidiaries will prospectively adopt accounting guidance that was issued to improve disclosures about fair value measurements. This guidance: • requires disclosures be provided for each class of assets and
liabilities, with class determined on the basis of the nature and risks of the assets and liabilities;
• for recurring fair value measurements, requires disclosure of significant transfers between Levels 1 and 2 and transfers into and out of Level 3 and the reasons for those transfers; and
• clarifies that a description of valuation techniques and inputs used to measure fair value is required for Level 2 and Level 3 recurring and nonrecurring fair value measurements.
Effective January 1, 2011, PPL and its subsidiaries will adopt provisions of this guidance that require Level 3 activity of purchases, sales, issuances and settlements be provided on a gross basis. This guidance makes corresponding amendments to employers' disclosures about pensions and other postretirement benefits.
Early adoption is permitted. Comparative disclosures are required only for periods ending after initial adoption. PPL and its subsidiaries are assessing the potential impact of adoption. The adoption could have a significant impact on required disclosures. Subsequent Measurement - Cash Flow Hedges Effective April 1, 2010, PPL and its subsidiaries will prospectively adopt accounting guidance that was issued to clarify how an entity should reflect the subsequent measurement of cash flow hedges in AOCI if, during a prior period, hedge accounting was not permitted. This situation may arise if an entity's retrospective assessment of hedge effectiveness indicated that the hedging relationship had not been highly effective in a period, but the prospective assessment of hedge effectiveness showed an expectation that the hedging relationship would be highly effective in the future; therefore, the hedging relationship continued even though hedge accounting was not permitted for a certain period. This guidance: • requires that the cumulative gain or loss on the derivative
that is used to determine the maximum amount of gain or loss that may be reflected in AOCI exclude the gains or losses that occurred during the period when hedge accounting was not permitted; and
• requires that the cumulative change in the expected future cash flows on the hedged transaction exclude the changes related to the period when hedge accounting was not applied.
PPL and its subsidiaries are assessing the potential impact of adoption. The potential impact of adoption is not yet determinable but could be material.
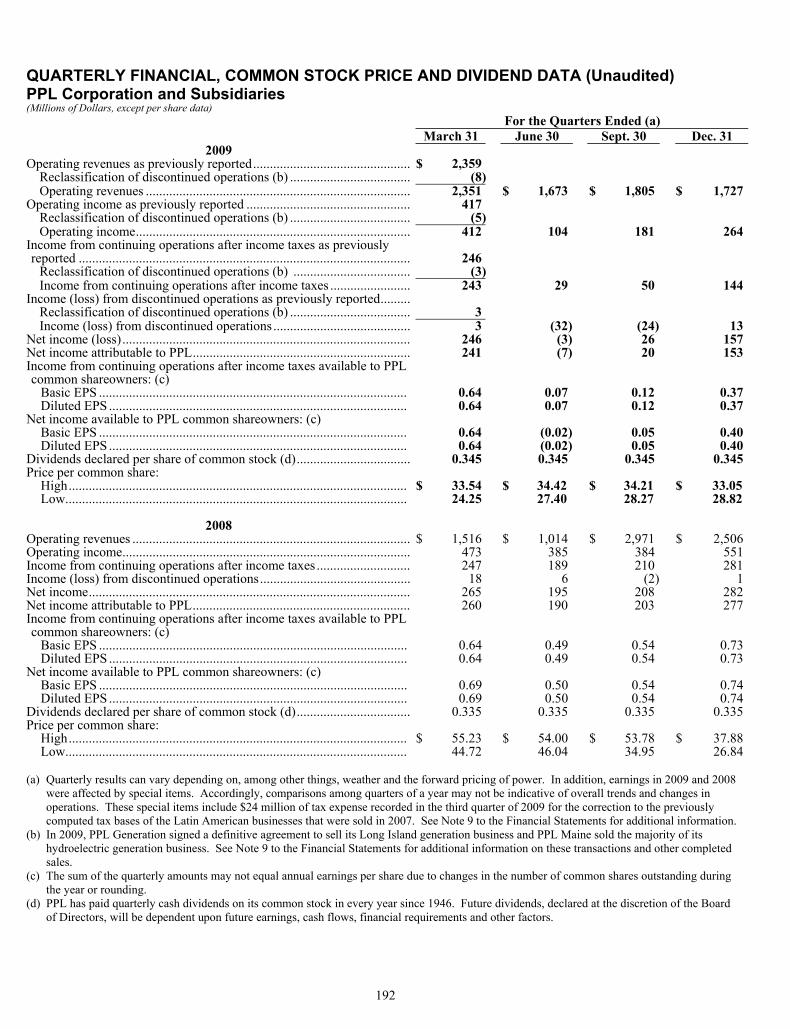
192
QUARTERLY FINANCIAL, COMMON STOCK PRICE AND DIVIDEND DATA (Unaudited) PPL Corporation and Subsidiaries (Millions of Dollars, except per share data)
For the Quarters Ended (a) March 31 June 30 Sept. 30 Dec. 31
2009 Operating revenues as previously reported............................................... $ 2,359
Reclassification of discontinued operations (b) .................................... (8) Operating revenues ............................................................................... 2,351 $ 1,673 $ 1,805 $ 1,727
Operating income as previously reported ................................................. 417 Reclassification of discontinued operations (b) .................................... (5) Operating income.................................................................................. 412 104 181 264
Income from continuing operations after income taxes as previously reported ................................................................................................... 246
Reclassification of discontinued operations (b) ................................... (3) Income from continuing operations after income taxes ........................ 243 29 50 144
Income (loss) from discontinued operations as previously reported......... Reclassification of discontinued operations (b) .................................... 3 Income (loss) from discontinued operations ......................................... 3 (32) (24) 13
Net income (loss)...................................................................................... 246 (3) 26 157Net income attributable to PPL................................................................. 241 (7) 20 153Income from continuing operations after income taxes available to PPL common shareowners: (c)
Basic EPS ............................................................................................ 0.64 0.07 0.12 0.37Diluted EPS ......................................................................................... 0.64 0.07 0.12 0.37
Net income available to PPL common shareowners: (c) Basic EPS ............................................................................................ 0.64 (0.02) 0.05 0.40Diluted EPS ......................................................................................... 0.64 (0.02) 0.05 0.40
Dividends declared per share of common stock (d).................................. 0.345 0.345 0.345 0.345Price per common share:
High..................................................................................................... $ 33.54 $ 34.42 $ 34.21 $ 33.05Low...................................................................................................... 24.25 27.40 28.27 28.82
2008
Operating revenues ................................................................................... $ 1,516 $ 1,014 $ 2,971 $ 2,506Operating income...................................................................................... 473 385 384 551Income from continuing operations after income taxes ............................ 247 189 210 281Income (loss) from discontinued operations............................................. 18 6 (2) 1Net income................................................................................................ 265 195 208 282Net income attributable to PPL................................................................. 260 190 203 277Income from continuing operations after income taxes available to PPL common shareowners: (c)
Basic EPS ............................................................................................ 0.64 0.49 0.54 0.73Diluted EPS ......................................................................................... 0.64 0.49 0.54 0.73
Net income available to PPL common shareowners: (c) Basic EPS ............................................................................................ 0.69 0.50 0.54 0.74Diluted EPS ......................................................................................... 0.69 0.50 0.54 0.74
Dividends declared per share of common stock (d).................................. 0.335 0.335 0.335 0.335Price per common share:
High..................................................................................................... $ 55.23 $ 54.00 $ 53.78 $ 37.88Low...................................................................................................... 44.72 46.04 34.95 26.84
(a) Quarterly results can vary depending on, among other things, weather and the forward pricing of power. In addition, earnings in 2009 and 2008
were affected by special items. Accordingly, comparisons among quarters of a year may not be indicative of overall trends and changes in operations. These special items include $24 million of tax expense recorded in the third quarter of 2009 for the correction to the previously computed tax bases of the Latin American businesses that were sold in 2007. See Note 9 to the Financial Statements for additional information.
(b) In 2009, PPL Generation signed a definitive agreement to sell its Long Island generation business and PPL Maine sold the majority of its hydroelectric generation business. See Note 9 to the Financial Statements for additional information on these transactions and other completed sales.
(c) The sum of the quarterly amounts may not equal annual earnings per share due to changes in the number of common shares outstanding during the year or rounding.
(d) PPL has paid quarterly cash dividends on its common stock in every year since 1946. Future dividends, declared at the discretion of the Board of Directors, will be dependent upon future earnings, cash flows, financial requirements and other factors.
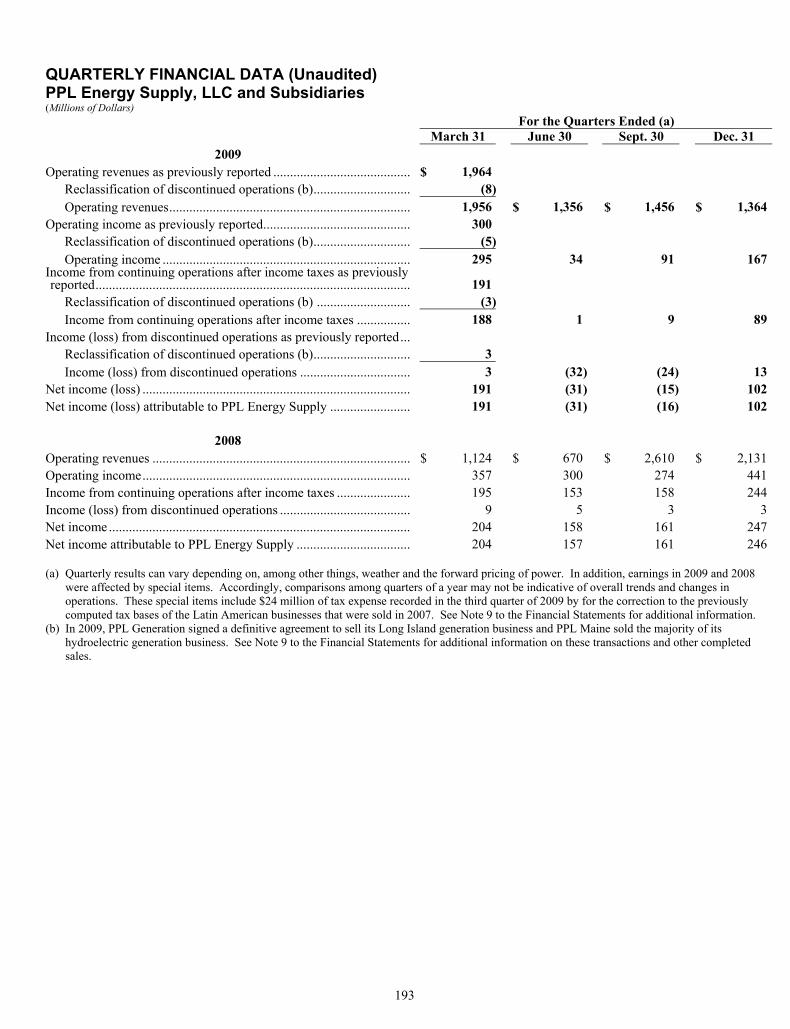
193
QUARTERLY FINANCIAL DATA (Unaudited) PPL Energy Supply, LLC and Subsidiaries (Millions of Dollars)
For the Quarters Ended (a) March 31 June 30 Sept. 30 Dec. 31
2009 Operating revenues as previously reported ......................................... $ 1,964
Reclassification of discontinued operations (b)............................. (8) Operating revenues........................................................................ 1,956 $ 1,356 $ 1,456 $ 1,364
Operating income as previously reported............................................ 300 Reclassification of discontinued operations (b)............................. (5) Operating income .......................................................................... 295 34 91 167
Income from continuing operations after income taxes as previously reported.............................................................................................. 191
Reclassification of discontinued operations (b) ............................ (3) Income from continuing operations after income taxes ................ 188 1 9 89
Income (loss) from discontinued operations as previously reported... Reclassification of discontinued operations (b)............................. 3 Income (loss) from discontinued operations ................................. 3 (32) (24) 13
Net income (loss) ................................................................................ 191 (31) (15) 102Net income (loss) attributable to PPL Energy Supply ........................ 191 (31) (16) 102
2008
Operating revenues ............................................................................. $ 1,124 $ 670 $ 2,610 $ 2,131Operating income................................................................................ 357 300 274 441Income from continuing operations after income taxes ...................... 195 153 158 244Income (loss) from discontinued operations ....................................... 9 5 3 3Net income .......................................................................................... 204 158 161 247Net income attributable to PPL Energy Supply .................................. 204 157 161 246 (a) Quarterly results can vary depending on, among other things, weather and the forward pricing of power. In addition, earnings in 2009 and 2008
were affected by special items. Accordingly, comparisons among quarters of a year may not be indicative of overall trends and changes in operations. These special items include $24 million of tax expense recorded in the third quarter of 2009 by for the correction to the previously computed tax bases of the Latin American businesses that were sold in 2007. See Note 9 to the Financial Statements for additional information.
(b) In 2009, PPL Generation signed a definitive agreement to sell its Long Island generation business and PPL Maine sold the majority of its hydroelectric generation business. See Note 9 to the Financial Statements for additional information on these transactions and other completed sales.
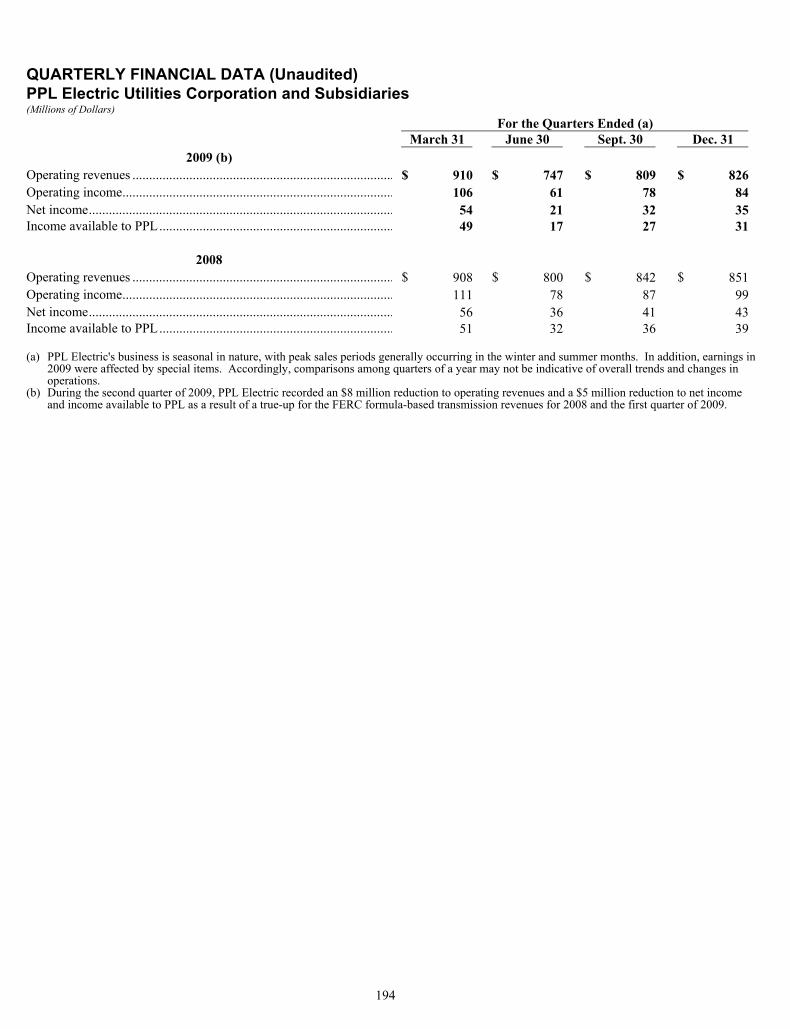
194
QUARTERLY FINANCIAL DATA (Unaudited) PPL Electric Utilities Corporation and Subsidiaries (Millions of Dollars)
For the Quarters Ended (a) March 31 June 30 Sept. 30 Dec. 31
2009 (b) Operating revenues .............................................................................. $ 910 $ 747 $ 809 $ 826Operating income................................................................................. 106 61 78 84Net income........................................................................................... 54 21 32 35Income available to PPL...................................................................... 49 17 27 31
2008 Operating revenues .............................................................................. $ 908 $ 800 $ 842 $ 851Operating income................................................................................. 111 78 87 99Net income........................................................................................... 56 36 41 43Income available to PPL...................................................................... 51 32 36 39 (a) PPL Electric's business is seasonal in nature, with peak sales periods generally occurring in the winter and summer months. In addition, earnings in
2009 were affected by special items. Accordingly, comparisons among quarters of a year may not be indicative of overall trends and changes in operations.
(b) During the second quarter of 2009, PPL Electric recorded an $8 million reduction to operating revenues and a $5 million reduction to net income and income available to PPL as a result of a true-up for the FERC formula-based transmission revenues for 2008 and the first quarter of 2009.
195
ITEM 9. CHANGES IN AND DISAGREEMENTS WITH ACCOUNTANTS
ON ACCOUNTING AND FINANCIAL DISCLOSURE PPL Corporation, PPL Energy Supply, LLC and PPL Electric Utilities Corporation None.
ITEM 9A. CONTROLS AND PROCEDURES PPL Corporation, PPL Energy Supply, LLC and PPL Electric Utilities Corporation (a) Evaluation of disclosure controls and procedures.
The registrants' principal executive officers and principal financial officers, based on their evaluation of the registrants' disclosure controls and procedures (as defined in Rules 13a-15(e) and 15d-15(e) of the Securities Exchange Act of 1934) have concluded that, as of December 31, 2009, the registrants' disclosure controls and procedures are effective to ensure that material information relating to the registrants and their consolidated subsidiaries is recorded, processed, summarized and reported within the time periods specified by the SEC's rules and forms, particularly during the period for which this annual report has been prepared. The aforementioned principal officers have concluded that the disclosure controls and procedures are also effective to ensure that information required to be disclosed in reports filed under the Exchange Act is accumulated and communicated to management, including the principal executive and principal financial officers, to allow for timely decisions regarding required disclosure.
(b) Changes in internal control over financial reporting.
The registrants' principal executive officers and principal financial officers have concluded that there were no changes in the registrants' internal control over financial reporting during the registrants' fourth fiscal quarter that have materially affected, or are reasonably likely to materially affect, the registrants' internal control over financial reporting.
Management's Report on Internal Control over Financial Reporting PPL Corporation
PPL's management is responsible for establishing and maintaining adequate internal control over financial reporting, as such term is defined in Exchange Act Rule 13a-15(f). PPL's internal control over financial reporting is a process designed to provide reasonable assurance to PPL's management and Board of Directors regarding the reliability of financial reporting and the preparation of financial statements for external purposes in accordance with generally accepted accounting principles. Because of its inherent limitations, internal control over financial reporting may not prevent or detect misstatements. Under the supervision and with the participation of our management, including our principal executive officer and principal financial officer, we conducted an evaluation of the effectiveness of our internal control over financial reporting based on the framework in "Internal Control - Integrated Framework" issued by the Committee of Sponsoring Organizations of the Treadway Commission. Based on our evaluation under the framework in "Internal Control - Integrated Framework," our management concluded that our internal control over financial reporting was effective as of December 31, 2009. The effectiveness of our internal control over financial reporting has been audited by Ernst & Young LLP, an independent registered public accounting firm, as stated in their report contained on page 90.
ITEM 9A(T). CONTROLS AND PROCEDURES
PPL Energy Supply, LLC and PPL Electric Utilities Corporation
Management of PPL's non-accelerated filer companies, PPL Energy Supply and PPL Electric, is responsible for establishing and maintaining adequate internal control over financial reporting, as such term is defined in Exchange Act Rule 13a-15(f). PPL's internal control over financial reporting is a process designed to provide reasonable assurance to PPL's management and Board of Directors regarding the reliability of financial reporting and the preparation of financial statements for external purposes in accordance with generally accepted accounting principles. Because of its inherent limitations, internal control over financial reporting may not prevent or detect misstatements. Under the supervision and with the participation of our management, including our principal executive officers and principal
196
financial officers, we conducted an evaluation of the effectiveness of our internal control over financial reporting based on the framework in "Internal Control - Integrated Framework" issued by the Committee of Sponsoring Organizations of the Treadway Commission. Based on our evaluation under the framework in "Internal Control - Integrated Framework," our management concluded that our internal control over financial reporting was effective as of December 31, 2009. This annual report does not include an attestation report of Ernst & Young LLP, the companies' independent registered public accounting firm regarding internal control over financial reporting. Management's report was not subject to attestation by the companies' registered public accounting firm pursuant to temporary rules of the Securities and Exchange Commission that permit the companies to provide only management's report in this annual report.
ITEM 9B. OTHER INFORMATION
PPL Corporation, PPL Energy Supply, LLC and PPL Electric Utilities Corporation None.
PART III
ITEM 10. DIRECTORS, EXECUTIVE OFFICERS AND CORPORATE GOVERNANCE PPL Corporation Additional information for this item will be set forth in the sections entitled "Nominees for Directors," "Directors Continuing in Office," "Board Committees - Audit Committee" and "Section 16(a) Beneficial Ownership Reporting Compliance" in PPL's 2010 Notice of Annual Meeting and Proxy Statement, which will be filed with the SEC not later than 120 days after December 31, 2009, and which information is incorporated herein by reference. There have been no changes to the procedures by which shareowners may recommend nominees to PPL's board of directors since the filing with the SEC of PPL's 2009 Notice of Annual Meeting and Proxy Statement. Information required by this item concerning the executive officers of PPL is set forth at the end of Part I of this report. PPL has adopted a code of ethics entitled "Standards of Conduct and Integrity" that applies to all directors, managers, trustees, officers (including the principal executive officers, principal financial officers and principal accounting officers (each, a "principal officer")), employees and agents of PPL and PPL's subsidiaries for which it has operating control (including PPL Energy Supply and PPL Electric). The "Standards of Conduct and Integrity" are posted on PPL's Internet Web site: www.pplweb.com/about/corporate+governance. A description of any amendment to the "Standards of Conduct and Integrity" (other than a technical, administrative or other non-substantive amendment) will be posted on PPL's Internet Web site within four business days following the date of the amendment. In addition, if a waiver constituting a material departure from a provision of the "Standards of Conduct and Integrity" is granted to one of the principal officers, a description of the nature of the waiver, the name of the person to whom the waiver was granted and the date of the waiver will be posted on PPL's Internet Web site within four business days following the date of the waiver. PPL also has adopted its "Guidelines for Corporate Governance," which address, among other things, director qualification standards and director and board committee responsibilities. These guidelines, and the charters of each of the committees of PPL's board of directors, are posted on PPL's Internet Web site: www.pplweb.com/about/corporate+governance. PPL Energy Supply, LLC Item 10 is omitted as PPL Energy Supply meets the conditions set forth in General Instruction (I)(1)(a) and (b) of Form 10-K. PPL Electric Utilities Corporation Additional information for this item will be set forth in the sections entitled "Nominees for Directors," "Board Committees," and "Section 16(a) Beneficial Ownership Reporting Compliance" in PPL Electric's 2010 Notice of Annual Meeting and Information Statement, which will be filed with the SEC not later than 120 days after December 31, 2009, and which information is incorporated herein by reference. PPL Electric's parent, PPL, has adopted a code of ethics entitled "Standards of Conduct and Integrity," which applies to all directors, managers, officers (including the principal executive officers, principal financial officers and principal accounting officers), employees and agents of PPL Electric and its subsidiaries. The full text of the "Standards of Conduct and Integrity" is posted in the Corporate Governance section of PPL's Internet Web site: www.pplweb.com/about/corporate+governance. Information required by this item concerning the executive officers of PPL Electric is set forth at the end of Part I of this report.
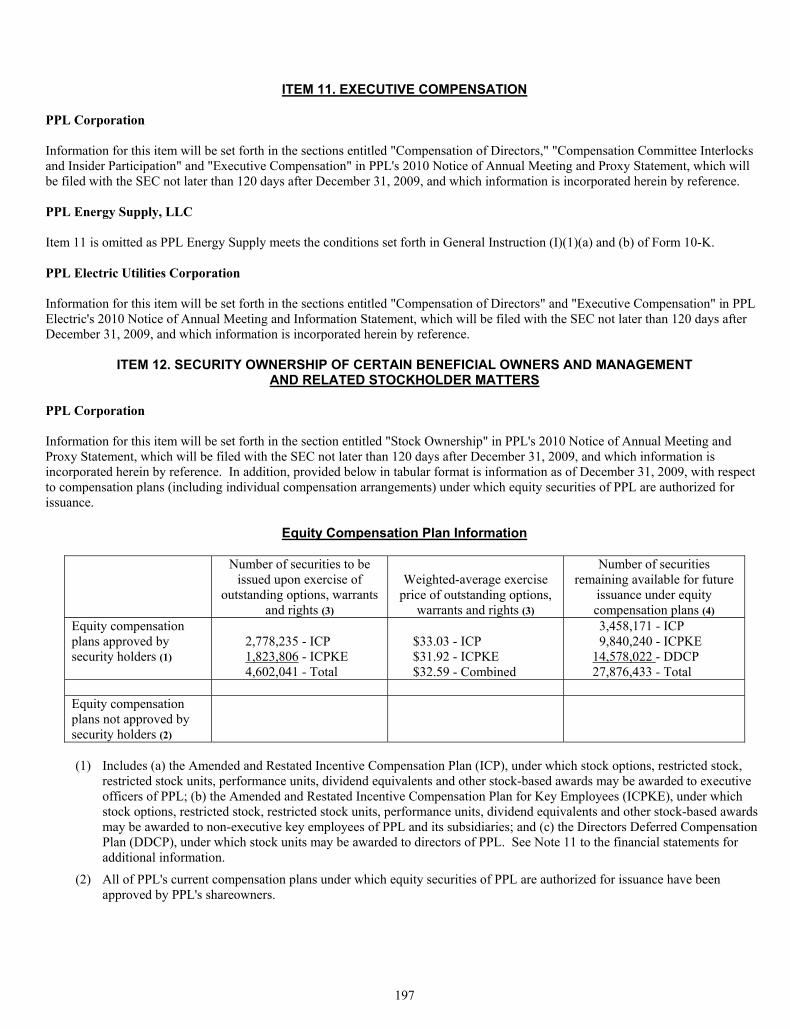
197
ITEM 11. EXECUTIVE COMPENSATION PPL Corporation Information for this item will be set forth in the sections entitled "Compensation of Directors," "Compensation Committee Interlocks and Insider Participation" and "Executive Compensation" in PPL's 2010 Notice of Annual Meeting and Proxy Statement, which will be filed with the SEC not later than 120 days after December 31, 2009, and which information is incorporated herein by reference. PPL Energy Supply, LLC Item 11 is omitted as PPL Energy Supply meets the conditions set forth in General Instruction (I)(1)(a) and (b) of Form 10-K. PPL Electric Utilities Corporation Information for this item will be set forth in the sections entitled "Compensation of Directors" and "Executive Compensation" in PPL Electric's 2010 Notice of Annual Meeting and Information Statement, which will be filed with the SEC not later than 120 days after December 31, 2009, and which information is incorporated herein by reference.
ITEM 12. SECURITY OWNERSHIP OF CERTAIN BENEFICIAL OWNERS AND MANAGEMENT AND RELATED STOCKHOLDER MATTERS
PPL Corporation Information for this item will be set forth in the section entitled "Stock Ownership" in PPL's 2010 Notice of Annual Meeting and Proxy Statement, which will be filed with the SEC not later than 120 days after December 31, 2009, and which information is incorporated herein by reference. In addition, provided below in tabular format is information as of December 31, 2009, with respect to compensation plans (including individual compensation arrangements) under which equity securities of PPL are authorized for issuance.
Equity Compensation Plan Information
Number of securities to be issued upon exercise of
outstanding options, warrants and rights (3)
Weighted-average exercise price of outstanding options,
warrants and rights (3)
Number of securities remaining available for future
issuance under equity compensation plans (4)
Equity compensation plans approved by security holders (1)
2,778,235 - ICP 1,823,806 - ICPKE 4,602,041 - Total
$33.03 - ICP $31.92 - ICPKE $32.59 - Combined
3,458,171 - ICP 9,840,240 - ICPKE 14,578,022 - DDCP 27,876,433 - Total
Equity compensation plans not approved by security holders (2)
(1) Includes (a) the Amended and Restated Incentive Compensation Plan (ICP), under which stock options, restricted stock,
restricted stock units, performance units, dividend equivalents and other stock-based awards may be awarded to executive officers of PPL; (b) the Amended and Restated Incentive Compensation Plan for Key Employees (ICPKE), under which stock options, restricted stock, restricted stock units, performance units, dividend equivalents and other stock-based awardsmay be awarded to non-executive key employees of PPL and its subsidiaries; and (c) the Directors Deferred Compensation Plan (DDCP), under which stock units may be awarded to directors of PPL. See Note 11 to the financial statements for additional information.
(2) All of PPL's current compensation plans under which equity securities of PPL are authorized for issuance have been approved by PPL's shareowners.

198
(3) Relates to common stock issuable upon the exercise of stock options awarded under the ICP and ICPKE as of December 31, 2009. In addition, as of December 31, 2009, the following other securities had been awarded and are outstanding under the ICP, ICPKE and DDCP: 45,400 shares of restricted stock, 416,840 restricted stock units and 101,139 performance units under the ICP; 24,600 shares of restricted stock, 921,202 restricted stock units and 65,324 performance units under the ICPKE; and 406,584 stock units under the DDCP.
(4) Based upon the following aggregate award limitations under the ICP, ICPKE and DDCP: (a) under the ICP, 15,769,430 awards (i.e., 5% of the total PPL common stock outstanding as of April 23, 1999) granted after April 23, 1999; (b) under the ICPKE, 16,573,608 awards (i.e., 5% of the total PPL common stock outstanding as of January 1, 2003) granted after April 25, 2003, reduced by outstanding awards for which common stock was not yet issued as of such date of 2,373,812 resulting in a limit of 14,199,796; and (c) under the DDCP, 15,052,856 securities. In addition, each of the ICP and ICPKE includes an annual award limitation of 2% of total PPL common stock outstanding as of January 1 of each year.
PPL Energy Supply, LLC Item 12 is omitted as PPL Energy Supply meets the conditions set forth in General Instruction (I)(1)(a) and (b) of Form 10-K. PPL Electric Utilities Corporation Information for this item will be set forth in the section entitled "Stock Ownership" in PPL Electric's 2010 Notice of Annual Meeting and Information Statement, which will be filed with the SEC not later than 120 days after December 31, 2009, and which information is incorporated herein by reference.
ITEM 13. CERTAIN RELATIONSHIPS AND RELATED TRANSACTIONS, AND DIRECTOR INDEPENDENCE PPL Corporation Information for this item will be set forth in the sections entitled "Transactions with Related Persons" and "Independence of Directors" in PPL's 2010 Notice of Annual Meeting and Proxy Statement, which will be filed with the SEC not later than 120 days after December 31, 2009, and is incorporated herein by reference. PPL Energy Supply, LLC Item 13 is omitted as PPL Energy Supply meets the conditions set forth in General Instruction (I)(1)(a) and (b) of Form 10-K. PPL Electric Utilities Corporation Information for this item will be set forth in the sections entitled "Transactions with Related Persons" and "Nominations" in PPL Electric's 2010 Notice of Annual Meeting and Information Statement, which will be filed with the SEC not later than 120 days after December 31, 2009, and is incorporated herein by reference.
ITEM 14. PRINCIPAL ACCOUNTING FEES AND SERVICES PPL Corporation Information for this item will be set forth in the section entitled "Fees to Independent Auditor for 2009 and 2008" in PPL's 2010 Notice of Annual Meeting and Proxy Statement, which will be filed with the SEC not later than 120 days after December 31, 2009, and which information is incorporated herein by reference. PPL Energy Supply, LLC The following table presents an allocation of fees billed, including expenses, by Ernst & Young LLP (EY) to PPL for the fiscal years ended December 31, 2009 and 2008, for professional services rendered for the audit of PPL Energy Supply's annual financial statements and for fees billed for other services rendered by EY.
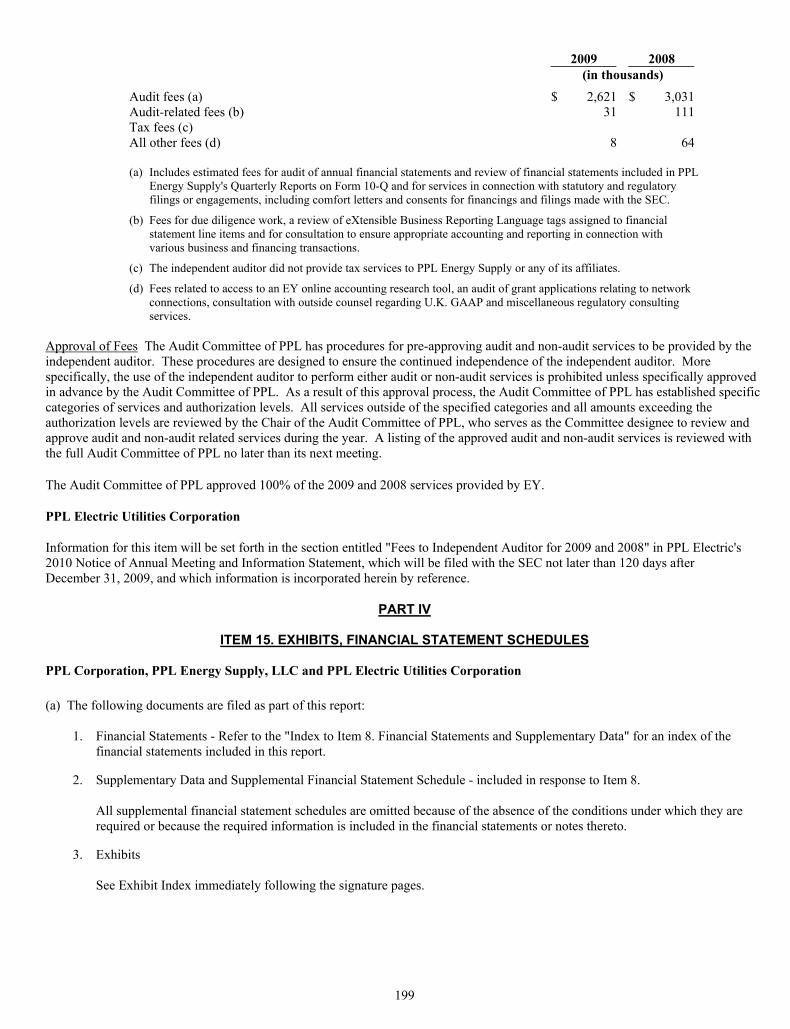
199
2009 2008 (in thousands) Audit fees (a) $ 2,621 $ 3,031Audit-related fees (b) 31 111Tax fees (c) All other fees (d) 8 64
(a) Includes estimated fees for audit of annual financial statements and review of financial statements included in PPL
Energy Supply's Quarterly Reports on Form 10-Q and for services in connection with statutory and regulatory filings or engagements, including comfort letters and consents for financings and filings made with the SEC.
(b) Fees for due diligence work, a review of eXtensible Business Reporting Language tags assigned to financial statement line items and for consultation to ensure appropriate accounting and reporting in connection with various business and financing transactions.
(c) The independent auditor did not provide tax services to PPL Energy Supply or any of its affiliates.
(d) Fees related to access to an EY online accounting research tool, an audit of grant applications relating to network connections, consultation with outside counsel regarding U.K. GAAP and miscellaneous regulatory consulting services.
Approval of Fees The Audit Committee of PPL has procedures for pre-approving audit and non-audit services to be provided by the independent auditor. These procedures are designed to ensure the continued independence of the independent auditor. More specifically, the use of the independent auditor to perform either audit or non-audit services is prohibited unless specifically approved in advance by the Audit Committee of PPL. As a result of this approval process, the Audit Committee of PPL has established specific categories of services and authorization levels. All services outside of the specified categories and all amounts exceeding the authorization levels are reviewed by the Chair of the Audit Committee of PPL, who serves as the Committee designee to review and approve audit and non-audit related services during the year. A listing of the approved audit and non-audit services is reviewed with the full Audit Committee of PPL no later than its next meeting. The Audit Committee of PPL approved 100% of the 2009 and 2008 services provided by EY. PPL Electric Utilities Corporation Information for this item will be set forth in the section entitled "Fees to Independent Auditor for 2009 and 2008" in PPL Electric's 2010 Notice of Annual Meeting and Information Statement, which will be filed with the SEC not later than 120 days after December 31, 2009, and which information is incorporated herein by reference.
PART IV
ITEM 15. EXHIBITS, FINANCIAL STATEMENT SCHEDULES
PPL Corporation, PPL Energy Supply, LLC and PPL Electric Utilities Corporation (a) The following documents are filed as part of this report:
1. Financial Statements - Refer to the "Index to Item 8. Financial Statements and Supplementary Data" for an index of the
financial statements included in this report. 2. Supplementary Data and Supplemental Financial Statement Schedule - included in response to Item 8.
All supplemental financial statement schedules are omitted because of the absence of the conditions under which they are required or because the required information is included in the financial statements or notes thereto.
3. Exhibits
See Exhibit Index immediately following the signature pages.
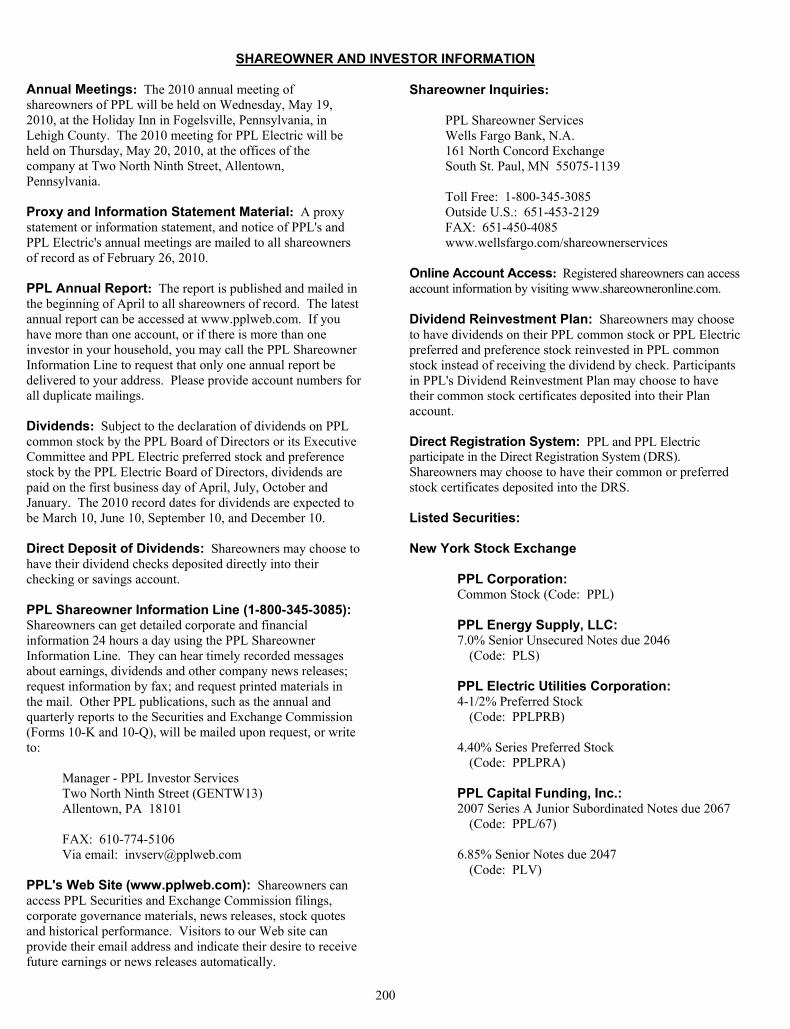
200
SHAREOWNER AND INVESTOR INFORMATION
Annual Meetings: The 2010 annual meeting of shareowners of PPL will be held on Wednesday, May 19, 2010, at the Holiday Inn in Fogelsville, Pennsylvania, in Lehigh County. The 2010 meeting for PPL Electric will be held on Thursday, May 20, 2010, at the offices of the company at Two North Ninth Street, Allentown, Pennsylvania. Proxy and Information Statement Material: A proxy statement or information statement, and notice of PPL's and PPL Electric's annual meetings are mailed to all shareowners of record as of February 26, 2010. PPL Annual Report: The report is published and mailed in the beginning of April to all shareowners of record. The latest annual report can be accessed at www.pplweb.com. If you have more than one account, or if there is more than one investor in your household, you may call the PPL Shareowner Information Line to request that only one annual report be delivered to your address. Please provide account numbers for all duplicate mailings. Dividends: Subject to the declaration of dividends on PPL common stock by the PPL Board of Directors or its Executive Committee and PPL Electric preferred stock and preference stock by the PPL Electric Board of Directors, dividends are paid on the first business day of April, July, October and January. The 2010 record dates for dividends are expected to be March 10, June 10, September 10, and December 10. Direct Deposit of Dividends: Shareowners may choose to have their dividend checks deposited directly into their checking or savings account. PPL Shareowner Information Line (1-800-345-3085): Shareowners can get detailed corporate and financial information 24 hours a day using the PPL Shareowner Information Line. They can hear timely recorded messages about earnings, dividends and other company news releases; request information by fax; and request printed materials in the mail. Other PPL publications, such as the annual and quarterly reports to the Securities and Exchange Commission (Forms 10-K and 10-Q), will be mailed upon request, or write to:
Manager - PPL Investor Services Two North Ninth Street (GENTW13) Allentown, PA 18101 FAX: 610-774-5106 Via email: [email protected]
PPL's Web Site (www.pplweb.com): Shareowners can access PPL Securities and Exchange Commission filings, corporate governance materials, news releases, stock quotes and historical performance. Visitors to our Web site can provide their email address and indicate their desire to receive future earnings or news releases automatically.
Shareowner Inquiries: PPL Shareowner Services Wells Fargo Bank, N.A. 161 North Concord Exchange South St. Paul, MN 55075-1139 Toll Free: 1-800-345-3085 Outside U.S.: 651-453-2129 FAX: 651-450-4085 www.wellsfargo.com/shareownerservices
Online Account Access: Registered shareowners can access account information by visiting www.shareowneronline.com. Dividend Reinvestment Plan: Shareowners may choose to have dividends on their PPL common stock or PPL Electric preferred and preference stock reinvested in PPL common stock instead of receiving the dividend by check. Participants in PPL's Dividend Reinvestment Plan may choose to have their common stock certificates deposited into their Plan account. Direct Registration System: PPL and PPL Electric participate in the Direct Registration System (DRS). Shareowners may choose to have their common or preferred stock certificates deposited into the DRS. Listed Securities: New York Stock Exchange PPL Corporation: Common Stock (Code: PPL) PPL Energy Supply, LLC:
7.0% Senior Unsecured Notes due 2046 (Code: PLS)
PPL Electric Utilities Corporation:
4-1/2% Preferred Stock (Code: PPLPRB)
4.40% Series Preferred Stock
(Code: PPLPRA) PPL Capital Funding, Inc.:
2007 Series A Junior Subordinated Notes due 2067 (Code: PPL/67)
6.85% Senior Notes due 2047
(Code: PLV)

201
Fiscal Agents: Stock Transfer Agent and Registrar; Dividend Reinvestment Plan Agent Wells Fargo Bank, N.A. Shareowner Services 161 North Concord Exchange South St. Paul, MN 55075-1139 Toll Free: 1-800-345-3085 Outside U.S.: 651-453-2129 Dividend Disbursing Office PPL Investor Services Two North Ninth Street (GENTW13) Allentown, PA 18101 FAX: 610-774-5106 Via email: [email protected] Or call the PPL Shareowner Information Line Toll Free: 1-800-345-3085
Mortgage Bond Trustee Transfer and Bond Interest Paying Agent Deutsche Bank Trust Company Americas 648 Grassmere Park Road Nashville, TN 37211 Toll Free: 1-800-735-7777 FAX: 615-835-2727 Indenture Trustee The Bank of New York Mellon 101 Barclay Street New York, NY 10286

202
SIGNATURES Pursuant to the requirements of Section 13 or 15(d) of the Securities Exchange Act of 1934, the Registrant has duly caused this report to be signed on its behalf by the undersigned, thereunto duly authorized.
PPL Corporation (Registrant)
By /s/ James H. Miller James H. Miller - Chairman, President and Chief Executive Officer
Pursuant to the requirements of the Securities Exchange Act of 1934, this report has been signed below by the following persons on behalf of the Registrant and in the capacities and on the date indicated.
TITLE
By /s/ James H. Miller Principal Executive Officer and Director James H. Miller - Chairman, President and Chief Executive Officer
By /s/ Paul A. Farr Principal Financial Officer Paul A. Farr - Executive Vice President and Chief Financial Officer
By /s/ J. Matt Simmons, Jr. Principal Accounting Officer J. Matt Simmons, Jr. - Vice President and Controller
Directors:
Frederick M. Bernthal Stuart Heydt John W. Conway Craig A. Rogerson E. Allen Deaver W. Keith Smith Louise K. Goeser Natica von Althann Stuart E. Graham Keith H. Williamson By /s/ James H. Miller James H. Miller, Attorney-in-fact Date: February 25, 2010

203
SIGNATURES Pursuant to the requirements of Section 13 or 15(d) of the Securities Exchange Act of 1934, the Registrant has duly caused this report to be signed on its behalf by the undersigned, thereunto duly authorized.
PPL Energy Supply, LLC (Registrant)
By /s/ James H. Miller James H. Miller - President Pursuant to the requirements of the Securities Exchange Act of 1934, this report has been signed below by the following persons on behalf of the Registrant and in the capacities and on the date indicated.
TITLE By /s/ James H. Miller Principal Executive Officer and Manager James H. Miller - President
By /s/ Paul A. Farr Principal Financial Officer and Manager Paul A. Farr - Executive Vice President
By /s/ J. Matt Simmons, Jr. Principal Accounting Officer J. Matt Simmons, Jr. - Vice President and Controller
Managers:
/s/ Robert J. Grey Robert J. Grey /s/ William H. Spence William H. Spence /s/ James E. Abel James E. Abel Date: February 25, 2010

204
SIGNATURES Pursuant to the requirements of Section 13 or 15(d) of the Securities Exchange Act of 1934, the Registrant has duly caused this report to be signed on its behalf by the undersigned, thereunto duly authorized.
PPL Electric Utilities Corporation (Registrant)
By /s/ David G. DeCampli David G. DeCampli - President Pursuant to the requirements of the Securities Exchange Act of 1934, this report has been signed below by the following persons on behalf of the Registrant and in the capacities and on the date indicated. TITLE By /s/ David G. DeCampli Principal Executive Officer and Director David G. DeCampli - President By /s/ J. Matt Simmons, Jr. Principal Financial Officer and J. Matt Simmons, Jr. - Principal Accounting Officer Vice President and Controller
Directors:
/s/ James H. Miller /s/ William H. Spence James H. Miller William H. Spence /s/ Paul A. Farr /s/ Dean A. Christiansen Paul A. Farr Dean A. Christiansen /s/ Robert J. Grey Robert J. Grey Date: February 25, 2010

205
EXHIBIT INDEX
The following Exhibits indicated by an asterisk preceding the Exhibit number are filed herewith. The balance of the Exhibits have heretofore been filed with the Commission and pursuant to Rule 12(b)-32 are incorporated herein by reference. Exhibits indicated by a [_] are filed or listed pursuant to Item 601(b)(10)(iii) of Regulation S-K. 3(a) - Amended and Restated Articles of Incorporation of PPL Corporation effective May 21, 2008 (Exhibit 3(i) to
PPL Corporation Form 8-K Report (File No. 1-11459) dated May 21, 2008) 3(b) - Amended and Restated Articles of Incorporation of PPL Electric Utilities Corporation (Exhibit 3(a) to PPL
Electric Utilities Corporation Form 10-Q Report (File No. 1-905) for the quarter ended March 31, 2006) 3(c) - Certificate of Formation of PPL Energy Supply, LLC (Exhibit 3.1 to PPL Energy Supply, LLC Form S-4
(Registration Statement No. 333-74794)) 3(d) - Amended and Restated Bylaws of PPL Corporation, effective May 21, 2008 (Exhibit 3.(ii) to PPL Corporation
Form 8-K Report (File No. 1-11459) dated May 21, 2008) 3(e) - Bylaws of PPL Electric Utilities Corporation, as amended and restated effective March 30, 2006 (Exhibit 3.2 to
PPL Electric Utilities Corporation Form 8-K Report (File No. 1-905) dated March 30, 2006) 3(f) - Limited Liability Company Agreement of PPL Energy Supply, LLC, dated March 20, 2001 (Exhibit 3.2 to PPL
Energy Supply, LLC Form S-4 (Registration Statement No. 333-74794)) 4(a)-1 - Amended and Restated Employee Stock Ownership Plan, dated January 12, 2007 (Exhibit 4(a) to PPL
Corporation Form 10-K Report (File No. 1-11459) for the year ended December 31, 2006) 4(a)-2 - Amendment No. 1 to said Amended and Restated Employee Stock Ownership Plan, dated July 2, 2007 (Exhibit
4(a) to PPL Corporation Form 10-Q Report (File No. 1-11459) for the quarter ended September 30, 2007) 4(a)-3 - Amendment No. 2 to said Amended and Restated Employee Stock Ownership Plan, dated December 13, 2007
(Exhibit 4(a)-3 to PPL Corporation Form 10-K Report (File No. 1-11459) for the year ended December 31, 2007)
4(a)-4 - Amendment No. 3 to said Amended and Restated Employee Stock Ownership Plan, dated August 19, 2009
(Exhibit 4(a) to PPL Corporation Form 10-Q Report (File No. 1-11459) for quarter ended September 30, 2009) *4(a)-5 - Amendment No. 4 to said Amended and Restated Employee Stock Ownership Plan, dated December 2, 2009 4(b) - Trust Deed constituting £150 million 9 ¼ percent Bonds due 2020, dated November 9, 1995, between South
Wales Electric plc and Bankers Trustee Company Limited (Exhibit 4(k) to PPL Corporation Form 10-K Report (File No. 1-11459) for the year ended December 31, 2004)
4(c)-1 - Indenture, dated as of November 1, 1997, among PPL Corporation, PPL Capital Funding, Inc. and JPMorgan
Chase Bank (formerly The Chase Manhattan Bank), as Trustee (Exhibit 4.1 to PPL Corporation Form 8-K Report (File No. 1-11459) dated November 12, 1997)
4(c)-2 - Supplement, dated as of May 18, 2004, to said Indenture (Exhibit 4.7 to Registration Statement Nos. 333-
116478, 333-116478-01 and 333-116478-02) 4(c)-3 - Supplement, dated as of July 1, 2007, to said Indenture (Exhibit 4(b) to PPL Corporation Form 8-K Report (File
No. 1-11459) dated July 16, 2007) 4(d)-1 - Indenture, dated as of August 1, 2001, by PPL Electric Utilities Corporation and JPMorgan Chase Bank
(formerly The Chase Manhattan Bank), as Trustee (Exhibit 4.1 to PPL Electric Utilities Corporation Form 8-K Report (File No. 1-905) dated August 21, 2001)
206
4(d)-2 - Supplement, dated as of February 1, 2005, to said Indenture (Exhibit 4(g)-5 to PPL Electric Utilities Corporation Form 10-K Report (File No. 1-905) for the year ended December 31, 2004)
4(d)-3 - Supplement, dated as of May 1, 2005, to said Indenture (Exhibit 4(b) to PPL Electric Utilities Corporation Form
10-Q Report (File No. 1-905) for the quarter ended June 30, 2005) 4(d)-4 - Supplement, dated as of December 1, 2005, to said Indenture (Exhibit 4(a) to PPL Electric Utilities Corporation
Form 8-K Report (File No. 1-905) dated December 22, 2005) 4(d)-5 - Supplement, dated as of August 1, 2007, to said Indenture (Exhibit 4(b) to PPL Electric Utilities Corporation
Form 8-K Report (File No. 1-905) dated August 14, 2007) 4(d)-6 - Supplement, dated as of October 1, 2008, to said Indenture (Exhibit 4(b) to PPL Electric Utilities Corporation
Form 8-K Report (File No. 1-905) dated October 20, 2008) 4(d)-7 - Supplement, dated as of October 1, 2008, to said Indenture (Exhibit 4(c) to PPL Electric Utilities Corporation
Form 8-K Report (File No. 1-905) dated October 31, 2008) 4(d)-8 - Supplement, dated as of May 1, 2009, to said Indenture (Exhibit 4(b) to PPL Electric Utilities Corporation Form
8-K Report (File No. 1-905) dated May 22, 2009) 4(e)-1 - Indenture, dated as of October 1, 2001, by PPL Energy Supply, LLC and JPMorgan Chase Bank (formerly The
Chase Manhattan Bank), as Trustee (Exhibit 4.1 to PPL Energy Supply, LLC Form S-4 (Registration Statement No. 333-74794))
4(e)-2 - Supplement, dated as of October 1, 2001, to said Indenture (Exhibit 4.2 to PPL Energy Supply, LLC Form S-4
(Registration Statement No. 333-74794)) 4(e)-3 - Registration Rights Agreement, dated October 19, 2001, between PPL Energy Supply, LLC and the Initial
Purchasers (Exhibit 4.5 to PPL Energy Supply, LLC Form S-4 (Registration Statement No. 333-74794)) 4(e)-4 - Supplement, dated as of August 15, 2004, to said Indenture (Exhibit 4(h)-4 to PPL Energy Supply, LLC Form
10-K Report (File No. 333-74794) for the year ended December 31, 2004) 4(e)-5 - Supplement, dated as of October 15, 2005, to said Indenture (Exhibit 4(a) to PPL Energy Supply, LLC Form 8-
K Report (File No. 333-74794) dated October 28, 2005) 4(e)-6 - Form of Note for PPL Energy Supply, LLC's $300 million aggregate principal amount of 5.70% REset Put
Securities due 2035 (REPSSM) (Exhibit 4(b) to PPL Energy Supply, LLC Form 8-K Report (File No. 333-74794) dated October 28, 2005)
4(e)-7 - Supplement, dated as of May 1, 2006, to said Indenture (Exhibit 4(a) to PPL Energy Supply, LLC Form 10-Q
Report (File No. 333-74794) for the quarter ended June 30, 2006) 4(e)-8 - Supplement, dated as of July 1, 2006, to said Indenture (Exhibit 4(b) to PPL Energy Supply, LLC Form 10-Q
Report (File No. 333-74794) for the quarter ended June 30, 2006) 4(e)-9 - Supplement, dated as of July 1, 2006, to said Indenture (Exhibit 4(c) to PPL Energy Supply, LLC Form 10-Q
Report (File No. 333-74794) for the quarter ended June 30, 2006) 4(e)-10 - Supplement, dated as of December 1, 2006, to said Indenture (Exhibit 4(f)-10 to PPL Energy Supply, LLC
Form 10-K Report (File No. 333-74794) for the year ended December 31, 2006) 4(e)-11 - Supplement, dated as of December 1, 2007, to said Indenture (Exhibit 4(b) to PPL Energy Supply, LLC Form 8-
K Report (File No. 333-74794) dated December 18, 2007) 4(e)-12 - Supplement, dated as of March 1, 2008, to said Indenture (Exhibit 4(b) to PPL Energy Supply, LLC Form 8-K
Report (File No. 333-74794) dated March 14, 2008)
207
4(e)-13 - Supplement, dated as of July 1, 2008, to said Indenture (Exhibit 4(b) to PPL Energy Supply, LLC Form 8-K
Report (File No. 1-32944) dated July 21, 2008) 4(f)-1 - Trust Deed constituting £200 million 5.875 percent Bonds due 2027, dated March 25, 2003, between Western
Power Distribution (South West) plc and J.P. Morgan Corporate Trustee Services Limited (Exhibit 4(o)-1 to PPL Corporation Form 10-K Report (File No. 1-11459) for the year ended December 31, 2004)
4(f)-2 - Supplement, dated May 27, 2003, to said Trust Deed, constituting £50 million 5.875 percent Bonds due 2027
(Exhibit 4(o)-2 to PPL Corporation Form 10-K Report (File No. 1-11459) for the year ended December 31, 2004)
*4(g) - Indenture, dated as of March 16, 2001, among WPD Holdings UK, Bankers Trust Company, as Trustee,
Principal Paying Agent, and Transfer Agent and Deutsche Bank Luxembourg, S.A., as Paying and Transfer Agent
4(h) - Trust Deed constituting £105 million 1.541 percent Index-Linked Notes due 2053, dated December 1, 2006,
between Western Power Distribution (South West) plc and HSBC Trustee (CI) Limited (Exhibit 4(i) to PPL Corporation Form 10-K Report (File No. 1-11459) for the year ended December 31, 2006)
4(i) - Trust Deed constituting £120 million 1.541 percent Index-Linked Notes due 2056, dated December 1, 2006,
between Western Power Distribution (South West) plc and HSBC Trustee (CI) Limited (Exhibit 4(j) to PPL Corporation Form 10-K Report (File No. 1-11459) for the year ended December 31, 2006)
4(j) - Trust Deed constituting £225 million 4.80436 percent Notes due 2037, dated December 21, 2006, between
Western Power Distribution (South Wales) plc and HSBC Trustee (CI) Limited (Exhibit 4(k) to PPL Corporation Form 10-K Report (File No. 1-11459) for the year ended December 31, 2006)
4(k)-1 - Subordinated Indenture, dated as of March 1, 2007, between PPL Capital Funding, Inc., PPL Corporation and
The Bank of New York, as Trustee (Exhibit 4(a) to PPL Corporation Form 8-K Report (File No. 1-11459) dated March 20, 2007)
4(k)-2 - Supplement, dated as of March 1, 2007, to said Subordinated Indenture (Exhibit 4(b) to PPL Corporation Form
8-K Report (File No. 1-11459) dated March 20, 2007) 4(l)-1 - Series 2009A Exempt Facilities Loan Agreement, dated as of April 1, 2009, between PPL Energy Supply, LLC
and Pennsylvania Economic Development Financing Authority (Exhibit 4(a) to PPL Energy Supply, LLC Form 8-K Report (File No. 1-32944) dated April 9, 2009)
4(l)-2 - Series 2009B Exempt Facilities Loan Agreement, dated as of April 1, 2009, between PPL Energy Supply, LLC
and Pennsylvania Economic Development Financing Authority (Exhibit 4(b) to PPL Energy Supply, LLC Form 8-K Report (File No. 1-32944) dated April 9, 2009)
4(l)-3 - Series 2009C Exempt Facilities Loan Agreement, dated as of April 1, 2009, between PPL Energy Supply, LLC
and Pennsylvania Economic Development Financing Authority (Exhibit 4(c) to PPL Energy Supply, LLC Form 8-K Report (File No. 1-32944) dated April 9, 2009)
10(a) - $150 Million Credit and Reimbursement Agreement, dated as of April 25, 2001, among PPL Montana, LLC and
the banks named therein (Exhibit 10(d) to PPL Montana, LLC Form 10-Q Report (File No. 333-50350) for the quarter ended June 30, 2001)
10(b) - Generation Supply Agreement, dated as of June 20, 2001, between PPL Electric Utilities Corporation and PPL
EnergyPlus, LLC (Exhibit 10.5 to PPL Energy Supply, LLC Form S-4 (Registration Statement No. 333-74794)) 10(c)-1 - Master Power Purchase and Sale Agreement, dated as of October 15, 2001, between NorthWestern Energy
Division (successor in interest to The Montana Power Company) and PPL Montana, LLC (Exhibit 10(g) to PPL Montana, LLC Form 10-K Report (File No. 333-50350) for the year ended December 31, 2001)
208
10(c)-2 - Confirmation Letter dated July 5, 2006, between PPL Montana, LLC and NorthWestern Corporation (PPL Corporation and PPL Energy Supply, LLC Form 8-K Reports (File Nos. 1-11459 and 333-74794) dated July 6, 2006)
10(d) - Guaranty, dated as of December 21, 2001, from PPL Energy Supply, LLC in favor of LMB Funding, Limited
Partnership (Exhibit 10(j) to PPL Energy Supply, LLC Form 10-K Report (File No. 333-74794) for the year ended December 31, 2001)
10(e)-1 - Agreement for Lease, dated as of December 21, 2001, between LMB Funding, Limited Partnership and Lower
Mt. Bethel Energy, LLC (Exhibit 10(m) to PPL Energy Supply, LLC Form 10-K Report (File No. 333-74794) for the year ended December 31, 2003)
10(e)-2 - Amendment No. 1 to Agreement for Lease, dated as of September 16, 2002, between LMB Funding, Limited
Partnership and Lower Mt. Bethel Energy, LLC (Exhibit 10(m)-1 to PPL Energy Supply, LLC Form 10-K Report (File No. 333-74794) for the year ended December 31, 2003)
10(f)-1 - Lease Agreement, dated as of December 21, 2001, between LMB Funding, Limited Partnership and Lower Mt.
Bethel Energy, LLC (Exhibit 10(n) to PPL Energy Supply, LLC Form 10-K Report (File No. 333-74794) for the year ended December 31, 2003)
10(f)-2 - Amendment No. 1 to Lease Agreement, dated as of September 16, 2002, between LMB Funding, Limited
Partnership and Lower Mt. Bethel Energy, LLC (Exhibit 10(n)-1 to PPL Energy Supply, LLC Form 10-K Report (File No. 333-74794) for the year ended December 31, 2003)
10(g) - Pollution Control Facilities Loan Agreement, dated as of May 1, 1973, between PPL Electric Utilities
Corporation and the Lehigh County Industrial Development Authority (Exhibit 5(z) to Registration Statement No. 2-60834)
10(h) - Facility Lease Agreement (BA 1/2) between PPL Montana, LLC and Montana OL3, LLC (Exhibit 4.7a to PPL
Montana, LLC Form S-4 (Registration Statement No. 333-50350)) 10(i) - Facility Lease Agreement (BA 3) between PPL Montana, LLC and Montana OL4, LLC (Exhibit 4.8a to PPL
Montana, LLC Form S-4 (Registration Statement No. 333-50350)) 10(j) - Services Agreement, dated as of July 1, 2000, among PPL Corporation, PPL Energy Funding Corporation and
its direct and indirect subsidiaries in various tiers, PPL Capital Funding, Inc., PPL Gas Utilities Corporation, PPL Services Corporation and CEP Commerce, LLC (Exhibit 10.20 to PPL Energy Supply, LLC Form S-4 (Registration Statement No. 333-74794))
10(k)-1 - Asset Purchase Agreement, dated as of June 1, 2004, by and between PPL Sundance Energy, LLC, as Seller,
and Arizona Public Service Company, as Purchaser (Exhibit 10(a) to PPL Corporation and PPL Energy Supply, LLC Form 10-Q Reports (File Nos. 1-11459 and 333-74794) for the quarter ended June 30, 2004)
10(k)-2 - Amendment No. 1, dated December 14, 2004, to said Asset Purchase Agreement (Exhibit 99.1 to PPL
Corporation and PPL Energy Supply, LLC Form 8-K Reports (File Nos. 1-11459 and 333-74794) dated December 15, 2004)
10(l)-1 - Receivables Sale Agreement, dated as of August 1, 2004, between PPL Electric Utilities Corporation, as
Originator, and PPL Receivables Corporation, as Buyer (Exhibit 10(d) to PPL Electric Utilities Corporation Form 10-Q Report (File No. 1-905) for the quarter ended June 30, 2004)
10(l)-2 - Amendment No. 1 to Receivables Sale Agreement, dated as of August 5, 2008, between PPL Electric Utilities
Corporation, as Originator, and PPL Receivables Corporation, as Buyer (Exhibit 10(b) to PPL Electric Utilities Corporation Form 8-K Report (File No. 1-905) dated August 6, 2008)
209
10(l)-3 - Credit and Security Agreement, dated as of August 5, 2008, among PPL Receivables Corporation, PPL Electric Utilities Corporation, Victory Receivables Corporation, the Liquidity Banks from time to time party thereto and The Bank of Tokyo-Mitsubishi UFJ, Ltd., New York Branch (Exhibit 10(a) to PPL Electric Utilities Corporation Form 8-K Report (File No. 1-905) dated August 6, 2008)
10(1)-4 - Amendment No. 1 to said Credit and Security Agreement, dated as of July 28, 2009, among PPL Receivables
Corporation, as Borrower, PPL Electric Utilities Corporation, as Servicer, Victory Receivables Corporation, as a Lender, and The Bank of Tokyo-Mitsubishi UFJ, Ltd, New York Branch, as Liquidity Bank and as Agent (Exhibit 10(a) to PPL Electric Utilities Corporation Form 10-Q Report (File No. 1-905) for quarter ended September 30, 2009)
10(1)-5 - Amended and Restated Fee Letter, dated July 28, 2009, among PPL Receivables Corporation, as Borrower, PPL
Electric Utilities Corporation, as Servicer, Victory Receivables Corporation, as a Lender, and The Bank of Tokyo-Mitsubishi UFJ, Ltd, New York Branch, as Liquidity Bank and as Agent (Exhibit 10(b) to PPL Electric Utilities Corporation Form 10-Q Report (File No. 1-905) for quarter ended September 30, 2009)
10(m) - $300 Million Demand Loan Agreement, dated as of August 20, 2004, among CEP Lending, Inc. and PPL
Energy Funding Corporation (Exhibit 10(dd) to PPL Electric Utilities Corporation Form 10-K Report (File No. 1-905) for the year ended December 31, 2004)
10(n)-1 - Reimbursement Agreement, dated as of March 31, 2005, among PPL Energy Supply, LLC, The Bank of Nova
Scotia, as Issuer and Administrative Agent, and the Lenders party thereto from time to time (Exhibit 10(a) to PPL Energy Supply, LLC Form 10-Q Report (File No. 333-74794) for the quarter ended March 31, 2005)
10(n)-2 - First Amendment to said Reimbursement Agreement, dated as of June 16, 2005 (Exhibit 10(b) to PPL Energy
Supply, LLC Form 10-Q Report (File No. 333-74794) for the quarter ended June 30, 2005) 10(n)-3 - Second Amendment to said Reimbursement Agreement, dated as of September 1, 2005 (Exhibit 10(a) to PPL
Energy Supply, LLC Form 10-Q Report (File No. 333-74794) for the quarter ended September 30, 2005) 10(n)-4 - Third Amendment to said Reimbursement Agreement, dated as of March 30, 2006 (Exhibit 10(a) to PPL Energy
Supply, LLC Form 8-K Report (File No. 333-74794) dated April 5, 2006) 10(n)-5 - Fourth Amendment to said Reimbursement Agreement, dated as of April 12, 2006 (Exhibit 10(b) to PPL Energy
Supply, LLC Form 10-Q Report (File No. 333-74794) for the quarter ended September 30, 2006) 10(n)-6 - Fifth Amendment to said Reimbursement Agreement, dated as of November 1, 2006 (Exhibit 10(q)-6 to PPL
Energy Supply, LLC Form 10-K Report (File No. 333-74794) for the year ended December 31, 2006) 10(n)-7 - Sixth Amendment to said Reimbursement Agreement, dated as of March 29, 2007 (Exhibit 10(q)-7 to PPL
Energy Supply, LLC Form 10-K Report (File No. 333-74794) for the year ended December 31, 2007) 10(n)-8 - Seventh Amendment to said Reimbursement Agreement, dated as of March 1, 2008 (Exhibit 10(a) to PPL
Energy Supply, LLC Form 10-Q Report (File No. 333-74794) for the quarter ended March 31, 2008) 10(n)-9 - Eighth Amendment to said Reimbursement Agreement, dated as of March 30, 2009 (Exhibit 10(a) to PPL
Energy Supply, LLC Form 10-Q Report (File No. 1-32944) for the quarter ended March 31, 2009) 10(o)-1 - $300 Million Five-Year Letter of Credit and Revolving Credit Agreement, dated as of December 15, 2005,
among PPL Energy Supply, LLC and the banks named therein (Exhibit 10(b) to PPL Energy Supply, LLC Form 8-K Report (File No. 333-74794) dated December 21, 2005)
10(o)-2 - First Amendment to said Letter of Credit and Revolving Credit Agreement, dated as of December 29, 2006
(Exhibit 10(t)-2 to PPL Energy Supply, LLC Form 10-K Report (File No. 333-74794) for the year ended December 31, 2006)
210
10(p)-1 - $300 Million Five-Year Letter of Credit and Reimbursement Agreement, dated as of December 15, 2005, among PPL Energy Supply and the banks named therein (Exhibit 10(c) to PPL Energy Supply, LLC Form 8-K Report (File No. 333-74794) dated December 21, 2005)
10(p)-2 - First Amendment to said Letter of Credit and Reimbursement Agreement, dated as of December 29, 2006
(Exhibit 10(u)-2 to PPL Energy Supply, LLC Form 10-K Report (File No. 333-74794) for the year ended December 31, 2006)
10(q) - $400 million Amended and Restated 364-Day Credit Agreement, dated as of September 8, 2009, among PPL
Energy Supply, LLC and the banks named therein (Exhibit 10(a) to PPL Energy Supply, LLC Form 8-K Report (File No. 1-32944) dated September 11, 2009)
10(r)-1 - $200 million Third Amended and Restated Five-Year Credit Agreement, dated as of May 4, 2007, among PPL
Electric Utilities Corporation and the banks named therein (Exhibit 10(b) to PPL Electric Utilities Corporation Form 8-K Report (File No. 1-905) dated May 9, 2007)
10(r)-2 - First Amendment to Third Amended and Restated Credit Agreement, dated as of December 3, 2008, by and
among PPL Electric Utilities Corporation, certain of the lenders party to the Third Amended and Restated Credit Agreement dated as of May 4, 2007 and Wachovia Bank, National Association, as administrative agent (Exhibit 99.2 to PPL Electric Utilities Corporation Form 8-K Report (File No. 1-905) December 4, 2008)
10(s)-1 - $3.4 billion Second Amended and Restated Five-Year Credit Agreement, dated as of May 4, 2007, among PPL
Energy Supply, LLC and the banks named therein (Exhibit 10(a) to PPL Energy Supply, LLC Form 8-K Report (File No. 333-74794) dated May 9, 2007)
10(s)-2 - First Amendment to Second Amended and Restated Credit Agreement, dated as of December 3, 2008, by and
among PPL Energy Supply, LLC, certain of the lenders party to the Second Amended and Restated Credit Agreement dated as of May 4, 2007 and Wachovia Bank, National Association, as administrative agent (Exhibit 99.1 to PPL Energy Supply, LLC Form 8-K Report (File No. 1-32944) dated December 4, 2008)
10(t) - £150 million Credit Agreement, dated as of January 24, 2007, among Western Power Distribution Holdings
Limited and the banks named therein (Exhibit 10(y) to PPL Corporation Form 10-K Report (File No. 1-11459) for the year ended December 31, 2006)
10(u)-1 - Pollution Control Facilities Loan Agreement, dated as of February 1, 2005, between PPL Electric Utilities
Corporation and the Lehigh County Industrial Development Authority (Exhibit 10(ff) to PPL Electric Utilities Corporation Form 10-K Report (File No. 1-905) for the year ended December 31, 2004)
10(u)-2 - Pollution Control Facilities Loan Agreement, dated as of May 1, 2005, between PPL Electric Utilities
Corporation and the Lehigh County Industrial Development Authority (Exhibit 10(a) to PPL Electric Utilities Corporation Form 10-Q Report (File No. 1-905) for the quarter ended June 30, 2005)
10(u)-3 - Pollution Control Facilities Loan Agreement, dated as of October 1, 2008, between Pennsylvania Economic
Development Financing Authority and PPL Electric Utilities Corporation (Exhibit 4(a) to PPL Electric Utilities Corporation Form 8-K Report (File No. 1-905) dated October 31, 2008)
10(v) - £210 million Multicurrency Revolving Facility Agreement, dated July 7, 2009, between Western Power
Distribution (South West) plc and HSBC Bank plc, Lloyds TSB Bank plc and Clydesdale Bank plc (Exhibit 10(c) to PPL Corporation Form 10-Q Report (File No. 1-11459) for quarter ended June 30, 2009)
[_]10(w)-1 - Amended and Restated Directors Deferred Compensation Plan, dated June 12, 2000 (Exhibit 10(h) to PPL
Corporation Form 10-K Report (File No. 1-11459) for the year ended December 31, 2000) [_]10(w)-2 - Amendment No. 1 to said Amended and Restated Directors Deferred Compensation Plan, dated December 18,
2002 (Exhibit 10(m)-1 to PPL Corporation Form 10-K Report (File No. 1-11459) for the year ended December 31, 2002)
211
[_]10(w)-3 - Amendment No. 2 to said Amended and Restated Directors Deferred Compensation Plan, dated December 4,
2003 (Exhibit 10(q)-2 to PPL Corporation Form 10-K Report (File No. 1-11459) for the year ended December 31, 2003)
[_]10(w)-4 - Amendment No. 3 to said Amended and Restated Directors Deferred Compensation Plan, dated as of January 1,
2005 (Exhibit 10(cc)-4 to PPL Corporation Form 10-K Report (File No. 1-11459) for the year ended December 31, 2005)
[_]10(w)-5 - Amendment No. 4 to said Amended and Restated Directors Deferred Compensation Plan, dated as of May 1,
2008 (Exhibit 10(x)-5 to PPL Corporation Form 10-K Report (File No. 1-11459) for the year ended December 31, 2008)
[_]10(x)-1 - Trust Agreement, dated as of April 1, 2001, between PPL Corporation and Wachovia Bank, N.A. (as successor
to First Union National Bank), as Trustee [_]10(x)-2 - Trust Agreement, dated as of March 20, 2007, between PPL Corporation and Wachovia Bank, N.A., as Trustee
(Exhibit 10(c) to PPL Corporation Form 10-Q Report (File No. 1-1149) for the quarter ended March 31, 2007) [_]10(x)-3 - Trust Agreement, dated as of March 20, 2007, between PPL Corporation and Wachovia Bank, N.A., as Trustee
(Exhibit 10(d) to PPL Corporation Form 10-Q Report (File No. 1-11459) for the quarter ended March 31, 2007) [_]10(x)-4 - Trust Agreement, dated as of March 20, 2007, between PPL Corporation and Wachovia Bank, N.A., as Trustee
(Exhibit 10(e) to PPL Corporation Form 10-Q Report (File No. 1-11459) for the quarter ended March 31, 2007) [_]10(y)-1 - Amended and Restated Officers Deferred Compensation Plan, dated December 8, 2003 (Exhibit 10(r) to PPL
Corporation Form 10-K Report (File No. 1-11459) for the year ended December 31, 2003) [_]10(y)-2 - Amendment No. 1 to said Amended and Restated Officers Deferred Compensation Plan, dated as of January 1,
2005 (Exhibit 10(ee)-1 to PPL Corporation Form 10-K Report (File No. 1-11459) for the year ended December 31, 2005)
[_]10(y)-3 - Amendment No. 2 to said Amended and Restated Officers Deferred Compensation Plan, dated as of
January 22, 2007 (Exhibit 10(bb)-3 to PPL Corporation Form 10-K Report (File No. 1-11459) for the year ended December 31, 2006)
[_]10(y)-4 - Amendment No. 3 to said Amended and Restated Officers Deferred Compensation Plan, dated as of June 1,
2008 (Exhibit 10(z)-4 to PPL Corporation Form 10-K Report (File No. 1-11459) for the year ended December 31, 2008)
[_]10(z)-1 - Amended and Restated Supplemental Executive Retirement Plan, dated December 8, 2003 (Exhibit 10(s) to
PPL Corporation Form 10-K Report (File No. 1-11459) for the year ended December 31, 2003) [_]10(z)-2 - Amendment No. 1 to said Supplemental Executive Retirement Plan, dated December 16, 2004 (Exhibit 99.1 to
PPL Corporation Form 8-K Report (File No. 1-11459) dated December 17, 2004) [_]10(z)-3 - Amendment No. 2 to said Supplemental Executive Retirement Plan, dated as of January 1, 2005 (Exhibit 10(ff)-
3 to PPL Corporation Form 10-K Report (File 1-11459) for the year ended December 31, 2005) [_]10(z)-4 - Amendment No. 3 to said Supplemental Executive Retirement Plan, dated as of January 22, 2007 (Exhibit
10(cc)-4 to PPL Corporation Form 10-K Report (File No. 1-11459) for the year ended December 31, 2006) [_]10(z)-5 - Amendment No. 4 to said Supplement Executive Retirement Plan, dated as of December 9, 2008 (Exhibit
10(aa)-5 to PPL Corporation Form 10-K Report (File No. 1-11459) for the year ended December 31, 2008) [_]10(aa)-1 - Incentive Compensation Plan, amended and restated effective January 1, 2003 (Exhibit 10(p) to PPL
Corporation Form 10-K Report (File No. 1-11459) for the year ended December 31, 2002)
212
[_]10(aa)-2 - Amendment No. 1 to said Incentive Compensation Plan, dated as of January 1, 2005 (Exhibit 10(gg)-2 to PPL Corporation Form 10-K Report (File 1-11459) for the year ended December 31, 2005)
[_]10(aa)-3 - Amendment No. 2 to said Incentive Compensation Plan, dated as of January 26, 2007 (Exhibit 10(dd)-3 to PPL
Corporation Form 10-K Report (File No. 1-11459) for the year ended December 31, 2006) [_]10(aa)-4 - Amendment No. 3 to said Incentive Compensation Plan, dated as of March 21, 2007 (Exhibit 10(f) to PPL
Corporation Form 10-Q Report (File No. 1-11459) for the quarter ended March 31, 2007) [_]10(aa)-5 - Amendment No. 4 to said Incentive Compensation Plan, effective December 1, 2007 (Exhibit 10(a) to PPL
Corporation Form 10-Q Report (File No. 1-11459) for the quarter ended September, 30, 2008) [_]10(aa)-6 - Amendment No. 5 to said Incentive Compensation Plan, dated as of December 16, 2008 (Exhibit 10(bb)-6 to
PPL Corporation Form 10-K Report (File 1-11459) for the year ended December 31, 2008) [_]10(aa)-7 - Form of Stock Option Agreement for stock option awards under the Incentive Compensation Plan (Exhibit
10(a) to PPL Corporation Form 8-K Report (File No. 1-11459) dated February 1, 2006) [_]10(aa)-8 - Form of Restricted Stock Unit Agreement for restricted stock unit awards under the Incentive Compensation
Plan (Exhibit 10(b) to PPL Corporation Form 8-K Report (File No. 1-11459) dated February 1, 2006) [_]10(aa)-9 - Form of Restricted Stock Unit Agreement for restricted stock unit awards under the Incentive Compensation
Plan pursuant to PPL Corporation Cash Incentive Premium Exchange Program (Exhibit 10(c) to PPL Corporation Form 8-K Report (File No. 1-11459) dated February 1, 2006)
[_]10(bb)-1 - Incentive Compensation Plan for Key Employees, amended and restated effective January 1, 2003 (Schedule B
to Proxy Statement of PPL Corporation, dated March 17, 2003) [_]10(bb)-2 - Amendment No. 1 to said Incentive Compensation Plan for Key Employees, dated as of January 1, 2005
(Exhibit (hh)-1 to PPL Corporation Form 10-K Report (File 1-11459) for the year ended December 31, 2005 [_]10(bb)-3 - Amendment No. 2 to said Incentive Compensation Plan for Key Employees, dated as of January 26, 2007
(Exhibit 10(ee)-3 to PPL Corporation Form 10-K Report (File No. 1-11459) for the year ended December 31, 2006)
[_]10(bb)-4 - Amendment No. 3 to said Incentive Compensation Plan for Key Employees, dated as of March 21, 2007
(Exhibit 10(q) to PPL Corporation Form 10-Q Report (File No. 1-11459) for the quarter ended March 31, 2007) [_]10(bb)-5 - Amendment No. 4 to said Incentive Compensation Plan for Key Employees, dated as of December 15, 2008
(Exhibit 10(cc)-5 to PPL Corporation Form 10-K Report (File No. 1-11459) for the year ended December 31, 2008)
[_]10(cc) - Short-term Incentive Plan (Schedule A to Proxy Statement of PPL Corporation, dated March 20, 2006) [_]10(dd) - Agreement dated January 15, 2003 between PPL Corporation and Mr. Miller regarding Supplemental Pension
Benefits (Exhibit 10(u) to PPL Corporation Form 10-K Report (File No. 1-11459) for the year ended December 31, 2002)
[_]10(ee) - Employment letter dated December 19, 2005 between PPL Services Corporation and Jerry Matthews Simmons,
Jr. (Exhibit 10(jj) to PPL Corporation Form 10-K Report (File No. 1-11459) for the year ended December 31, 2006)
[_]10(ff) - Employment letter dated May 31, 2006 between PPL Services Corporation and William H. Spence (Exhibit
10(pp) to PPL Corporation Form 10-K Report (File No. 1-11459) for the year ended December 31, 2006) [_]10(gg) - Employment letter dated August 29, 2006, between PPL Services Corporation and David G. DeCampli (Exhibit
10(qq) to PPL Corporation Form 10-K Report (File No. 1-11459) for the year ended December 31, 2006)
213
[_]10(hh) - Amendments to certain compensation programs and arrangements for Named Executive Officers of PPL Corporation and PPL Electric Utilities Corporation and compensation arrangement changes for non-employee Directors of PPL Corporation (PPL Corporation and PPL Electric Utilities Corporation Form 8-K Reports (File Nos. 1-11459 and 1-905) dated November 1, 2006)
[_]10(ii) - Form of Retention Agreement entered into between PPL Corporation and Messrs. Champagne, Farr, Miller and
Shriver (Exhibit 10(h) to PPL Corporation Form 10-Q Report (File No. 1-11459) for the quarter ended March 31, 2007)
[_]10(jj)-1 - Form of Severance Agreement entered into between PPL Corporation and the Named Executive Officers
(Exhibit 10(i) to PPL Corporation Form 10-Q Report (File No. 1-11459) for the quarter ended March 31, 2007) [_]10(jj)-2 - Amendment to said Severance Agreement (Exhibit 10(a) to PPL Corporation Form 10-Q Report (File No. 1-
11459) for the quarter ended June 30, 2009) [_]10(kk) - Form of Performance Unit Agreement entered into between PPL Corporation and the Named Executive Officers
(Exhibit 10(ss) to PPL Corporation Form 10-K Report (File No. 1-11459) for the year ended December 31, 2007)
[_]10(ll) - 2009 compensation matters regarding PPL Corporation Named Executive Officers (PPL Corporation Form 8-K
Report (File No. 1-11459) dated January 28, 2009) [_]10(mm) - 2009 compensation matters regarding PPL Electric Utilities Corporation Named Executive Officers (PPL
Electric Utilities Corporation Form 8-K Report (File No. 1-905) dated January 28, 2009) [_]10(nn) - Establishment of 2009 annual performance goals and business criteria for incentive awards to PPL Corporation
Named Executive Officers (PPL Corporation Form 8-K Report (File No. 1-11459) dated April 1, 2009) [_]10(oo) - Establishment of 2009 annual performance goals and business criteria for incentive awards to PPL Electric
Utilities Corporation Named Executive Officers (PPL Electric Utilities Corporation Form 8-K Report (File No. 1-905) dated April 1, 2009)
[_]10(pp) - Employment letter dated May 22, 2009, between PPL Services Corporation and Gregory W. Dudkin (Exhibit
10(b) to PPL Corporation Form 10-Q Report (File No. 1-11459) for quarter ended June 30, 2009) *12(a) - PPL Corporation and Subsidiaries Computation of Ratio of Earnings to Combined Fixed Charges and Preferred
Stock Dividends *12(b) - PPL Energy Supply, LLC and Subsidiaries Computation of Ratio of Earnings to Fixed Charges *12(c) - PPL Electric Utilities Corporation and Subsidiaries Computation of Ratio of Earnings to Combined Fixed
Charges and Preferred Stock Dividends *21(a) - Subsidiaries of PPL Corporation *21(b) - Subsidiaries of PPL Electric Utilities Corporation *23(a) - Consent of Ernst & Young LLP - PPL Corporation *23(b) - Consent of Ernst & Young LLP - PPL Energy Supply, LLC *23(c) - Consent of Ernst & Young LLP - PPL Electric Utilities Corporation *24 - Power of Attorney *31(a) - Certificate of PPL's principal executive officer pursuant to Section 302 of the Sarbanes-Oxley Act of 2002
214
*31(b) - Certificate of PPL's principal financial officer pursuant to Section 302 of the Sarbanes-Oxley Act of 2002 *31(c) - Certificate of PPL Energy Supply's principal executive officer pursuant to Section 302 of the Sarbanes-Oxley
Act of 2002 *31(d) - Certificate of PPL Energy Supply's principal financial officer pursuant to Section 302 of the Sarbanes-Oxley
Act of 2002 *31(e) - Certificate of PPL Electric's principal executive officer pursuant to Section 302 of the Sarbanes-Oxley Act of
2002 *31(f) - Certificate of PPL Electric's principal financial officer pursuant to Section 302 of the Sarbanes-Oxley Act of
2002 *32(a) - Certificate of PPL's principal executive officer pursuant to Section 906 of the Sarbanes-Oxley Act of 2002 *32(b) - Certificate of PPL's principal financial officer pursuant to Section 906 of the Sarbanes-Oxley Act of 2002 *32(c) - Certificate of PPL Energy Supply's principal executive officer pursuant to Section 906 of the Sarbanes-Oxley
Act of 2002 *32(d) - Certificate of PPL Energy Supply's principal financial officer pursuant to Section 906 of the Sarbanes-Oxley
Act of 2002 *32(e) - Certificate of PPL Electric's principal executive officer pursuant to Section 906 of the Sarbanes-Oxley Act of
2002 *32(f) - Certificate of PPL Electric's principal financial officer pursuant to Section 906 of the Sarbanes-Oxley Act of
2002 *99(a) - Examples of Wholesale Energy, Fuel and Emission Allowance Price Fluctuations - 2005 through 2009 **101.INS - XBRL Instance Document for PPL Corporation **101.SCH - XBRL Taxonomy Extension Schema for PPL Corporation **101.CAL - XBRL Taxonomy Extension Calculation Linkbase for PPL Corporation **101.DEF - XBRL Taxonomy Extension Definition Linkbase for PPL Corporation **101.LAB - XBRL Taxonomy Extension Label Linkbase for PPL Corporation **101.PRE - XBRL Taxonomy Extension Presentation Linkbase for PPL Corporation ** - XBRL information will be considered to be furnished, not filed, for the first two years of a company's submission of XBRL information.
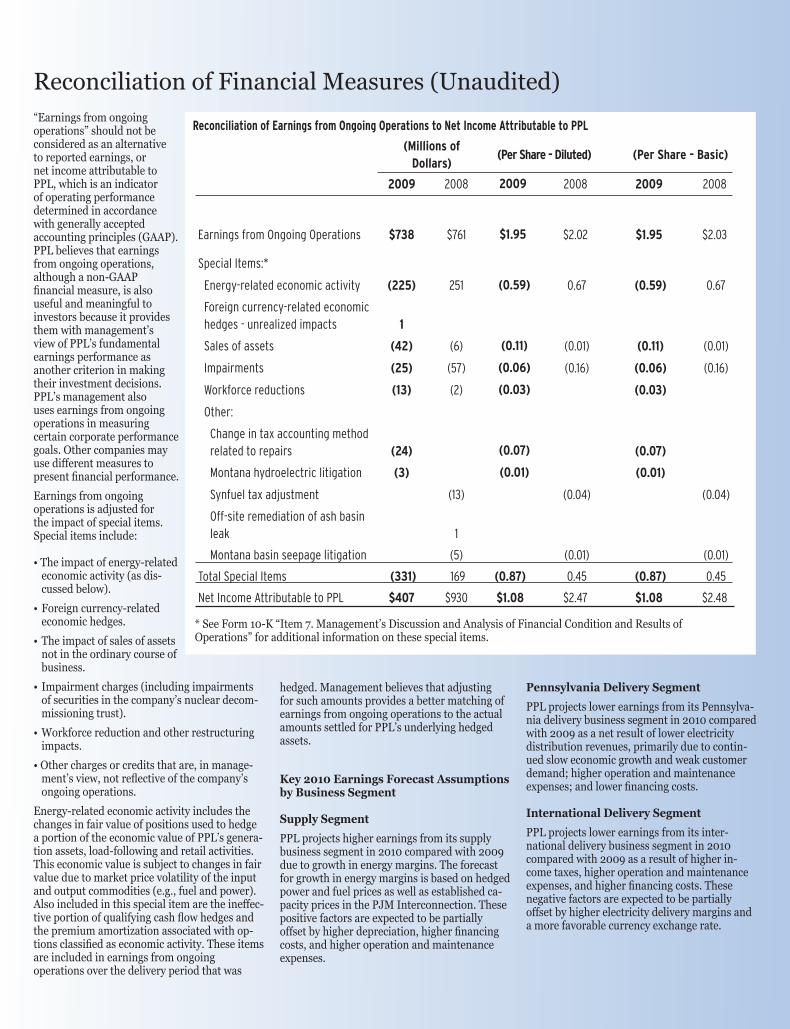
Reconciliation of Financial Measures (Unaudited)“Earnings from ongoing operations” should not be considered as an alternative to reported earnings, or net income attributable to PPL, which is an indicator of operating performance determined in accordance with generally accepted accounting principles (GAAP). PPL believes that earnings from ongoing operations, although a non-GAAP financial measure, is also useful and meaningful to investors because it provides them with management’s view of PPL’s fundamental earnings performance as another criterion in making their investment decisions. PPL’s management also uses earnings from ongoing operations in measuring certain corporate performance goals. Other companies may use different measures to present financial performance.
Earnings from ongoing operations is adjusted for the impact of special items. Special items include: • The impact of energy-related
economic activity (as dis-cussed below).
• Foreign currency-related economic hedges.
• The impact of sales of assets not in the ordinary course of business.
• Impairment charges (including impairments of securities in the company’s nuclear decom-missioning trust).
• Workforce reduction and other restructuring impacts.
• Other charges or credits that are, in manage-ment’s view, not reflective of the company’s ongoing operations.
Energy-related economic activity includes the changes in fair value of positions used to hedge a portion of the economic value of PPL’s genera-tion assets, load-following and retail activities. This economic value is subject to changes in fair value due to market price volatility of the input and output commodities (e.g., fuel and power). Also included in this special item are the ineffec-tive portion of qualifying cash flow hedges and the premium amortization associated with op-tions classified as economic activity. These items are included in earnings from ongoing operations over the delivery period that was
hedged. Management believes that adjusting for such amounts provides a better matching of earnings from ongoing operations to the actual amounts settled for PPL’s underlying hedged assets.
Key 2010 Earnings Forecast Assumptions by Business Segment
Supply Segment
PPL projects higher earnings from its supply business segment in 2010 compared with 2009 due to growth in energy margins. The forecast for growth in energy margins is based on hedged power and fuel prices as well as established ca-pacity prices in the PJM Interconnection. These positive factors are expected to be partially offset by higher depreciation, higher financing costs, and higher operation and maintenance expenses.
Reconciliation of Earnings from Ongoing Operations to Net Income Attributable to PPL
(Millions of Dollars)
(Per Share - Diluted) (Per Share - Basic)
2009 2008 2009 2008 2009 2008
Earnings from Ongoing Operations $738 $761 $1.95 $2.02 $1.95 $2.03
Special Items:*
Energy-related economic activity (225) 251 (0.59) 0.67 (0.59) 0.67
Foreign currency-related economic hedges - unrealized impacts 1
Sales of assets (42) (6) (0.11) (0.01) (0.11) (0.01)
Impairments (25) (57) (0.06) (0.16) (0.06) (0.16)
Workforce reductions (13) (2) (0.03) (0.03)
Other:
Change in tax accounting method related to repairs (24) (0.07) (0.07)
Montana hydroelectric litigation (3) (0.01) (0.01)
Synfuel tax adjustment (13) (0.04) (0.04)
Off-site remediation of ash basin leak 1
Montana basin seepage litigation (5) (0.01) (0.01)
Total Special Items (331) 169 (0.87) 0.45 (0.87) 0.45
Net Income Attributable to PPL $407 $930 $1.08 $2.47 $1.08 $2.48
* See Form 10-K “Item 7. Management’s Discussion and Analysis of Financial Condition and Results of Operations” for additional information on these special items.
Pennsylvania Delivery Segment
PPL projects lower earnings from its Pennsylva-nia delivery business segment in 2010 compared with 2009 as a net result of lower electricity distribution revenues, primarily due to contin-ued slow economic growth and weak customer demand; higher operation and maintenance expenses; and lower financing costs.
International Delivery Segment
PPL projects lower earnings from its inter-national delivery business segment in 2010 compared with 2009 as a result of higher in-come taxes, higher operation and maintenance expenses, and higher financing costs. These negative factors are expected to be partially offset by higher electricity delivery margins and a more favorable currency exchange rate.

Directors
Frederick M. Bernthal, 67, is president of Universities Research Association, a consortium of 87 research universities engaged in the construction and operation of major research facilities.
John W. Conway, 64, is chairman of the board, president and chief executive officer of Crown Holdings, Inc., an international manufacturer of packaging products for consumer goods.
E. Allen Deaver, 74, is former executive vice president and director of Armstrong World Industries, Inc., a manufacturer of interior furnishings and specialty products.
Louise K. Goeser, 56, is president and chief executive officer of Grupo Siemens S.A. de C.V. and is responsible for Siemens Mesoamérica, the Mexican, Central American and Caribbean unit of multinational Siemens AG, a global engineering company operating in the industry, energy and healthcare sectors.
Stuart E. Graham, 64, is former president and chief executive officer of Skanska AB, an international project development and construction company.
Stuart Heydt, 70, is former chief executive officer of Geisinger Health System, a nonprofit healthcare provider.
James H. Miller, 61, is chairman, president and chief executive officer of PPL Corporation.
Craig A. Rogerson, 53, is chairman, president and chief executive officer of Chemtura Corporation, a global manufacturer and marketer of specialty chemicals, crop protection and pool, spa and home care products.
W. Keith Smith, 75, is former chief executive officer of West Penn Allegheny Health System, former vice chairman of Mellon Financial Corporation and former senior vice chairman of Mellon Bank, N.A.
Natica von Althann, 59, is former senior credit risk management executive of Bank of America, and former chief credit officer of U.S. Trust, an investment management company.
Keith H. Williamson, 57, is senior vice president, secretary and general counsel of Centene Corporation, a provider of Medicaid-managed care and specialty services.
Executive Committee
James H. Miller, ChairFrederick M. BernthalE. Allen DeaverStuart Heydt
Audit Committee
Stuart Heydt, ChairFrederick M. BernthalNatica von AlthannW. Keith Smith
Compensation, Governance and Nominating Committee
E. Allen Deaver, ChairJohn W. ConwayLouise K. GoeserStuart E. GrahamStuart Heydt
Finance Committee
W. Keith Smith, ChairJohn W. ConwayE. Allen DeaverNatica von AlthannKeith H. Williamson
Nuclear Oversight Committee
Frederick M. Bernthal, ChairE. Allen DeaverStuart E. GrahamStuart HeydtCraig A. Rogerson
Board Committees
Directors and Officers
Officers Corporate Leadership Council
James H. Miller, Chairman, President and CEO, PPL Corporation
Paul A. Farr, Executive VP and CFO, PPL Corporation
William H. Spence, Executive VP and COO, PPL Corporation
Robert J. Grey, Senior VP, General Counsel and Secretary, PPL Corporation
Major Subsidiary Presidents
David G. DeCampli, PPL Electric Utilities
Robert D. Gabbard, PPL EnergyPlus
Rick L. Klingensmith, PPL Global
William H. Spence, PPL Generation
Other Officers
James E. Abel, VP-Finance and Treasurer, PPL Corporation
L. Gene Alessandrini, Senior VP-Marketing, PPL EnergyPlus
Gregory N. Dudkin, Senior VP-Operations, PPL Electric Utilities
Robert M. Geneczko, VP-Customer Services, PPL Electric Utilities
Jeffrey M. Helsel, VP-Nuclear Operations, PPL Susquehanna
Michael E. Kroboth, VP-Energy Services, PPL Energy Services Group, LLC
Victor N. Lopiano, Senior VP-Fossil and Hydro Generation, PPL Generation, and President, PPL Nuclear Development, LLC
Dennis J. Murphy, VP and COO-Eastern Fossil and Hydro, PPL Generation
Joanne H. Raphael, VP-External Affairs, PPL Services
Timothy S. Rausch, Senior VP and Chief Nuclear Officer, PPL Susquehanna
William E. Riebling, VP-Engineering and Construction, PPL Generation
Stephen R. Russo, VP-Human Resources and Services, PPL Services
James E. Schinski, VP-Chief Information Officer, PPL Services
J. Matt Simmons, Jr., VP and Controller, PPL Corporation, and VP-Risk Management and Chief Risk Officer, PPL Services
Peter J. Simonich, VP and COO-Western Fossil and Hydro, PPL Generation
Robert A. Symons, Chief Executive, Western Power Distribution, and VP-United Kingdom, PPL Global

Duplicate MailingsIf you have more than one account, or if there is more than one investor in your household, you may call the PPL Shareowner Information Line to request that only one annual report be delivered to your address. Please provide account numbers for all duplicate mailings.
PPL Shareowner Information Line (1-800-345-3085)Shareowners can get detailed corporate and financial information 24 hours a day using the PPL Shareowner Information Line. They can hear timely recorded messages about earnings, dividends and other company news releases; request information by fax; and request printed materials in the mail. Other PPL publications, such as the annual and quarterly reports to the Securities and Exchange Commission (Forms 10-K and 10-Q) will be mailed upon request, or write to:
Manager-PPL Investor ServicesTwo North Ninth Street (GENTW13)Allentown, PA 18101Fax: 610-774-5106Via e-mail: [email protected]
PPL’s Web Site (www.pplweb.com)Shareowners can access PPL Securities and Exchange Commission filings, corporate governance materials, news releases, stock quotes and historical performance. Visitors to our Web site can provide their e-mail address and indicate their desire to receive future earnings or news releases automatically.
Lost Dividend ChecksDividend checks lost by investors, or those that may be lost in the mail, will be replaced if the check has not been located by the 10th business day following the payment date.
Direct Deposit of DividendsShareowners may choose to have their dividends deposited directly into their checking or savings account. Please consider registering for direct deposit, which expedites your receipt of dividends and saves the cost of postage, paper, handling and transportation.
Dividend Reinvestment PlanShareowners may choose to have dividends on their PPL Corporation common stock or PPL Electric Utilities preferred and preference stock reinvested in PPL Corporation common stock instead of receiving the dividend by direct deposit or check. Participants in PPL’s Dividend Reinvestment Plan may choose to deposit their common stock into their plan account.
Direct Registration SystemPPL Corporation and PPL Electric Utilities Corporation participate in the Direct Registration System (DRS). Shareowners may choose to have their common or preferred stock certificates converted to book entry form within the DRS.
Online Account AccessRegistered shareowners can access account information by visiting www.shareowneronline.com.
Shareowner Inquiries and Registrar, Transfer and Dividend Reinvestment Plan Agent
PPL Shareowner ServicesWells Fargo Bank, N.A.161 North Concord ExchangeSouth St. Paul, MN 55075-1139
Toll-free: 1-800-345-3085Outside U.S.: 651-453-2129FAX: 651-450-4085www.wellsfargo.com/shareownerservices/
Corporate OfficesPPL CorporationTwo North Ninth Street Allentown, PA 18101610-774-5151
PPL and the PPL logo are trademarks of PPL Corporation or an affiliate.
S&P 500 is a registered trademark of McGraw-Hill, Inc.
©PPL Corporation. All Rights Reserved
Shareowner InformationAnnual MeetingShareowners are invited to attend the annual meeting to be held Wednesday, May 19, 2010, at the Holiday Inn in Fogelsville, Pennsylvania, in Lehigh County. The meeting will begin at 10 a.m. EDT.
Stock Exchange ListingPPL Corporation common stock is listed on the New York Stock Exchange (NYSE). The symbol is PPL.
2009
High LowDividendsDeclared
1st quarter $33.54 $24.25 $.345
2nd quarter
34.42 27.40 .345
3rd quarter
34.21 28.27 .345
4th quarter
33.05 28.82 .345
2008
High LowDividendsDeclared
1st quarter $55.23 $44.72 $.335
2nd quarter
54.00 46.04 .335
3rd quarter
53.78 34.95 .335
4th quarter
37.88 26.84 .335
The company has paid quarterly cash dividends on its common stock in every year since 1946. The dividends declared per share in 2009 and 2008 were $1.38 and $1.34, respectively. On Feb. 26, 2010, the company increased its quarterly dividend to $0.35 per share (equivalent to $1.40 per share per year), effective with the quarterly dividend paid April 1, 2010, to shareowners of record on March 10, 2010.
DividendsThe planned dates for consideration of the declaration of dividends by the Board of Directors or its Executive Committee for the balance of 2010 are May 19, Aug. 27 and Nov. 19. Subject to the declaration, dividends are paid on the first business day of April, July, October and January. The record dates for dividends for the balance of 2010 are expected to be June 10, Sept. 10 and Dec. 10.

PPL CorporationTwo North Ninth StreetAllentown, PA 18101-1179
www.pplweb.com
Printed on recycled and recyclable paper