Embed Size (px)
Citation preview
1PPIC PPIC PPIC
California 2025California 2025
Elisa BarbourElisa Barbour
Public Policy Institute of CaliforniaPublic Policy Institute of California
2PPICPPICPPIC
OutlineOutline
•• Population and economy forecastsPopulation and economy forecasts
•• Funding and meeting needs Funding and meeting needs –– Education facilitiesEducation facilities–– TransportationTransportation
•• Governance challengesGovernance challenges
3PPICPPICPPIC
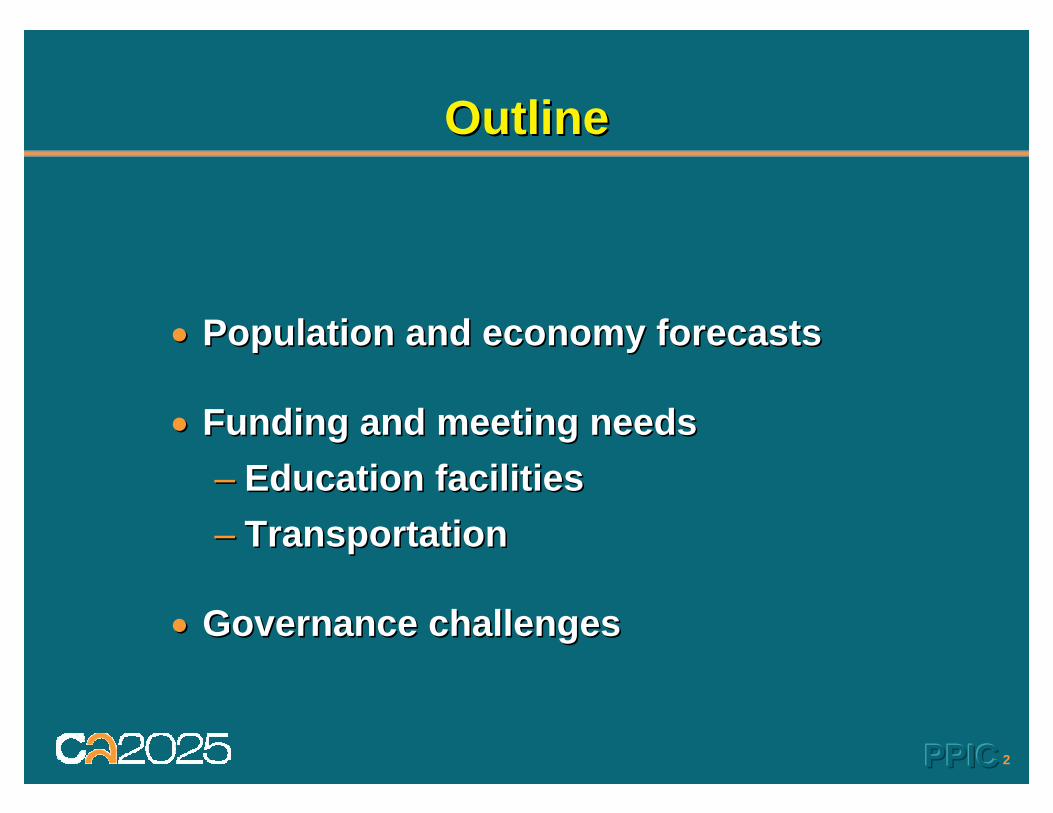
California population will grow,California population will grow,but at a slower pacebut at a slower pace
0
1
2
3
4
5
6
7
1980-1990 1990-2000 2000-2010 2010-20200
5
10
15
20
25
30
Millions (%)
Absolute change
Percentage change
4PPICPPICPPIC
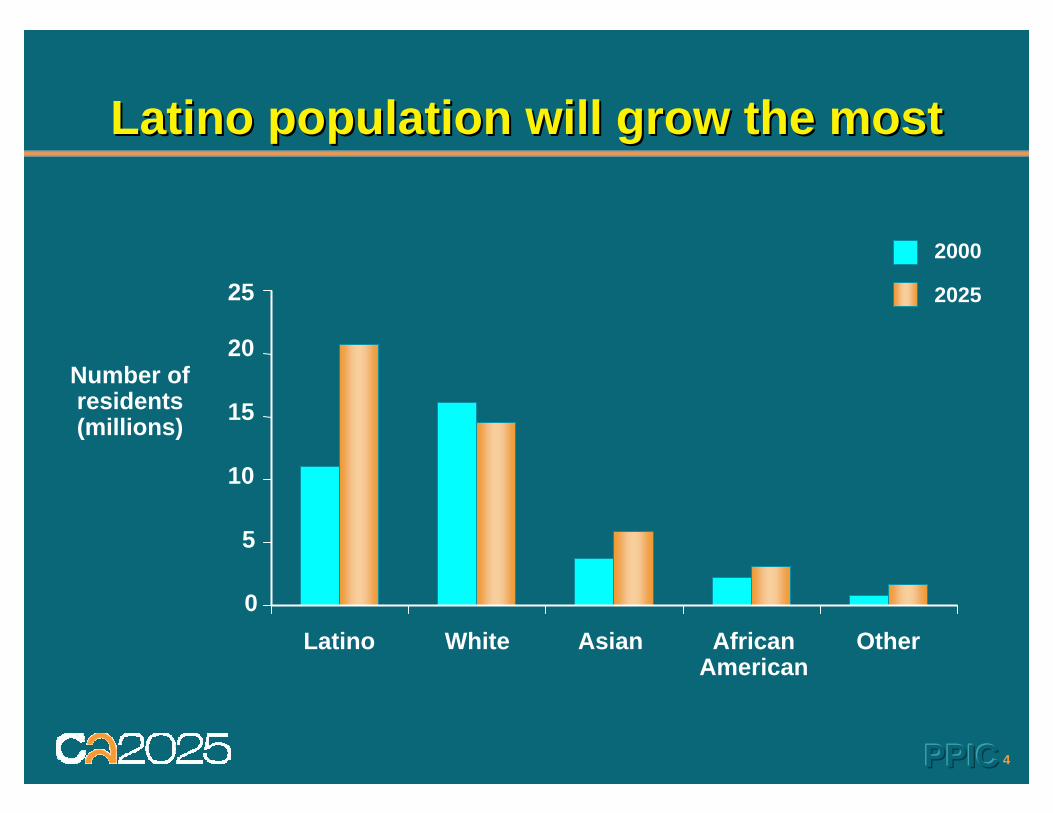
Latino population will grow the mostLatino population will grow the most
0
5
10
15
20
25
Latino White Asian AfricanAmerican
Other
2000
2025
Number ofresidents(millions)
5PPICPPICPPIC
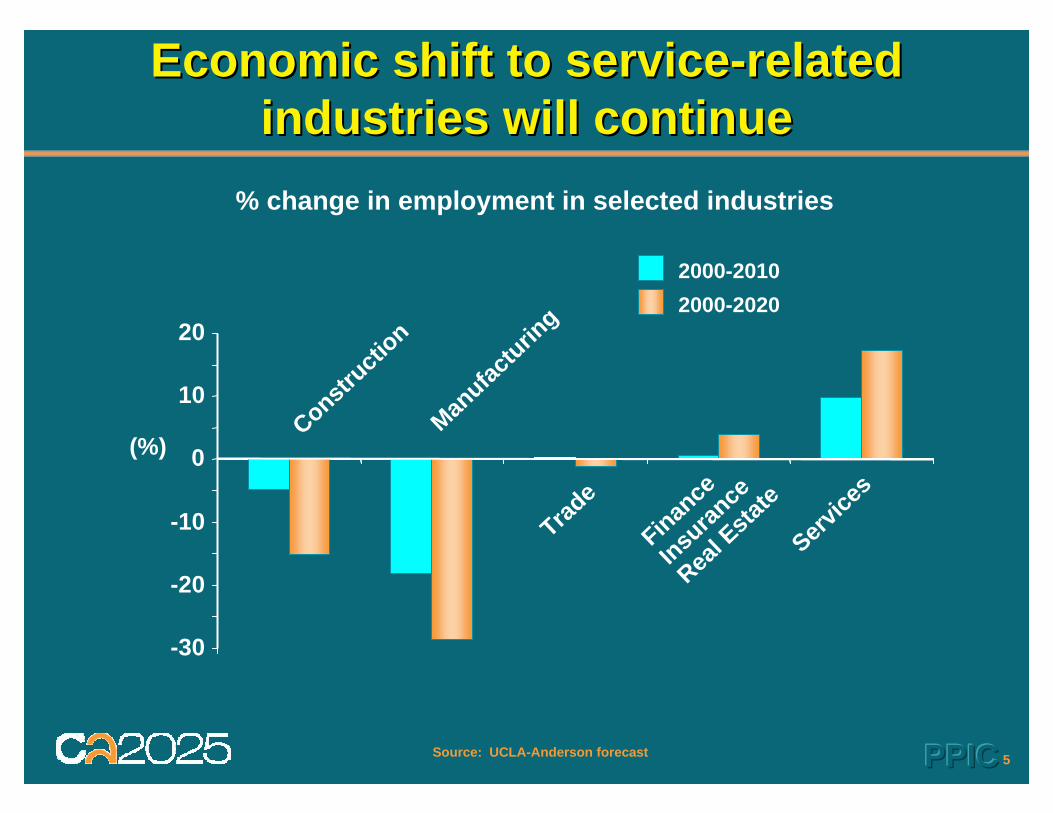
Economic shift to serviceEconomic shift to service--related related industries will continueindustries will continue
-30
-20
-10
0
10
20
Constructi
on
Manufac
turing
Trade
Finance
Insuran
ce
Real E
state
Service
s
2000-20102000-2020
% change in employment in selected industries
Source: UCLA-Anderson forecast
(%)
6PPICPPICPPIC
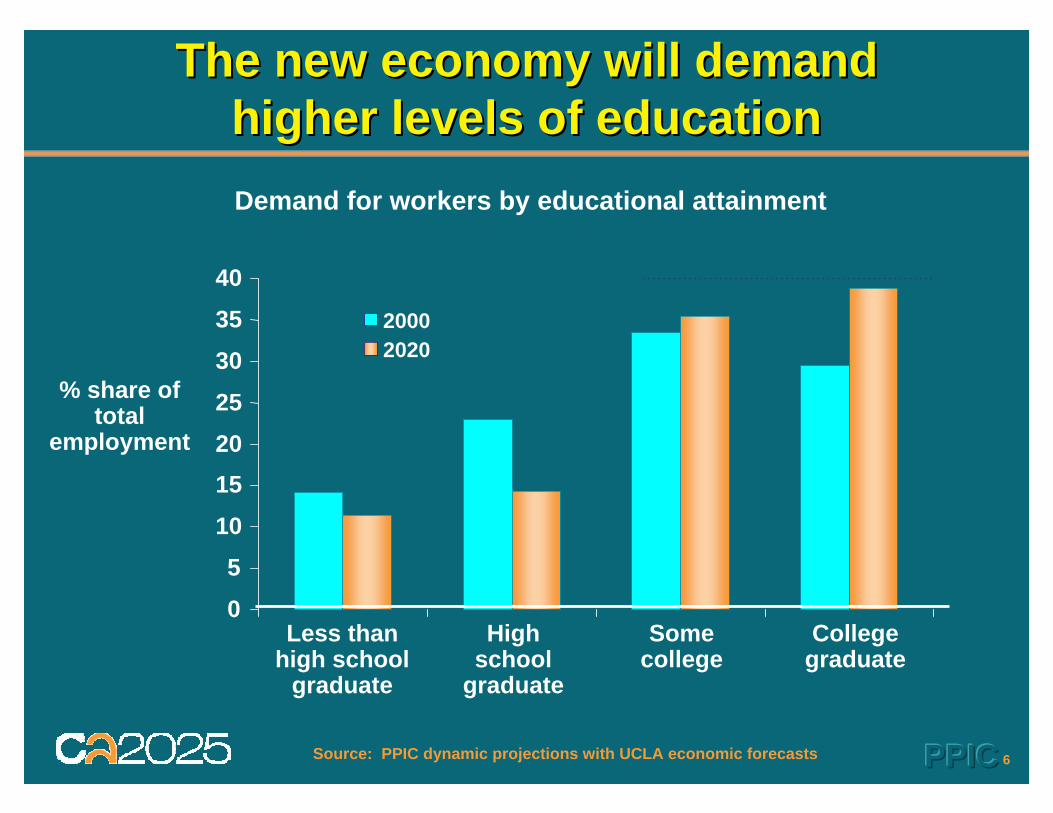
The new economy will demand The new economy will demand higher levels of educationhigher levels of educationDemand for workers by educational attainment
0
510
152025
30
3540
Less thanhigh school
graduate
Highschool
graduate
Somecollege
Collegegraduate
% share oftotal
employment
20002020
Source: PPIC dynamic projections with UCLA economic forecasts
7PPICPPICPPIC
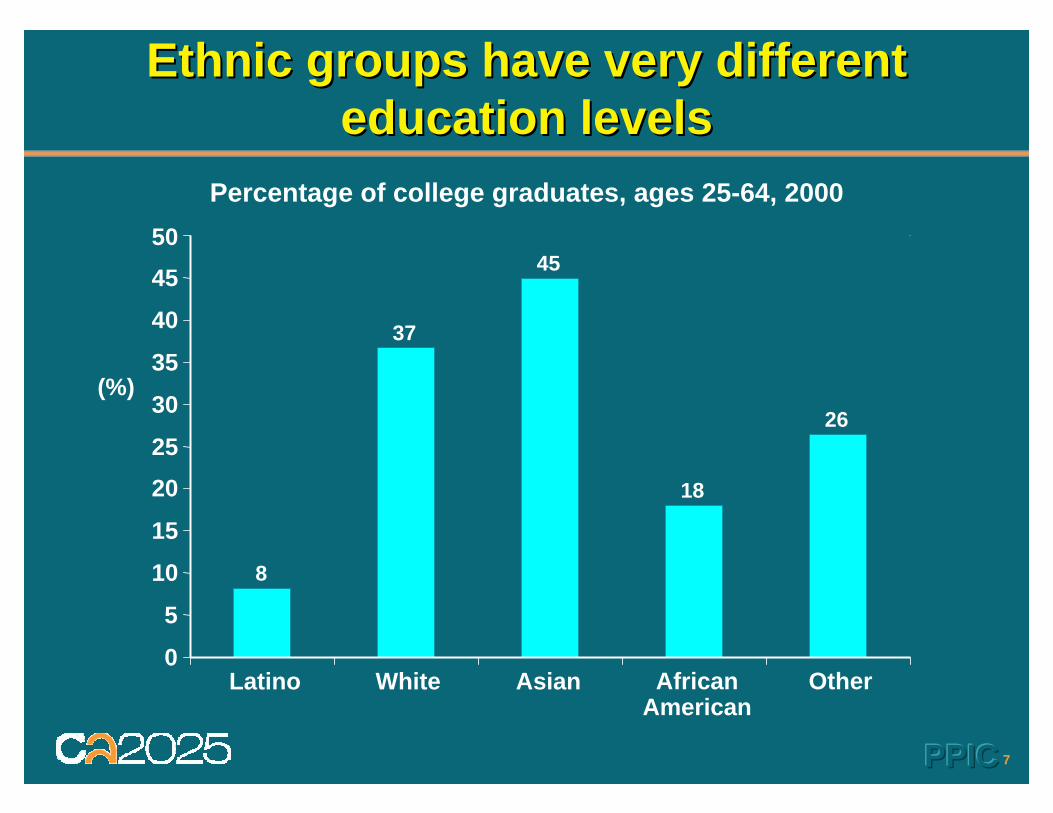
Ethnic groups have very different Ethnic groups have very different education levelseducation levels
50
8
37
45
18
26
0
5
10
15
2025
30
35
40
45
Latino White Asian AfricanAmerican
Other
Percentage of college graduates, ages 25-64, 2000
(%)
8PPICPPICPPIC
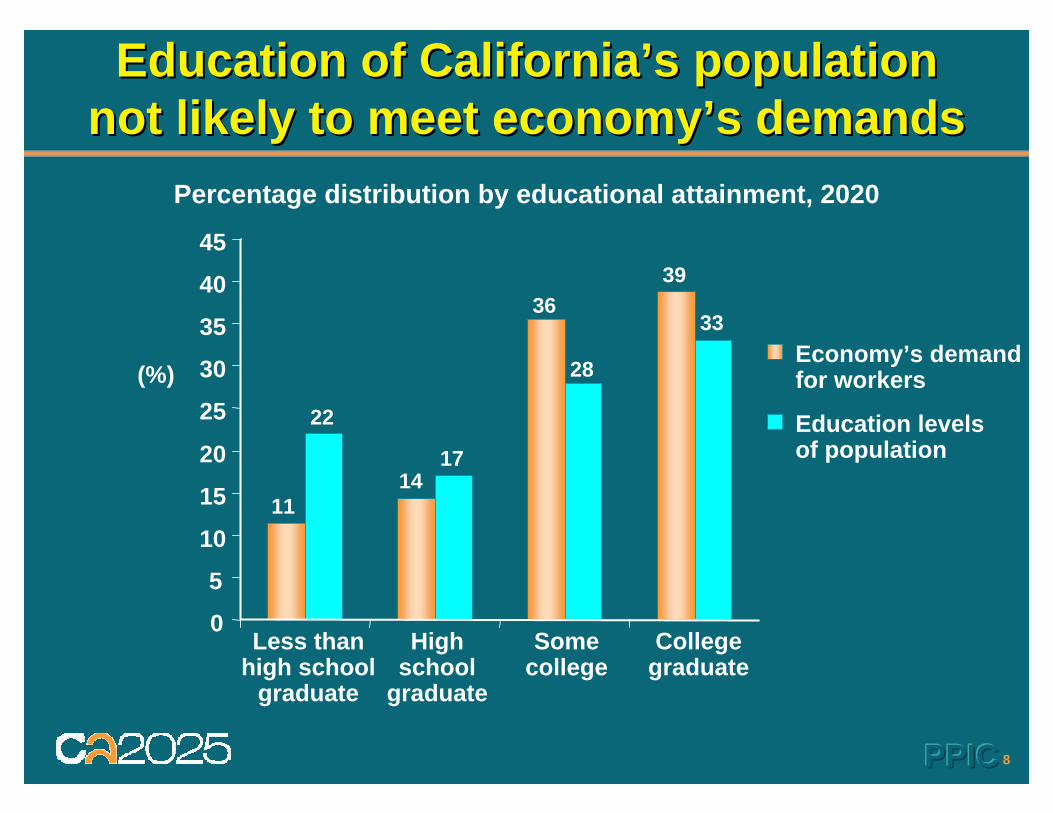
Education of California’s population Education of California’s population not likely to meet economy’s demandsnot likely to meet economy’s demands
Percentage distribution by educational attainment, 2020
1114
3639
22
17
28
33
0
5
10
15
20
25
30
35
40
45
Less thanhigh school
graduate
Highschool
graduate
Somecollege
Collegegraduate
Economy’s demandfor workers
Education levelsof population
(%)
9PPICPPICPPIC
OutlineOutline
•• Population and economy forecastsPopulation and economy forecasts
•• Funding and meeting needsFunding and meeting needs–– Education facilitiesEducation facilities–– TransportationTransportation
•• Governance challengesGovernance challenges
10PPICPPICPPIC
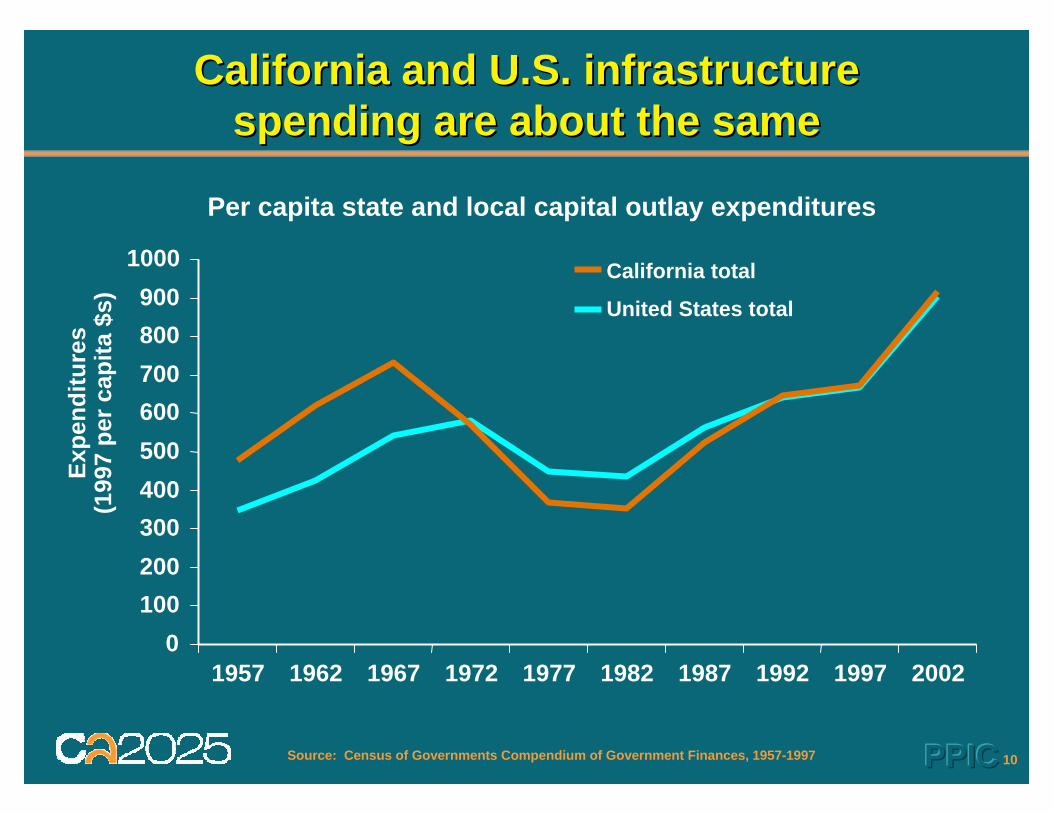
California and U.S. infrastructure California and U.S. infrastructure spending are about the samespending are about the same
Per capita state and local capital outlay expenditures
0100200300400500600700800900
1000
1957 1962 1967 1972 1977 1982 1987 1992 1997 2002
Expe
nditu
res
(199
7 pe
r cap
ita $
s)
California total
United States total
Source: Census of Governments Compendium of Government Finances, 1957-1997
11PPICPPICPPIC
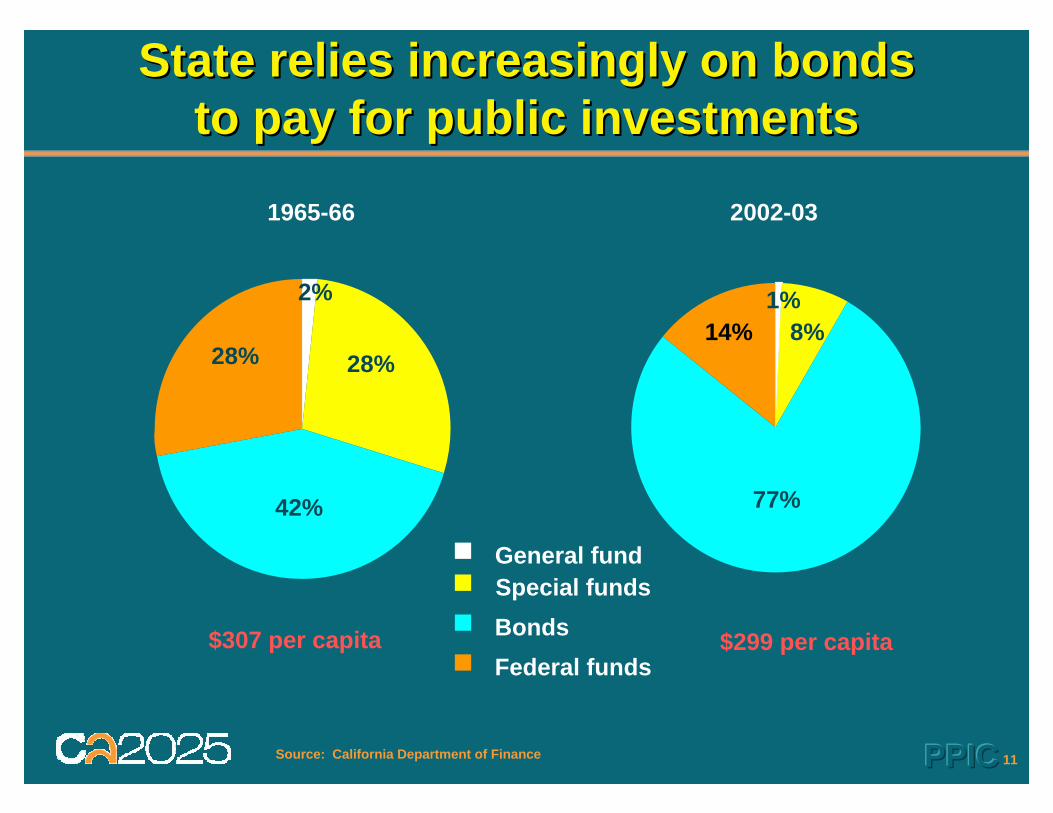
State relies increasingly on bondsState relies increasingly on bondsto pay for public investmentsto pay for public investments
$307 per capita $299 per capita
1965-66 2002-03
28%
42%
28%
2%
77%
14%8%1%2%
28%
42%
28%
1%8%
77%
14%
General fundSpecial fundsBondsFederal funds
Source: California Department of Finance
12PPICPPICPPIC
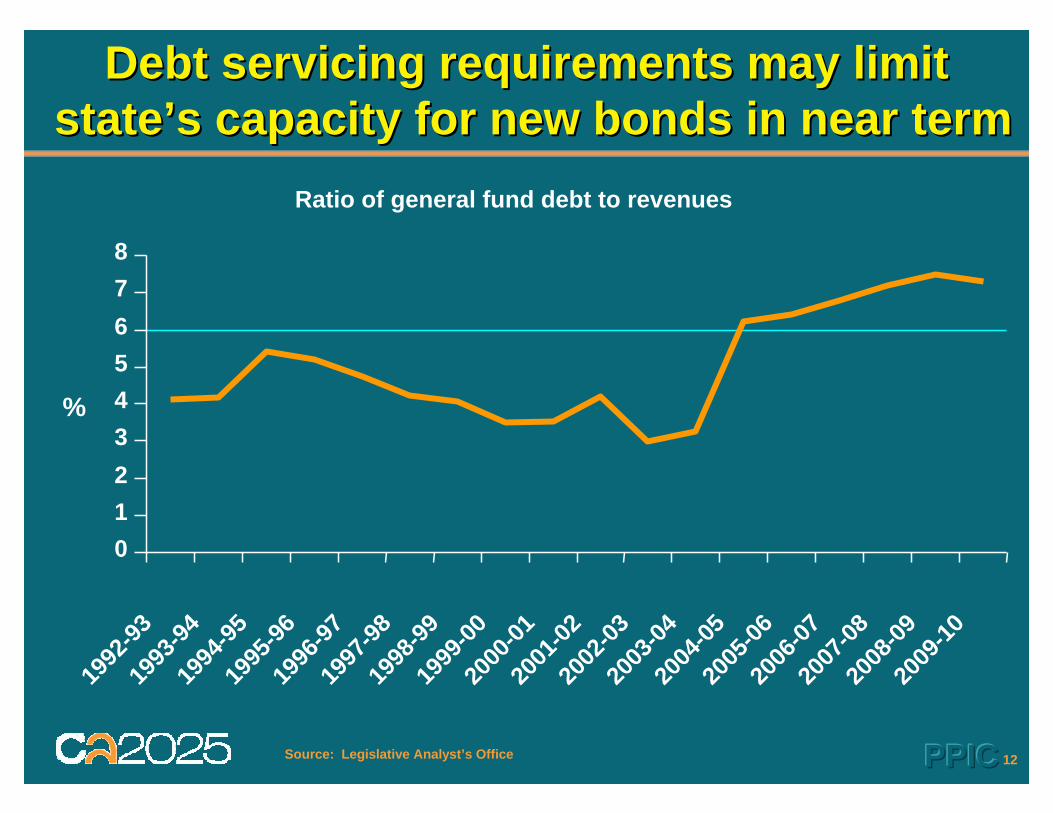
Debt servicing requirements may limitDebt servicing requirements may limitstate’s capacity for new bonds in near termstate’s capacity for new bonds in near term
012345678
1992
-9319
93-94
1994
-9519
95-96
1996
-9719
97-98
1998
-9919
99-00
2000
-0120
01-02
2002
-0320
03-04
2004
-0520
05-06
2006
-0720
07-08
2008
-0920
09-10
%
Ratio of general fund debt to revenues
Source: Legislative Analyst’s Office
13PPICPPICPPIC
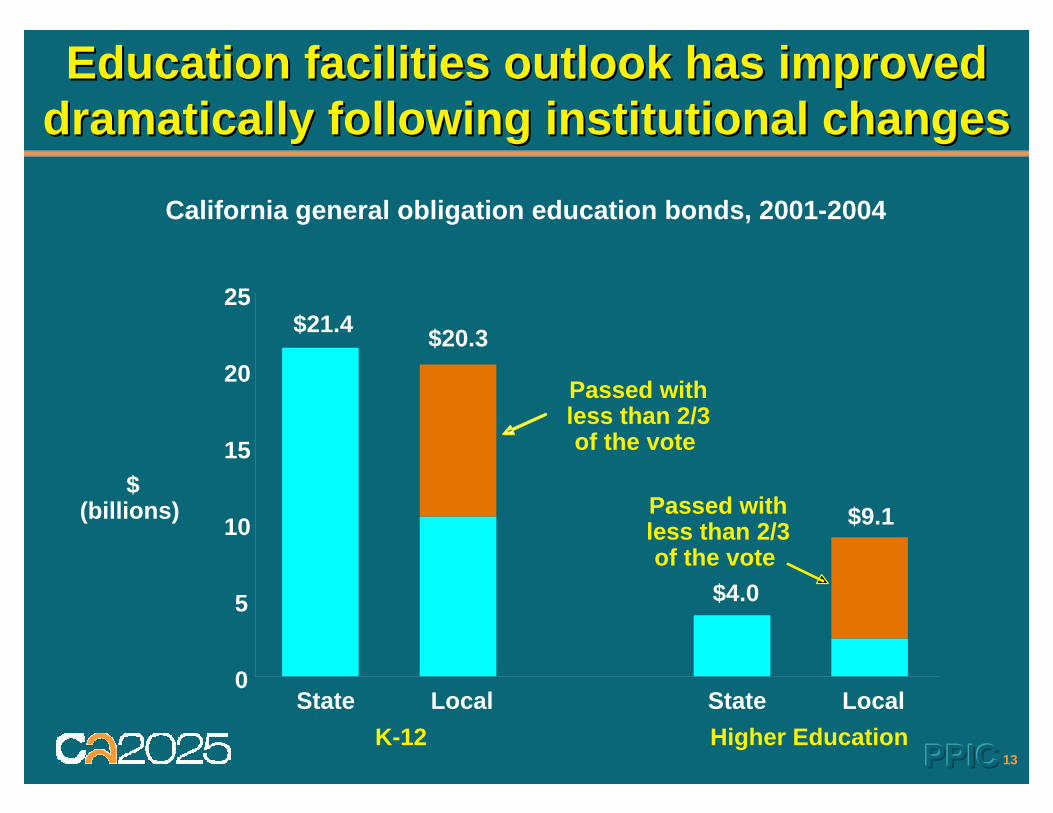
Education facilities outlook has improved Education facilities outlook has improved dramatically following institutional changesdramatically following institutional changes
California general obligation education bonds, 2001-2004
0
5
10
15
20
25
State Local State Local
$(billions)
Passed withless than 2/3of the vote
Passed withless than 2/3of the vote
K-12 Higher Education
$21.4 $20.3
$4.0
$9.1
14PPICPPICPPIC
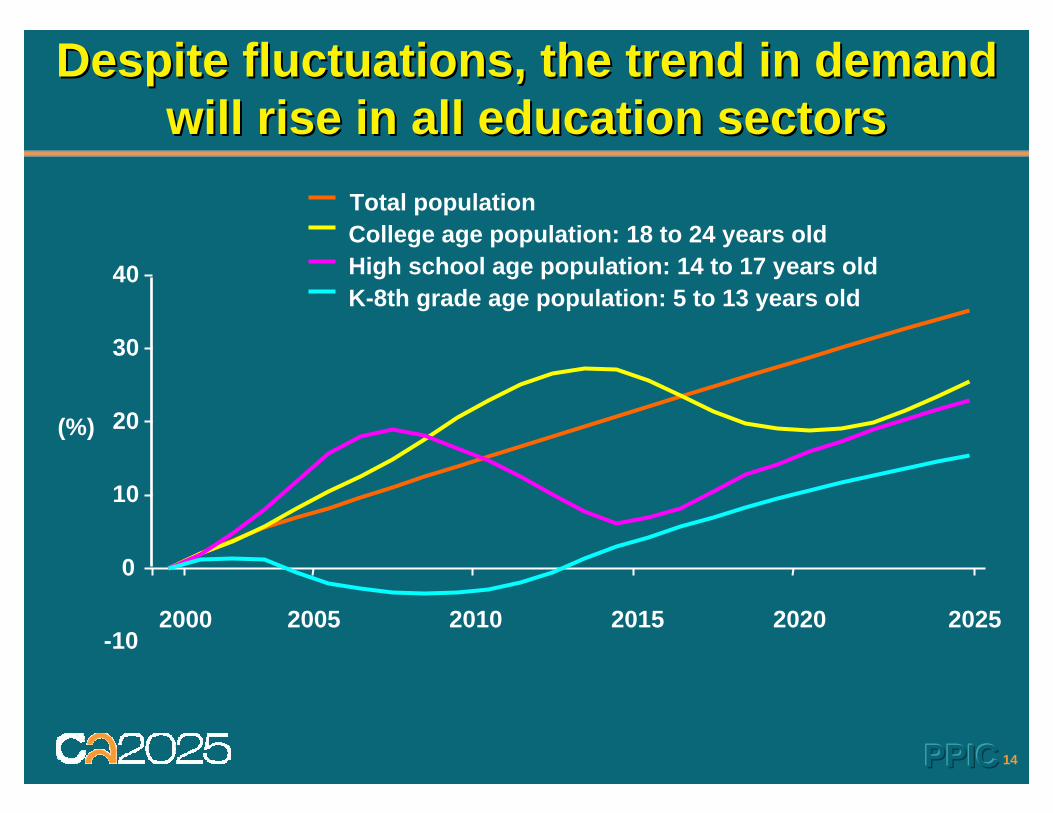
Despite fluctuations, the trend in demand Despite fluctuations, the trend in demand will rise in all education sectorswill rise in all education sectors
-10
0
10
20
30
40
2000 2005 2010 2015 2020 2025
Total populationCollege age population: 18 to 24 years oldHigh school age population: 14 to 17 years oldK-8th grade age population: 5 to 13 years old
(%)
15PPICPPICPPIC
-200
-100
0
100
200
300
400
500
1965
1970
1975
1980
1985
1990
1995
2000
2005
2010
2015
2020
2025
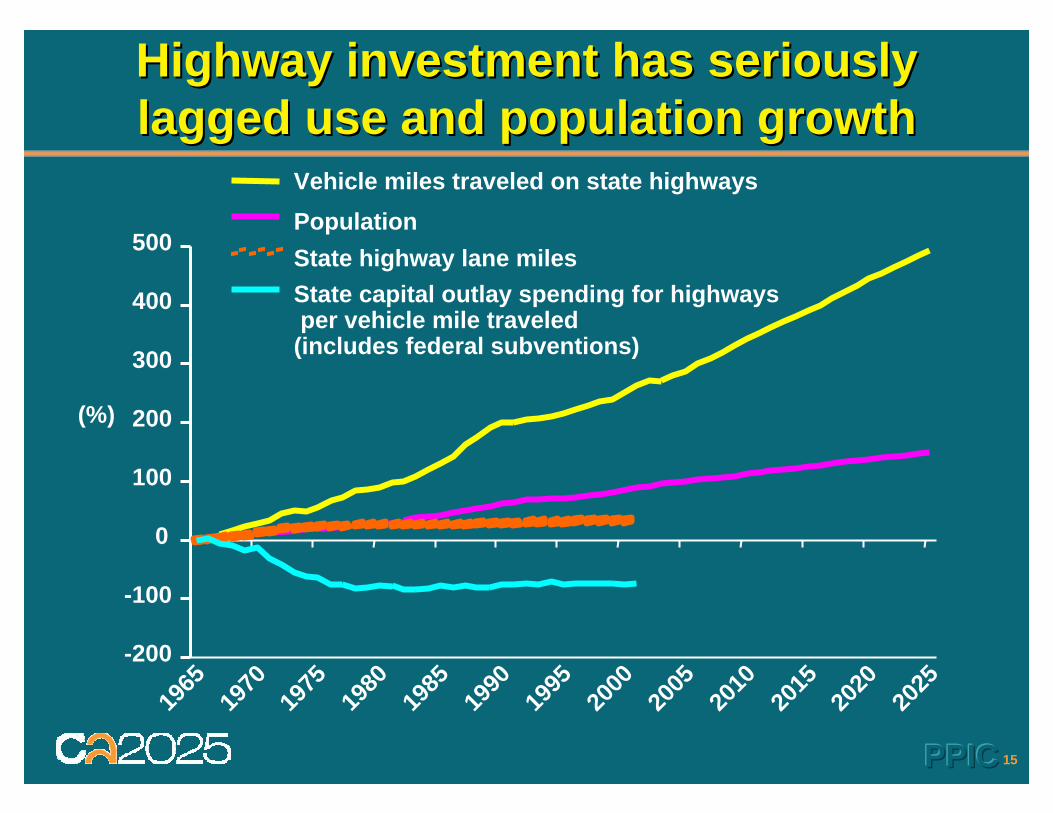
Highway investment has seriouslyHighway investment has seriouslylagged use and population growthlagged use and population growth
Vehicle miles traveled on state highwaysPopulationState highway lane milesState capital outlay spending for highwaysper vehicle mile traveled (includes federal subventions)
(%)
16PPICPPICPPIC
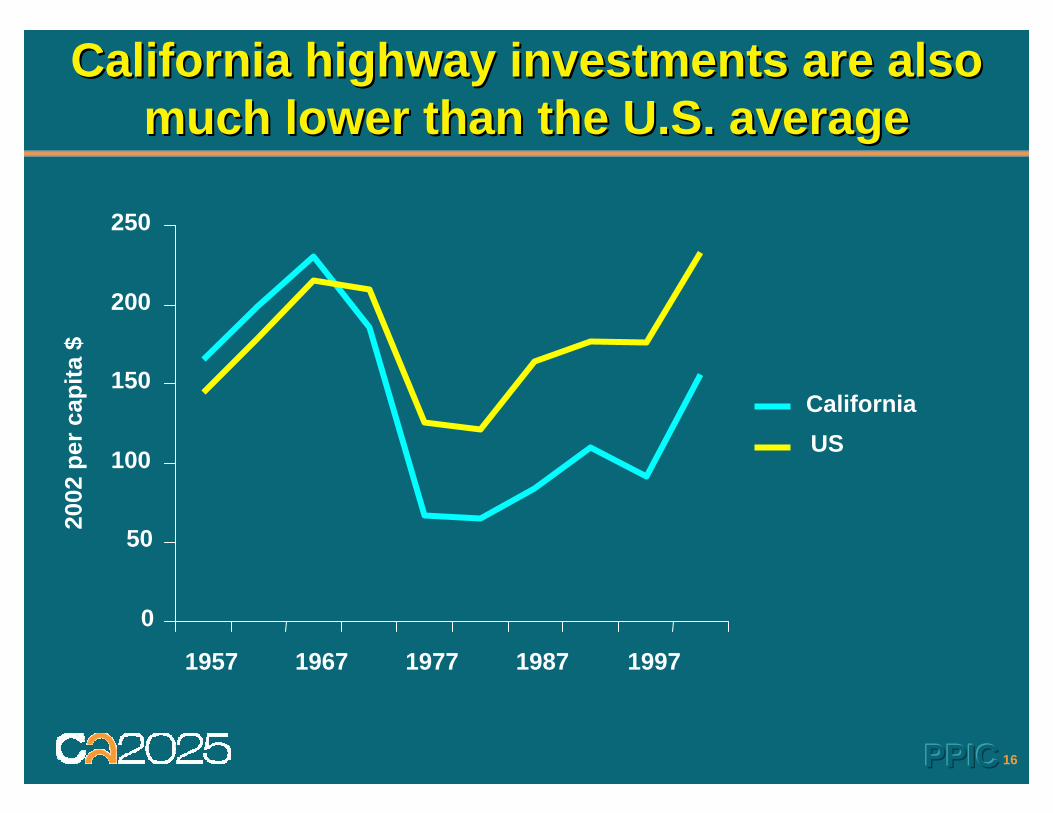
California highway investments are also California highway investments are also much lower than the U.S. averagemuch lower than the U.S. average
0
50
100
150
200
250
1957 1967 1977 1987 1997
CaliforniaUS
2002
per
cap
ita $
17PPICPPICPPIC
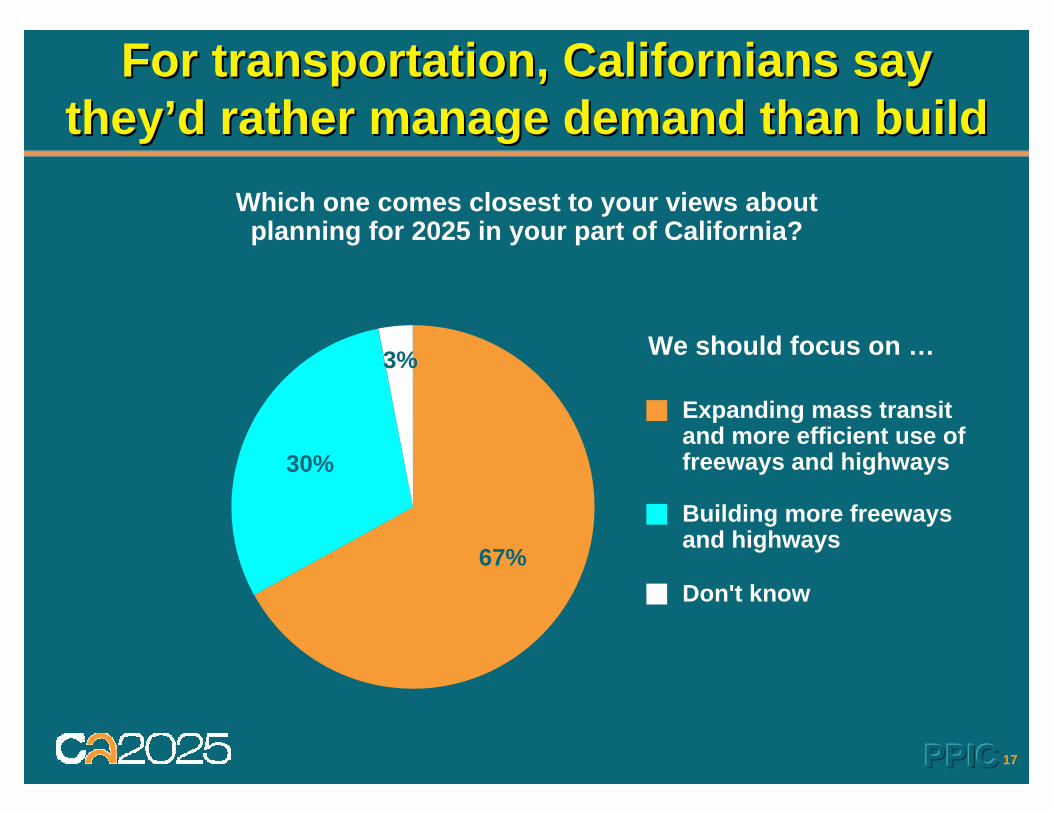
For transportation, Californians say For transportation, Californians say they’d rather manage demand than buildthey’d rather manage demand than build
Which one comes closest to your views about planning for 2025 in your part of California?
Expanding mass transitand more efficient use offreeways and highways
Building more freewaysand highways
Don't know67%
30%
3% We should focus on …
18PPICPPICPPIC
OutlineOutline
•• Population and economy forecastsPopulation and economy forecasts
•• Funding and meeting needsFunding and meeting needs–– Education facilitiesEducation facilities–– TransportationTransportation
•• Governance challengesGovernance challenges
19PPICPPICPPIC
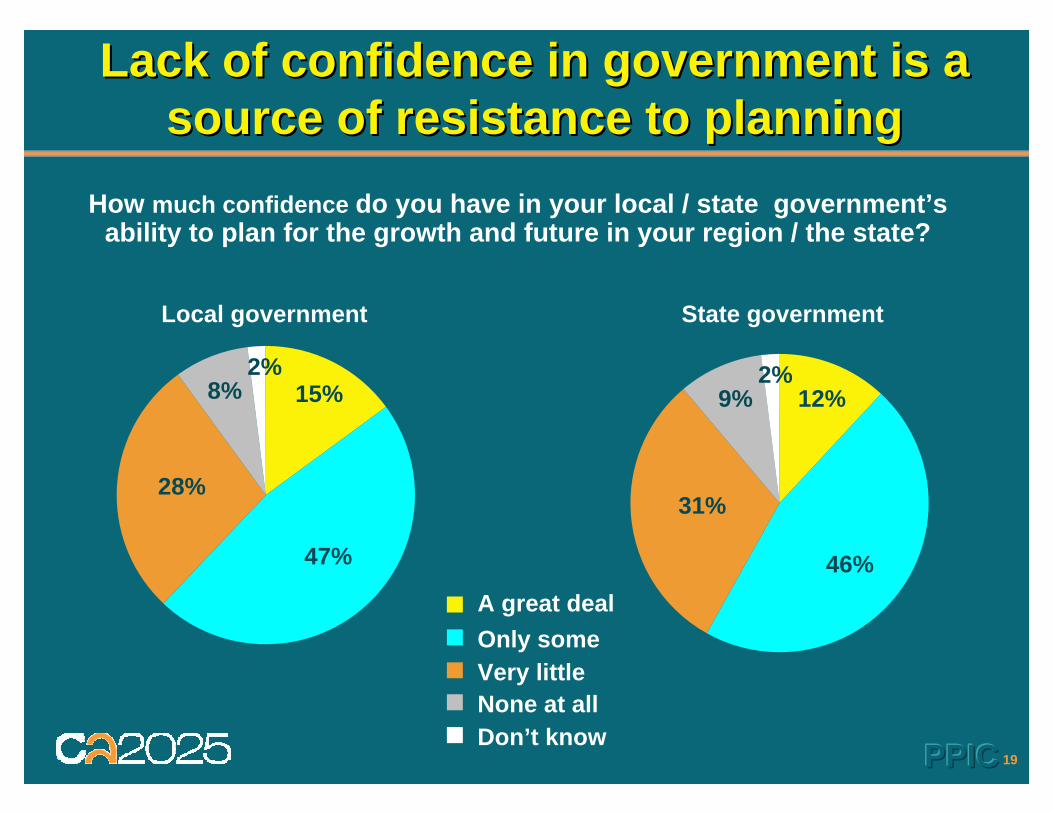
A great dealOnly someVery littleNone at allDon’t know
Lack of confidence in government is a Lack of confidence in government is a source of resistance to planningsource of resistance to planning
Local government State government
47%
15%
28%
8%2%
31%
9%
46%
12%2%
How much confidence do you have in your local / state government’sability to plan for the growth and future in your region / the state?
20PPICPPICPPIC
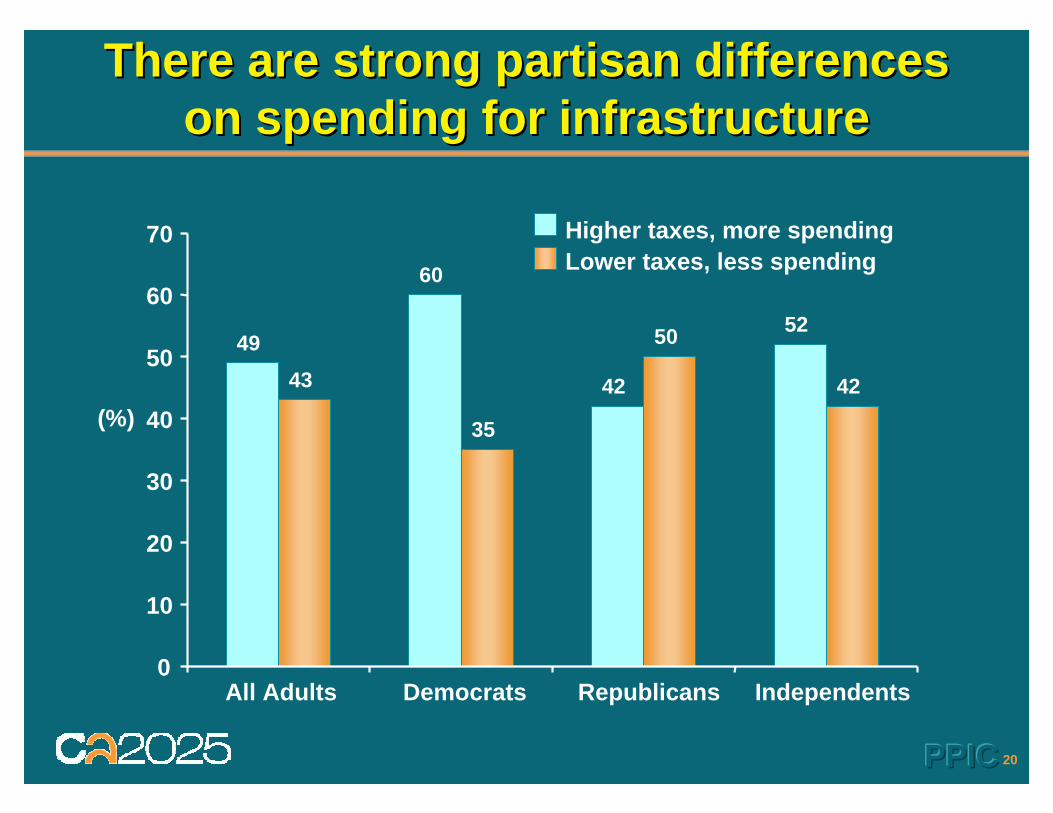
There are strong partisan differencesThere are strong partisan differenceson spending for infrastructureon spending for infrastructure
49
60
42
52
43
35
50
42
0
10
20
30
40
50
60
70
All Adults Democrats Republicans Independents
(%)
Higher taxes, more spendingLower taxes, less spending
21PPICPPICPPIC
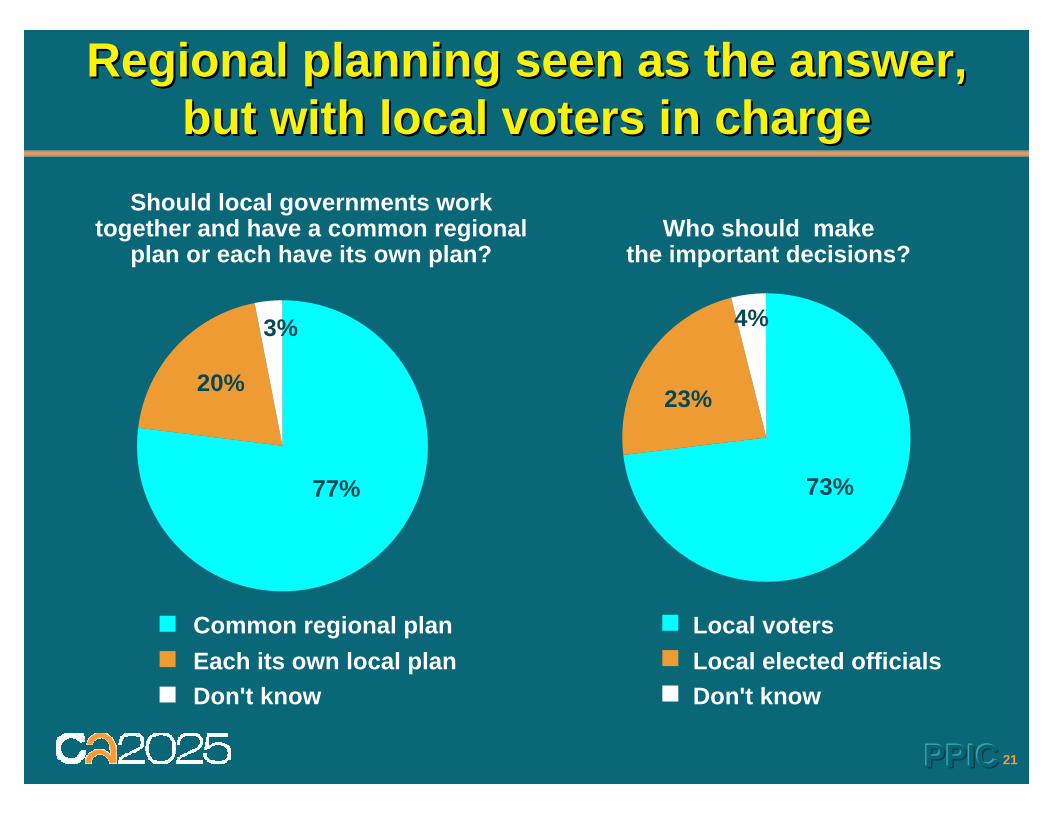
Regional planning seen as the answer, Regional planning seen as the answer, but with local voters in chargebut with local voters in charge
Should local governments work together and have a common regional
plan or each have its own plan?
3%
20%
77%
Common regional planEach its own local planDon't know
Who should make the important decisions?
4%
23%
73%
Local votersLocal elected officialsDon't know
22PPICPPICPPIC
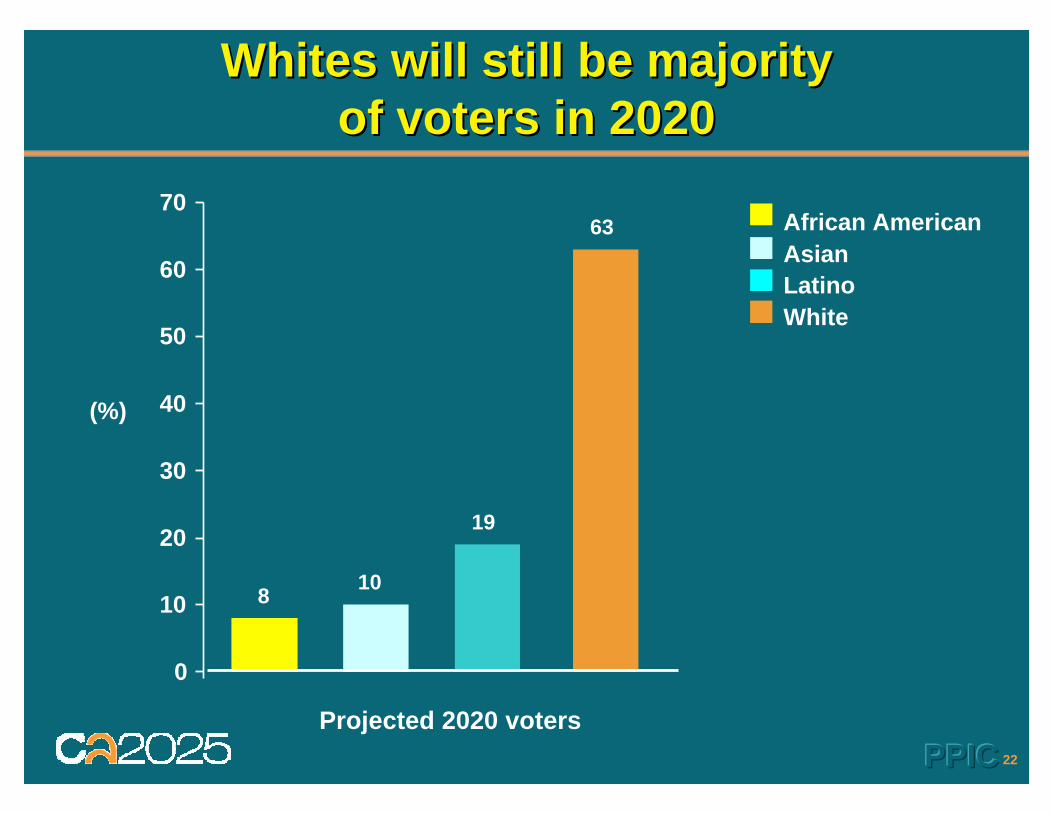
Whites will still be majorityWhites will still be majorityof voters in 2020of voters in 2020
108
19
63
0
10
20
30
40
50
60
70
Projected 2020 voters
AsianAfrican American
LatinoWhite
(%)
23PPICPPICPPIC
Some issue areas to address Some issue areas to address for future planningfor future planning
•• The education deficitThe education deficit
•• The threat of unrepresentative governmentThe threat of unrepresentative government
•• The inequity of infrastructureThe inequity of infrastructure
•• The shrinking infrastructure dollarThe shrinking infrastructure dollar
•• The difficult policy contextThe difficult policy context