Embed Size (px)
Citation preview

Q3
2015 Axis REIT Managers Bhd
Q3 2015 Results Presentation 19th October 2015

3Q 2015
Highlights
3
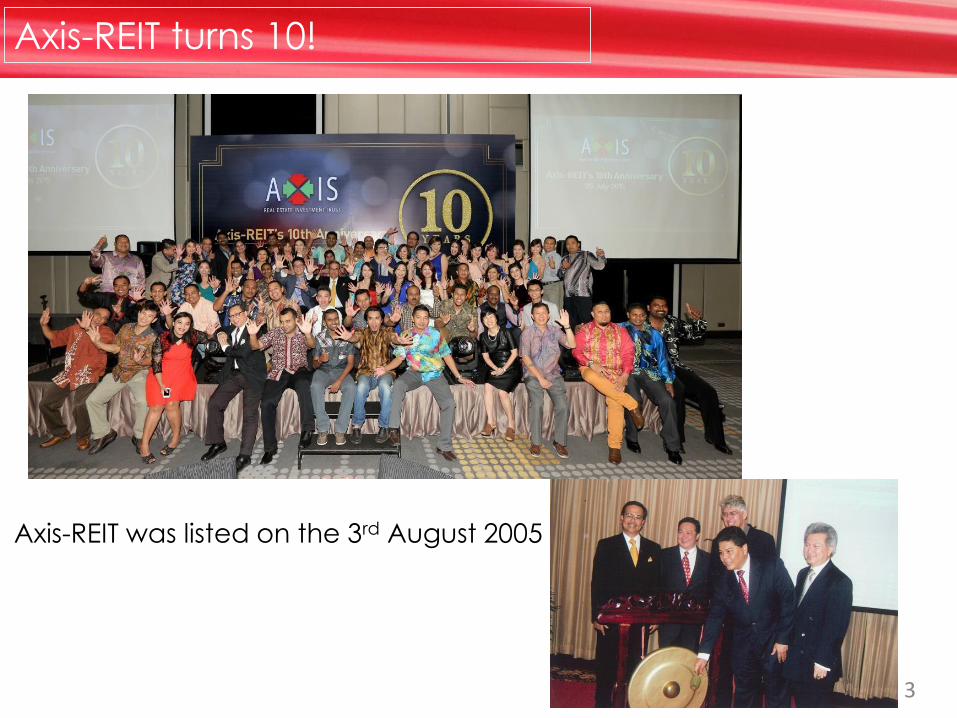
Axis-REIT turns 10!
Axis-REIT was listed on the 3rd August 2005

4
Our 10 year milestones - briefly
Assets Under Management RM296 million RM2.09 billion
Space Under Management 978,000 sq.ft 7,014,356 sq ft
Properties 5 34
Valuation Gain since listing RM276,000,000
First REIT to convert into an Islamic REIT
First PLC to adopt Cloud Computing
First REIT to introduce the Income Distribution Reinvestment Plan
First REIT to implement Unit Split
Winner of Best Practices Award from Asian Public Real Estate Association
Founding member of the Malaysian REIT Managers Association

5
Dato’Stewart LaBrooy to retire as CEO
Y Bhg Dato’ Stewart LaBrooy CEO & Executive Director
Ms. Leong Kit May COO & Finance Director
The Board of Directors of Axis REIT Managers Berhad, announced that the Manager
had received approval from the Securities Commission Malaysia vide their letter
dated 13 October 2015 for the appointment of Ms Leong Kit May to succeed Dato'
Stewart LaBrooy as CEO when he retires on 31 December 2015.
Ms Leong's appointment will be effective 1 January 2016.
Dato' Stewart LaBrooy will continue to serve the Board as a Non-Independent Non-
Executive Director from 1 January 2016.

6
* (Based on DPU from operations + gain on disposal + movement in market price)/
Restated opening market price as at 1 January 2015)
Q3 2015 Return Comparatives
-1.92%
5.05%
6.75%
4.17%
3.69% 3.25%
-3.00%
-2.00%
-1.00%
0.00%
1.00%
2.00%
3.00%
4.00%
5.00%
6.00%
7.00%
8.00%
Axis-REIT Total
Return *
Axis-REIT
Distribution Yield
EPF Dividend
Return
10-yr MGS 12 Months FD
Rate
OPR
7
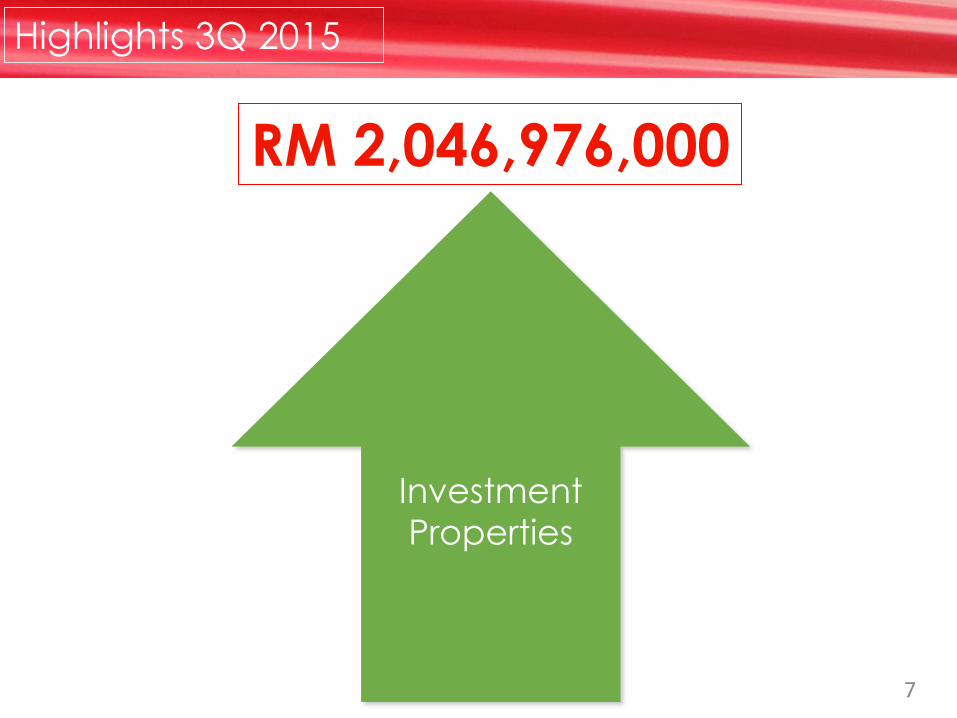
Investment Properties
Highlights 3Q 2015
RM 2,046,976,000

8
Highlights 3Q 2015
Completed the acquisition of Axis Shah Alam DC2 for RM45 million on 31 March ,
which was the remaining property with a related party initially transacted in 2014.
Acceptance of a Letter of Offer to acquire a new industrial facility for RM61.0
million located in Indahpura, Johor on 30 June 2015.
Acceptance of a Letter of Offer to acquire a new logistic warehouse for RM41.0
million located in SiLC, Nusajaya on 13 October 2015.
The Unit Split was implemented and completed with the Subdivided Units being
listed and quoted on the Main Market of Bursa Securities on 9 September 2015.
The fund size of the fund had been increased form 547,758,040 units to
1,095,516,080 units upon completion of the Unit Split.
Announced the 1st implementation of Income Distribution Reinvestment Plan
(IDRP) for 2015 in conjunction with the payment of 3rd interim income distribution.
Obtained Unitholders’ approval for General Mandate to place out additional 20%
new units.
Declared 2.20 sen DPU for 3Q 2015; equivalent to 4.40 sen prior to Unit Split.
Traded at a premium of 36.9% to our NAV as of 30 September 2015.
3Q 2015
Finance
Report
10
3Q 2015
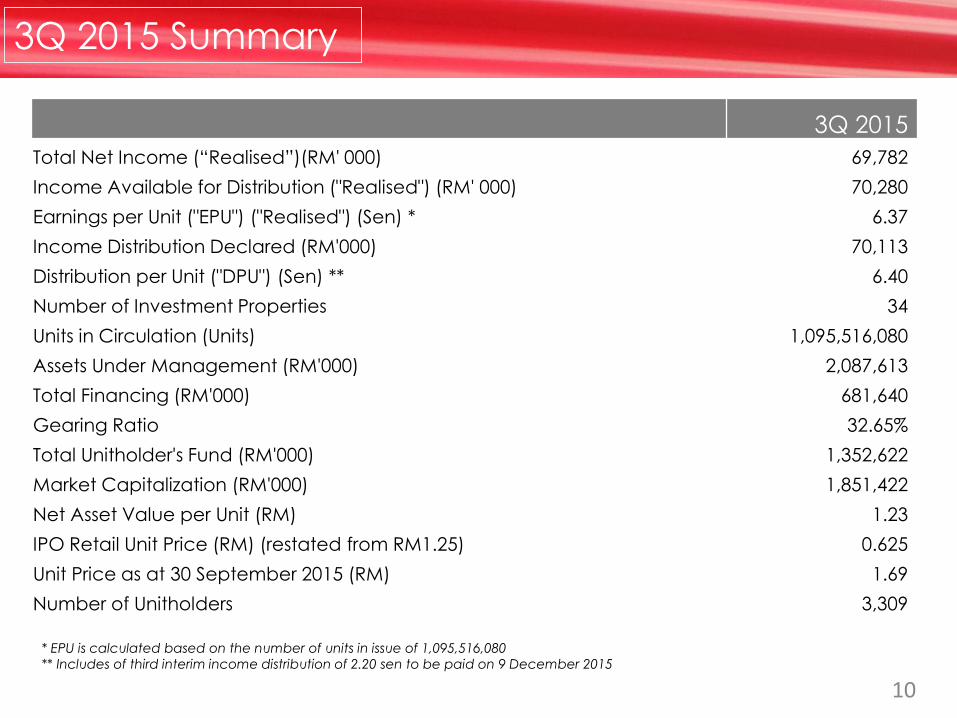
Total Net Income (“Realised”)(RM' 000) 69,782
Income Available for Distribution ("Realised") (RM' 000) 70,280
Earnings per Unit ("EPU") ("Realised") (Sen) * 6.37
Income Distribution Declared (RM'000) 70,113
Distribution per Unit ("DPU") (Sen) ** 6.40
Number of Investment Properties 34
Units in Circulation (Units) 1,095,516,080
Assets Under Management (RM'000) 2,087,613
Total Financing (RM'000) 681,640
Gearing Ratio 32.65%
Total Unitholder's Fund (RM'000) 1,352,622
Market Capitalization (RM'000) 1,851,422
Net Asset Value per Unit (RM) 1.23
IPO Retail Unit Price (RM) (restated from RM1.25) 0.625
Unit Price as at 30 September 2015 (RM) 1.69
Number of Unitholders 3,309
* EPU is calculated based on the number of units in issue of 1,095,516,080
** Includes of third interim income distribution of 2.20 sen to be paid on 9 December 2015
3Q 2015 Summary

3Q 2015
(RM ‘000)
3Q 2014
(RM’000)
Changes /
Movement
11
No. of Properties 34 30 + 4
Property Income 41,631 33,004 + 26.1%
Property Expenses (5,826) (5,099) + 14.3%
Net Property Income 35,805 27,905 + 28.3%
Profit Income / other income 226 117
Non-Property Expenses (4,643) (3,352) + 38.5%
Islamic Financing Cost (7,606) (5,777) + 31.7%
Income tax expenses (73) -
Net Income 23,709 18,893 + 25.5%
DPU (sen)
– on performance
– gain on disposal
2.20
-
2.12 *
0.38 *
+ 3.77%
No. of units in issuance 1,095,516,080 463,700,098
Note: The above financials excludes unrealised earnings due to changes in fair value of investment properties/tenants’ depos its and derivative
liability.
* Restated to reflect units issuance after split
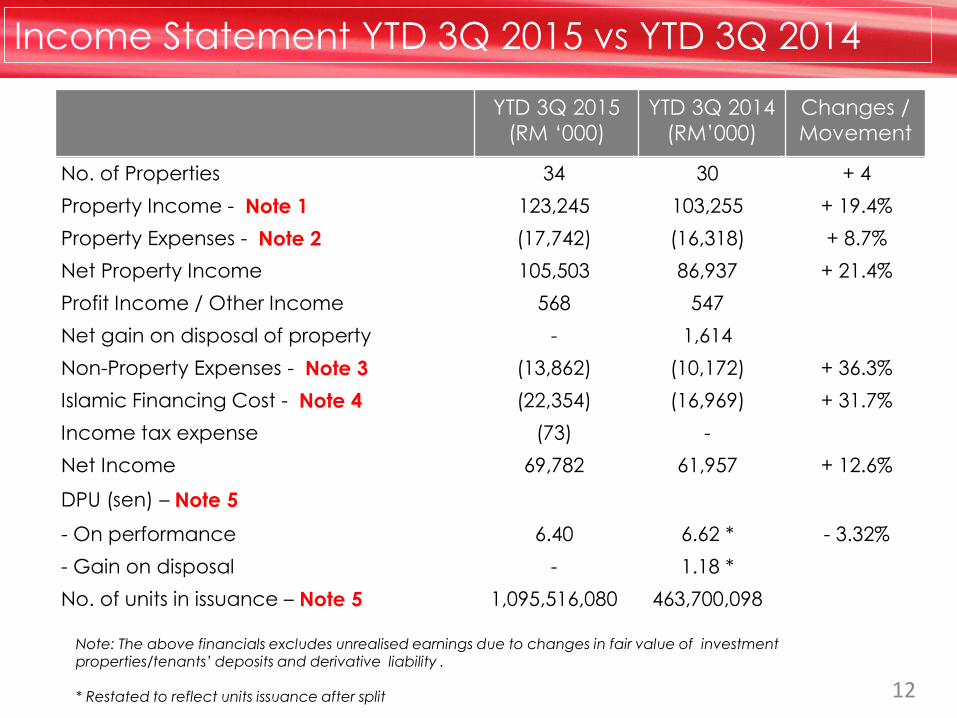
Income Statement 3Q 2015 vs 3Q 2014
YTD 3Q 2015
(RM ‘000)
YTD 3Q 2014
(RM’000)
Changes /
Movement
12
Note: The above financials excludes unrealised earnings due to changes in fair value of investment properties/tenants’ deposits and derivative liability . * Restated to reflect units issuance after split
Income Statement YTD 3Q 2015 vs YTD 3Q 2014
No. of Properties 34 30 + 4
Property Income - Note 1 123,245 103,255 + 19.4%
Property Expenses - Note 2 (17,742) (16,318) + 8.7%
Net Property Income 105,503 86,937 + 21.4%
Profit Income / Other Income 568 547
Net gain on disposal of property - 1,614
Non-Property Expenses - Note 3 (13,862) (10,172) + 36.3%
Islamic Financing Cost - Note 4 (22,354) (16,969) + 31.7%
Income tax expense (73) -
Net Income 69,782 61,957 + 12.6%
DPU (sen) – Note 5
- On performance 6.40 6.62 * - 3.32%
- Gain on disposal - 1.18 *
No. of units in issuance – Note 5 1,095,516,080 463,700,098
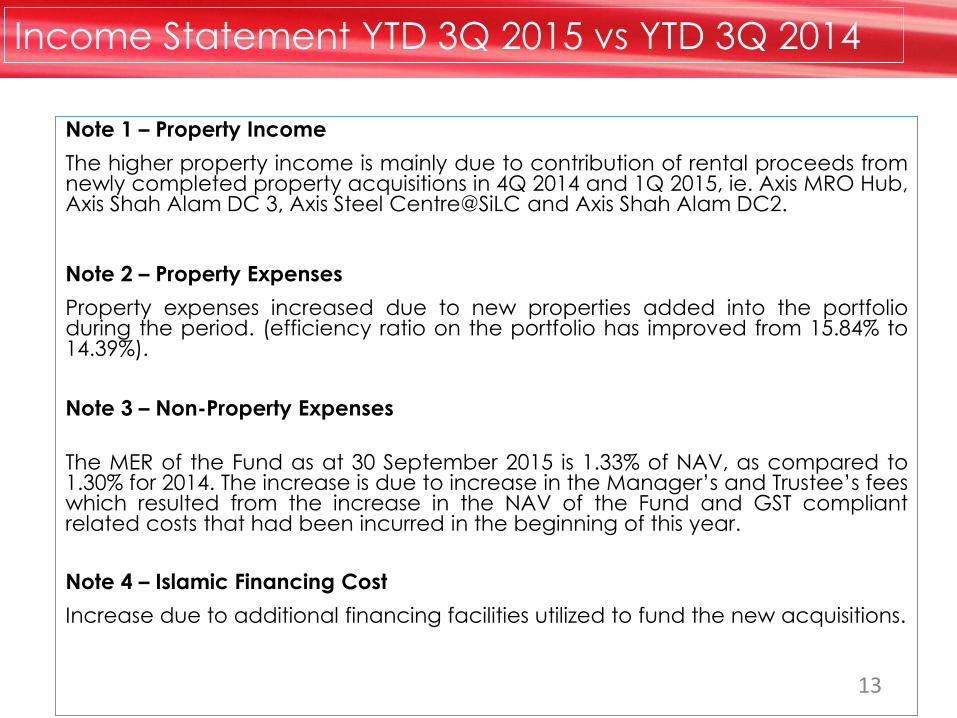
Note 1 – Property Income
The higher property income is mainly due to contribution of rental proceeds from newly completed property acquisitions in 4Q 2014 and 1Q 2015, ie. Axis MRO Hub, Axis Shah Alam DC 3, Axis Steel Centre@SiLC and Axis Shah Alam DC2.
Note 2 – Property Expenses
Property expenses increased due to new properties added into the portfolio during the period. (efficiency ratio on the portfolio has improved from 15.84% to 14.39%).
Note 3 – Non-Property Expenses
The MER of the Fund as at 30 September 2015 is 1.33% of NAV, as compared to 1.30% for 2014. The increase is due to increase in the Manager’s and Trustee’s fees which resulted from the increase in the NAV of the Fund and GST compliant related costs that had been incurred in the beginning of this year.
Note 4 – Islamic Financing Cost
Increase due to additional financing facilities utilized to fund the new acquisitions.
13
Income Statement YTD 3Q 2015 vs YTD 3Q 2014

Note 5 – No. of units in issuance and effect on DPU The Unit Split of 1 unit into 2 units has doubled the Fund's units in circulation and resulted in the DPU being halved. However the distribution yield remains.
14
Income Statement YTD 3Q 2015 vs YTD 3Q 2014
DPU declared for 2015
Prior to Unit Split After Unit Split
No. of units 547,758,040 1,095,516,080
1st interim 4.10 2.05
2nd interim 4.30 2.15
3rd interim equivalent to 4.40 2.20
YTD up to
3rd qtr 12.80 6.40

15
Gross Yield of Investment Properties
Properties Gross yield (%)
1 Wisma Kemajuan 18.15%
2 Crystal Plaza 14.31%
3 Delfi Warehouse 13.48%
4 FCI Senai 13.31%
5 BMW Centre PTP 12.80%
6 Menara Axis 12.60%
7 D8 Logistics Warehouse 12.09%
8 Strateq Data Centre 11.93%
9 Niro Warehouse 11.42%
10 Fonterra HQ 10.97%
11 Seberang Prai Logistic Warehouse 3 10.87%
12 Wisma Academy Parcel 10.37%
13 Axis PDI Centre 10.00%
14 Infinite Centre 9.98%
15 Quattro West 9.94%
16 Emerson Industrial Facility Nilai 9.85%
17 Axis Vista 9.82%
18 Bayan Lepas Distribution Centre 9.66%
19 Axis Shah Alam DC 1 9.53%
20 Giant Hypermarket, Sungai Petani 9.02%
21 Seberang Prai Logistic Warehouse 1 8.99%
22 Axis Steel Centre 8.84%
23 Bukit Raja Distribution Centre 8.71%
24 Axis Business Park 8.63%
25 Seberang Prai Logistic Warehouse 2 8.53%
26 Tesco Bukit Indah 8.43%
27 Axis Shah Alam DC 3 7.98%
28 Axis MRO Hub 7.88%
29 Axis Shah Alam DC 2 7.68%
30 Axis Technology Centre 7.56%
31 Axis Steel Centre@ SiLC 7.46%
32 Axis Eureka 7.19%
33 The Annex 6.50%
34 Axis Business Campus -
Average gross yield 3Q 2015 = 9.86%

16
Net Yield of Investment Properties / Cost
Properties Net yield (%)
1 Wisma Kemajuan 14.09%
2 Crystal Plaza 12.05%
3 FCI Senai 11.86%
4 Delfi Warehouse 11.74%
5 BMW Centre PTP 11.63%
6 Strateq Data Centre 11.33%
7 D8 Logistics Warehouse 11.29%
8 Niro Warehouse 10.36%
9 Menara Axis 10.26%
10 Seberang Prai Logistic Warehouse 3 9.82%
11 Fonterra HQ 9.44%
12 Emerson Industrial Facility Nilai 8.92%
13 Axis PDI Centre 8.80%
14 Bayan Lepas Distribution Centre 8.79%
15 Axis Vista 8.69%
16 Axis Shah Alam DC 1 8.60%
17 Seberang Prai Logistic Warehouse 1 8.52%
18 Giant Hypermarket, Sungai Petani 8.26%
19 Bukit Raja Distribution Centre 8.20%
20 Axis Steel Centre 8.02%
21 Seberang Prai Logistic Warehouse 2 7.88%
22 Tesco Bukit Indah 7.83%
23 Quattro West 7.64%
24 Infinite Centre 7.64%
25 Wisma Academy Parcel 7.22%
26 WiAxis MRO Hub 7.18%
27 Axis Shah Alam DC 3 7.10%
28 Axis Steel Centre@ SiLC 7.09%
29 Axis Shah Alam DC 2 6.94%
30 Axis Business Park 6.51%
31 Axis Technology Centre 5.76%
32 Axis Eureka 4.39%
33 The Annex 4.23%
34 Axis Business Campus -
Average net yield 3Q 2015 = 8.47%

17
Income Statement
0.00
5.00
10.00
15.00
20.00
25.00
30.00
35.00
1Q 2014 2Q 2014 3Q 2014 4Q 2014 1Q 2015 2Q 2015 3Q 2015
20.83 20.83 19.85 20.26
22.67 23.75 23.86
RM
' m
illio
n
Adjusted Income Before Taxation/ Income Available For Distribution:
Gain on disposal
RM10.952 mil
Gain on disposal RM5.9 mil
Gain on disposal RM7.2
mil
Gain on disposal RM10.952 mil

18
3rd Quarter 2015 Income Distribution
3rd Interim 2015 Income Distribution: 2.20 sen
The 2.20 sen DPU represents 99.76% income available for distribution from performance of properties for the period from 1 July 2015 to 30 September 2015
Important dates:
Ex-date: 29 October 2015
Entitlement date: 2 November 2015 Payment date: 9 December 2015

19
Implementation of Income Distribution
Reinvestment Plan (IDRP)
a) Electable Portion : 1.00 sen which is 45% of the 2.20
sen DPU to be allow for reinvestment
b) Exercise Price : RM1.59 represents a 5.8%
discount to the VWAMP up to
and including 16 October 2015
The Manager wishes to announce that it will be implementing the
Income Distribution Reinvestment Plant for the 3Q 2015.
Details are as follows:

20
Summary of Realised EPU and DPU (Restated After Unit Split)
2.44
6.41
6.80
7.73 7.89 8.01
8.64
9.30 9.23
8.71
6.37
2.35
6.48
6.82
7.64 7.90
8.00
8.60
9.30 9.25
9.88
6.40
-
1.00
2.00
3.00
4.00
5.00
6.00
7.00
8.00
9.00
10.00
2005 2006 2007 2008 2009 2010 2011 2012 2013 2014 YTD 3Q
2015
sen
pe
r u
nit
EPU (realised)
After Unit Split
DPU
After Unit split

30/09/15 (RM’000)
31/12/14 (RM’000) Changes
Investment Properties – Note 1 2,046,976 1,982,587 + 64,389
Fixed Assets 3,712 2,821 + 891
Other Assets – Note 2 36,925 100,475 - 63,550
TOTAL ASSETS 2,087,613 2,085,883 + 1,730
Borrowings – Note 3 681,640 683,769 - 2,129
Other Payables 53,351 75,745 - 22,394
TOTAL LIABILITIES 734,991 759,514 - 24,523
NET ASSETS VALUE (“NAV”) 1,352,622 1,326,369 + 26,253
Unitholders' Capital – Note 4 1,045,258 1,044,664 + 594
Undistributed Distributable Income 21,383 5,555 + 15,828
Non-Distributable Reserve – Note 5 285,981 276,150 + 9,831
TOTAL UNITHOLDERS' FUND 1,352,622 1,326,369 + 26,253
GEARING 32.65% 32.78%
NAV/unit (RM) 1.2347 2.4225
No. of units in issuance 1,095,516,080 547,522,040 21
Statement of Financial Positions

22
Note 1 – Investment properties
The acquisition of Axis Shah Alam DC2 was completed on 31 March 2015 at RM45 million. A total of RM9.905 million has been incurred for enhancement of the properties in the nine months period of 2015. Five properties have been
revalued in 2015 resulted in a gain of RM8.702 million.
Note 2 – Other assets
The average collection of trade receivables is as shown below:
For Period Ended Avg. Collection Period (in days)
31-DEC-14 2
31-MAR-15 2
30-JUN-15
30-SEP-15
7
3
Statement of Financial Positions
23
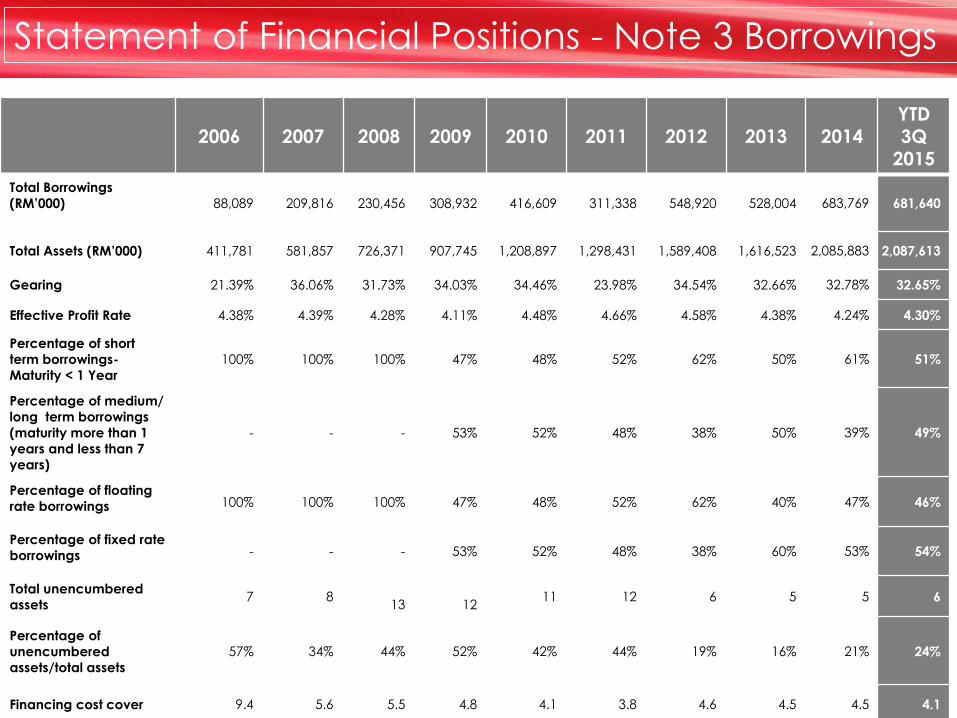
2006 2007 2008 2009 2010 2011 2012 2013 2014 YTD 3Q
2015
Total Borrowings
(RM’000)
88,089 209,816 230,456 308,932 416,609 311,338 548,920 528,004 683,769 681,640
Total Assets (RM’000) 411,781 581,857 726,371 907,745 1,208,897 1,298,431 1,589,408 1,616,523 2,085,883 2,087,613
Gearing 21.39% 36.06% 31.73% 34.03% 34.46% 23.98% 34.54% 32.66% 32.78% 32.65%
Effective Profit Rate 4.38% 4.39% 4.28% 4.11% 4.48% 4.66% 4.58% 4.38% 4.24% 4.30%
Percentage of short
term borrowings-
Maturity < 1 Year
100% 100% 100% 47% 48% 52% 62% 50% 61% 51%
Percentage of medium/
long term borrowings
(maturity more than 1
years and less than 7
years)
- - - 53% 52% 48% 38% 50% 39% 49%
Percentage of floating
rate borrowings 100% 100% 100% 47% 48% 52% 62% 40% 47% 46%
Percentage of fixed rate
borrowings - - - 53% 52% 48% 38% 60% 53% 54%
Total unencumbered
assets 7 8
13
12 11 12 6 5 5 6
Percentage of
unencumbered
assets/total assets
57% 34% 44% 52% 42% 44% 19% 16% 21% 24%
Financing cost cover 9.4 5.6 5.5 4.8 4.1 3.8 4.6 4.5 4.5 4.1
Statement of Financial Positions - Note 3 Borrowings
0.0%
5.0%
10.0%
15.0%
20.0%
25.0%
30.0%
35.0%
40.0%
3Q
2005
4Q
2005
1Q
2006
2Q
2006
3Q
2006
4Q
2006
1Q
2007
2Q
2007
3Q
2007
4Q
2007
1Q
2008
2Q
2008
3Q
2008
4Q
2008
1Q
2009
2Q
2009
3Q
2009
4Q
2009
1Q
2010
2Q
2010
3Q
2010
4Q
2010
1Q
2011
2Q
2011
3Q
2011
4Q
2011
1Q
2012
2Q
2012
3Q
2012
4Q
2012
1Q
2013
2Q
2013
3Q
2013
4Q
2013
1Q
2014
2Q
2014
3Q
2014
4Q
2014
1Q
2015
2Q
2015
3Q
2015
10.8% 11.8%
14.0%
25.0%
23.7%
21.4%
23.5% 22.4%
31.2%
36.1%
26.8%
29.1%
31.8% 31.7% 33.0%
33.1%
27.3%
34.0%
35.4% 36.0%
31.3%
34.5%
36.0% 37.5%
38.2%
24.0%
28.8% 30.0%
34.2%
34.5% 33.9%
32.6% 32.7%
32.7% 32.5%
31.7%
33.4% 32.8%
32.5% 32.5%
32.5%
24
Gearing Levels
Statement of Financial Positions
Placements Undertaken

-
500.0
1,000.0
1,500.0
2,000.0
2,500.0
31-Dec-05 31-Dec-06 31-Dec-07 31-Dec-08 31-Dec-09 31-Dec-10 31-Dec-11 31-Dec-12 31-Dec-13 31-Dec-14 30-Sep-15
339.6 411.8
581.8
726.4
907.7
1,208.9
1,298.4
1,589.4 1,616.5
2,085.7 2,086.7
234.9 234.9 234.9 323.3
406.9
540.3
728.2 735.4 751.0
1,044.7 1,045.5 RM
mil
Total Asset Unitholders' Capital
25
Unitholders’Capital – Note 4
The funds raised from equity
placements are being
injected into acquiring good
quality properties…..

26
Unitholders’Capital – Note 4
… resulting in good total returns to unitholders.
170%
88% 104%
72%
38%
-2%
132%
74% 65%
47%
29%
4%
302%
162% 169%
119%
67%
-40%
0%
40%
80%
120%
160%
200%
240%
280%
320%
IPO @ RM1.25 Placement '08 @ RM1.80 Placement '09 @ RM1.66 Placement '10 @ RM1.97 Placement '11 @ RM2.45 Placement '14 @ RM3.45
Total returns on placements
Capital return Distribution return

27
Non-distributable reserve mainly comprises the favorable gain in fair value of
approx. RM276 million to date.
Note 5 – Non-distributable reserve
Statement of Financial Positions
Crystal Plaza 44,329
Menara Axis 38,002
Axis Business Park 24,287
Axis Vista 22,388
Wisma Kemajuan 21,920
Bukit Raja Distribution
Centre 20,584
Axis Business Campus 14,807
Tesco Bukit Indah 13,699
Strateq Data Centre 10,368
Infinite Centre 7,112
Axis Shah Alam DC 1 5,829
Axis PDI Centre 5,664
The Annex 5,630
Quattro West 5,351
Wisma Academy Parcel 5,041
Fonterra HQ 3,937
Axis Steel Centre 3,727
FCI Senai 3,341
Axis Technology Centre 2,891
Delfi Warehouse 2,797
Emerson Industrial Facility Nilai 2,693
Seberang Prai Logistic Warehouse 1 2,498
Niro Warehouse 2,466
Giant Hypermarket, Sungei Petani 2,102
BMW Centre PTP 1,937
Seberang Prai Logistic Warehouse 3 1,929
D8 Logistics Warehouse 1,914
Bayan Lepas Distribution Centre 692
Seberang Prai Logistic Warehouse 2 675
Axis Shah Alam DC 2 -
Axis Steel Centre@ SiLC (20)
Axis Eureka (243)
Axis MRO Hub (357)
Axis Shah Alam DC 3 (2,416)
Building Gain /(Loss) RM’000 Building Gain /(Loss) RM’000
Q3 2015
Property
Report
28

2015 Overview
Q3 2015 occupancy rate has held steady registering a slight adjustment down to
92.64% from 92.67% in Q2 2015. There have been some movements in the portfolio
with some tenants moving out, however the leasing team has succeeded to
secure replacements tenants for these spaces at higher rents.
The vacant spaces in the portfolio currently stands at 516,304 sq. ft as at 30
September 2015. Our leasing team continues to work hard to secure new tenants
to fill up the voids in our properties within the portfolio. It is fortunate that these
vacancies are occurring in our newly refurbished buildings which have recently
come back on the market. Being new and contemporary, they have generated
much interest with prospective tenants.
We are pleased to report that we have been successful in securing new
tenancies/leases which will be commencing in December 2015 for approximately
30,000 sq ft and we expect that few more prospects will sign on for their tenancies/
leases by end of this year. This should result in a sharp reduction in the vacancies in
the portfolio.
29

2015 Overview
The industrial portfolio continues to perform very well and has excellent growth
prospects in the coming years. Demand for e-commerce platforms are rising and
we are working with our current tenants to upgrade their current facilities to meet
this new demand.
The current weakness in the Malaysian economy continues to weigh down the
demand for office space. Our challenge is the fact that many companies that are
looking for space to expand or relocate operations are taking a longer time to
deliberate on their decisions. It is fortunate that our properties remain in demand
due to their unique configuration and strategic locations.
By filling the current voids, we expect to add as much as 1.97 sen to the annual
DPU (based on the enlarged unit size after the Unit Split).
30
31
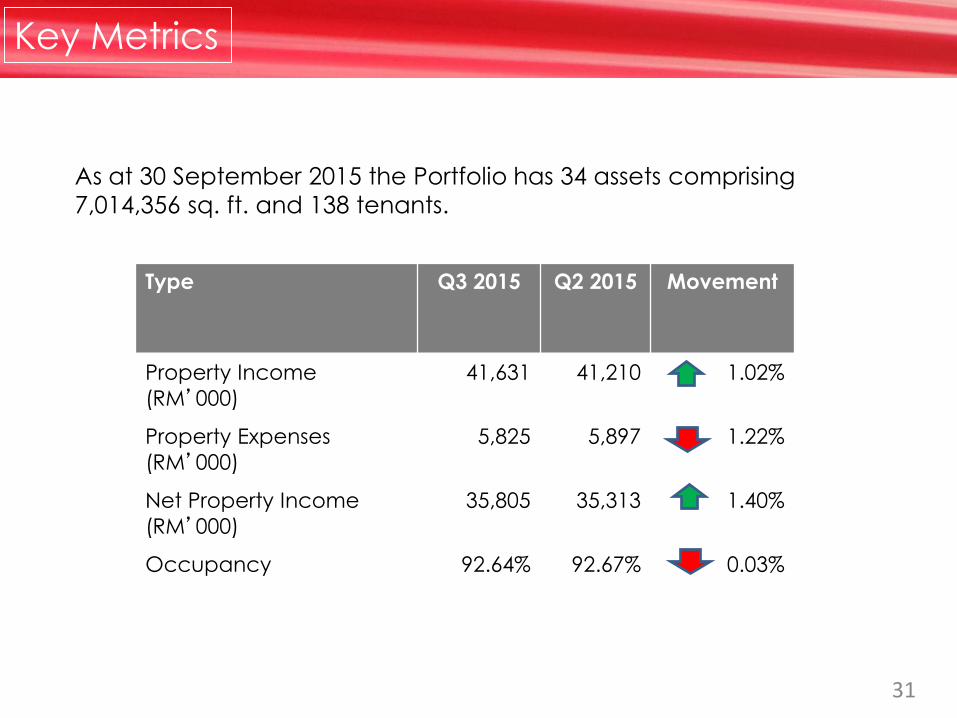
Key Metrics
As at 30 September 2015 the Portfolio has 34 assets comprising
7,014,356 sq. ft. and 138 tenants.
Type Q3 2015
Q2 2015 Movement
Property Income
(RM’000)
41,631 41,210 1.02%
Property Expenses
(RM’000)
5,825 5,897 1.22%
Net Property Income
(RM’000)
35,805 35,313 1.40%
Occupancy 92.64% 92.67% 0.03%

32
Key Metrics
Average Rental Rates:
Type of Properties Q3 2015 Q2 2015 Movement
Office (RM/sq. ft.) 4.64 4.63 + 0.01
Office Industrial (RM/sq. ft.) 2.62 2.62 No change
Manufacturing Facilities (RM/sq. ft.) 1.33 1.29 + 0.04
Warehouse Logistics (RM/sq. ft.) 1.70 1.69 + 0.01
Hypermarket (RM/sq. ft.) 2.24 2.24 No change

33
Space Under Management (Sq. Ft.)
34
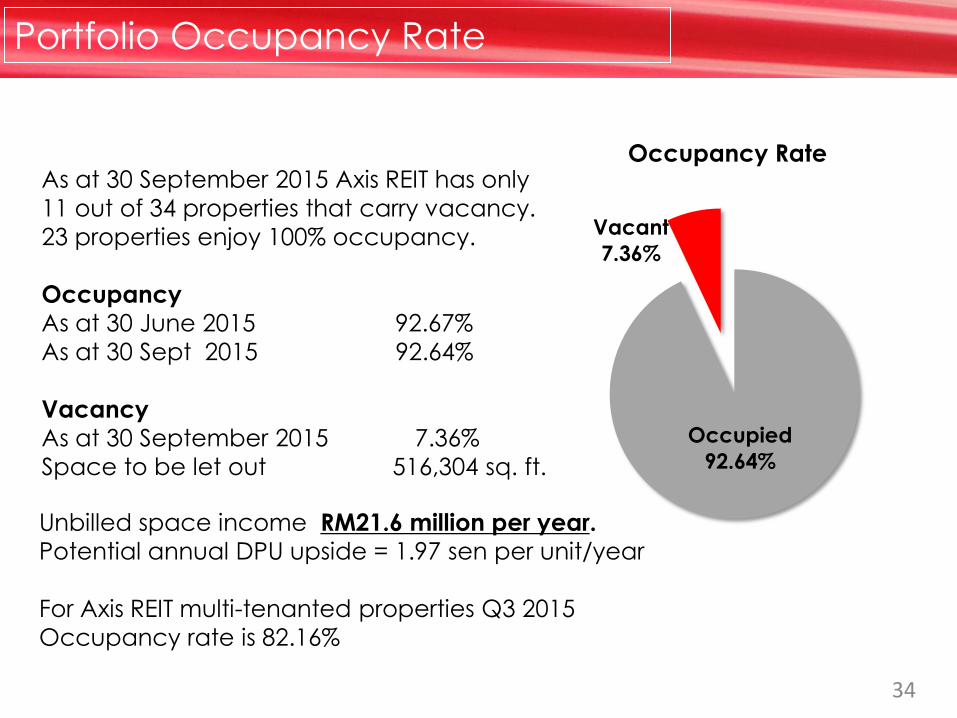
Portfolio Occupancy Rate
As at 30 September 2015 Axis REIT has only
11 out of 34 properties that carry vacancy.
23 properties enjoy 100% occupancy.
Occupancy
As at 30 June 2015 92.67%
As at 30 Sept 2015 92.64%
Vacancy
As at 30 September 2015 7.36%
Space to be let out 516,304 sq. ft.
Unbilled space income RM21.6 million per year.
Potential annual DPU upside = 1.97 sen per unit/year
For Axis REIT multi-tenanted properties Q3 2015
Occupancy rate is 82.16%
Occupied
92.64%
Vacant
7.36%
Occupancy Rate

35
Occupancy Rates by Property As At 30 Sep 2015
1 Menara Axis 78.77%
2 Crystal Plaza 81.33%
3 Quattro West 84.18%
4 Axis Eureka 59.08%
5 Axis Business Park 63.99%
6 Infinite Centre 71.53%
7 Wisma Kemajuan 97.38%
8 Axis Business Campus -
9 Strateq Data Centre 100.00%
10 Fonterra HQ 84.96%
11 Axis Vista 100.00%
12 Axis Tech Centre 80.47%
13 Wisma Academy Parcel 92.07%
14 The Annex 100.00%
15 Giant Hypermarket Sg. Petani 100.00%
16 Tesco Bukit Indah 100.00%
17 Axis Shah Alam DC 1 100.00%
18 BMW Asia Technology Centre 100.00%
19 Niro Warehouse 100.00%
20 Delfi Warehouse 100.00%
21 Axis Steel Centre 100.00%
22 Bukit Raja Distribution Centre 100.00%
23 Seberang Prai Logistic Warehouse 1 100.00%
24 Seberang Prai Logistic Warehouse 2 100.00%
25 Axis PDI Centre 100.00%
26 D8 Logistics Warehouse 100.00%
27 FCI Senai 100.00%
28 Bayan Lepas Distribution Centre 100.00%
29 Seberang Prai Logistic Warehouse 3 100.00%
30 Emerson Industrial Facility Nilai 100.00%
31 Axis Shah Alam DC 3 100.00%
32 Axis MRO Hub 100.00%
33 Axis Steel Centre @ SiLC 100.00%
34 Axis Shah Alam DC 2 100.00%
36
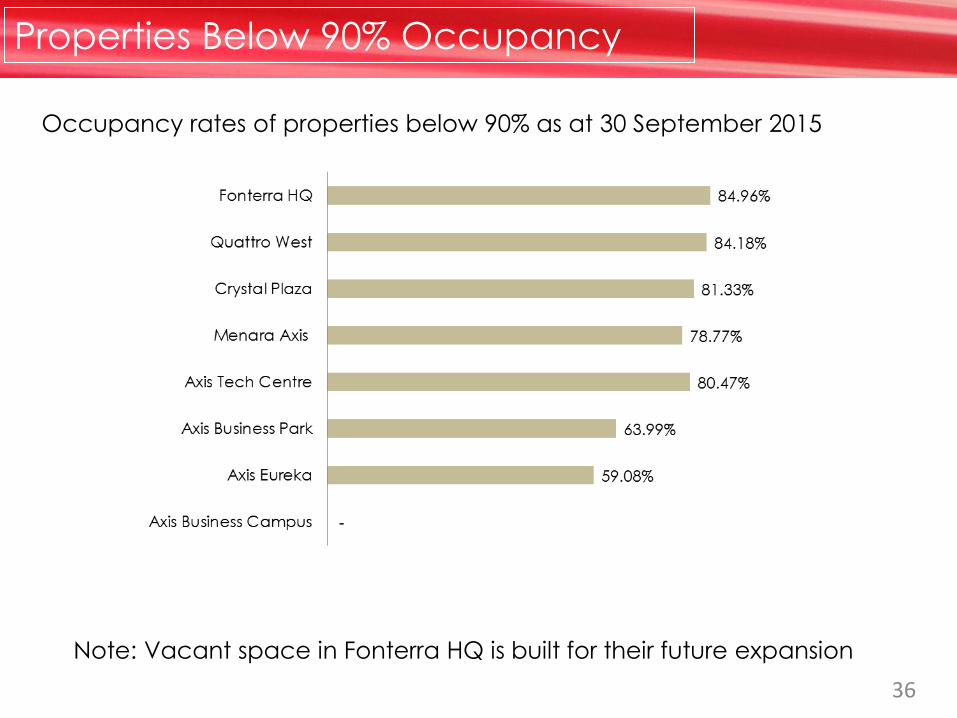
Properties Below 90% Occupancy
Occupancy rates of properties below 90% as at 30 September 2015
Note: Vacant space in Fonterra HQ is built for their future expansion

37
Diversified Portfolio
9%
22%
5%
46%
18%
Portfolio Diversification by Type and NLA
Office
Office/ Industrial
Hypermarkets
Warehouse Logistic
Manufacturing Facilities - Light Industrial

38
Portfolio Location
1.68%
1.97%
4.16%
6.06%
10.67%
23.01%
24.07%
28.39%
Cyberjaya
Kedah
Nilai
Klang
Penang
Shah Alam
Johor
Petaling Jaya
Portfolio Diversification by Geographical Location

39
Tenancy Mix
57%
43%
Single Tenant vs. Multi Tenant
Single Tenant Multi Tenant

40
Lease Expiry Profile – Looking Forward
Year Area up for
renewal
% of Total
NLA
% of Rental
Income
2015 903,977 sq. ft. 12.89% 15.24%
2016 1,765,120 sq. ft. 25.16% 26.46%
2017 1,140,198 sq. ft. 16.26% 17.84%

41
Lease Expiry Profile – Looking Forward
Year % of % of Rental Year % of % of Rental Year % of % of Rental
Property 2015 Total NLA Income/month 2016 Total NLA Income/month 2017 Total NLA Income/month
Menara Axis - - 0.02 91,514 1.30 2.84 22,073 0.31 1.08
Crystal Plaza 3,407 0.05 0.06 120,122 1.71 3.72 7,746 0.11 0.27
Axis Business Park 33,138 0.47 0.71 61,105 0.87 1.11 112,776 1.61 2.60
Infinite Centre 28,219 0.40 0.50 51,145 0.73 0.99 30,383 0.43 0.45
Wisma Kemajuan 68,095 0.97 1.09 116,119 1.66 2.12 9,583 0.14 0.25
Axis Vista - - - 40,937 0.58 0.70 77,080 1.10 1.22
Quattro West 10,991 0.16 0.26 61,474 0.88 2.03 8,073 0.12 0.24 Axis Technology Centre 129,237 1.84 1.91 62,675 0.89 0.97 34,020 0.49 0.38
Axis Eureka 160 0.00 0.01 15,235 0.22 0.50 54,259 0.77 1.55 Wisma Academy Parcel 128,099 1.83 1.93 49,760 0.71 0.98 50,741 0.72 1.04
Annex 2,354 0.03 0.01 45,400 0.65 0.50 - - -
Emerson Nilai - - - 291,642 4.16 1.61 - - -
Axis Steel Centre - - - - - - 366,839 5.23 3.49 Bayan Lepas Dist Centre - - - - - - 205,151 2.92 2.95
SPLC3 64,500 0.92 0.54 395,225 5.63 3.99 - - -
Fontera HQ - - - 600 0.01 0.01 - - -
BMW - - - - - - 161,474 2.30 2.31
Axis PDI Centre 58,009 0.83 5.14 - - - - - -
Axis Shah Alam DC 1 110,406 1.57 1.03 - - - - - -
FCI 136,619 1.95 0.98 - - - - - -
Delfi 130,743 1.86 1.03 - - - - - -
Axis Shah Alam DC 3 - 362,167 5.16 4.38 - -
903,977 12.89 15.24 1,765,120 25.16 26.46 1,140,198 16.26 17.84
42
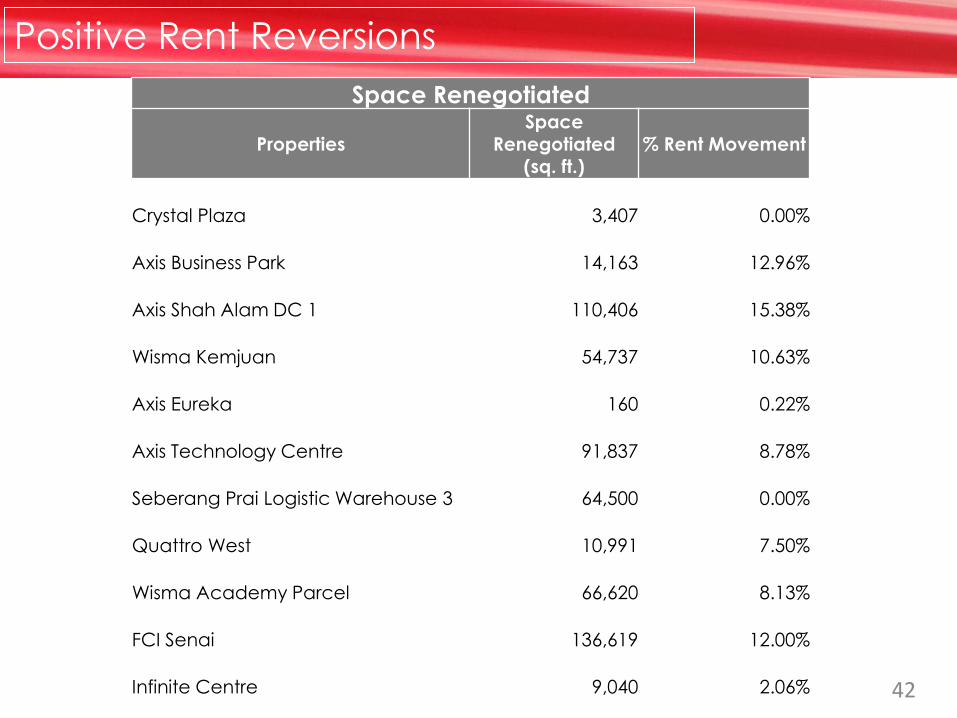
Positive Rent Reversions
Space Renegotiated
Properties Space
Renegotiated (sq. ft.)
% Rent Movement
Crystal Plaza 3,407 0.00%
Axis Business Park
14,163 12.96%
Axis Shah Alam DC 1
110,406 15.38%
Wisma Kemjuan
54,737 10.63%
Axis Eureka
160 0.22%
Axis Technology Centre 91,837 8.78%
Seberang Prai Logistic Warehouse 3
64,500 0.00%
Quattro West
10,991 7.50%
Wisma Academy Parcel 66,620 8.13%
FCI Senai 136,619 12.00%
Infinite Centre 9,040 2.06%
43
Income Growth – Leasing Profile
Successfully renegotiated 562,480 sq. ft. space out of 903,977 sq.
ft. space due for renewal in 2015, representing 62.2% tenant
retention.
Rental growth of 549,156 sq. ft. space achieved from pre-
negotiated rent step up in the leases.
The leases in the portfolio achieved positive rent reversion of
7.91% in Q3 2015.
The Manager also secured new tenancies for 78,833 sq. ft. space.

44
Weighted Average Lease Expiry (“WALE”)
The “WALE” for the portfolio is:
By Year Q3 2015 Q2 2015
By NLA 4.07 4.27
By Rental 4.05 4.25
45
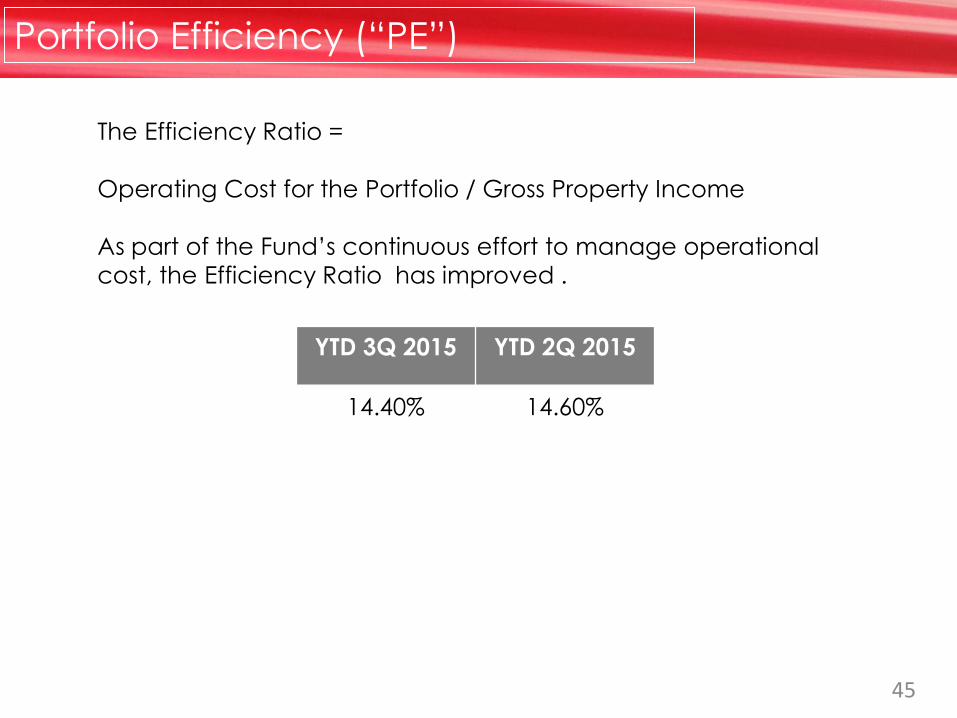
Portfolio Efficiency (“PE”)
The Efficiency Ratio =
Operating Cost for the Portfolio / Gross Property Income
As part of the Fund’s continuous effort to manage operational
cost, the Efficiency Ratio has improved .
YTD 3Q 2015 YTD 2Q 2015
14.40% 14.60%
46
Top 10 Tenants – Strong Rental Covenants
1. Konsortium Logistik Berhad
2. LF Logistics Services (M) Sdn Bhd
3. Yongnam Engineering Sdn Bhd
4. Schenker Logistics (M) Sdn Bhd
5. Tenaga Nasional Berhad
6. Tesco Stores (M) Sdn Bhd
7. Strateq Data Center Sdn Bhd
8. DHL Properties (M) Sdn Bhd
9. SR Technics Malaysia Sdn Bhd
10. BMW Asia Technology Centre Sdn Bhd
The top ten tenants account for 54.7% of the total revenue of
the Trust.

Q3 2015
Asset
Enhancement
Initiatives
47
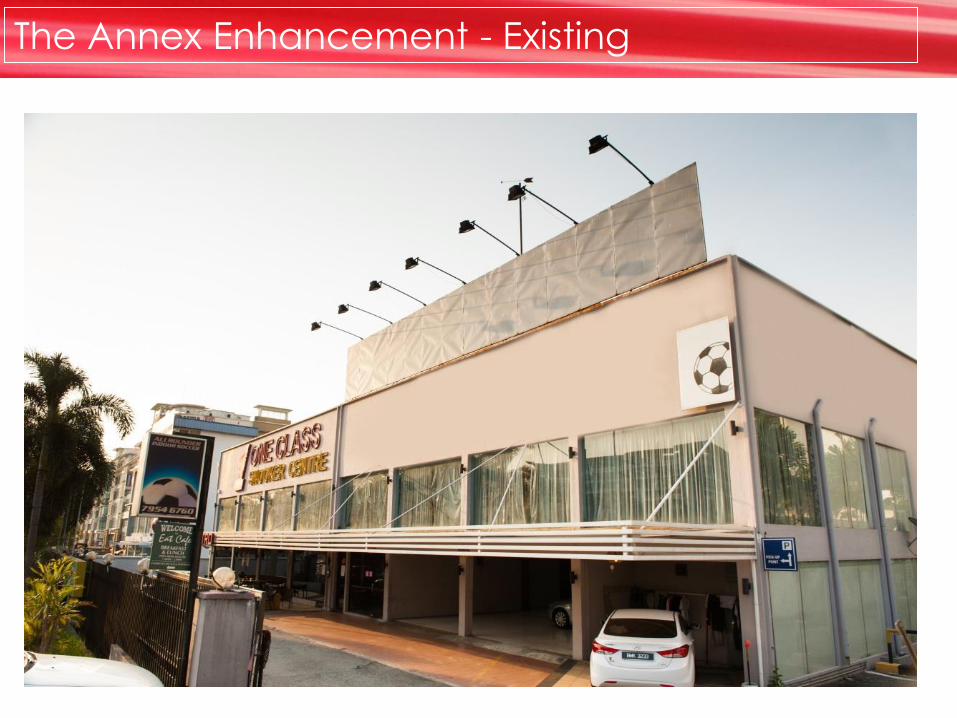
The Annex Enhancement - Existing
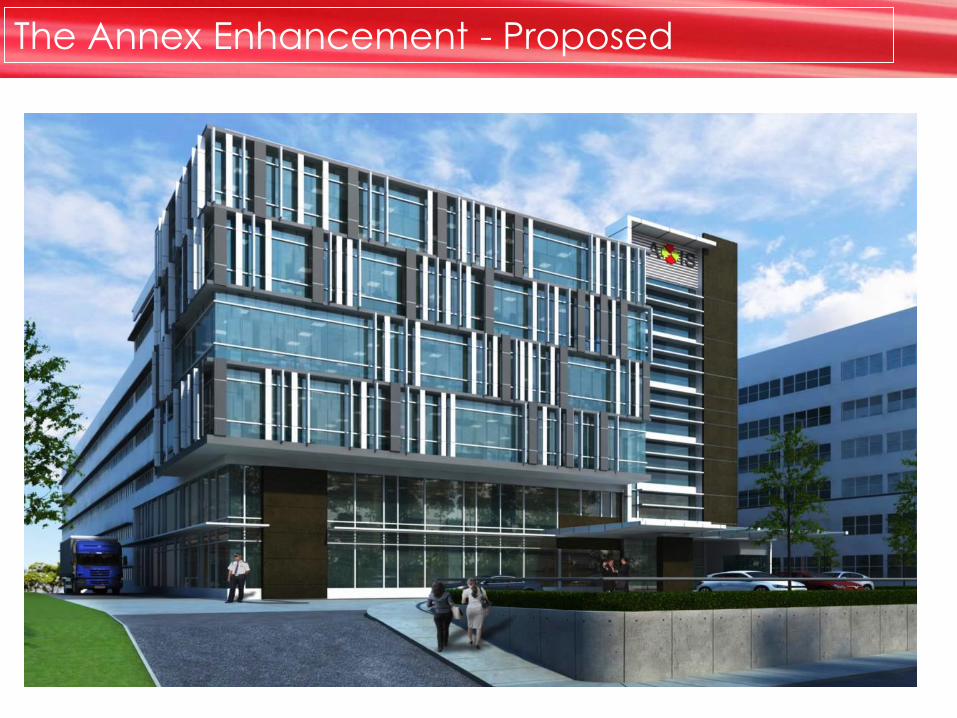
The Annex Enhancement - Proposed

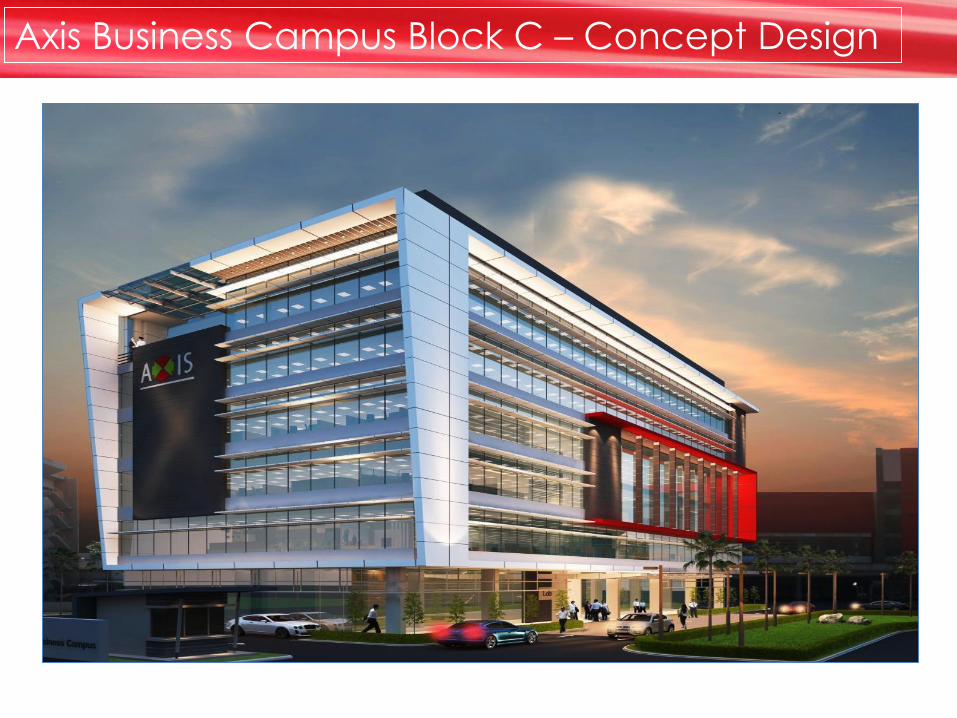
Axis Business Campus Block C Enhancement
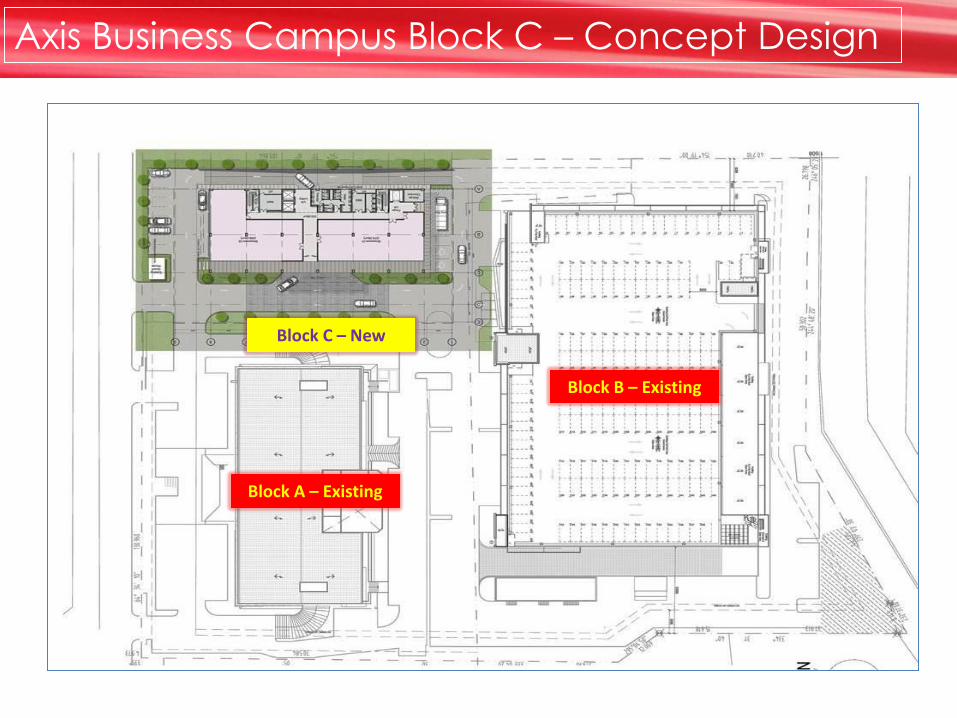
Axis Business Campus Block C – Concept Design
Block A – Existing
Block B – Existing
Block C – New
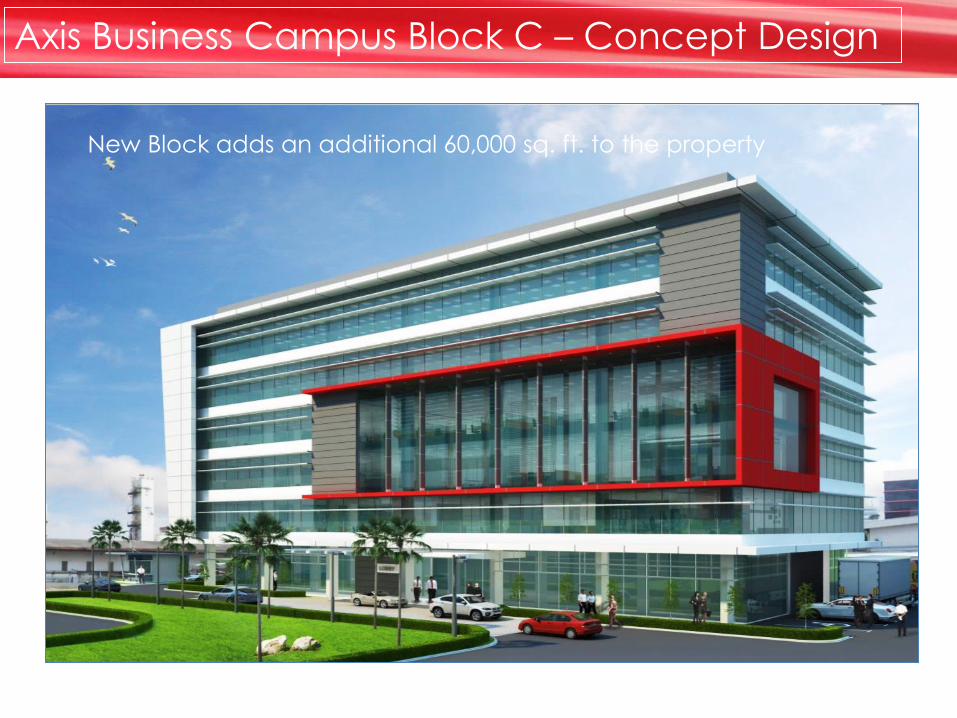
Axis Business Campus Block C – Concept Design
New Block adds an additional 60,000 sq. ft. to the property
Axis Business Campus Block C – Concept Design

Sustainability
Initiatives
54
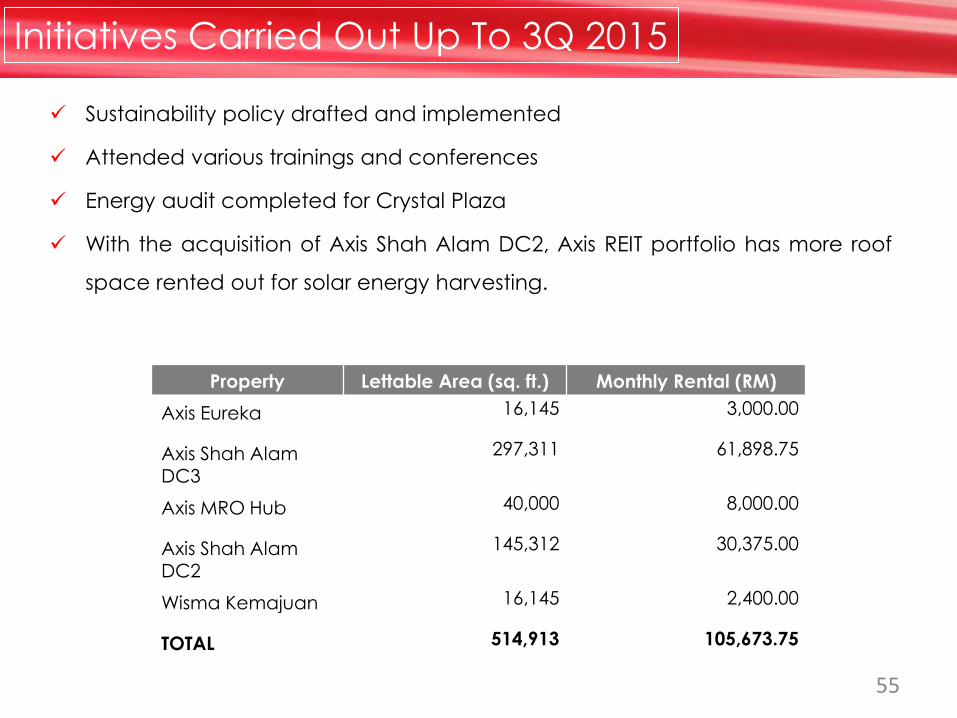
Sustainability policy drafted and implemented
Attended various trainings and conferences
Energy audit completed for Crystal Plaza
With the acquisition of Axis Shah Alam DC2, Axis REIT portfolio has more roof
space rented out for solar energy harvesting.
55
Initiatives Carried Out Up To 3Q 2015
Property Lettable Area (sq. ft.) Monthly Rental (RM)
Axis Eureka 16,145 3,000.00
Axis Shah Alam
DC3
297,311 61,898.75
Axis MRO Hub 40,000 8,000.00
Axis Shah Alam DC2
145,312 30,375.00
Wisma Kemajuan 16,145 2,400.00
TOTAL 514,913 105,673.75

3Q 2015
Business
Development
Report

57
Ongoing Acquisitions
Manufacturing Facility - Kulaijaya, Johor
Land Area : Approx. 10 acres
Land Tenure : Freehold
Occupancy : 100%
Purchase Price : RM61 million
WALE : 10 years

58
Ongoing Acquisitions
Logistics Warehouse – SiLC, Nusajaya, Johor
Land Area : Approx. 7 acres
Land Tenure : Freehold
Occupancy : 100%
Purchase Price : RM41 million
WALE : 7 years
59
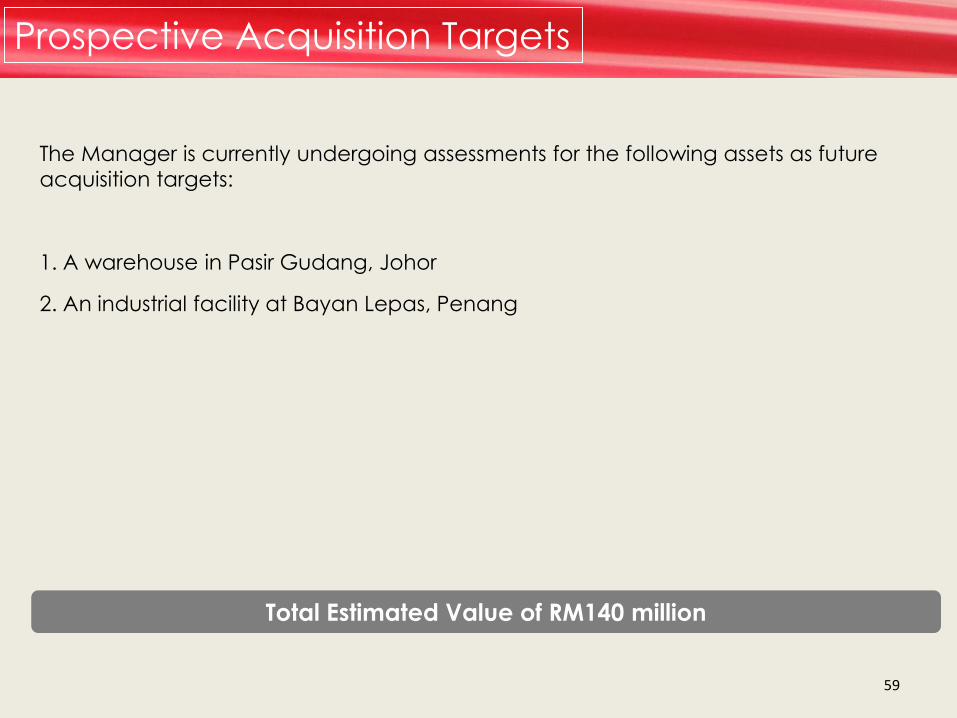
The Manager is currently undergoing assessments for the following assets as future
acquisition targets:
1. A warehouse in Pasir Gudang, Johor
2. An industrial facility at Bayan Lepas, Penang
Prospective Acquisition Targets
Total Estimated Value of RM140 million

3Q 2015
Investor
Relations
Report

2.85
3.09
3.38
3.50
3.37 3.31
3.55 3.54 3.62
3.69
3.55 3.62 3.58
3.69
3.53 3.62
3.53 3.45
3.34 3.27
3.22
1.61 1.69
1.00
1.50
2.00
2.50
3.00
3.50
4.00
Jan Feb Mar Apr May Jun Jul Aug Sep Oct Nov Dec Jan Feb Mar Apr May Jun Jul Aug Sep
Pre-Unit Split Price Post-Unit Split Price
61
Unit Price Performance YTD 2015
AXREIT: 1 Jan 2014 – 30 Sep 2015
Note:
2-for-1 Unit Split on 4 Sep 2015
from RM3.22 to RM1.61

62
Price & Volume Statistics
Source: Kenanga Online
AXREIT vs KLCI: 1 Jan 2013 – 30 Sep 2015
Unit Price Movement YTD 2015
3Q2015: Unit Price @ 30 Sep 2015 RM1.69
2Q2015: Unit Price @ 30 Jun 2015 RM3.45
Highest Price: 2015 YTD (February) RM3.69
Lowest Price: 2015 YTD (August) RM3.20
Note: 2-for-1 Unit Split on 4 Sep 2015
80%
90%
100%
110%
120%
130%
140%
KLCI AXREIT
63
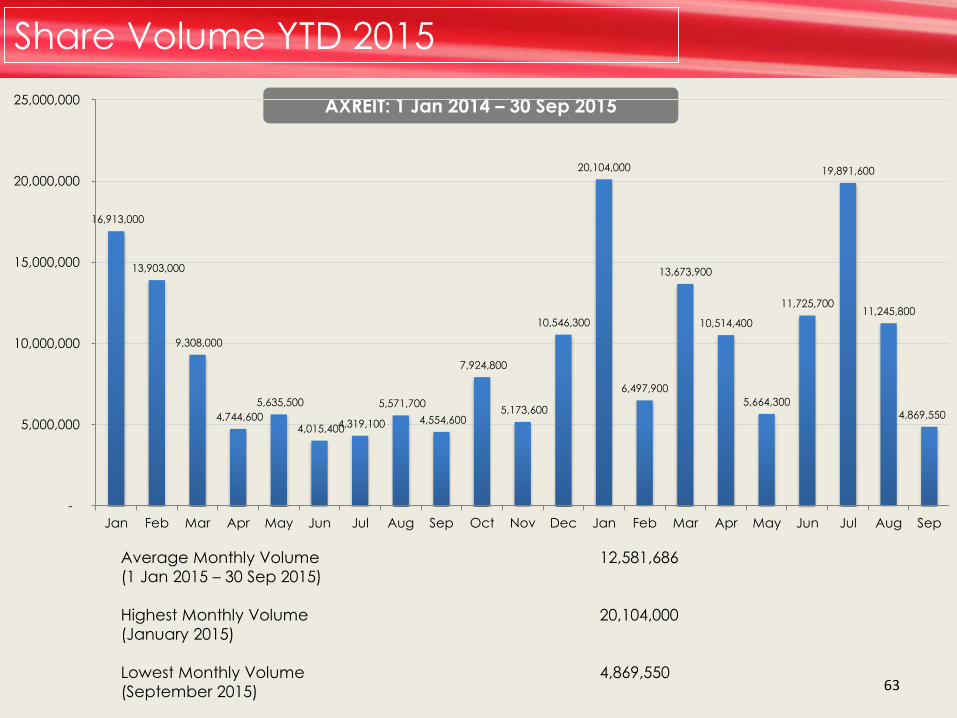
Average Monthly Volume 12,581,686
(1 Jan 2015 – 30 Sep 2015)
Highest Monthly Volume 20,104,000
(January 2015)
Lowest Monthly Volume 4,869,550
(September 2015)
Share Volume YTD 2015
AXREIT: 1 Jan 2014 – 30 Sep 2015
16,913,000
13,903,000
9,308,000
4,744,600
5,635,500
4,015,400 4,319,100
5,571,700
4,554,600
7,924,800
5,173,600
10,546,300
20,104,000
6,497,900
13,673,900
10,514,400
5,664,300
11,725,700
19,891,600
11,245,800
4,869,550
-
5,000,000
10,000,000
15,000,000
20,000,000
25,000,000
Jan Feb Mar Apr May Jun Jul Aug Sep Oct Nov Dec Jan Feb Mar Apr May Jun Jul Aug Sep
64
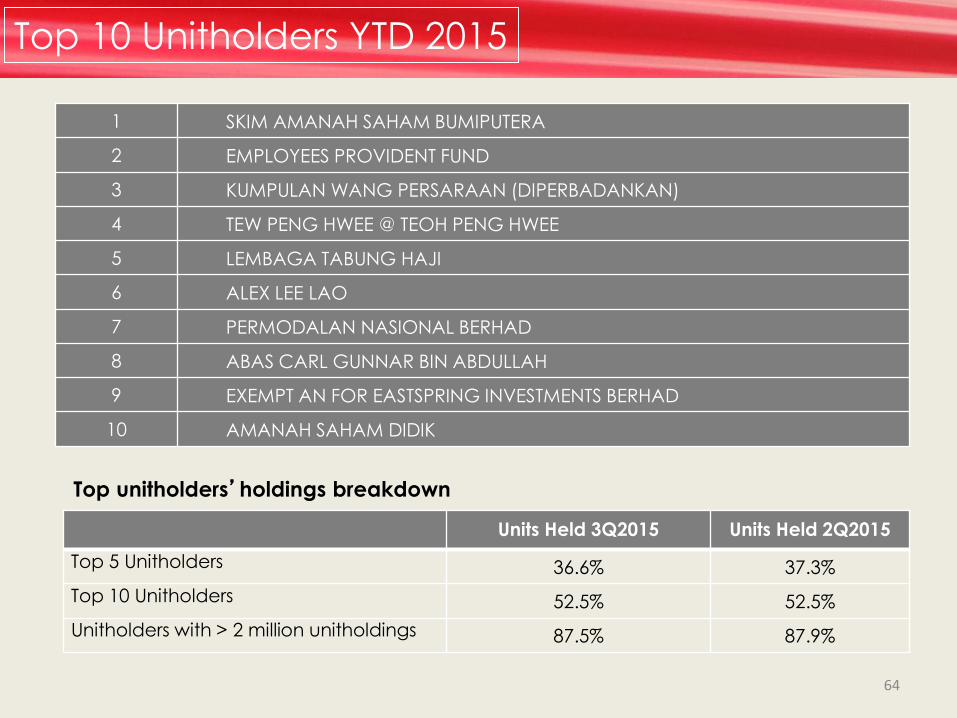
1 SKIM AMANAH SAHAM BUMIPUTERA
2 EMPLOYEES PROVIDENT FUND
3 KUMPULAN WANG PERSARAAN (DIPERBADANKAN)
4 TEW PENG HWEE @ TEOH PENG HWEE
5 LEMBAGA TABUNG HAJI
6 ALEX LEE LAO
7 PERMODALAN NASIONAL BERHAD
8 ABAS CARL GUNNAR BIN ABDULLAH
9 EXEMPT AN FOR EASTSPRING INVESTMENTS BERHAD
10 AMANAH SAHAM DIDIK
Top unitholders’holdings breakdown
Top 10 Unitholders YTD 2015
Units Held 3Q2015 Units Held 2Q2015
Top 5 Unitholders 36.6% 37.3%
Top 10 Unitholders 52.5% 52.5%
Unitholders with > 2 million unitholdings 87.5% 87.9%
65
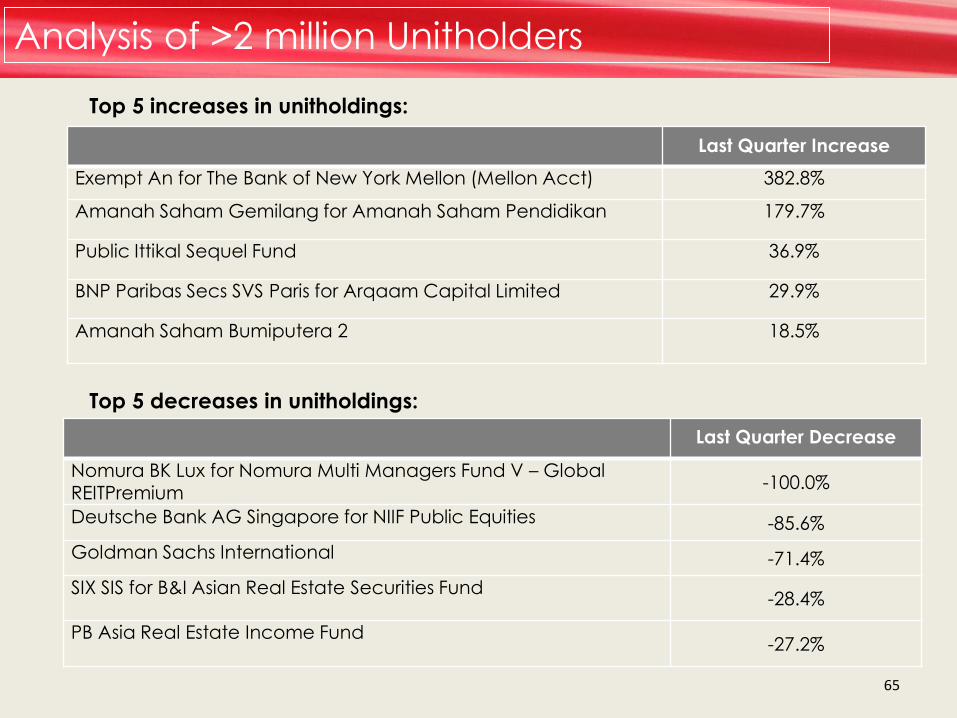
Analysis of >2 million Unitholders
Top 5 increases in unitholdings:
Top 5 decreases in unitholdings:
Last Quarter Increase
Exempt An for The Bank of New York Mellon (Mellon Acct) 382.8%
Amanah Saham Gemilang for Amanah Saham Pendidikan 179.7%
Public Ittikal Sequel Fund 36.9%
BNP Paribas Secs SVS Paris for Arqaam Capital Limited 29.9%
Amanah Saham Bumiputera 2 18.5%
Last Quarter Decrease
Nomura BK Lux for Nomura Multi Managers Fund V – Global
REITPremium -100.0%
Deutsche Bank AG Singapore for NIIF Public Equities -85.6%
Goldman Sachs International -71.4%
SIX SIS for B&I Asian Real Estate Securities Fund -28.4%
PB Asia Real Estate Income Fund -27.2%

66
Quarter-on-quarter, total number of CDS accounts increased by 90 to 3,309.
Investor Visibility and Liquidity YTD 2015
No. of CDS Accounts
Units Held 3Q2015 Units Held 2Q2015
Total foreign holdings 12.69% 13.53%
Foreign holdings – related-party 7.47% 7.47%
Foreign holdings – non-related-party 5.22% 6.07%
Promoters 13.77% 13.77%
1,652
2,080
2,420
2,702 2,850
3,009 3,176 3,200 3,219
3,309
-
500
1,000
1,500
2,000
2,500
3,000
3,500
2008 2009 2010 2011 2012 2013 2014 1Q2015 2Q2015 3Q2015
67
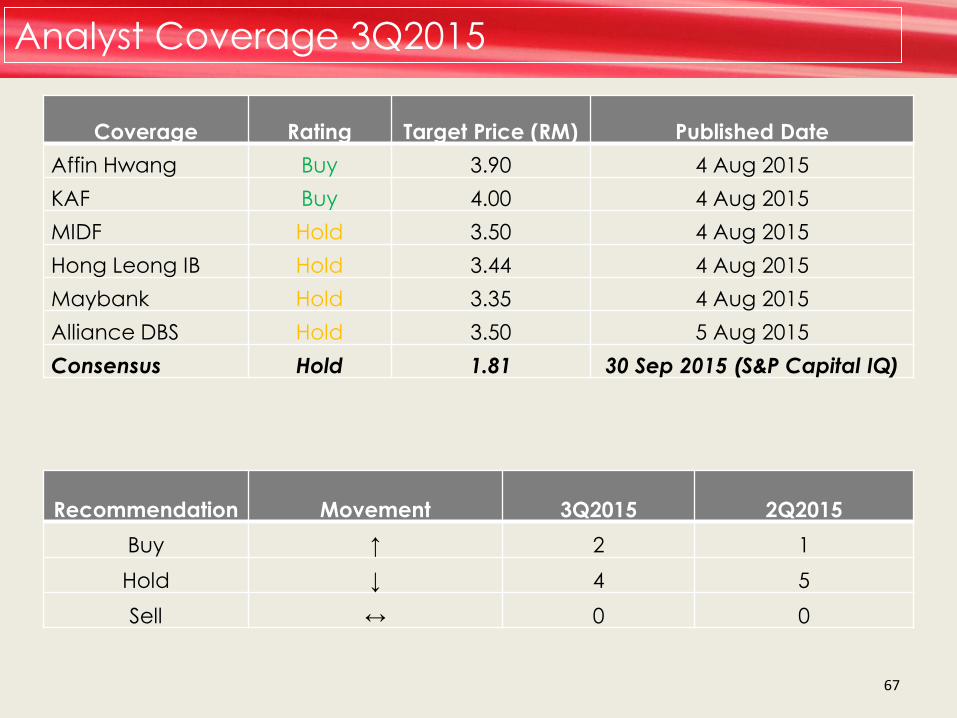
Analyst Coverage 3Q2015
Coverage Rating Target Price (RM) Published Date
Affin Hwang Buy 3.90 4 Aug 2015
KAF Buy 4.00 4 Aug 2015
MIDF Hold 3.50 4 Aug 2015
Hong Leong IB Hold 3.44 4 Aug 2015
Maybank Hold 3.35 4 Aug 2015
Alliance DBS Hold 3.50 5 Aug 2015
Consensus Hold 1.81 30 Sep 2015 (S&P Capital IQ)
Recommendation Movement 3Q2015 2Q2015
Buy ↑ 2 1
Hold ↓ 4 5
Sell ↔ 0 0

THANK
YOU
68