Embed Size (px)
Citation preview
CAGNY 2017
February 23, 2017
François-Xavier Roger
EVP, Chief Financial Officer
Disclaimer
This presentation contains forward looking statements
which reflect Management’s current views and estimates.
The forward looking statements involve certain risks and
uncertainties that could cause actual results to differ materially
from those contained in the forward looking statements.
Potential risks and uncertainties include such factors as general
economic conditions, foreign exchange fluctuations, competitive
product and pricing pressures and regulatory developments.
February 23, 2017 CAGNY 20172
Agenda
Overview Of Nestlé
Long-Term Value Creation
Structural Cost Saving Initiatives
Summary
February 23, 2017 CAGNY 20173
Agenda
Overview Of Nestlé
Long-Term Value Creation
Structural Cost Saving Initiatives
Summary
February 23, 2017 CAGNY 20174
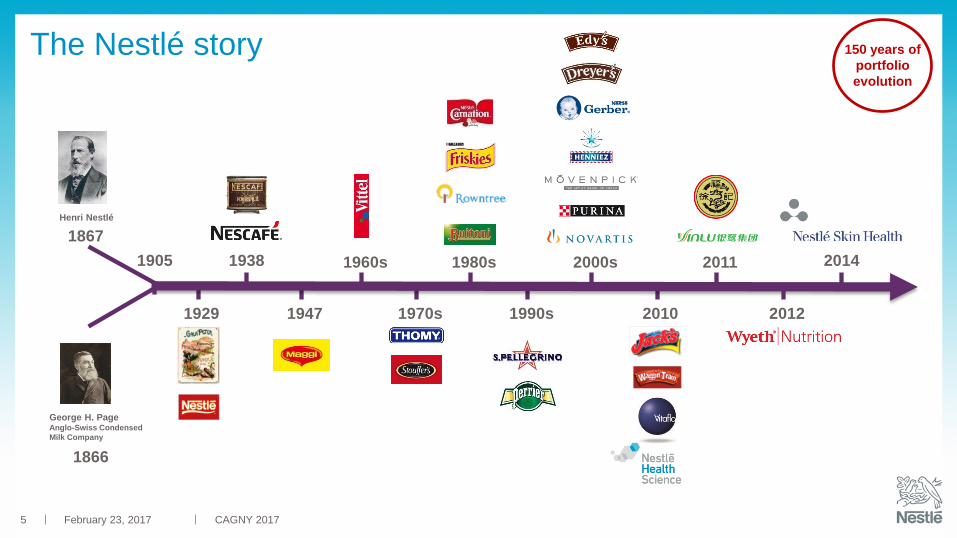
The Nestlé story
February 23, 2017
2011
201220101990s1970s19471929
2000s1960s 1980s
1867
Henri Nestlé
1905
1866
George H. PageAnglo-Swiss Condensed
Milk Company
20141938
CAGNY 2017
150 years of
portfolio
evolution
5
February 23, 2017
Illustrative
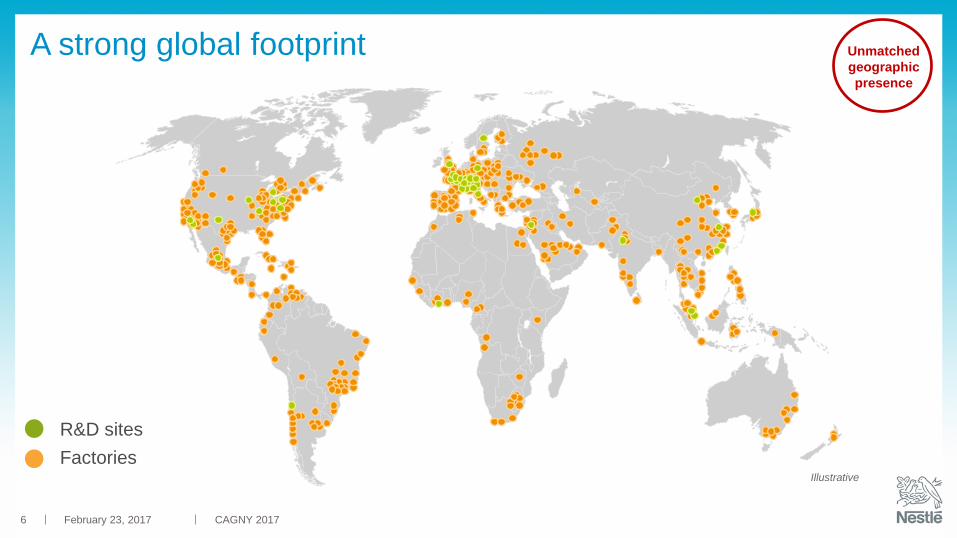
A strong global footprint
R&D sites
Factories
Unmatched
geographic
presence
CAGNY 20176
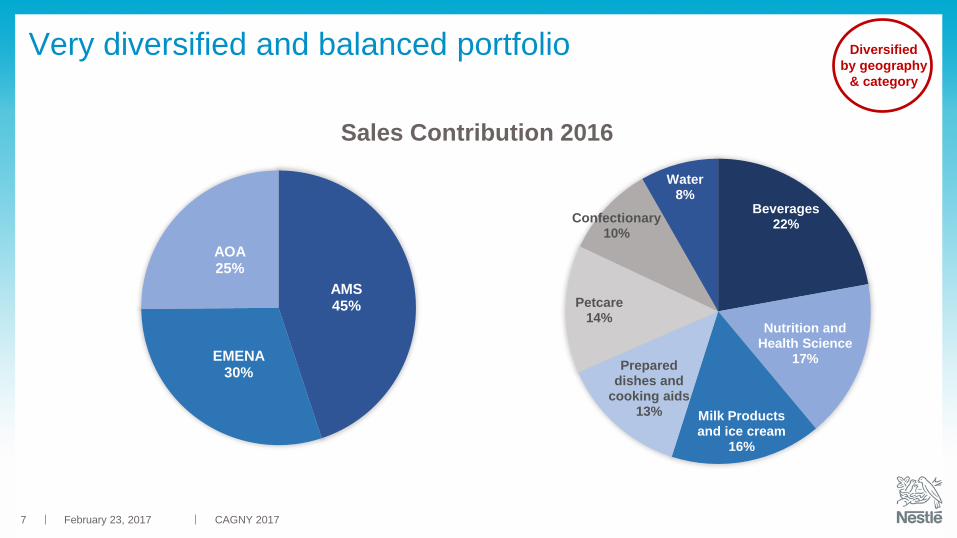
Very diversified and balanced portfolio
Beverages
Dairy & IC
Culinary
Nutrition &
Health Science
AMS
EMENA
AOA
CAGNY 2017
Diversified
by geography
& category
February 23, 2017
Sales Contribution 2016
AMS45%
EMENA30%
AOA25%
7
Beverages22%
Nutrition and Health Science
17%
Milk Products and ice cream
16%
Prepared dishes and
cooking aids13%
Petcare14%
Confectionary10%
Water8%
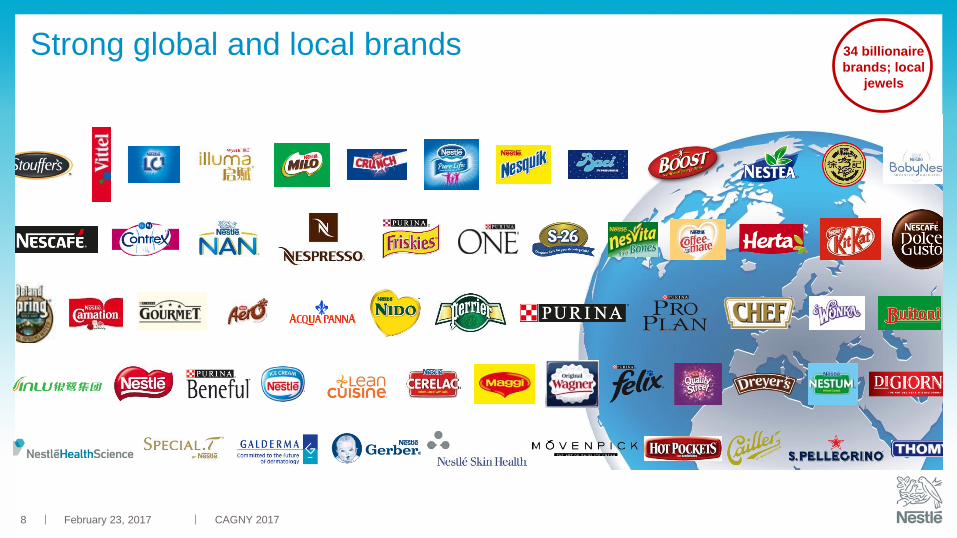
Strong global and local brands
February 23, 2017 CAGNY 2017
34 billionaire
brands; local
jewels
8
Agenda
Overview Of Nestlé
Long-Term Value Creation
Structural Cost Saving Initiatives
Summary
CAGNY 2017February 23, 20179
Commitment to long-term value creation
Nutrition Health and Wellness Strategy
Balanced top and bottom-line growth key to long-term value creation:
Invest selectively in fast-growing categories and regions
Address underperforming businesses
Portfolio management
Product and business model innovation; Embrace digital opportunities
Leverage existing efficiency culture; Execute structural savings projects
Continuous FCF improvement to support sustainable, growth-oriented dividend
Prudent approach to capital allocation, including M&A
February 23, 2017 CAGNY 2017
Balanced
top and
bottom line
growth
10
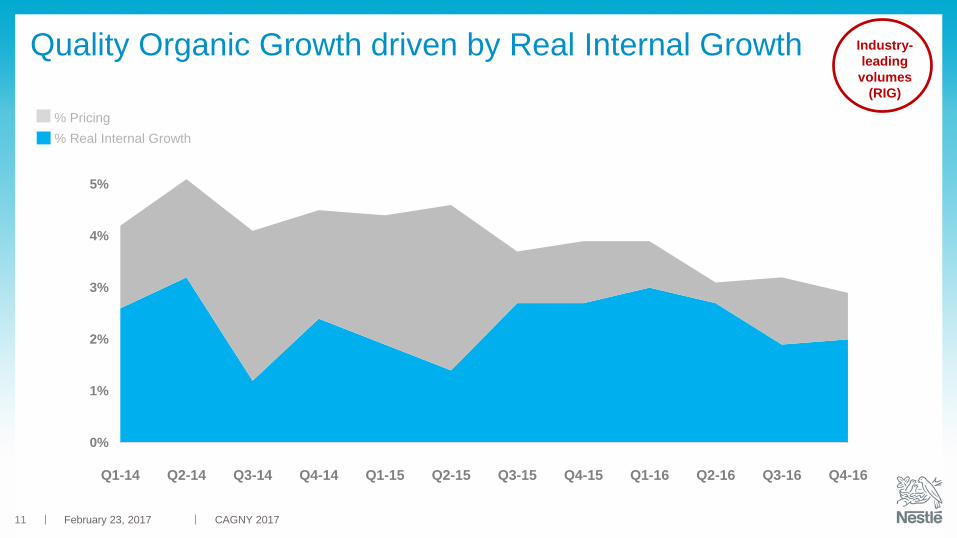
0%
1%
2%
3%
4%
5%
Q1-14 Q2-14 Q3-14 Q4-14 Q1-15 Q2-15 Q3-15 Q4-15 Q1-16 Q2-16 Q3-16 Q4-16
February 23, 2017 CAGNY 2017
Quality Organic Growth driven by Real Internal Growth
% Pricing
% Real Internal Growth
Industry-
leading
volumes
(RIG)
11
February 23, 2017 CAGNY 2017
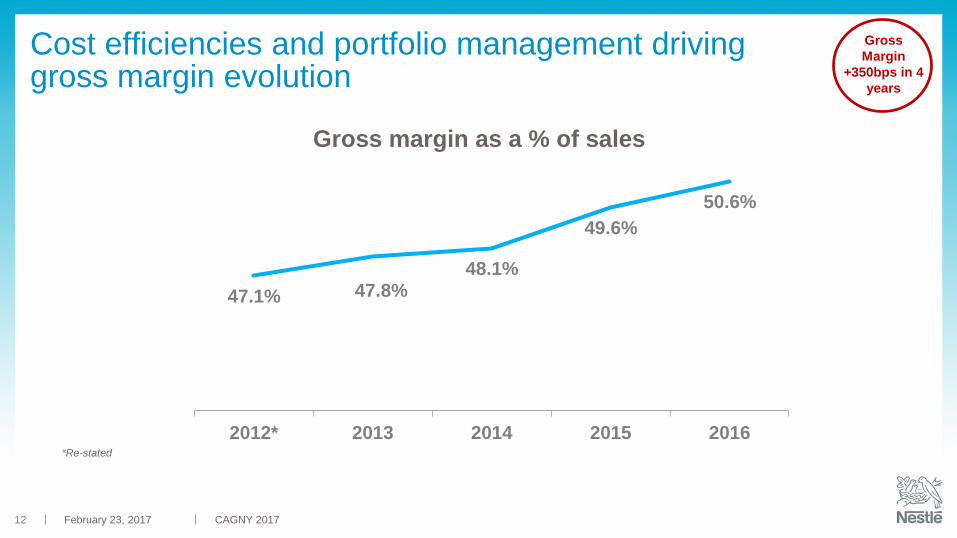
Cost efficiencies and portfolio management drivinggross margin evolution
47.1% 47.8%48.1%
49.6%
50.6%
42.0%
44.0%
46.0%
48.0%
50.0%
52.0%
2012* 2013 2014 2015 2016*Re-stated
Gross
Margin
+350bps in 4
years
Gross margin as a % of sales
12
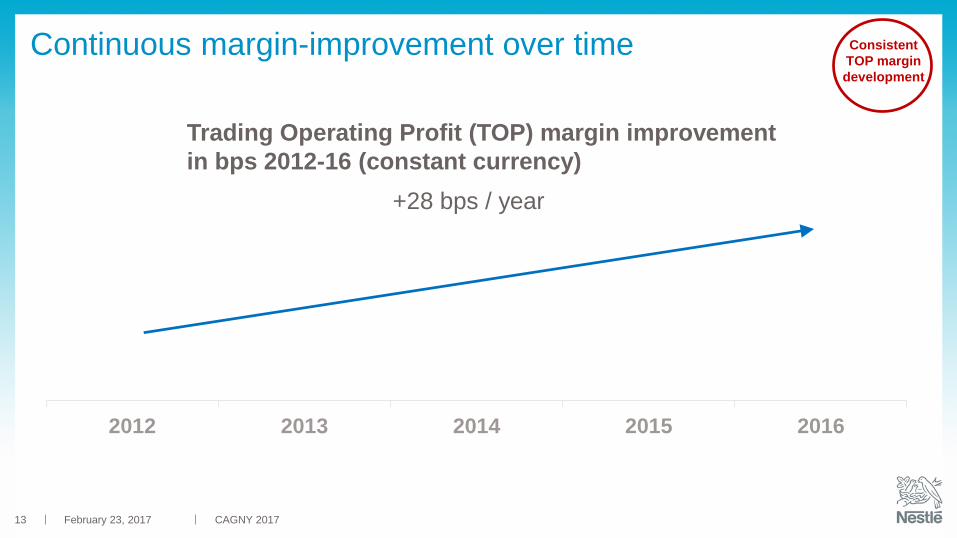
Continuous margin-improvement over time
0
0
0
0
0
1
1
1
1
1
1
2012 2013 2014 2015 2016
+28 bps / year
Consistent
TOP margin
development
February 23, 2017 CAGNY 2017
Trading Operating Profit (TOP) margin improvement
in bps 2012-16 (constant currency)
13
February 23, 2017 CAGNY 2017
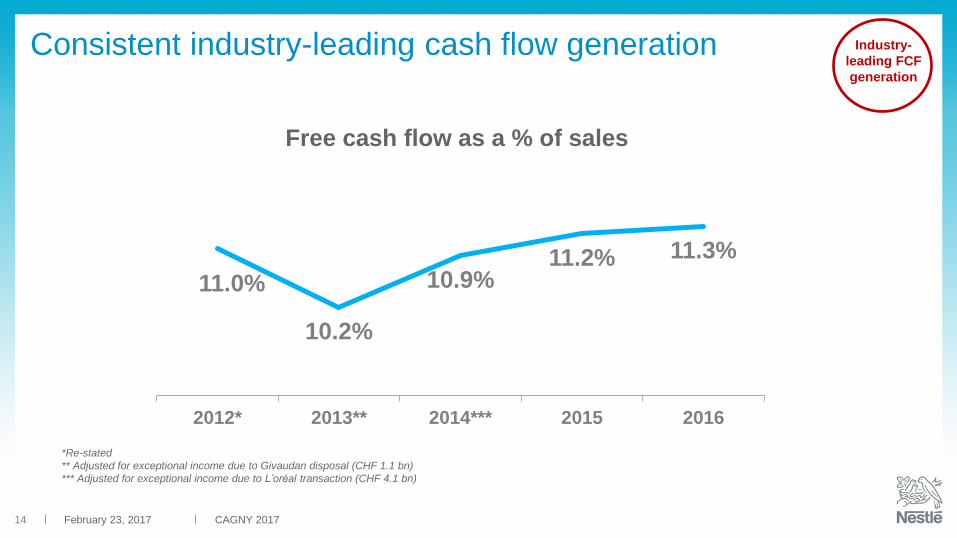
Consistent industry-leading cash flow generation
*Re-stated
** Adjusted for exceptional income due to Givaudan disposal (CHF 1.1 bn)
*** Adjusted for exceptional income due to L’oréal transaction (CHF 4.1 bn)
Free cash flow as a % of sales
11.0%
10.2%
10.9%11.2% 11.3%
9.0%
9.5%
10.0%
10.5%
11.0%
11.5%
12.0%
12.5%
13.0%
2012* 2013** 2014*** 2015 2016
Industry-
leading FCF
generation
14
February 23, 2017
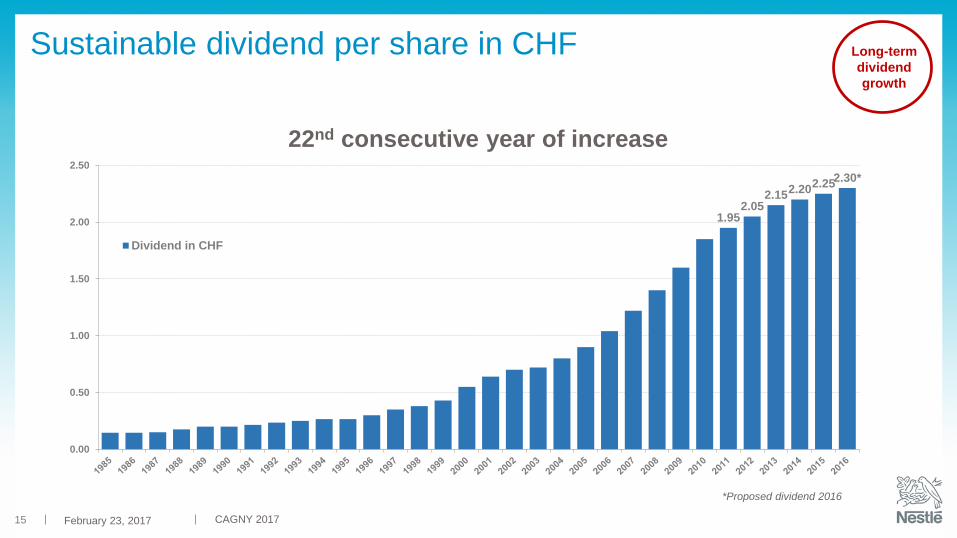
Sustainable dividend per share in CHF Long-term
dividend
growth
CAGNY 2017
22nd consecutive year of increase
15
1.952.05
2.152.20
2.252.30*
0.00
0.50
1.00
1.50
2.00
2.50
Dividend in CHF
*Proposed dividend 2016
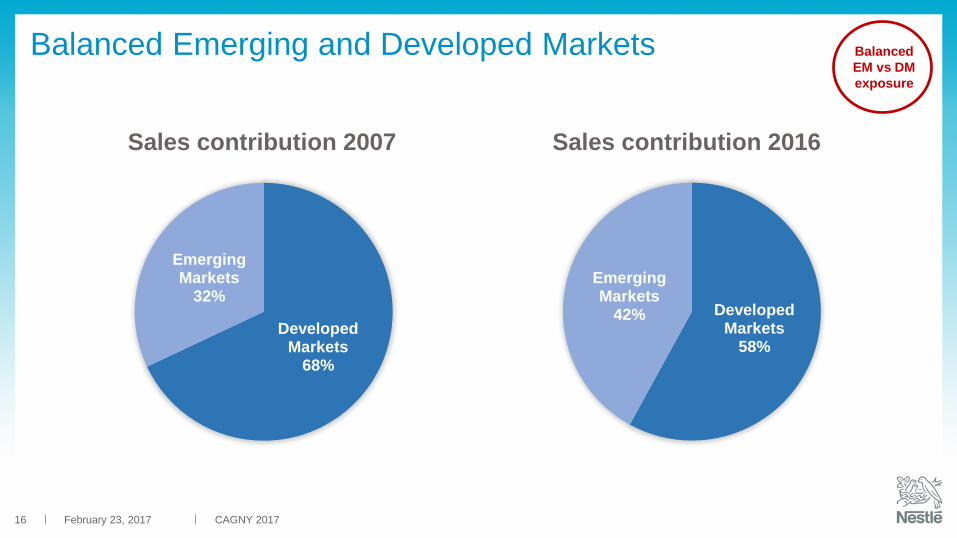
Balanced Emerging and Developed Markets
February 23, 2017 CAGNY 2017
Balanced
EM vs DM
exposure
Sales contribution 2007 Sales contribution 2016
Developed Markets
68%
Emerging Markets
32%Developed
Markets58%
Emerging Markets
42%
16
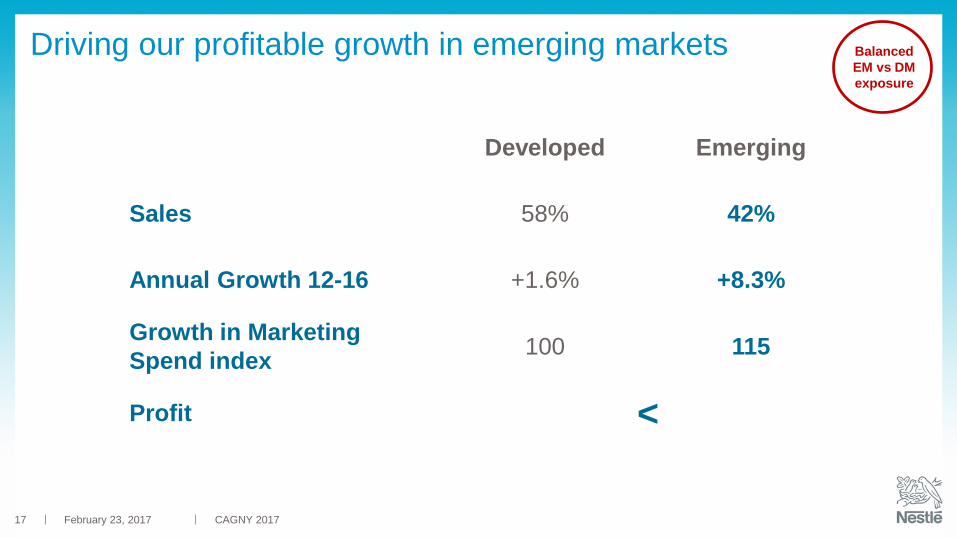
Driving our profitable growth in emerging markets
Developed Emerging
Sales 58% 42%
Annual Growth 12-16 +1.6% +8.3%
Growth in Marketing
Spend index100 115
Profit <
Balanced
EM vs DM
exposure
February 23, 2017 CAGNY 201717
February 23, 2017 CAGNY 2017
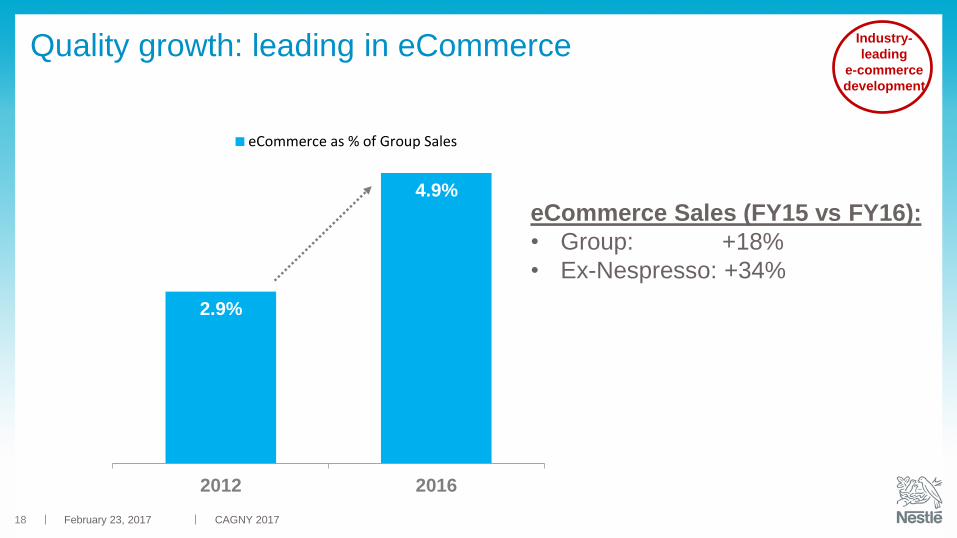
Quality growth: leading in eCommerce
2.9%
4.9%
0.0%
2012 2016
eCommerce as % of Group Sales
eCommerce Sales (FY15 vs FY16):
• Group: +18%
• Ex-Nespresso: +34%
Industry-
leading
e-commerce
development
18
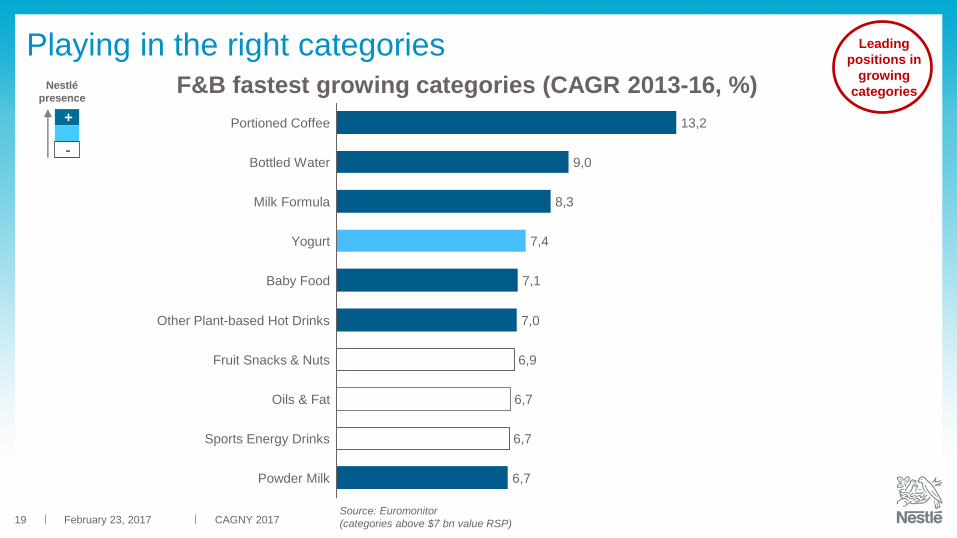
Playing in the right categories
F&B fastest growing categories (CAGR 2013-16, %)Nestlé
presence
+
-
7,4
Milk Formula 8,3
Bottled Water 9,0
Portioned Coffee 13,2
Powder Milk 6,7
Sports Energy Drinks 6,7
Oils & Fat 6,7
Fruit Snacks & Nuts 6,9
Other Plant-based Hot Drinks 7,0
Baby Food 7,1
Yogurt
Leading
positions in
growing
categories
February 23, 2017 CAGNY 2017Source: Euromonitor
(categories above $7 bn value RSP)19
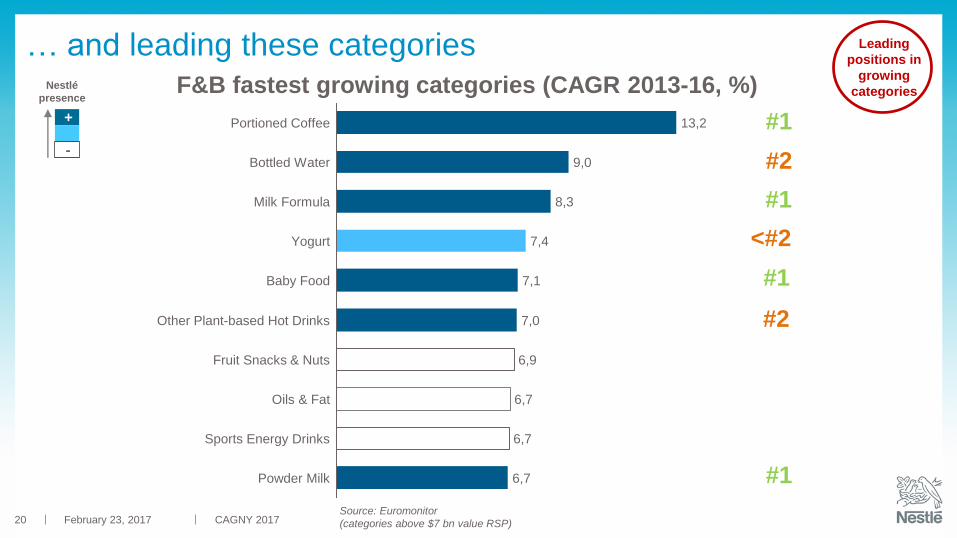
F&B fastest growing categories (CAGR 2013-16, %)Nestlé
presence
+
-#2
#1
<#2
#1
Source: Euromonitor
(categories above $7 bn value RSP)
#1
#1
#2
7,4
Milk Formula 8,3
Bottled Water 9,0
Portioned Coffee 13,2
Powder Milk 6,7
Sports Energy Drinks 6,7
Oils & Fat 6,7
Fruit Snacks & Nuts 6,9
Other Plant-based Hot Drinks 7,0
Baby Food 7,1
Yogurt
Leading
positions in
growing
categories
… and leading these categories
February 23, 2017 CAGNY 201720
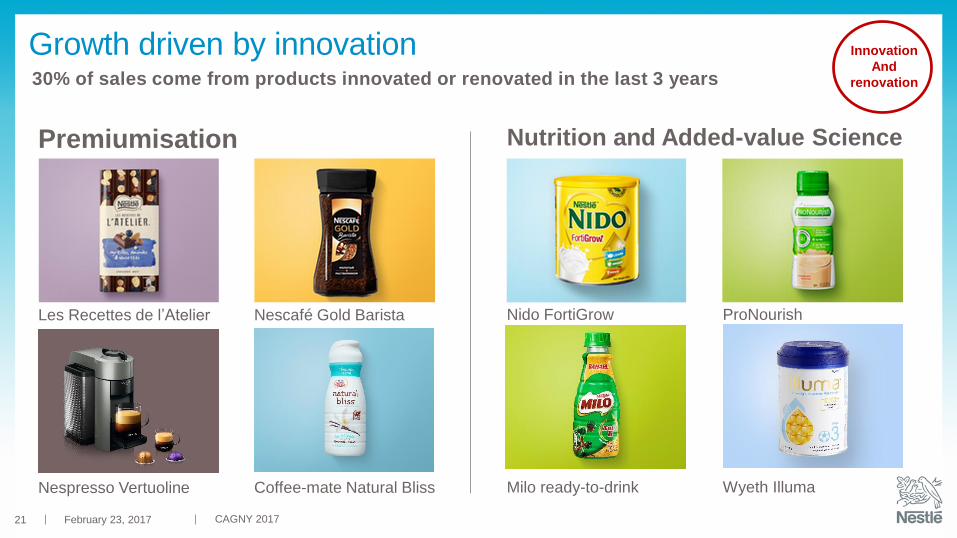
30% of sales come from products innovated or renovated in the last 3 years
Premiumisation
Les Recettes de l’Atelier
Nutrition and Added-value Science
Nescafé Gold Barista
Nespresso Vertuoline Coffee-mate Natural Bliss
Nido FortiGrow ProNourish
Milo ready-to-drink Wyeth Illuma
Innovation
And
renovation
Growth driven by innovation
February 23, 2017 CAGNY 201721
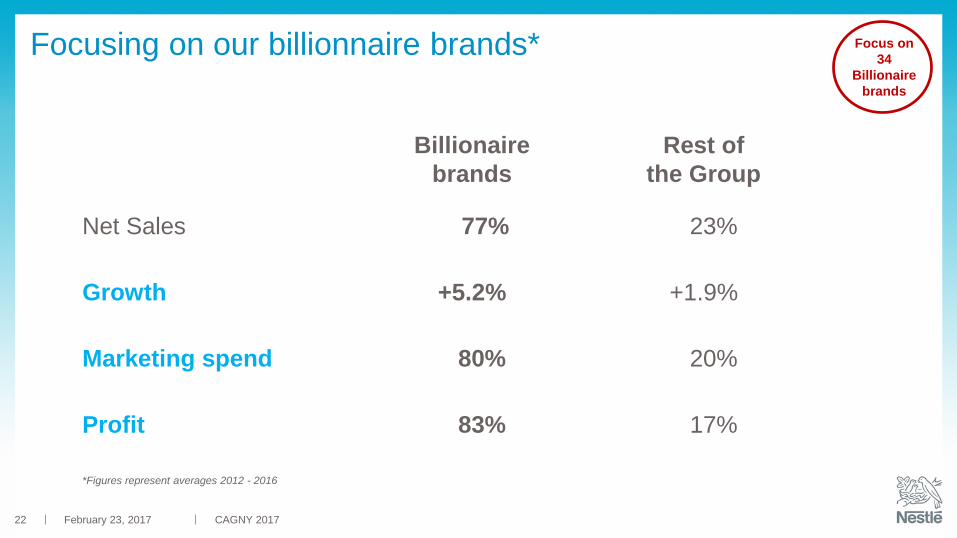
Focusing on our billionnaire brands*
Billionaire
brands
Rest of
the Group
Net Sales 77% 23%
Growth +5.2% +1.9%
Marketing spend 80% 20%
Profit 83% 17%
*Figures represent averages 2012 - 2016
Focus on
34
Billionaire
brands
February 23, 2017 CAGNY 201722
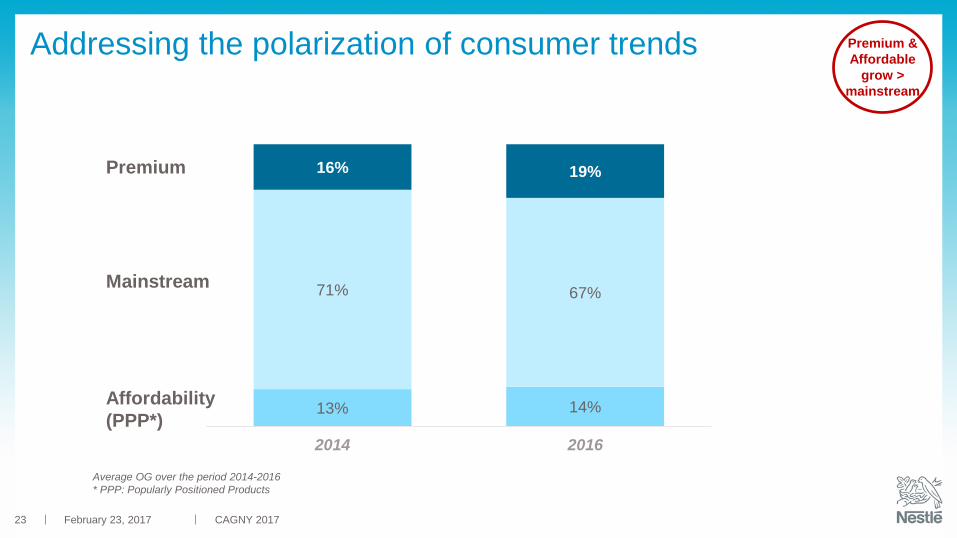
Addressing the polarization of consumer trends
13% 14%
71% 67%
16% 19%
2014 2016
Mainstream
Premium
Affordability
(PPP*)
Average OG over the period 2014-2016
* PPP: Popularly Positioned Products
CAGNY 2017
Premium &
Affordable
grow >
mainstream
February 23, 201723
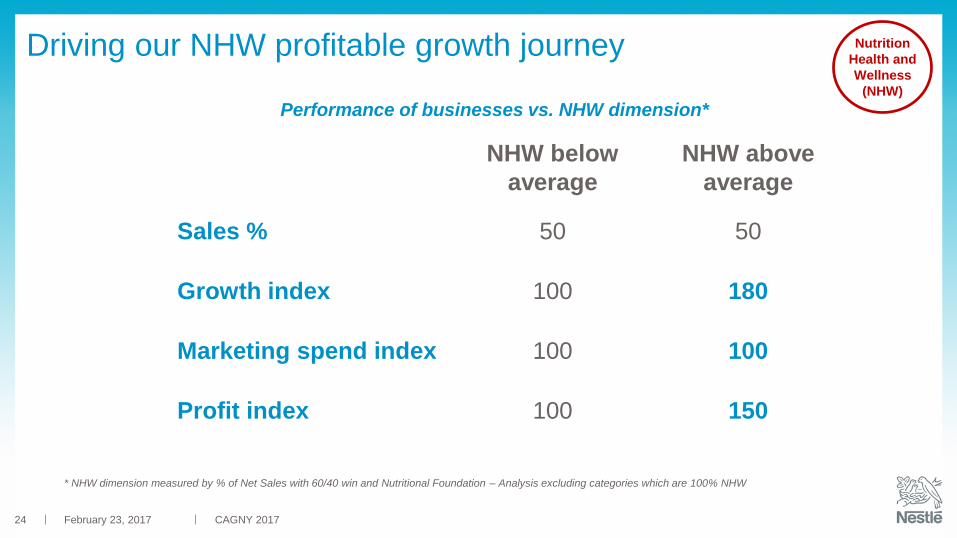
Driving our NHW profitable growth journey
Performance of businesses vs. NHW dimension*
* NHW dimension measured by % of Net Sales with 60/40 win and Nutritional Foundation – Analysis excluding categories which are 100% NHW
NHW below
average
NHW above
average
Sales % 50 50
Growth index 100 180
Marketing spend index 100 100
Profit index 100 150
Nutrition
Health and
Wellness
(NHW)
February 23, 2017 CAGNY 201724
Agenda
Overview Of Nestlé
Long-Term Value Creation
Structural Cost Saving Initiatives
Summary
CAGNY 2017February 23, 201725
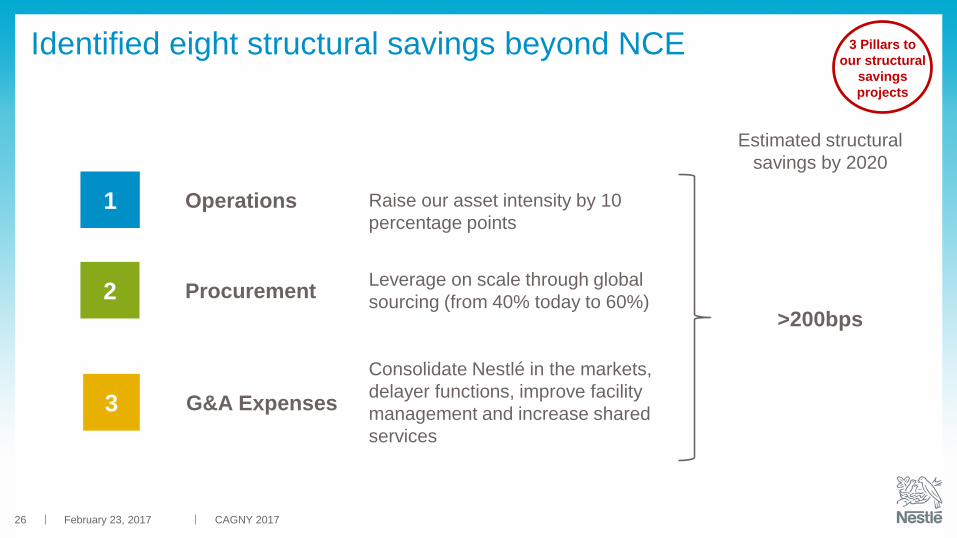
Identified eight structural savings beyond NCE
Estimated structural
savings by 2020
1 Operations Raise our asset intensity by 10
percentage points
2 ProcurementLeverage on scale through global
sourcing (from 40% today to 60%)
3 G&A Expenses
Consolidate Nestlé in the markets,
delayer functions, improve facility
management and increase shared
services
>200bps
3 Pillars to
our structural
savings
projects
February 23, 2017 CAGNY 201726
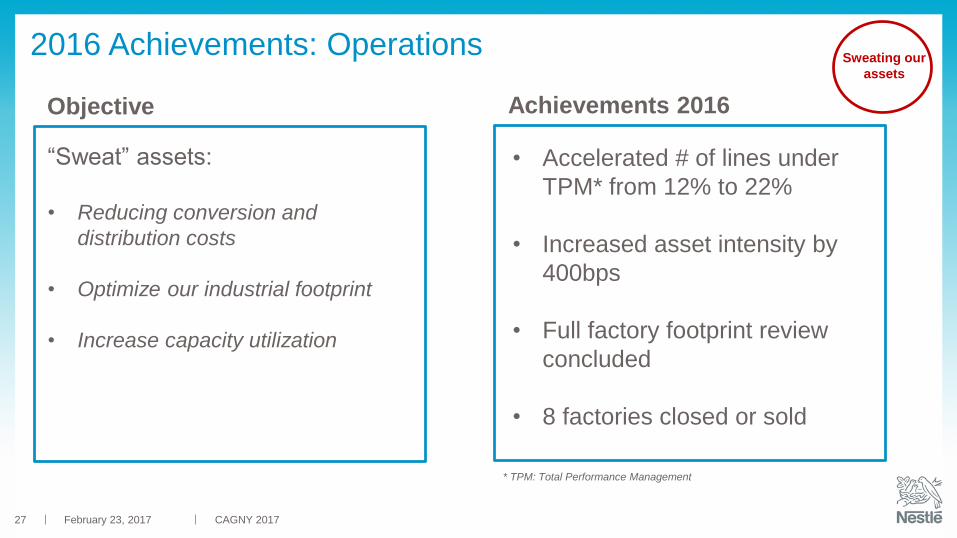
2016 Achievements: Operations
Objective
• Accelerated # of lines under
TPM* from 12% to 22%
• Increased asset intensity by
400bps
• Full factory footprint review
concluded
• 8 factories closed or sold
Achievements 2016
“Sweat” assets:
• Reducing conversion and
distribution costs
• Optimize our industrial footprint
• Increase capacity utilization
* TPM: Total Performance Management
Sweating our
assets
February 23, 2017 CAGNY 201727
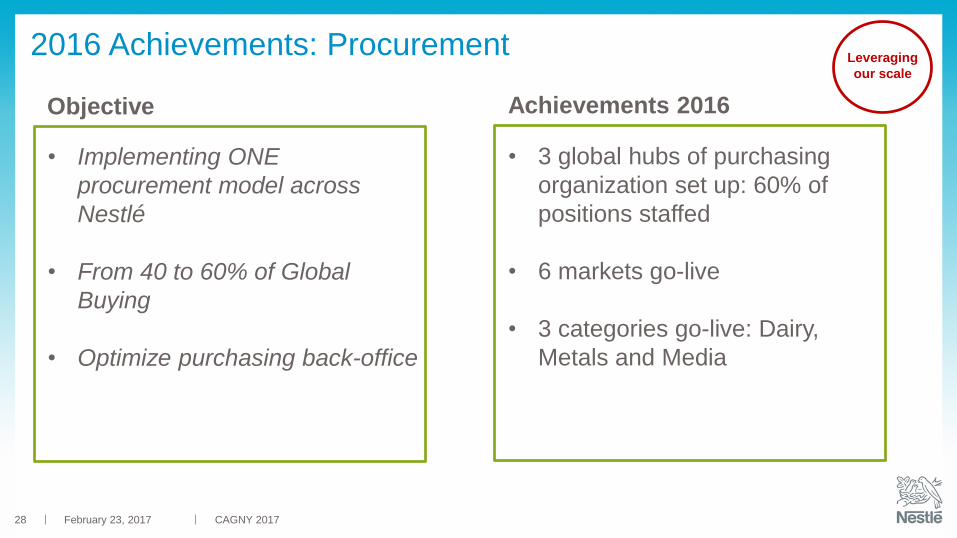
2016 Achievements: Procurement
Objective Achievements 2016
• 3 global hubs of purchasing
organization set up: 60% of
positions staffed
• 6 markets go-live
• 3 categories go-live: Dairy,
Metals and Media
• Implementing ONE
procurement model across
Nestlé
• From 40 to 60% of Global
Buying
• Optimize purchasing back-office
Leveraging
our scale
February 23, 2017 CAGNY 201728
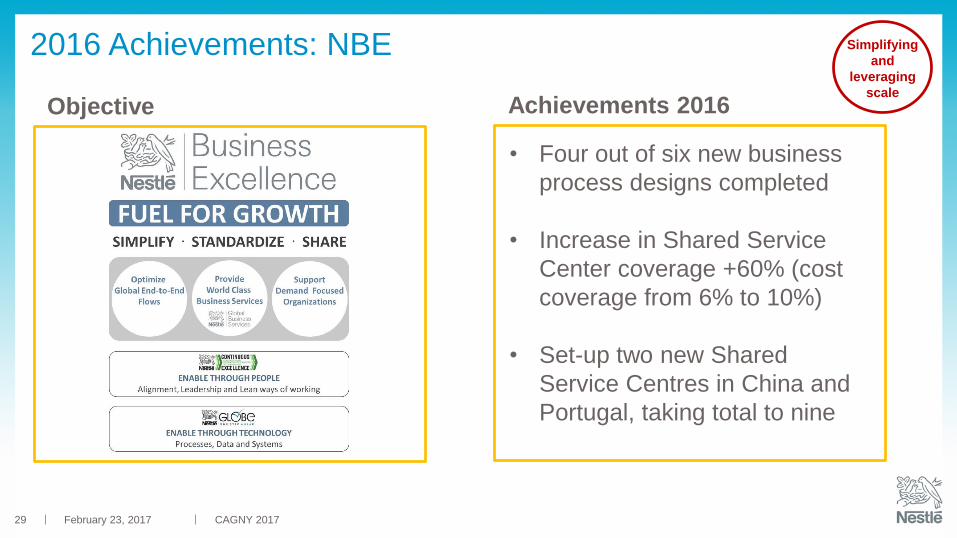
2016 Achievements: NBE
Objective Achievements 2016
• Four out of six new business
process designs completed
• Increase in Shared Service
Center coverage +60% (cost
coverage from 6% to 10%)
• Set-up two new Shared
Service Centres in China and
Portugal, taking total to nine
Simplifying
and
leveraging
scale
February 23, 2017 CAGNY 201729
2016 Achievements: Site Optimization
Objective Achievements 2016
• Announced consolidation of
Nestlé USA HQ and support
functions in East Coast and
Ohio
• Commenced restructuring of
US sales-force
• Commenced site optimization
process at Group HQ in Vevey
• Consolidate Nestlé in the
markets
• Improve facility management
• De-layer functions
Site
optimization
commenced
in USA
February 23, 2017 CAGNY 201730
Agenda
Overview Of Nestlé
Long-Term Value Creation
Structural Cost Saving Initiatives
Summary
CAGNY 2017February 23, 201731
February 23, 2017 CAGNY 2017
Summary
Long-Term value creation through balance of top and bottom line growth
Increased cost discipline and progress structural saving initiatives
Continuous FCF improvement to support sustainable, growth-oriented dividend
Prudent approach to capital allocation, including M&A
Manage change, faster decision-making and execution
32
Thank you !
February 23, 2017 CAGNY 201733