Embed Size (px)
Citation preview
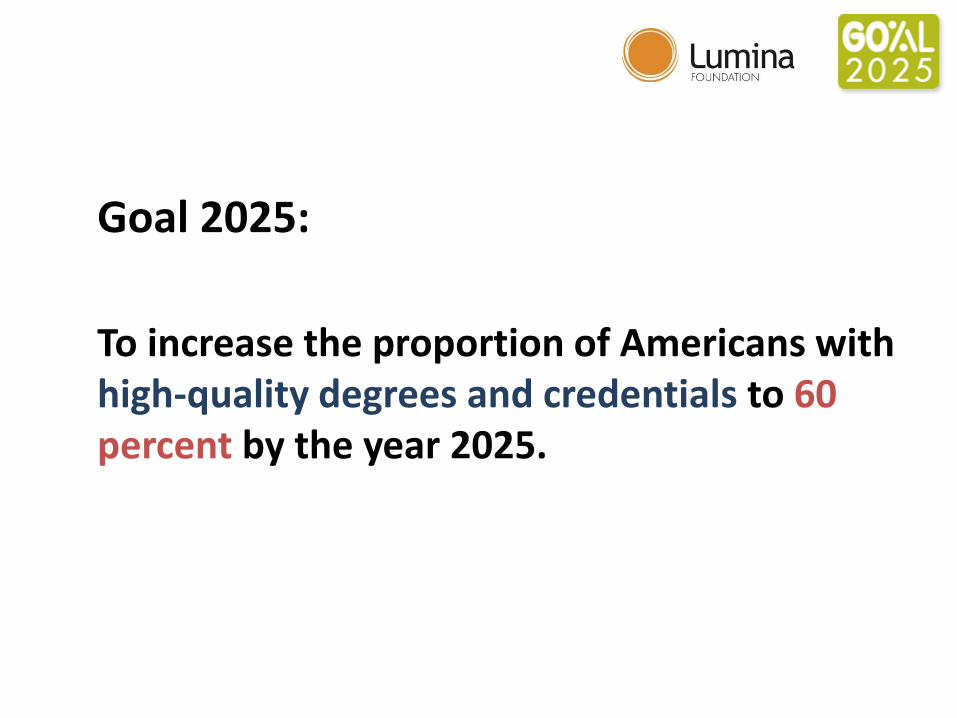
Goal 2025:
To increase the proportion of Americans with high-quality degrees and credentials to 60 percent by the year 2025.
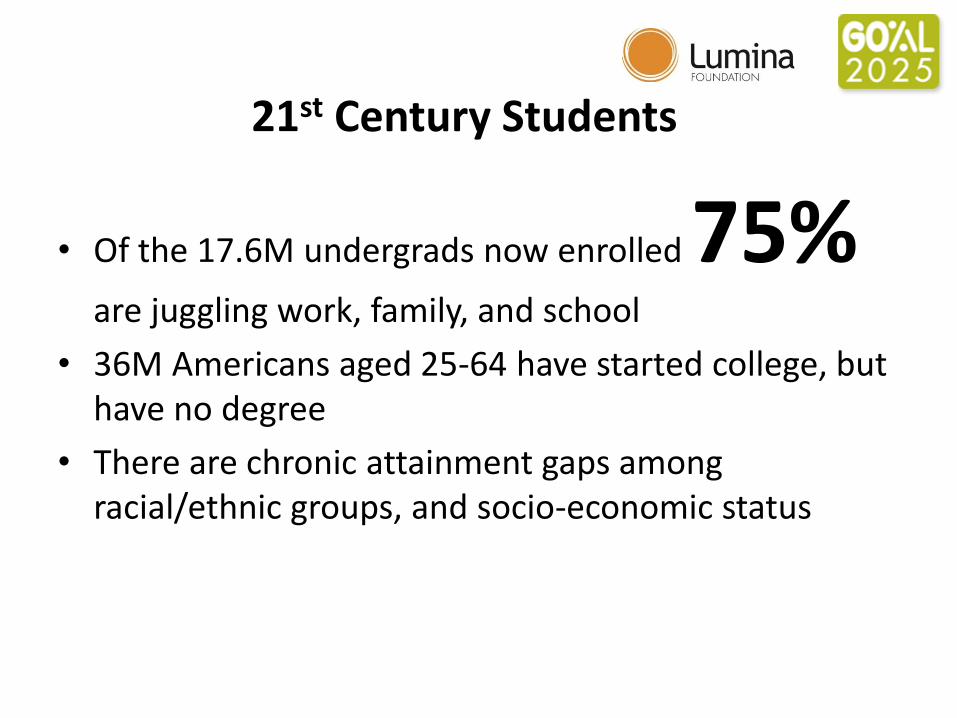
21st Century Students
• Of the 17.6M undergrads now enrolled 75% are juggling work, family, and school
• 36M Americans aged 25-64 have started college, but have no degree
• There are chronic attainment gaps among racial/ethnic groups, and socio-economic status
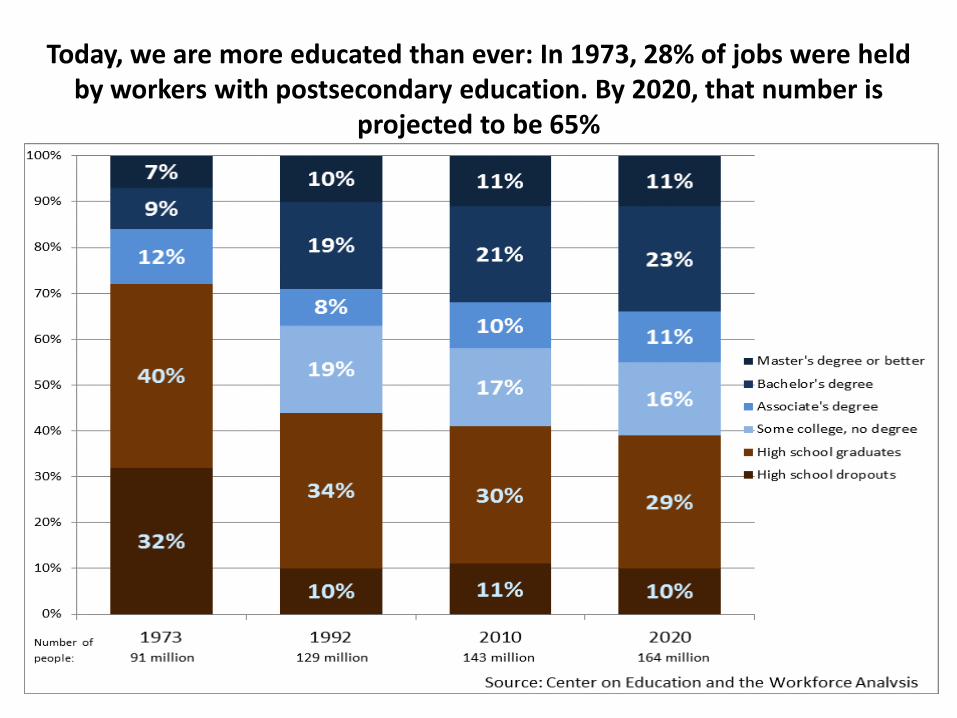
Today, we are more educated than ever: In 1973, 28% of jobs were held by workers with postsecondary education. By 2020, that number is
projected to be 65%
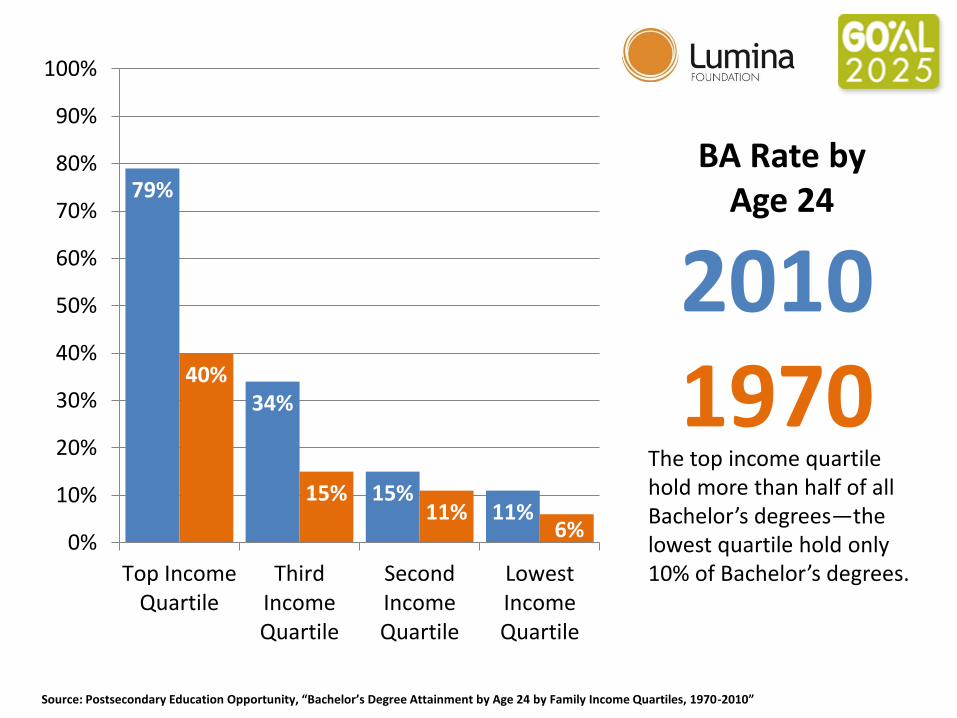
BA Rate by Age 24
2010 1970
The top income quartile hold more than half of all Bachelor’s degrees—the lowest quartile hold only 10% of Bachelor’s degrees.
79%
34%
15% 11%
40%
15% 11%
6% 0%
10%
20%
30%
40%
50%
60%
70%
80%
90%
100%
Top IncomeQuartile
ThirdIncomeQuartile
SecondIncomeQuartile
LowestIncomeQuartile
Source: Postsecondary Education Opportunity, “Bachelor’s Degree Attainment by Age 24 by Family Income Quartiles, 1970-2010”
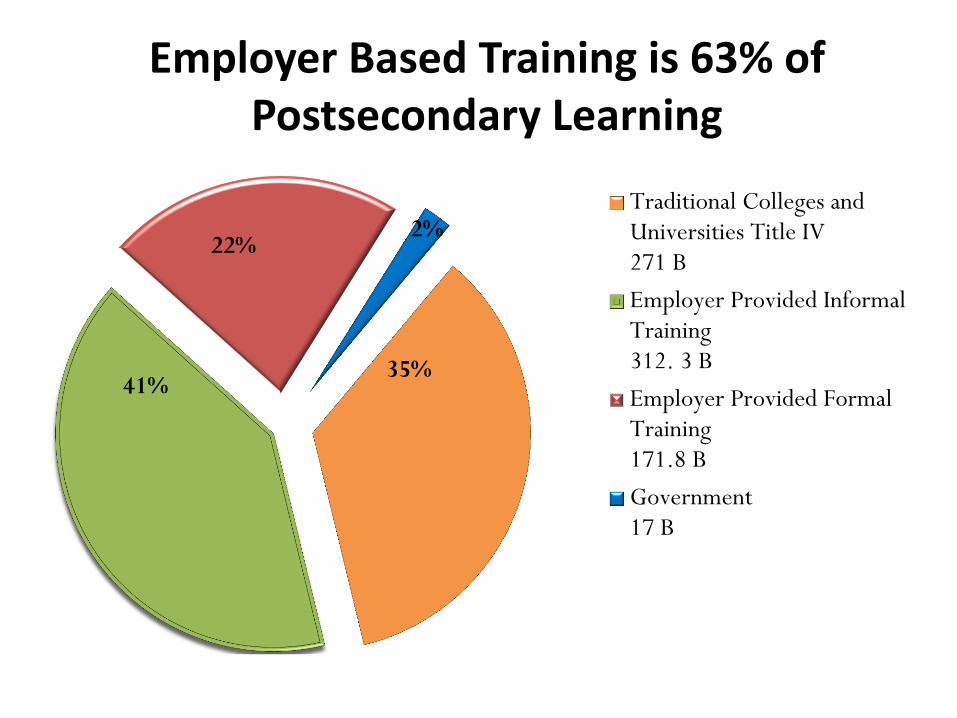
Employer Based Training is 63% of Postsecondary Learning
Traditional Colleges andUniversities Title IV271 B
Employer Provided InformalTraining312. 3 B
Employer Provided FormalTraining171.8 B
Government17 B
41%
22%
35%
2%
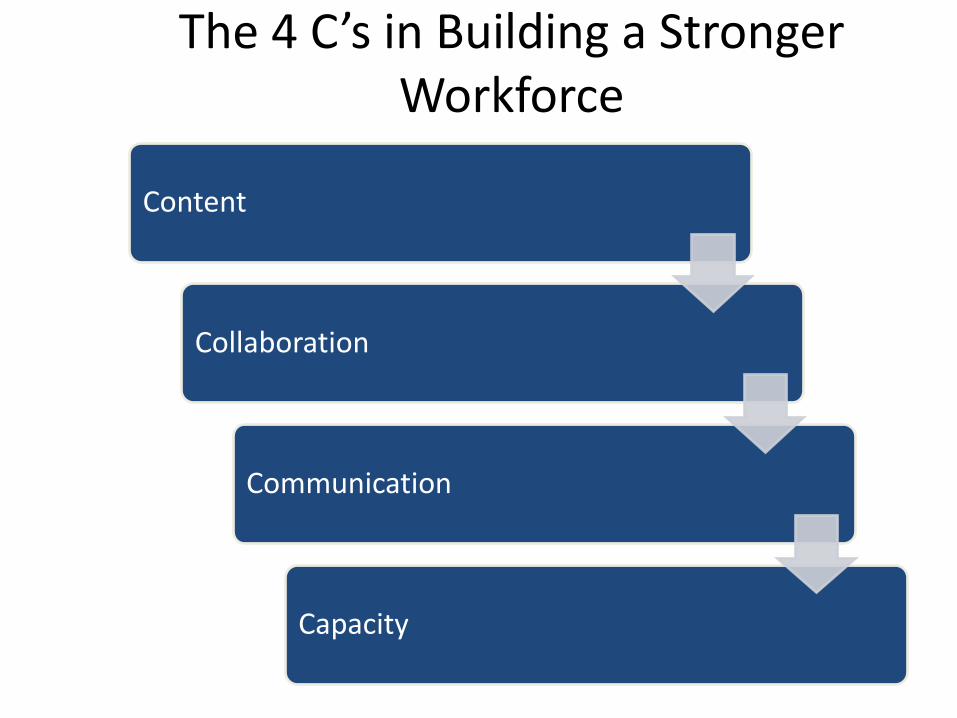
Content
Collaboration
Communication
Capacity
The 4 C’s in Building a Stronger Workforce
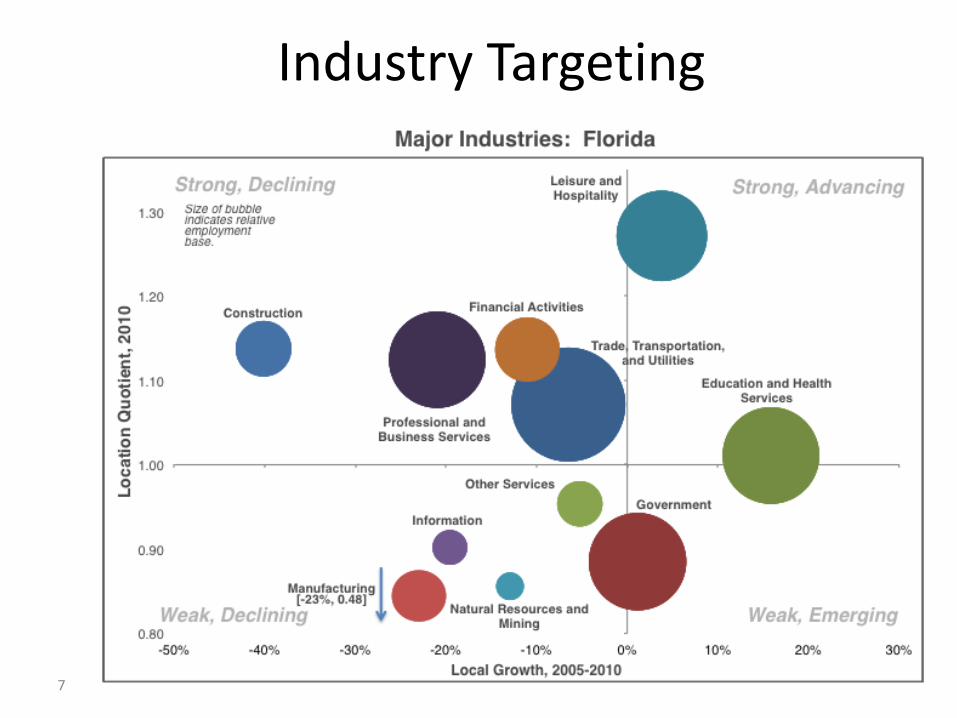
Industry Targeting
7
8
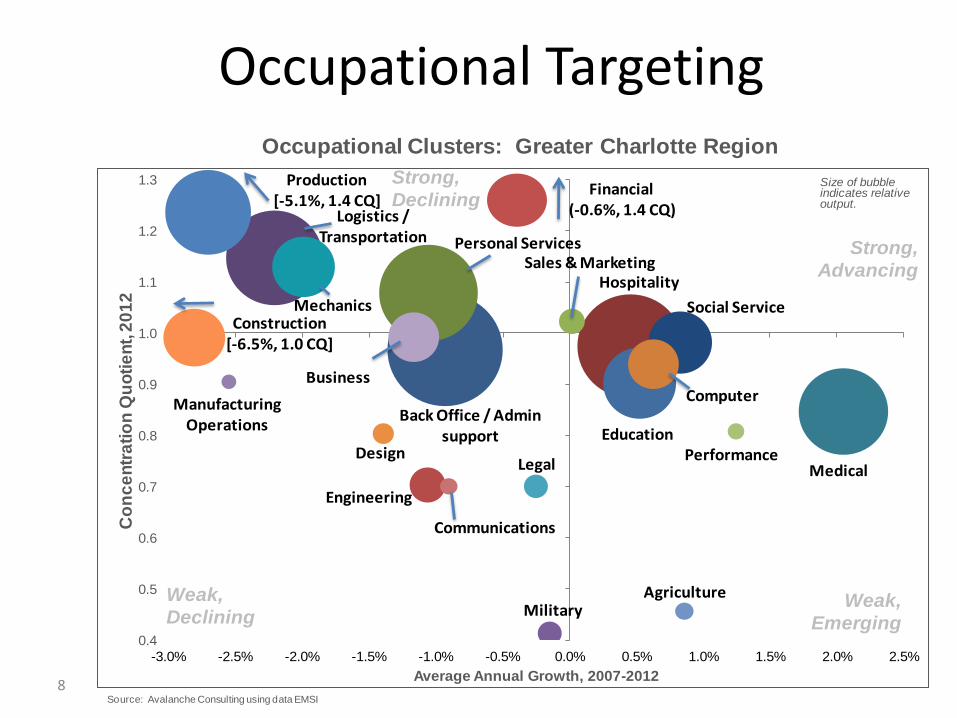
Occupational Targeting
Back Office / Admin support
Hospitality
Personal Services
Logistics / Transportation
Medical
Education
Social ServiceMechanics
ComputerBusiness
Engineering
Sales & Marketing
Military
LegalDesign
Agriculture
Communications
Performance
Manufacturing Operations
0.4
0.5
0.6
0.7
0.8
0.9
1.0
1.1
1.2
1.3
-3.0% -2.5% -2.0% -1.5% -1.0% -0.5% 0.0% 0.5% 1.0% 1.5% 2.0% 2.5%
Co
nc
en
tra
tio
n Q
uo
tie
nt,
20
12
Average Annual Growth, 2007-2012
Occupational Clusters: Greater Charlotte Region
Size of bubble indicates relative output.
Source: Avalanche Consulting using data EMSI
Strong,
Advancing
Strong,
Declining
Weak,
Emerging
Weak,
Declining
Financial(-0.6%, 1.4 CQ)
Production[-5.1%, 1.4 CQ]
Construction[-6.5%, 1.0 CQ]
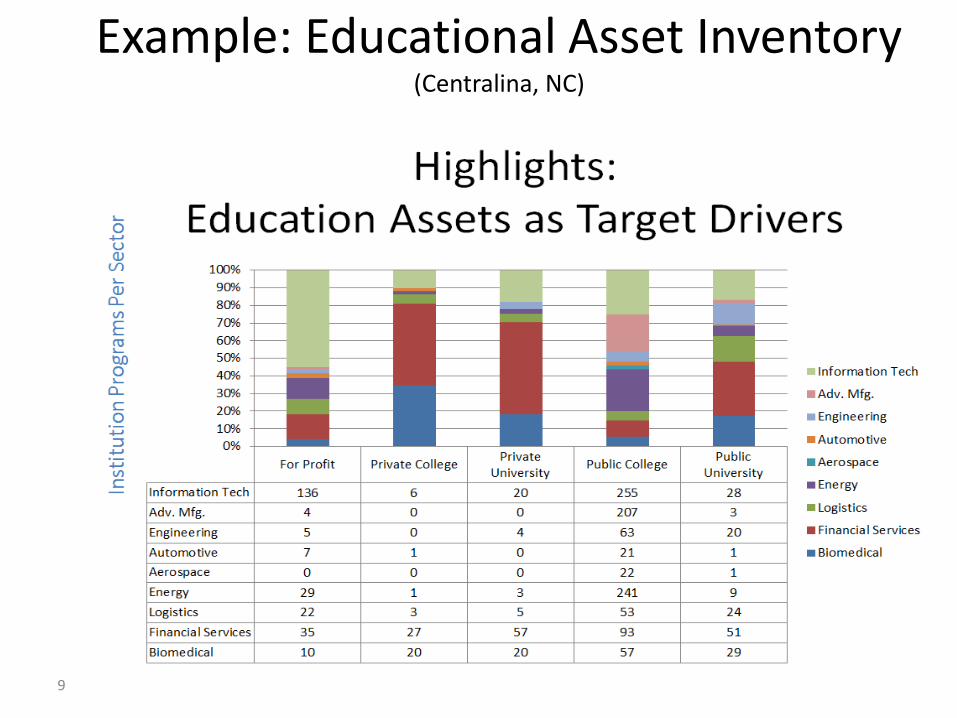
Example: Educational Asset Inventory (Centralina, NC)
9

Example: Credentials by specialty, by institution (Miami, FL)
10
Supporting Programs
Flo
rida Inte
rnational
Univ
ers
ity
Flo
rida M
em
ori
al
Univ
ers
ity
Flo
rida N
ational C
ollege
Johnso
n a
nd W
ale
s
Univ
ers
ity
Mia
mi D
ade C
ollege
M-D
CPS T
ech
nic
al
Inst
itutions
St. T
hom
as
Univ
ers
ity
DeV
ry u
niv
ers
ity
New
Pro
fess
ions
Tech
nic
al
Inst
itute
Culinary Management, Operations C B C, A, B
C
Event Management and Meeting Planning C B C
Tourism Marketing C
Hospitality Administration, Management C, B, M,
P B A B C, A B
B C
Travel/Tourism Management C B C, A B
Hotel/Lodging Management, Operations C B C
Culinary Arts B C C
Customer Service Tech C
Travel Agent C
11
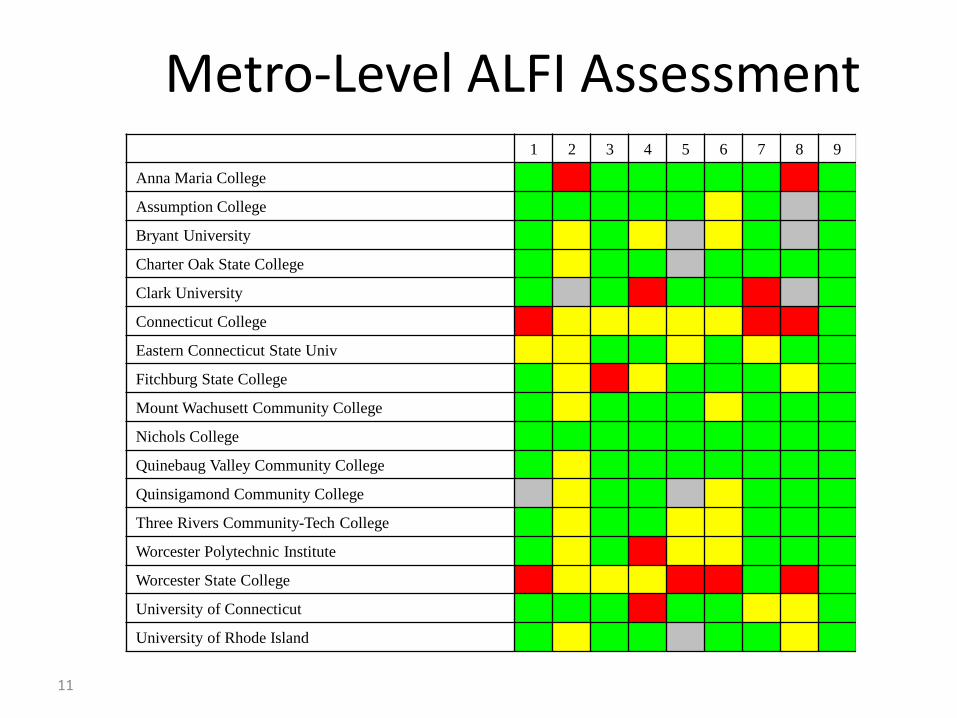
Metro-Level ALFI Assessment 1 2 3 4 5 6 7 8 9 10
Anna Maria College
Assumption College
Bryant University
Charter Oak State College
Clark University
Connecticut College
Eastern Connecticut State Univ
Fitchburg State College
Mount Wachusett Community College
Nichols College
Quinebaug Valley Community College
Quinsigamond Community College
Three Rivers Community-Tech College
Worcester Polytechnic Institute
Worcester State College
University of Connecticut
University of Rhode Island
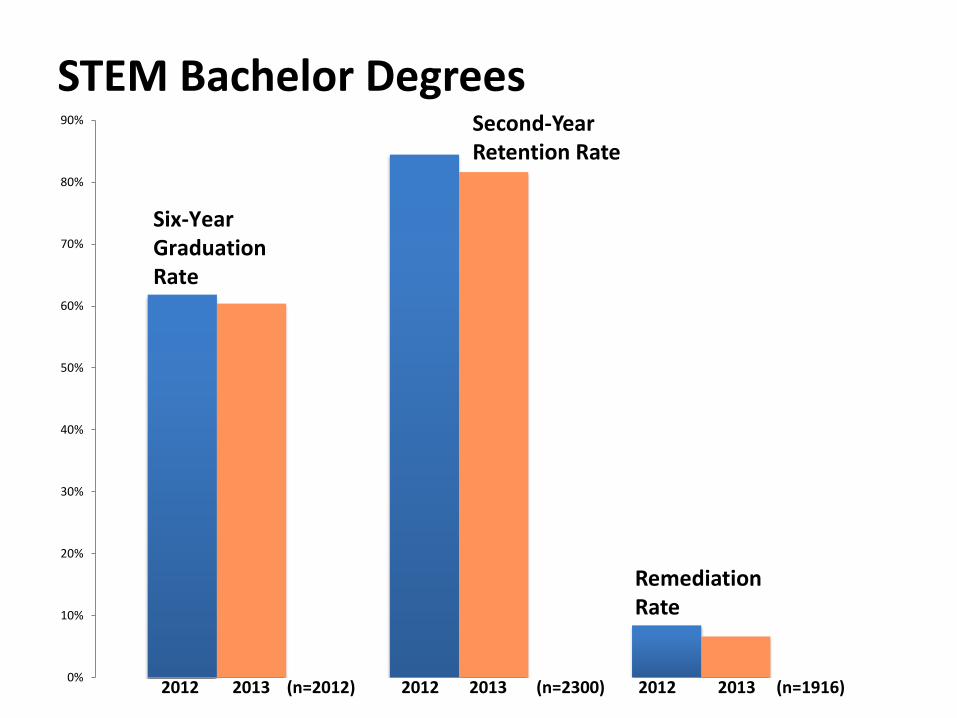
STEM Bachelor Degrees
0%
10%
20%
30%
40%
50%
60%
70%
80%
90%
Six-Year Graduation Rate
Remediation Rate
Second-Year Retention Rate
2012 2013 (n=2012) 2012 2013 (n=2300) 2012 2013 (n=1916)
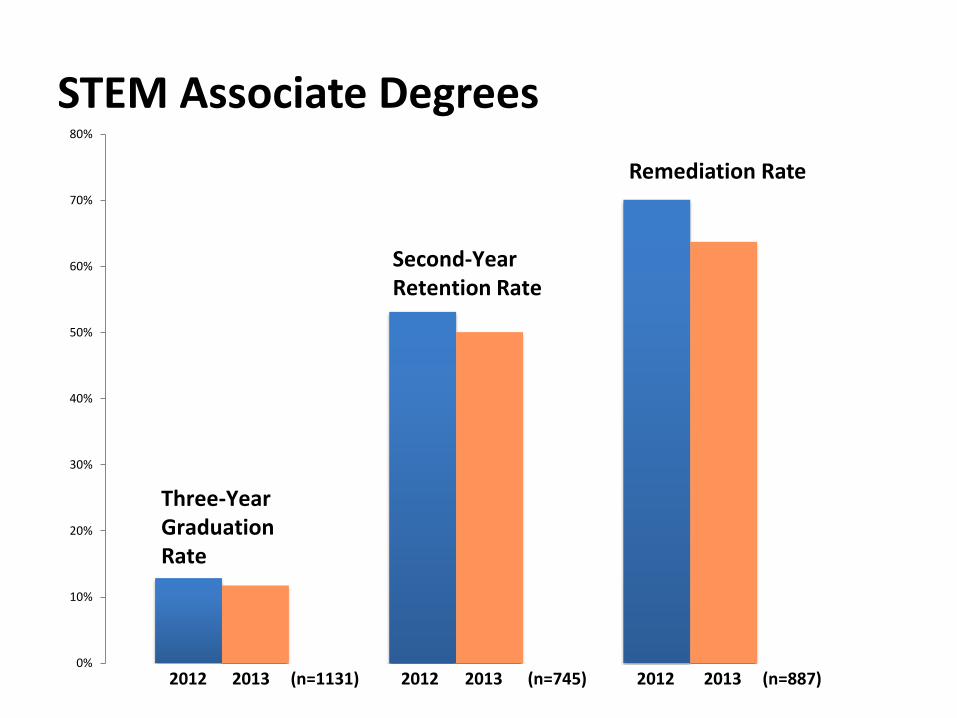
STEM Associate Degrees
0%
10%
20%
30%
40%
50%
60%
70%
80%
Three-Year Graduation Rate
Second-Year Retention Rate
Remediation Rate
2012 2013 (n=1131) 2012 2013 (n=745) 2012 2013 (n=887)
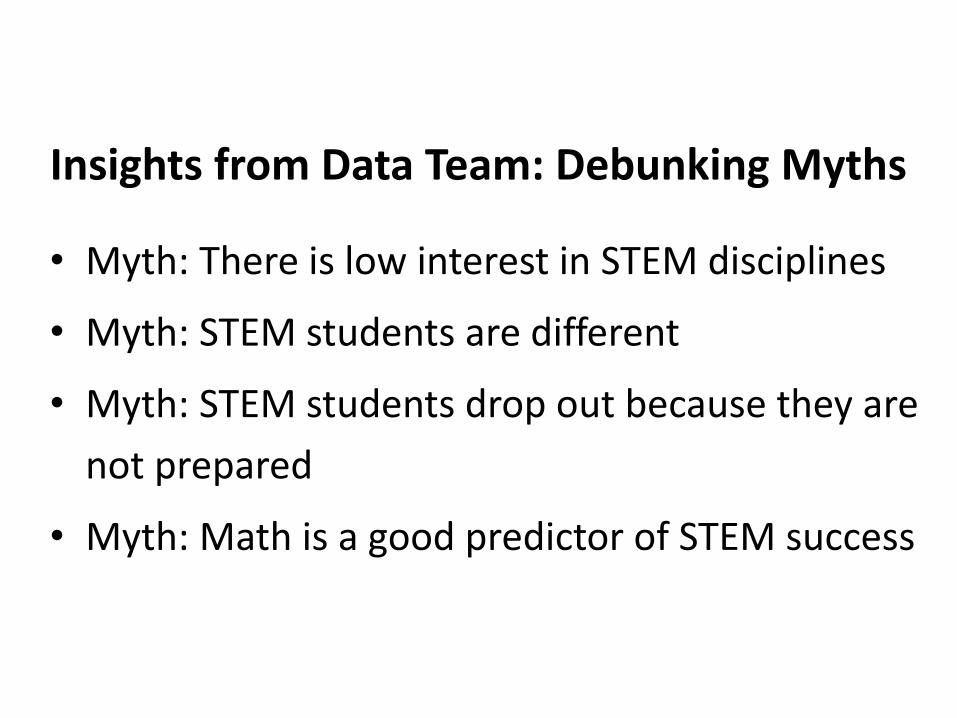
Insights from Data Team: Debunking Myths
• Myth: There is low interest in STEM disciplines
• Myth: STEM students are different
• Myth: STEM students drop out because they are
not prepared
• Myth: Math is a good predictor of STEM success
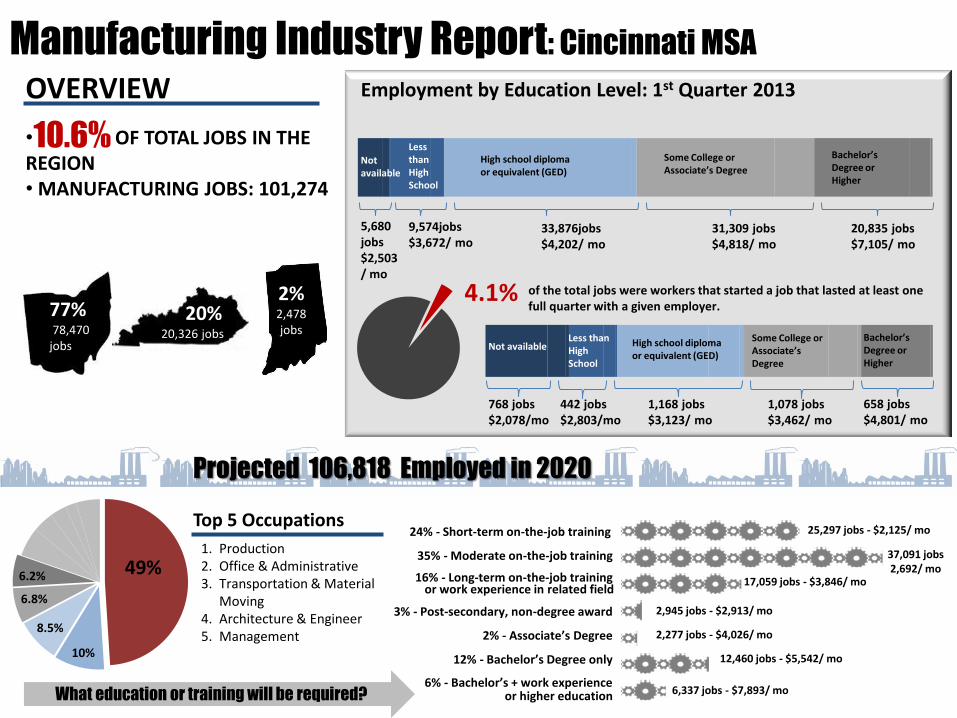
768 jobs $2,078/mo
Bachelor’s Degree or Higher
Some College or Associate’s Degree
High school diploma or equivalent (GED)
Less than High School
Not available
442 jobs $2,803/mo
1,168 jobs $3,123/ mo
1,078 jobs $3,462/ mo
658 jobs $4,801/ mo
25,837 jobs $2,136/ mo
37,955 jobs $2,696/ mo
What education or training will be required?
20,835 jobs $7,105/ mo
31,309 jobs $4,818/ mo
33,876jobs $4,202/ mo
9,574jobs $3,672/ mo
5,680 jobs $2,503 / mo
Bachelor’s Degree or Higher
Some College or Associate’s Degree
High school diploma or equivalent (GED)
Less than High School
Not available
Employment by Education Level: 1st Quarter 2013
Manufacturing Industry Report: Cincinnati MSA
OVERVIEW
• OF TOTAL JOBS IN THE REGION • MANUFACTURING JOBS: 101,274
77% 78,470 jobs
20% 20,326 jobs
2% 2 2,478
jobs
Projected 106,818 Employed in 2020
10.6%
4.1% of the total jobs were workers that started a job that lasted at least one full quarter with a given employer.
49%
10%
8.5%
6.8%
6.2%
3% - Post-secondary, non-degree award
16% - Long-term on-the-job training
35% - Moderate on-the-job training
24% - Short-term on-the-job training
12% - Bachelor’s Degree only
6% - Bachelor’s + work experience
2% - Associate’s Degree
25,297 jobs - $2,125/ mo
37,091 jobs 2,692/ mo
17,059 jobs - $3,846/ mo
2,945 jobs - $2,913/ mo
2,277 jobs - $4,026/ mo
12,460 jobs - $5,542/ mo
6,337 jobs - $7,893/ mo
.
or work experience in related field
.or higher education What education or training will be required?
Top 5 Occupations
1. Production 2. Office & Administrative 3. Transportation & Material
Moving 4. Architecture & Engineer 5. Management


![KMcGrew Austin2 WJIV handouts [Repaired]conference.esc13.net/assets/hci14/docs/McGrewPM_Print_HCI14.pdfCognitive Battery (GIA & CHC clusters) Oral Language Battery Achievement Battery](https://img.dokumen.tips/doc/110x75/5aa2af2d7f8b9a436d8d4656/kmcgrew-austin2-wjiv-handouts-repaired-battery-gia-chc-clusters-oral-language.jpg)