Embed Size (px)
Citation preview

1
POVERTY REDUCTION STRATEGY PAPER:
ANNUAL PROGRESS REPORT 2006-07
July 2008 PRSP Secretariat - Finance Division
Government of Pakistan

2
Contents
1 Introduction……………………………………………………………………………………..1 2 Trends in Poverty & Income/Consumption Distribution.........................................................3 2.1 Poverty Trends: 2004-05 / 2005-06………................................................…………………....4 2.2 Inequality Trends……..…….. ................................................................……………………...5 3 Trends in Macroeconomic Indicators .......................................................................................8 3.1 Agriculture .................................................................................................................................8 3.2 Industry ......................................................................................................................................9 3.3 Services ....................................................................................................................................10 3.4 Per Capita Income ....................................................................................................................10 3.5 Inflation ....................................................................................................................................11 3.6 Current Account Balance .......................................................................……………………..11 3.7 Investment and Savings ...........................................................................................................12 3.8 Fiscal Balance ..........................................................................................................................12 4 An Analysis of Pro-poor Budgetary Expenditure ..................................................................13 4.1 Provincial Patterns of PRSP Expenditure .................................................…………………...16 4.2 Sector-wise Analysis of PRSP ................................................................…………………….17 4.2.1 Education ..............................................................................................................................17 4.2.2 Health ....................................................................................................................................20 4.2.3 Rural Electrification………………………………………………………………………...22 5 Direct Transfers ........................................................................................................................24 5.1 Zakat ........................................................................................................................................24 5.2 Pakistan Bait-ul-Mal (PBM) ....................................................................................................25 5.3 Micro-credit .............................................................................................................................26 5.4 Employees Old Age Benefit Initiative (EOBI)……………………………………………….28 6 Monitoring the PRSP Intermediate Indicators.......................................................................30 6.1 Education Sector ......................................................................................................................30 6.2 Health Sector ............................................................................................................................37 6.3 Land Distribution .....................................................................................................................41 6.4 Employment ……….................................................................................................................41 7 Performance of the PRSP/MDG Indicators............................................................................44 7.1 Education Indicator ..................................................................................................................44 7.2 Literacy Rate.............................................................................................................................51 7.3 Health Indicator .......................................................................................................................53 7.4 Satisfaction from Basic Services .............................................................................................60 7.5 Housing ....................................................................................................................................61 7.6 Changes in Economic Condition: Household Perception ....................................................... 62 8 Conclusion and the Way Forward ..........................................................................................64 8.1 NWFP Expenditure Tracking………………………………………………………………...65 8.2 Strengthening Poverty Reduction Strategy Monitoring..…………………………………….66 8.3 Moving Forward……………………………………………………………………………...67
Tables

3
Table 2.1: Trends in Poverty Indicators….......................................................................................................4 Table 2.2: Population under various Poverty Bands........................................................................................5 Table 2.3: Gini Coefficient and Consumption Shares by Quintiles................…………………....................6 Table 3.1: Trends in Macroeconomic Indicators (Growth rates)……………………………...…………...10 Table 4.1: PRSP Development & Current Expenditures 2001-07…….. …..………………………………13 Table 4.2: Actual PRSP expenditure 2006-07………...................................................................................13 Table 4.3: Budgetary Poverty Related Expenditures by Sectors as % of GDP.......………………...……...14 Table 4.4: Budgetary Poverty Related Expenditures by Sectors, 2001-2007...........……………………….15 Table 4.5: PRSP %Change in Expenditures between 2006/07-2005/06………...…………………………16 Table 4.6: Percentage Change in PRSP Education Expenditure by Sectors…...…………..........................17 Table 4.7: Percentage Distribution of Education Expenditures by Province and Level of Education 2001-02 to 2006-07………………………………………………………..................19 Table 4.8: Percentage Change in PRSP Health Expenditures by Sectors….................................................21 Table 4.9: Percentage Distribution of Health Expenditure by Province and Sector 2001-02 to 2006-07………..............................................................................................................................22 Table 5.1: Direct Transfers and Beneficiaries...............................................................................................24 Table 5.2: Details of Zakat Programmes 2006-07….....................................................................................25 Table 5.3: Programmes of Pakistan Bait-ul-Mal….…………..…………...……………………………….26 Table 5.4: Micro-credit Disbursement…………….…………......................................................................27 Table 5.5: Khushal Pakistan Programme-I/Temporary Employment Generated 2006-07…........................28 Table 5.6: Khushal Pakistan Programme-I/Temporary Employment Generated 2002-07…........................28 Table 5.7: Number of Schemes Approved Under Each Category for 2006-07.............................................29 Table 6.1: Number of Functional Public Schools……..................................................................................32 Table 6.2: Actual Posts Filled Against Sanctioned Posts and Percentage of Trained Teachers…................33 Table 6.3: Proportion of Public Schools with Basic Facilities……..............................................................35 Table 6.4: TT- Immunization Coverage for Pregnant Women…..................................................................39 Table 6.5: DPT-3/OPV-3 Coverage of Children (%)………………………………………………………39 Table 6.6: Coverage of Lady Health Workers………...……........................................................................40 Table 6.7: Number of Lady Health Workers..…...........................................................................................40

4
Table 6.8: State Land Distribution by Number of Beneficiaries in Each Province…...................................41 Table 6.9: Age- Specific Unemployment Rate………………………......................................................... 42 Table 6.10: Unemployment Rate by Gender and Rural-Urban Areas……...................................................43 Table 7.1: Gross Enrolment Rate at the Primary Level (Age 5-9) By Province & Region (Excluding Katchi Class)……………………...…………………………………………...……45 Table 7.2: Gender Gap in GER at the Primary Level (Age 5-9)…………...……...……………………….46 Table 7.3: Net Enrolment Rate at the Primary Level (Age 5-9) By Province & Region (Excluding Katchi Class)..............................................................................................................47 Table 7.4: Gender Gap in NER at the Primary Level (Age 5-9)…...............................................................48 Table 7.5: Literacy Rates - Population 10 Years and Older (%)...................................................................52 Table 7.6: Percent of Children Aged 12-23 Months Immunized Based on Recall and Record Method Fully Immunized ..........................................................................................................................54 Table 7.7: Percentage of Pregnant Women Visiting Health Facility for Pre-and Post-Natal Consultation………………………………………………………………………...…………...55 Table 7.8: Main Sources of Drinking Water in Pakistan (Percentage Distribution)….................................57 Table 7.9: Percentage Distribution of Health Consultations in Past Two Weeks by Type of Health Provider/ Consulted during 2006-07……...................................................................................59 Table 7.10: Types of Practitioner Consulted for Diarrhea Treatment……...................................................59 Table 7.11: Health Facilities Used for Pre-Natal Consultation.....................................................................60 Table 7.12: Household Satisfaction by Facilities and Services Use (%)……………...……………...........60 Table 7.13: Distribution of Household by Type of Housing and Electricity Use (%)………….…….........61 Table 7.14: Percentage Distribution of Household by the Perception of the Economic Situation of the Household Compared to the Year before 2006-07…..………................................................... 62 Table 8.1: Break-up of District PRSP Expenditure for NWFP FY 07……...….…......................................65 Table 8.2: Percentage of District PRSP Expenditure as Compared to Total PRSP Expenditure in NWFP FY 07……..……………………….………………….……………………...………….66

5
List of Acronyms
AJK Azad Jamu Kashmir BCC Behaviour Change Communication BELA Basic Education and Literacy Authority BHC Basic Health Centers BHU Basic Health Units CDA Capital Development Authority CPI Consumer Price Index CRPRID Center for Research on Poverty Reduction and Income Distribution CSW Civil Society Wing CWIQ Core Welfare Indicators Questionnaire DOT Directly Observed Treatment DPT Diphtheria Pertusis Tetanus EFA Education for All EmONC Emergency Obstetrical and Neonatal Care EOBI Employees Old Age Benefit Institution ESR Education System Reform FANA Federally Administered Northern Areas FATA Federally Administered Tribal Areas FBS Federal Bureau of Statistics FP Family Planning FRDLA Fiscal Responsibility and Debt Limitation Act FSP Food Support Programme GER Gross Enrolment Rate GIS Geographical Information System HIES Household Integrated Economic Survey ICT Islamabad Capital Territory IFA Individual Finance Assistance IMNCI Integrated Management of Neonatal and Childhood Illnesses KB Khushali Bank KPF Khushal Pakistan Fund KPP Khushal Pakistan Programme LCV’s Light Commercial Vehicles LFS Labour Force Survey LHWs Lady Health Workers LSM Large Scale Manufacturing MCH Maternal and Child Health MDGs Millennium Development Goals MIS Management Information System MNH Maternal and Newborn Health NCHD National Commission for Human Development NCRCL National Center for Rehabilitation of Child Labour NEAS National Education Assessment System NEC National Education Census NEP National Education Policy NER Net Enrolment Rate NGO Non-Governmental Organization NHPU National Health Policy Unit PBM Pakistan Bait-ul-Mal

6
PIFRA Project for Improvement of Financial Reporting and Auditing PIHS Pakistan Integrated Household Survey PPAF Pakistan Poverty Alleviation Fund PSDP Public Sector Development Programme PSLM Pakistan Social and Living Standards Measurement Survey RCC Reinforced Cement Concrete RHC Rural Health Centers TBA Trained Birth Attendants TCP Trading Corporation of Pakistan VTI Vocational Training Institute ZTBL Zarai Taraqiati Bank Limited

7
1 Introduction 1.1 To arrest the high and rising trend of poverty in Pakistan at the start of the new millennium, the Government of Pakistan formulated an Interim Poverty Reduction Strategy Paper (I-PRSP) in November 2001, which after further refinement was evolved into the Poverty Reduction Strategy Paper (PRSP) in December 2003. With the PRSP having successfully completed its three years of implementation, final touches are being given to its successor – PRSP-II, which will take into account the recent socio-economic developments, including the changed landscape characterized by globalization and a demographic transition which the country is undergoing. 1.2 This PRSP Annual Progress Report is sixth in line. The purpose of this year’s report, like always, is to examine the details of PRSP expenditure, as well as, output and outcome PRSP indicators during the fiscal year 2006-07. This has been done using the pillars and indicators of PRSP-I as the base. However the final section presents some of the highlights of how the new monitoring framework under PRSP-II would look like; it contains an intensive discussion on district expenditures using NWFP as a case study. 1.3 PRSP initiative has been successful in Pakistan in many fronts, although several challenges are ahead. GDP grew on average by nearly 7% during the last six years. This recent growth is broad-based, and it has been underpinned by the macroeconomic policies of the government. 1.4 Both high growth and decline in unemployment along with considerable increase in pro-poor expenditure during the PRSP process, rise in per capita income, large inflow of remittances and direct transfers to the poor through Zakat, Pakistan Bait-ul-Mal and micro-credit have contributed in 10.6 percentage points decline in absolute poverty from 34.46% in 2000-01 to 23.9% in 2004-05. Although poverty reduced substantially, income inequality increased marginally during the same period. 1.5 According to the Fiscal Responsibility and Debt Limitation Act (FRDLA) 2005, poverty alleviation expenditures are not to be reduced below 4.5% of estimated GDP for any given year. PRSP expenditures have adhered to this Act; these expenditures as percentage of GDP consistently increased from less than 4% in FY02 to 5.63% in 2005- 06. During 2006-07, budgetary expenditures on pro-poor sectors came to Rs 497.5 billion, representing 5.71 percent of the GDP. 1.6 The FRDLA 2005 requires that budgetary allocations to the education and health sectors in terms of GDP should be doubled over the next 10 years. The education and health sectors represent the core elements of the poverty reduction strategy. The recent

8
issue of the Pakistan Social and Living Standards Measurement Survey (PSLM) 2006-07 has been published. Results of various PSLM Survey show that the literacy rate increased to 55 percent in 2006-07, while primary gross enrolment rate rose from 72 percent in 2001-02 to 91 percent in 2006-07. The female primary gross enrolment rate during the same period has increased from 77 percent to 81 percent. Results for the health sector show that immunization coverage of children aged 12-24 months has fairly over the past few years. The record based full immunization has shown a slight increase from 49 percent in 2005-06 to 50 percent in 2006-07. However, when recall measures are also included, full immunization rates (including all the eight recommended vaccines1) showed a positive increase from 71 percent in 2005-06 to 76 percent in 2006-072. Further, this period witnessed a decrease in the infant mortality rate from 85 per 1000 births in 2000-01 to 77 per 1,000 births during 2005-06. 1.7 However, there are many challenges ahead. High sustained economic growth is required for longer period to achieve the MDG/PRSP targets by 2015. There is a need to broaden the inclusiveness of economic growth to reduce income inequality level in the country. Despite a sharp decline in rural poverty, it is still almost double the poverty levels in urban areas. The challenge of further reduction in poverty particularly in rural areas requires more targeted interventions. Gender gaps still persist in literacy and primary school enrolment. District-level variations are also high in literacy, school enrolment, child immunization, pre- and post-natal consultation and water supply and sanitation. The Government of Pakistan is aware of these challenges and will address them during the PRSP-II period. 1.8 The rest of this report is organized as follows; Section 2 will exemplify the trends in poverty and the inequality in income & consumption distribution. Section 3 will examine an overview of the macroeconomic indicators. Sections 4 and 5 will then illustrate a detailed analysis of the data on pro-poor budgetary expenditures and direct transfers including Zakat, Pakistan Bait-ul-Mal (PBM), Employees Old-Age Benefit (EOBI) and Micro-credit. This section will include a box highlighting the achievements of the government’s Khushal Pakistan Programme (KPP). Progress in some intermediate indicators concerning education and health sectors, water supply and sanitation will be discussed in section 6, followed by an analysis of the performance of PRSP/MDG indicators, which will be reported briefly in section 7. The conclusion and way forward are presented in the final section, including a detailed analysis of district expenditure carried out in NWFP during the fiscal year under discussion. 1 Full immunization means that the child has received: BCG, DPT1, DPT2, DPT3, Polio1, Polio2, Polio3 and measles 2 PSLM (2006-07), Statistics Division, Federal Bureau of Statistics, Government of Pakistan, Islamabad

9
2 Trends in Poverty and Income / Consumption Distribution3
2.1 The PRSP recognizes that poverty has many dimensions in Pakistan. The poor have not only low incomes but they also lack access to basic needs such as education, health, clean drinking water and proper sanitation. The latter undermines their capabilities, limits their opportunities to secure employment, results in their social exclusion and exposes them to exogenous shocks. The vicious cycle of poverty is accentuated when the governance structures exclude the most vulnerable from the decision making process. 2.2 The reduction in poverty and improvement in social indicators and living conditions of the society are being monitored frequently through large-scale household surveys to gauge their progress in meeting the targets set by Pakistan for achieving the UN Millennium Development Goals by 2015. Among them the most important is halving the population living below the poverty line from 26% in 1990 to 13% by 2015. 2.3 From a poverty assessment angle, there are merits and demerits in following a consistent policy on periodicity of surveys. At times, the surveys and estimates are improbable to reveal much, and show data with minor variations and numbers which may not be very different statistically. Still they serve a useful purpose of monitoring and evaluating the sensitivity or robustness of estimates to changing economic conditions and also long time series helps to build and reveal a more ‘structural’ relationship between poverty and other dimensions of the economy. 2.4 A huge expenditure on poverty-related and social sector programme was bound to make a significant dent in poverty in Pakistan. Poverty alleviation gains made from 2001 to 2006 through sustained higher economic growth and tremendous rise in development expenditure have to be protected. 2.5 Fiscal year 2004-05 was an exceptionally good year, both in terms of agriculture and manufacturing growth and their contributions to GDP. The estimates to measure poverty situation in the country showed an improvement in poverty headcount to 23.9 percent from the previous estimates of 34.5 percent in 2000-01. Recently the estimates calculated from PSLM 2005-064 have been finalized. They serve as useful channel and benchmark to poverty monitoring. Estimates of poverty from PSLM for the period 2005-06 depict the socioeconomic conditions that prevailed during the fiscal year 2005-06.
3 This section largely relies on Pakistan Economic Survey 2007-08 4 Pakistan Social & Living Standards Measurement Survey, conducted by the Federal Bureau of Statistics (FBS) in the year 2005-06

10
2.6 Poverty estimates producing methodology is similar to the ones adopted previously, with the following features (i) updating the poverty line based on 2350 calories per adult equivalent per day with the consumer price inflation during 2004-05 and 2005-06, (ii) constructing spatial price index for all food and energy items (around 89) and adjusting household expenditures to provide consistent consumption welfare measure across all 1100 primary sampling units in the country and during the year of the survey, (iii) following a cleaning protocol consistent with the one adopted for data set of 2004-05 and (iv) adopting adult equivalent measures for consumption to adjust for number of children. 2.1 Poverty Trends: 2004-05 / 2005-06
2.7 Table-2.1 presents a comparison of poverty status during 2004-05 and 2005-06. The latest estimate of inflation-adjusted poverty line is Rs.944.47 per adult equivalent per month, up from Rs.878.64 in 2004-05. Headcount ratio5 has dropped marginally from 23.94 percent in 2004- 05 to 22.32 percent in 2005-06, showing an improvement of 1.62 percentage points6. Poverty in rural areas declined from 28.13 percent to 27.0 percent, which shows an improvement of 1.13 percentage points. Poverty in Urban areas also recorded a decline from 14.94 percent to 13.1 percent during, representing an improvement of 1.84 percentage points in the period. This shows that the improvement in poverty headcount in percentage points is more in urban areas as compared to rural areas.
Table 2.1: Trends in Poverty Indicators
Headcount Poverty Gap Severity of Poverty
Year Urban Rural Pakistan Urban Rural Pakistan Urban Rural Pakistan
2004-05 14.9 28.1 23.9 2.9 5.6 4.8 0.8 1.8 1.5
2005-06 13.1 27.0 22.3 2.1 5.0 4.0 0.5 1.4 1.1
Source: PSLM 2.8 The other two indicators, poverty gap and severity of poverty are aggregate measures of ‘spread’ of the poor below the poverty line, i.e., they aggregate the distance (proximity or remoteness) of all poor individuals from the poverty line. A lower value indicates that most of the poor are clustered around the poverty line. In line with the improvement in headcount, both the poverty gap and severity of poverty were also reduced in the country during the period. The estimation of poverty line enables the
5 Percentage of population below the poverty line 6 A technical exercise carried out by the World Bank supports the accuracy of CRPRID/Planning Commission poverty numbers for PIHS 2000-01, PSLM 2004-05, and PSLM 2005-06 using the official methodology and data cleaning protocol. The World Bank also carried out various sensitivity analyses to ensure the reliability of the estimates, and found that the poverty estimate at the national level declined slightly between 2004-05 and 2005-06, but the reduction was not statistically significant

11
policy makers to further identify and group the population into various ‘poverty bands’ such as extremely poor, vulnerable and non-poor etc. 2.9 Table-2.2 presents a comparative profile of 2004-05 and 2005-06 for the six groups. Notably the percentage of ‘extremely poor’ consuming less than 50% of poverty line expenditures, halved from 1 to 0.5 percent of the population. Similarly there was an improvement of 1 percentage point in the proportion of ultra-poor from 6.5 to 5.4 percent. On the other hand, the proportion of ‘Quasi non-poor’ increased from 35 to 36.3.percent. The section of population defined as ‘vulnerable’ at 20.5 percent remains almost the same and any negative macro or personal shock can easily drift these households into the category of ‘poor’. Combining ‘poor’ with ‘vulnerable’ segments of the population, i.e., the poverty status of 36.9 percent of the population is likely to change with the growth performance of agriculture and food inflation in the country.
Table 2.2: Population under various Poverty Bands
(% of Population)
Source: Pakistan Economic Survey 2007-08
2.2 Inequality Trends
2.10 Inequality based on consumption expenditure is generally lesser than inequality based on income as variations in consumption are less and it is based partly on a subset of
2004-05 Poverty Line = Rs. 878.64
2005-06 Poverty Line = Rs. 944.47
Extremely Poor 1.00% <50% that is <Rs. 439.32
Extremely Poor 0.50% <Rs. 472.23
Ultra Poor 6.50% >50%<75% that is Rs. 439.32 – Rs. 658.98
Ultra Poor 5.40% that is Rs. 708.35
Poor 16.40% >75%<100% that is Rs. 658.98 – Rs. 878.64
Poor 16.40% that is Rs. 944.47
Vulnerable 20.50% >100%<125% that is Rs. 878.64 – Rs. 1098.30
Vulnerable 20.50% that is Rs. 1180.59
Quasi Non-Poor 35.00% >125%<200% that is Rs. 1098.30 – Rs. 1757.28
Quasi Non-Poor 36.30% that is Rs. 1888.94
Non-Poor 20.50% over Rs. 1757.28
Non-Poor 20.90% over Rs. 1757.28

12
homogenous (in terms of quality and price) food items. The consumption inequality is measured by the Gini Coefficient7 and ratio of highest to the lowest quintile. 2.11 Table-2.3 shows the value of Gini for Pakistan and rural-urban divide obtained from the two Surveys, i.e., HIES8 2004-05 and PSLM 2005-06. The secular rise in Gini values continues at the national level and urban areas, indicating that consumption inequality continues to increase during the period, particularly for the middle quintiles 3 & 4 in urban areas. Between 2004-05 and 2005-06, consumption inequalities further increased from 0.2976 to 0.3018. This increasing trend in inequality is the opposite of the declining trend observed in absolute poverty. One also observes that in a matter of a year the Gini of rural areas declined from 0.2519 to 0.2462. The estimates indicate that consumption inequality in urban areas is higher than in rural areas, probably due to diversification of urban workforce in terms of skill and education, leading to differentials in household earnings and consumptions. Also urban inequality increased faster than overall inequality during 2005-06.
Table 2.3: Gini Coefficient and Consumption Shares by Quintiles
HIES 2004-05 PSLM 2005-06 Urban Rural Pakistan Urban Rural Pakistan
Gini Coefficient 0.3388 0.2519 0.2976 0.349 0.2462 0.3018 Consumption share by Quintile
Quintile 1 4.8 12.6 9.5 4.5 13.5 9.6 Quintile 2 7.6 17.1 13.2 8.2 16.8 13.1 Quintile 3 11.6 19.7 16.4 11.1 20.1 16.2 Quintile 4 18.3 23 21.4 17.8 23 20.8 Quintile 5 57.7 27.6 39.4 58.4 26.6 40.3
Ratio of Highest to Lowest
12.02 2.19 4.15 12.98 1.97 4.2
Source: Pakistan Economic Survey 2007-08
2.12 The Gini Coefficient is a broad single aggregative measure. It suppresses the profile of the distribution. Table-2.3 also reports the trends of percentage share of consumption expenditure by quintile for overall Pakistan as well as the rural and urban regions. Comparing 2004-05 with 2005-06, a miniscule improvement in the share of the lowest quintile is observed at the national level. For this group, the significant improvement in rural areas is offset by a worsening in urban areas. The consumption shares are stable between the two years for the next two quintiles. The decline in the
7 The Gini Coefficient takes on a value between 0 and 1, the higher the value of Gini Coefficient, the higher will be the inequality 8 Household Integrated Economic Survey

13
share of quintile group 4, i.e., between 60 and 80 percent is offset by further increase of 1 percentage point in the share of the top quintile. 2.13 Another measure of inequality is the ratio of highest to the lowest consumption quintile, which measures the gap between the rich and the poor. This ratio has increased overall marginally from 4.15 in 2004-05 to 4.2 in 2005-06 at the national level, indicating an increased rich-poor divide over the period. Consistent with increasing share of the poor in rural areas in 2005-06, the rich-poor gap narrowed in 2005-06 as the ratio declined from 2.19 in 2004-05 to 1.97 in 2005-06. However, in urban areas gap between the rich and the poor has widened more from 12.02 in 2004-05 to 12.98 in 2005-06. 2.14 Hence we can say that Pakistan’s Poverty Reduction Strategy has yielded handsome result in the shape of sharp reduction in poverty from 34.5% in 2000-01 to 22.32% in 2005-06. But it appears that high growth during the 2000/01 – 2005/06 period has resulted in lower levels of poverty but higher levels of inequality. The higher the inequality in the country, the harder it is for growth to reduce poverty. Although poverty has declined but the fact remains that 22.32 percent people of Pakistan still live below the poverty line. Further reduction in poverty is a major challenge for the government. The reduction in poverty between 2000-01 and 2005-06 period could have been more, had the distribution of consumption expenditures remained the same. Inequality reflects distortions in access to markets, in the availability and quality of health, education and infrastructure services, and in rural-urban distortions – all of which dampen growth and poverty reduction. The government of Pakistan is fully aware of the rising trends in inequality, and the PRSP-II aims to design policies to reduce it considerably through enhancing the inclusiveness of economic growth and improving the efficiency of targeted interventions.

14
3 Trends in Macroeconomic Indicators 3.1 Macroeconomic performance is commonly considered to be the key determinant of poverty reduction. The notion that a healthy economy benefits those at the low end of the income distribution is a proven fact as economic growth is an essential condition for the generation of resources needed to sustain investments in health, education, infrastructure, and good governance (law enforcement, regulation), among others. Government of Pakistan has assigned high priority to policies for sustained economic growth and realizes the importance of maintaining macroeconomic stability in its fight against poverty. 3.2 Key macroeconomic indicators remained encouraging in Financial Year 2006-07 despite external (rising oil prices) and internal shocks (energy crisis, political conditions). The real GDP growth increased persistently from 3.1% in 2001/02 to 8.4% in 2004/05, the year when poverty declined sharply (Table 3.1). Real GDP growth rate of 7% remained on track and achieved the target (7 %) set for this year as compared to 6.6% in 2005-06. The following section will provide an overview of key macroeconomic indicators and their trend for PRSP period. 3.1 Agriculture 3.3 Agriculture continues to be the single largest sector and has been recognized by the government as the engine of economic growth and poverty reduction. It accounts for 20.9 percent of the GDP and employs 43.4 percent of the total work force while provides livelihood for 66 percent of the country’s rural population. Pakistan has experienced mixed growth trends over the last six years in agriculture sector. The sector witnessed negative growth in 2000-01 and 2001-02 because of drought but registered a strong recovery in 2004-05. The performance of agriculture sector registered slow growth in 2005-06 because major crops could not perform up to the expectations due to adverse weather conditions. Agriculture experienced renewed growth in 2006-07 and grew by 5.0 percent achieving the target set for the year, as against the previous year’s growth of 1.6 percent. Major crops posted strong recovery from negative 4.1 percent last year to positive 7.6 percent, mainly due to higher production of wheat and sugarcane. Wheat production of 23.5 million tons, registered an increase of 10.5 percent over last year production of 21.7 million tons. Sugarcane production (54.8 million tons) grew by 22.6 percent over last year’s negative growth rate of 6.2% (from 47.2 million tons in 2004-05 to 44.3 million tons in 2005-06). Cotton production at 13 million bales remained mostly unchanged in comparison to 13.02 million bales of last year. Rice production at 5.4 million tons was marginally less than 5.5 million tons produced last year.

15
3.4 Livestock is an important component of Pakistan’s agriculture sector since 30 - 35 million of rural population is involved in livestock raising. Government gives high priority to its development and is focused on private sector led development of livestock. The government has formulated an independent Livestock Development Policy, providing a framework for accelerated development of livestock. This policy not only addresses the need of the small livestock farmers for whom livestock is a supplementary income source but also includes measures to develop small and medium livestock enterprises and an incentive framework for setting up large livestock farms. The Livestock Census 2006 carried out by the Agricultural Census Organization has been released. According to the Census, the share of livestock in agriculture growth has increased from 25.3 percent in 1996 to 49.6 percent in 2006. Livestock registered growth of 4.30 percent in 2006-07 over the last year’s strong growth of 7.5 percent. Fishery performed positively at 4.2 percent though the previous year’s growth stood at 20.5 percent. 3.2 Industry 3.5 The Overall Manufacturing sector continued its positive trend in 2006-07 and registered a growth of 8.45 % as compared to 9.9% in 2005-06. Large Scale Manufacturing (LSM) witnessed an upward trend in growth from FY02 to FY04. In FY04, LSM growth of 18.2% was highest in the last three decades. The LSM growth though declined to 15.6% in FY05, but was still substantially stronger than average growth of 9.6% during FY02-FY04. The LSM accounts for 69.5% of overall manufacturing and registered 8.8% of growth in 2006-07 against 10.7% in 2005-06. The relatively slow pace of LSM show signs of moderation on account of higher capacity utilization and strong base effect. The slow down in LSM can be attributed to multiple reasons like reduced production of cotton crop, sugar shortage, steel and iron problems and global oil prices. The main contributors to 8.8 percent growth of LSM in 2006-07 over last year are cotton cloth (7.0 percent) and cotton yarn (11.9 percent) in the textile group; cooking oil (6.8 percent), sugar (19.6 percent) and cigarettes (4.14 percent) in the food, beverages and tobacco groups; cement (21.11 percent) in the non-metallic mineral products group and Jeeps & Cars (3.0 percent), LCV’s (17.04 percent), motorcycles/scooters (12.30 percent) and tractors (11.40 percent) in the automobile group. 3.6 The overall growth rate of small and household manufacturing increased from 7.5% in FY05 to 9.3% in FY06 but decreased to 7.7 % in 2006-07. Overall value addition by industry witnessed a rise of 5.9% in FY06, significantly lower than both, the 9.5% target for the year and 11.4% growth in FY05. This has further risen to 6.8% in 2006-07 against a target of 9.1% for the year.

16
3.3 Services 3.7 Services sector has been growing rapidly over the last five years. It grew by 4.8% in FY02, 5.2% in FY03, 5.9% in FY04, and 8% in FY05. Services sector registered 8% growth rate in 2006-07 against 8.8% in 2005-06 and accounted for 53.3% of sectoral share in the GDP. Growth in the services sector in 2006-07 was primarily attributable to strong growth in the finance and insurance sector, better performance of wholesale and retail trade, as well as social services sector. These sectors collectively absorb approximately one-third of workforce in Pakistan. The services sector contributed 4.2 percentage points to 2006-07 GDP growth of 7%.
Table 3.1: Trends in Macroeconomic Indicators (Growth Rates)
2001-02 2002-03 2003-04 2004-05 2005-06 2006-07 Agriculture -0.1 4.1 2.2 7.6 2.5 5 Manufacturing 4.5 6.9 14.1 12.5 8.6 8.4 Large Scale Manufacturing 3.5 7.2 18.2 15.6 10.7 8.8 Small and Household 7.5 7.5 6.2 6.3 9.3 7.7 Services Sector 4.8 5.3 6 8 8.8 8 Real GDP Growth Rate 3.1 4.8 6.4 8.4 6.6 7 Inflation (CPI Growth) 3.5 3.1 4.6 9.3 7.9 7.9 GDP at Market Price (Billion Rs) 4,402 4,823 5,533 6,548 7,713 8,706 As % of GDP Investment 16.8 16.9 17.3 16.8 20 23 Fixed Investment 15.5 15.3 15.6 15.3 18.4 21.4 Public 4.2 4 4.8 4.4 4.8 5.2 Private 11.3 11.3 10.8 10.9 13.6 16.2 National Savings 18.6 20.8 18.7 15.6 16.4 18 Foreign Savings -1.9 -3.8 -1.4 1.2 3.7 5
Accelerating Economic Growth and Reducing Poverty: The Road Ahead (2003), PRSP Source: Pakistan Economic Survey 2007-08 3.4 Per Capita Income 3.8 The per capita income in dollar term has grown at an average rate of 13.6% per annum during the last three years - rising from US $669 in FY04 to US $742 in 2004-05 and to US $847 in 2005-06. Per capita income in dollar term rose to US $925 in 2006-07, depicting an increase of 11.0 percent. The sharp rise in per capita income owes to acceleration in real GDP growth; stable exchange rate and four fold increase in inflow of workers’ remittances.
17
3.5 Inflation 3.9 The rate of inflation averaged 7.9 percent in the first 10 months of the fiscal year – marginally lower than last year for the same period – but certainly above the target of 6.5 percent for the year. The average inflation for the year is likely to be around 7.5 percent – 100 basis points above the target. Food inflation averaged 10.2 percent over the first ten months of fiscal year 2006-07 as against 7 percent last year during the same period. On the other hand, non-food inflation averaged 6.2 percent as against 8.8 percent of last year during the same period. The core inflation, which excludes food and energy costs from headline CPI based inflation, also exhibited a decline, averaging 6 percent over the first 10 months of the current year as against 7.7 percent during the same period last year. The facts show that the inflation in FY07 has largely been driven by higher food inflation and food inflation in turn has been fueled by a combination of global trends in the prices of several commodities specifically high edible oil prices and shortfall in domestic production of rice and pulses. To control prices of food commodities, Government of Pakistan allowed a liberal import regime for food items, including zero rating of the imports of food commodities. The government has been selling wheat flour and sugar through the outlets of the Utility Stores Corporation at much lower prices than the market. The role of the Trading Corporation of Pakistan (TCP) has been enhanced. TCP is importing sugar and is asked to import various kinds of pulses to keep a check on the prices of these commodities. 3.6 Current Account Balance 3.10 The current deficit, excluding official transfers, stood at US $7361 million (4.3% of GDP) in FY07, as compared to US $5683 in FY06. Pakistan’s current account balance turned negative in FY05, after posting surpluses for three consecutive years. The deterioration in current account deficit is the result of higher oil import bill on the back of high global crude oil prices, large increase in non-oil imports, due to increased demand. In addition to widening of trade deficit, higher freight charges by international shipping lines as a result of large increase in global trade and higher fuel cost and growth in personal travel due to rising level of income of middle and high income groups have also contributed to the widening of current account deficit. Workers’ remittances, the second largest source of foreign exchange inflows after exports, continue to maintain its rising trend. Workers’ remittances stood at US$ 5.5 billion in FY07, as compared to US$ 4.6 billion in FY06- the highest ever in the country’s history.
18
3.7 Investment and Savings 3.11 Investment as percentage of GDP is estimated at 23% of GDP in FY07, as compared to 20% in FY06. Fixed investment stands at 21.4% of GDP in FY07, compared to 18.4% in FY06. Public investment as percentage of GDP amounts to 5.2% and private investment at 16.2% in FY07, compared to 4.8% and 13.6% in FY06, respectively. Over the last four years, total investment has increased 6.4% points of GDP, rising from 16.6% in 2003-04 to 23 percent in FY07, reflecting the buoyant mood of domestic as well as foreign investors. National savings as percentage of GDP stand at 18% in FY07, compared to 16.4% in FY06. 3.8 Fiscal Balance 3.12 Fiscal deficit is estimated at 4.3% of GDP in FY07 against 4.2% in FY06. The target of fiscal deficit was 4.2% for FY07. The revenue expenditure gap was financed through external and domestic sources.

19
4 An Analysis of Pro-Poor Budgetary Expenditures 4.1 Monitoring and evaluation of qualitative, as well as, quantitative aspects of PRSP expenditures are central to the PRSP process; and the government has attached critical importance towards their regular monitoring, analysis and transparency. Since the initiation of I-PRSP in 2001, pro-poor expenditures on 17 sectors have been reported regularly on a quarterly and annual basis. This section gives an overview of the expenditures incurred since 2001-02 and Table 4.1 presents data on PRSP current, development and total expenditures, as well as, a percentage of GDP. 4.2 Total PRSP expenditure (both current and development) has increased over time in nominal terms, as well as, percentage to GDP, surpassing the projected expenditures for the FY07. PRSP development expenditures as percentage of GDP have almost tripled during the past six years from 0.86% in FY01/FY02 to 2.4% in FY06/FY07. The PRSP current expenditures as percentage of GDP increased from 2.95% in FY02 to 3.4% in FY03 but declined over the following four years (except FY06) due to a relatively larger increase in the development expenditures during that period.
Table 4.1: PRSP Development & Current Expenditures 2001-07 PRSP Expenditures (Rs Million) PRSP Expenditures as % of GDP Year Development Current Total Development Current Total 2001-02 37,638 129,642 167,280 0.86 2.95 3.82002-03 44,208 164,320 208,528 0.92 3.41 4.322003-04 78,983 182,318 261,301 1.43 3.23 4.63 2004-05 112,635 203,608 316,243 1.71 3.09 4.812005-06 170,794 263,797 434,591 2.21 3.42 5.632006-07 210,876 286,602 497,484 2.4 3.31 5.71
Source: Civil Accounts provided by Accountant General’s Office Note 1: GDP (mp) at current factor cost for FY02, FY03, FY04, FY05, FY06 and FY07 in million Rs amounts to 4401699, 4822842, 5532663, 6547590, 7713064, and 8707000 respectively Note 2: For GDP data of 2001-02 to 2005-06, source is PRSP Annual Report 2005-06. For GDP data of 2006-07, source is Economic Adviser’s Wing, Finance Division, 2008
Table 4.2: Actual PRSP expenditure 2006-07
Sectors Actual Expenditure
Actual as % of GDP
Roads, highways & bridges 60003 0.69 Water supply and sanitation 16619 0.19 Education 162084 1.86 Health 53166 0.61 Population planning 7002 0.08 Social security and welfare 4513 0.05 Natural calamities 5008 0.06 Irrigation 74771 0.86 Land reclamation 2348 0.03 Rural development 22175 0.25 Rural electrification 2499 0.03

20
Food subsidies 5455 0.06 Food support programme 3458 0.04 Tawana Pakistan 20 0 Low cost housing 299 0 Administration of justice 5081 0.06 Law & order 72983 0.84
Total 497484 5.71
Source: PRSP Secretariat, Finance Division, Islamabad 4.3 The PRSP expenditures as percentage of GDP have shown an upward trend over the past six years (2001-02: 3.8%, 2002-03: 4.32%, 2003-04: 4.72%, 2004-05: 4.83%, 2005-06: 5.63%, and 2006-07: 5.71%). The sectors where PRSP expenditures as percentage of GDP in FY07 surpassed those in FY06 include water supply and sanitation, education, health, irrigation, rural development, rural electrification, and law and order (Table 4.3). For roads, highways and bridges, and food support programme the PRSP expenditures as percentage of GDP remained the same in FY07 as in FY06. In the remaining sectors PRSP expenditures as percentage of GDP declined in FY07 as compared to FY06. One reason behind this decline is high GDP growth in FY07 which resulted in a GDP of Rs 8707 billion and hence reduced the ratios with the GDP. 4.4 The overall PRSP expenditures have shown a respectable increase of 24.7%, 25.3%, 21.0%, 37.4% and 14.5% for FY03 over FY02, FY04 over FY03, FY05 over FY04, FY06 over FY05, and FY07 over FY06 respectively (Table 4.4). During FY07 PRSP expenditures stood at Rs 497,484 million recording an increase of Rs 62,893 million compared to FY06. An increase in expenditures occurred in all pro-poor expenditures between FY06 and FY07 except in population planning, social security & welfare, natural calamities, rural development, low cost housing, and administration of justice, which witnessed a decline of 31.6%, 40.4%, 73.9%, 12.2%, 9.4%, 2.0% and 10.0% respectively between FY06 and FY07.
Table 4.3: Budgetary Poverty Related Expenditures by Sectors as % of GDP 2001-02 2002-03 2003-04 2004-05 2005-06 2006-07 Roads, highways & bridges 0.14 0.27 0.41 0.54 0.69 0.69 Water supply and sanitation 0.11 0.07 0.1 0.1 0.13 0.19 Education 1.51 1.63 1.77 1.78 1.84 1.86 Health 0.44 0.46 0.49 0.48 0.51 0.61 Population Planning 0.03 0.06 0.08 0.07 0.13 0.08 Social security & welfare 0.08 0.03 0.07 0.03 0.1 0.05 Natural Calamities 0 0.01 0.01 0.01 0.25 0.06 Irrigation 0.23 0.32 0.41 0.58 0.78 0.86 Land reclamation 0.04 0.04 0.04 0.03 0.03 0.03 Rural development 0.28 0.35 0.34 0.23 0.19 0.25 Rural electrification 0 0 0.03 0.07 0.01 0.03 Food subsidies 0.13 0.23 0.15 0.08 0.08 0.06 Food support programme 0.05 0.04 0.05 0.04 0.04 0.04 Tawana Pakistan 0.02 0.02 0.01 0 - 0

21
Low cost housing 0 0 0.01 0 0 0 Administration of justice 0.05 0.05 0.04 0.05 0.07 0.06 Law and order 0.7 0.75 0.71 0.72 0.77 0.84 Total 3.80 4.32 4.72 4.83 5.63 5.71
Source: PRSP Secretariat, Finance Division, Islamabad
Table 4.4: Budgetary Poverty Related Expenditures by Sectors, 2001-2007 Expenditures (million Rs) % Change
Sectors 2002-03
2003-04 2004-05 2005-06 2006-07
2001-02
2002-03
2003-04
2004-05
2005-06
2006-07
/2001-02
/2002-03
/2003-04
/2004-05
/2005-06
Roads, highways &
bridges
6340 13145 22746 35181 53248 60003 107.33
73.04 54.67 51.35 12.69
Water supply and sanitation
4644 3421 5799 6538 10338 16619 -26.34 69.51 12.74 58.12 60.76
Education 66290 78447 97697 116873 141702 162084 18.34 24.54 19.63 21.24 14.38 Health 19211 22368 27009 31426 39203 53166 16.43 20.75 16.35 24.75 35.62
Population Planning
1331 3120 4689 4578 10229 7002 134.41 50.29 -2.37 123.44 -31.55
Social security &
welfare
3664 1301 4144 2030 7575 4513 -64.49 218.52 -51.01 273.15 -40.42
Natural Calamities
189 410 529 922 19148 5008 116.93 29.02 74.29 1976.79 -73.85
Irrigation 10133 15535 22506 37871 59819 74771 53.31 44.87 68.27 57.95 25.00 Land
reclamation 1838 1733 2016 2111 2673 2348 -5.71 16.33 4.71 26.62 -12.16
Rural development
12325 16883 18607 15369 15040 22175 36.98 10.21 -17.40 -2.14 47.44
Rural electrificati-
on
0 0 1422 4354 1000 2499 0 0 206.16 -77.03 149.90
Food subsidies
5513 10859 8513 5359 6021 5455 96.97 -21.60 -37.05 12.35 -9.40
Food support
programme
2017 2017 2804 2703 3081 3458 0 39.02 -3.60 13.98 12.24
Tawana Pakistan
800 800 590 78 0 20 0 -26.25 -86.78 -100.00 -
Low cost housing
0 0 423 318 305 299 0 0 -24.82 -4.09 -1.97
Administrat-ion of justice
1981 2196 2437 3116 5642 5081 10.85 10.97 27.86 81.07 -9.94
Law and order
31004 36293 39370 47416 59567 72983 17.06 8.48 20.44 25.63 22.52
Total 167280 208528 261301 316243 434591 497484 24.66 25.31 21.03 37.42 14.47
Source: PRSP Secretariat, Finance Division, Islamabad

22
4.1 Provincial Patterns of PRSP Expenditures 4.5 The highest increase is observed in PRSP expenditures in Punjab, at 20% which is over 5% percentage points higher compared to the overall increase in the pro-poor expenditures in 2006-07, followed by Balochistan which witnessed an increase of 19%. There is an increase of 19% in PRSP expenditures in the Federal Government in the outgoing fiscal year. Sindh province witnessed an increase of 9% in pro-poor expenditures in FY07 relative to FY06. On the other hand, NWFP experienced a decrease of 6% in the PRSP expenditures during FY07 over that in FY06 which is the lowest compared to other provinces. The largest change in FY05 compared to FY04 in PRSP expenditures in the Federal Government was observed in rural development (225%), in Punjab in health (53%), in Sindh in water supply and sanitation (837%), in NWFP in social security & welfare (330%) and in Balochistan in rural development (133%). 4.6 Investment in education and health sectors as well as water supply and sanitation is critical for development of human capital and is a priority to assist poor people to get out of the vicious circle of poverty. Table 4.5 shows that change in education expenditure between FY07 and FY06 stands at 20.98% by the Federal Government. Sindh witnessed a decrease in education expenditure during this period. Change in health expenditures in FY07 relative to FY06 is highest in Punjab at 53.38%, followed by NWFP at 49.51% and lowest in Balochistan at 14.09%. Expenditure on water supply and sanitation increased in all provinces, particularly in Sindh between FY07 and FY06. Punjab is the only province which incurred expenditure under the head of low cost housing during the last two fiscal years and it declined by 44.82% in FY07 over FY06.
Table 4.5: PRSP % Change in Expenditures between 2006-07 and 2005-06 by Sector and Province Sectors Federal Punjab Sindh NWFP Balochistan Pakistan
Roads, highways & bridges 14.22 1.40 24.21 66.02 13.70 12.69Water supply and sanitation 77.36 1.27 836.59 48.33 30.22 60.76Education 20.98 27.64 -15.87 5.95 18.68 14.38Health 23.37 53.38 18.17 49.51 14.09 35.62Population Planning -37.36 33.30 35.64 -80.82 19.46 -31.55Social security & welfare -79.68 11.81 -53.04 329.87 13.85 -40.42Natural Calamities -4.20 -61.37 -70.74 -92.30 66.67 -73.85Irrigation 33.51 34.97 10.95 32.15 -26.03 25.00Land reclamation -100.00 10.99 -1.49 -100.00 - -12.16Rural development 225.23 2.46 -29.09 106.13 133.17 47.44Rural electrification 149.90 - - - - 149.90Food subsidies 10.55 -99.47 42.59 -44.44 - -9.40Food Support Programme -30.64 6.09 45.68 30.19 5.65 12.24Tawana Pakistan - - - - - -Low cost housing -100.00 -44.82 - - - -1.97Administration of justice 63.26 -42.77 31.12 -9.47 6.28 -9.94
23
Law and order 13.54 38.88 14.90 11.28 23.63 22.52 % change of total amount between FY06 and FY07 18.46 20.42 8.91 -5.95 18.95 14.47
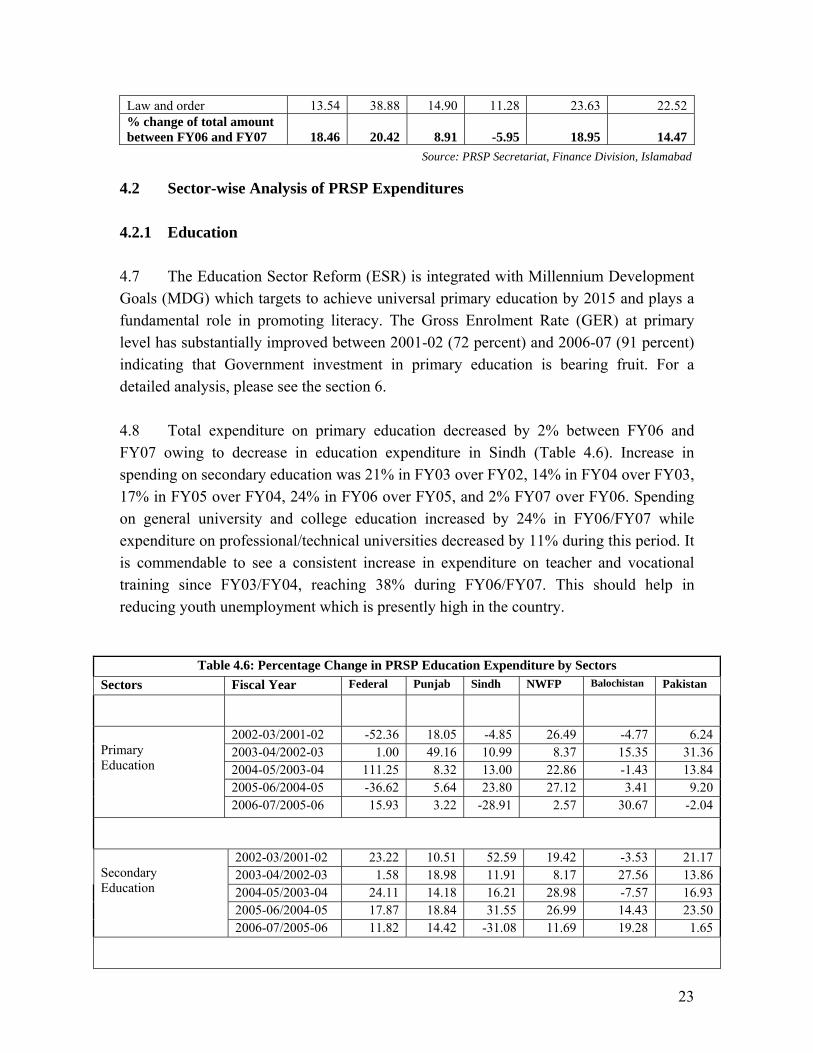
Source: PRSP Secretariat, Finance Division, Islamabad 4.2 Sector-wise Analysis of PRSP Expenditures 4.2.1 Education 4.7 The Education Sector Reform (ESR) is integrated with Millennium Development Goals (MDG) which targets to achieve universal primary education by 2015 and plays a fundamental role in promoting literacy. The Gross Enrolment Rate (GER) at primary level has substantially improved between 2001-02 (72 percent) and 2006-07 (91 percent) indicating that Government investment in primary education is bearing fruit. For a detailed analysis, please see the section 6. 4.8 Total expenditure on primary education decreased by 2% between FY06 and FY07 owing to decrease in education expenditure in Sindh (Table 4.6). Increase in spending on secondary education was 21% in FY03 over FY02, 14% in FY04 over FY03, 17% in FY05 over FY04, 24% in FY06 over FY05, and 2% FY07 over FY06. Spending on general university and college education increased by 24% in FY06/FY07 while expenditure on professional/technical universities decreased by 11% during this period. It is commendable to see a consistent increase in expenditure on teacher and vocational training since FY03/FY04, reaching 38% during FY06/FY07. This should help in reducing youth unemployment which is presently high in the country.
Table 4.6: Percentage Change in PRSP Education Expenditure by Sectors Sectors Fiscal Year Federal Punjab Sindh NWFP Balochistan Pakistan
Primary Education
2002-03/2001-02 -52.36 18.05 -4.85 26.49 -4.77 6.242003-04/2002-03 1.00 49.16 10.99 8.37 15.35 31.362004-05/2003-04 111.25 8.32 13.00 22.86 -1.43 13.842005-06/2004-05 -36.62 5.64 23.80 27.12 3.41 9.202006-07/2005-06 15.93 3.22 -28.91 2.57 30.67 -2.04
Secondary Education
2002-03/2001-02 23.22 10.51 52.59 19.42 -3.53 21.17 2003-04/2002-03 1.58 18.98 11.91 8.17 27.56 13.862004-05/2003-04 24.11 14.18 16.21 28.98 -7.57 16.932005-06/2004-05 17.87 18.84 31.55 26.99 14.43 23.502006-07/2005-06 11.82 14.42 -31.08 11.69 19.28 1.65

24
General University/ College Education
2002-03/2001-02 106.27 22.67 5.75 59.93 20.00 57.73 2003-04/2002-03 28.73 3.10 17.78 0.00 0.27 18.47 2004-05/2003-04 -18.43 22.01 22.62 4.80 4.21 -3.57 2005-06/2004-05 173.60 22.43 54.04 26.48 13.75 103.13 2006-07/2005-06 32.67 14.59 -6.97 -11.31 11.61 23.79
Professional/ Technical Universities
2002-03/2001-02 10.06 -20.75 6.50 17.74 47.52 6.072003-04/2002-03 29.85 30.89 3.62 7.63 25.48 21.082004-05/2003-04 320.30 -0.72 31.57 24.36 23.76 170.852005-06/2004-05 -56.05 82.28 19.14 42.54 5.73 -35.612006-07/2005-06 -15.64 3.97 -18.52 -6.05 20.33 -11.06
Teacher and Vocational Training
2002-03/2001-02 -69.99 -17.60 -43.66 26.32 54.27 -43.072003-04/2002-03 -90.49 126.43 4.17 66.67 -36.81 25.222004-05/2003-04 591.49 12.66 -7.09 -22.50 3.92 24.842005-06/2004-05 -86.15 9.61 25.42 -100.00 114.15 0.222006-07/2005-06 40.00 36.34 14.19 - -36.12 38.40
Other Educational Institutions
2002-03/2001-02 265.03 50.23 -22.20 218.31 74.73 89.40 2003-04/2002-03 22.02 122.93 88.29 -58.89 81.29 40.65 2004-05/2003-04 -12.59 46.08 -9.85 -55.62 62.33 12.47 2005-06/2004-05 83.46 2.57 85.95 27.39 -11.96 33.79 2006-07/2005-06 12.79 253.97 68.43 -20.52 13.40 98.59
Source: Civil Accounts
4.9 The share of expenditure on primary schooling in total education expenditure in FY02, FY03, FY04, FY05, FY06 and FY07 was 33%, 42%, 44%, 42%, 38% and 33% respectively, implying that the largest proportion of expenditures are incurred on primary education in Pakistan (Table 4.7). The second largest proportion of expenditures had been incurred on secondary education over the last six years, with the exception of FY07 in which expenditure on general university/ college education is 1% higher. During 2001-02 to 2006-07 the smallest proportion of education expenditure has been spent on teacher and vocational training, which is in a declining trend, even though this sector needs to be enhanced as vocational training imparts skills and hence generates employment. Distribution of education expenditure by provinces is similar to the pattern of overall expenditures. However the largest proportion of the federal education expenditure was allocated for general university/colleges during FY02 to FY07, with the exception of FY05 where federal expenditure on professional, technical and university education was the highest. 4.10 Development expenditure as percentage of total education expenditure increased every year during the past six years. During FY05, FY06 and FY07 the development education expenditure stood at 17.4%, 16.5% and 19.65 of the total education

25
expenditure respectively (Figure 1). The Federal Government spent the largest proportion of education expenditure on development (44.5%) in FY07 while NWFP province spent the lowest proportion (8.2%) followed by Balochistan (8.5%).
Figure: 1
Development Education Expenditure as % of Total Education Expenditure
0204060
2006-07 2005-06 2004-05
Years
%
FederalPunjab SindhNWFPBalochistanPakistan
Source: PRSP Secretariat, Finance Division, Islamabad
Table 4.7: Percentage Distribution of Education Expenditures by Province and Level of Education 2001-02 to
2006-07 Federal Punjab Sindh NWFP Balochistan Pakistan 2001-02 Primary Education 9.09 56.41 46.62 35.52 36.75 32.65 Secondary Education 10.78 24.9 32.25 32.32 28.32 28.51 General University/ College Education 49.16 9.75 9.34 6.78 8.43 19.94 Professional/Technical Universities 14.24 2.68 5.73 7.17 4.79 7.10 Teacher and Vocational Training 3.61 2.48 0.70 0.33 7.07 2.83 Other Educational Institutions 13.12 3.77 5.37 17.88 14.64 8.97 Total 100 100 100 100 100 100 2002-03 Primary Education 8.79 57.54 45.72 41.55 36.75 42.40 Secondary Education 11.94 24.27 33.81 35.73 28.32 25.81 General University/ College Education 47.36 9.98 8.33 7.16 8.43 16.19 Professional/Technical Universities 12.49 1.67 5.65 4.28 4.79 5.08 Teacher and Vocational Training 3.34 2.42 0.77 0.20 7.07 2.18 Other Educational Institutions 16.08 4.11 5.73 11.07 14.64 8.33 Total 100 100 100 100 100 100 2003-04 Primary Education 7.83 60.14 43.08 44.88 34.88 44.32 Secondary Education 10.25 21.35 32.61 38.52 29.66 24 General University/ College Education 50.81 7.3 8.26 7.14 6.83 15.27 Professional/Technical Universities 13.49 1.25 5.41 4.60 5.41 4.86 Teacher and Vocational Training 0.27 3.41 0.70 0.33 1.96 1.88 Other Educational Institutions 17.34 6.56 9.94 4.54 21.25 9.66 Total 100 100 100 100 100 100

26
2004-05
Primary Education 11.46 57.6 42.91 45.84 30.66 42.18 Secondary Education 8.81 21.56 33.41 41.30 24.44 23.46 General University/ College Education 28.7 7.88 8.93 6.22 6.35 12.31 Professional/Technical Universities 39.26 1.09 6.28 4.75 5.97 11 Teacher and Vocational Training 1.28 3.39 0.57 0.22 1.81 1.97 Other Educational Institutions 10.5 8.47 7.90 1.67 30.76 9.09 Total 100 100 100 100 100 100 2005-06 Primary Education 5.47 55.06 39.73 45.71 30.43 37.99 Secondary Education 7.82 23.18 32.87 41.14 26.85 23.89 General University/ College Education 59.1 8.73 10.29 6.17 6.93 20.62 Professional/Technical Universities 12.99 1.8 5.59 5.31 6.06 5.84 Teacher and Vocational Training 0.13 3.37 0.54 0 3.73 1.62 Other Educational Institutions 14.49 7.86 10.98 1.67 25.99 10.03 Total 100 100 100 100 100 100 2006-07 Primary Education 5.23 44.52 33.57 44.25 33.5 32.53 Secondary Education 7.22 20.77 26.92 43.36 26.98 21.23 General University/ College Education 64.81 7.83 11.37 5.16 6.52 22.32 Professional/Technical Universities 9.05 1.46 5.41 4.71 6.14 4.54 Teacher and Vocational Training 0.15 3.59 0.72 1.24 2 1.97 Other Educational Institutions 13.51 21.79 21.98 1.25 24.83 17.41 Total 100 100 100 100 100 100
Source: Civil Accounts
4.2.2 Health 4.11 The health expenditure showed a remarkable increase in mother and child care in FY07 Except for Balochistan, all provinces recorded an increase in expenditures on mother and child care in FY07 relative to FY06 (Table 4.8). However the largest proportion of health expenditure was spent on general hospital and clinics during the past six years (Table 4.9). 4.12 Figure 2 shows that development health expenditure as percentage of total health expenditure during FY05, FY06 and FY07 stood at 21.2%, 25% and 26.1% respectively, a considerable increase over time. The Federal Government spent a substantial amount of 51.4%, 54.6% and 57.7% on health development expenditure relative to total health expenditure during FY05, FY06 and FY07 respectively. The development health expenditure as percentage of total health expenditure during FY07 stood at 16.7 for Sindh, 15.5% for Punjab, 12.7 for NWFP and 6.2% for Balochistan.

27
Figure: 2 Development Health Expenditure as % of
Total Health Expenditure
0
50
100
2006-07 2005-06 2004-05
Years%
FederalPunjab SindhNWFPBalochistanPakistan
Source: PRSP Secretariat, Finance Division, Islamabad
Table 4.8: Percentage Change in PRSP Health Expenditures by Sectors
Fiscal Year Federal Punjab Sindh NWFP Balochistan Pakistan
General Hospitals & Clinics 2002-03/2001-02 7.28 24.97 4.87 10.82 -8.72 14.53
2003-04/2002-03 33.93 22.96 25.48 0.87 -3.05 21.08 2004-05/2003-04 9.64 7.35 2.67 44.73 48.75 11.99 2005-06/2004-05 55.9 14.32 56.08 9.03 -11.94 26.06 2006-07/2005-06 23.08 53.36 17.43 23.47 7.85 34.98
Mother & Child 2002-03/2001-02 0 41.94 0 -8.33 -71.43 3.39 2003-04/2002-03 0 20.45 0 9.09 -50 13.11 2004-05/2003-04 0 -97.96 - 8.33 1450 -23.08 2005-06/2004-05 50 6300 4300 15.38 -93.55 332 2006-07/2005-06 0 25 84.09 7046.67 -50 547.68
Health Facilities & Preventive Measures 2002-03/2001-02 30.42 92.86 6.28 9.3 84.68 28.43
2003-04/2002-03 4.43 125.93 -19.55 18.09 114.63 9.99 2004-05/2003-04 34.24 6.42 -5.56 239.63 -36.62 30.06 2005-06/2004-05 34.24 6.42 -5.56 239.63 -36.62 30.06 2006-07/2005-06 23.9 29.31 -55.5 54.76 23.88 20.75
Other Health Facilities 2002-03/2001-02 43.91 15.32 -16.92 23.35 5.11 14.91
2003-04/2002-03 -5.59 17.5 60.65 47.57 12.01 16.6 2004-05/2003-04 -4.46 33.2 141.48 22.7 -32 14.96 2005-06/2004-05 3.27 12.8 -14.72 -16.35 26.17 6.24 2006-07/2005-06 20.97 56.02 78.24 -36.22 17.52 38.97
Source: Civil Accounts

28
Table 4.9: Percentage Distribution of Health Expenditure by Province and Sector 2001-02 to 2006-07
Federal Punjab Sindh NWFP Balochistan Total
2001-02
General Hospitals and Clinics 41.9 86.6 81.9 87.5 45.4 71.8 Mother & Child 0.04 0.45 0 0.44 0.25 0.25 Health Facilities and Preventive Measures 48 0.6 10 3.2 12.9 15 Other Health Facilities 10.1 12.3 8.1 8.8 41.4 13 Total 100 100 100 100 100 100 2002-03 General Hospitals and Clinics 41 87.1 81.4 86.3 45.4 72.1 Mother & Child 0.04 0.47 0 0.49 0.25 0.27 Health Facilities and Preventive Measures 47.2 0.6 12.9 4.1 12.9 15 Other Health Facilities 11.8 11.9 5.7 9.1 41.4 12.6 Total 100 100 100 100 100 100 2003-04 General Hospitals and Clinics 43.75 87.71 89.37 82.22 32.34 72.29 Mother & Child 0.03 0.43 0 0.5 0.09 0.24 Health Facilities and Preventive Measures 46.17 1.16 4.36 4.62 21.13 14.67 Other Health Facilities 10.05 10.71 6.26 12.66 46.44 12.8 Total 100 100 100 100 100 100 2004-05 General Hospitals and Clinics 39.5 86.09 76.8 83.86 46.79 69.58 Mother & Child 0.02 0.01 0.06 0.38 1.43 0.16 Health Facilities and Preventive Measures 52.57 0.87 10.49 4.81 21.06 17.62 Other Health Facilities 7.91 13.04 12.66 10.95 30.72 12.64 Total 100 100 100 100 100 100 2005-06 General Hospitals and Clinics 43.87 85.91 83.75 77.89 44.11 70.32 Mother & Child 0.03 0.44 1.79 0.38 0.1 0.55 Health Facilities and Preventive Measures 50.28 0.8 6.92 13.93 14.29 18.37
Other Health Facilities 5.82 12.84 7.54 7.8 41.49 10.77 Total 100 100 100 100 100 100 2006-07 General Hospitals and Clinics 43.77 85.9 83.22 64.32 41.69 69.98 Mother & Child 0.02 0.36 2.78 17.92 0.04 2.63 Health Facilities and Preventive Measures 50.49 0.67 2.6 14.41 15.51 16.35 Other Health Facilities 5.7 13.05 11.37 3.32 42.73 11.03 Total 100 100 100 100 100 100
Source: Civil Accounts, Government of Pakistan 4.2.3 Rural Electrification 4.13 Low population densities and limited demand for electricity, along with high capital costs for expanding the network to rural areas, makes rural electrification unattractive. There was an increase of PRSP expenditure on rural electrification from Rs 1000 million in FY06 to Rs 2499 million in FY07, reflecting Government’s priority to

29
expand electricity supply to all rural areas. The government plans to electrify all the villages in the country by 2010. In order to attain this target, the village electrification programme has picked up speed. In the eight years prior to 2003/4, the number of villages electrified increased at an annual rate of only 3.3 percent; during that period 16,637 villages received electricity. In the three subsequent years, the rate of village electrification accelerated sharply to 11.6 percent per annum and provided electricity to 25,788 villages.

30
5 Direct Transfers 5.1 One pillar of the upcoming PRSP-II is titled ‘Targeting the poor and vulnerable’ and concerns encompassing backward regions into the mainstream of development and making progress in reducing existing inequalities’. Under the PRSP non-budgetary transfers, Zakat, Bait-ul-Mal, EOBI and micro-credit are main instruments to assist the needy. The amount of direct transfers and number of beneficiaries by type of transfers are given in Table 5.1. Total direct transfers in FY07 stood at Rs 22.3 billion, which were transferred to 5.4 million beneficiaries. Both the disbursement and number of beneficiaries have increased considerably since FY02. The largest increase, however, has been witnessed in micro-credit disbursement. The PRSP reports the disbursement of micro-credit through Khushali Bank, Pakistan Poverty Alleviation Fund (PPAF) and Zarai Taraqiati Bank Ltd (ZTBL). Micro-credit disbursement through these three sources has increased approximately ten times from Rs. 1049 million in FY02 to Rs. 9947 million in FY07. The number of beneficiaries has also increased from 100,000 in FY02 to 906,000 in FY07.
Table 5.1: Direct Transfers and Beneficiaries
Programme Disbursement/ beneficiaries
2001-02 2002-03 2003-04 2004-05 2005-06 2006-07
Zakat Amount disbursed (million Rs)
5254
8009 5330 3692 4520 ® 4611
Total beneficiaries (000) 1710 1754 1639 1370 2373 ® 2494 Pakistan Bait-ul-Mal (all programmes)*
Amount disbursed (million Rs)
- - 3159 3270 3838 4279
Total beneficiaries (000) - - 1614 1671 3130 1707 Micro-credit** Amount disbursed
(million Rs) 1049 2518 3034 5431 6655 9947
Total beneficiaries (000) 100 216 286 470 606 906 EOBI Amount disbursed
(million Rs) 1366 1592 1742 1929 2899 ® 3429
Total beneficiaries (000) 227 108 115 121 281 ® 290 All Programmes Amount disbursed
(million Rs) 7669 12119 13265 14322 17912 ® 22266
Total beneficiaries (000) 1810 2078 3654 3632 6390 ® 5397
Source: For Zakat: Ministry of Religious Affairs Zakat and Ushr, for Pakistan Bait-Ul-Mal: Ministry of Social Welfare and Special Education, for EOBI: Employees' Old Age Benefits Institution, Head Office Karachi * Includes Food Support Programme as given in budgetary expenditure **Comprise of Pakistan Poverty Alleviation Fund (PPAF), Khushali Bank and ZTBL 5.1 Zakat 5.2 As shown in Table 5.1, Zakat disbursement data for FY07 totaled Rs 4.6 billion. The number of beneficiaries has increased from 2.37 million in FY06 to 2.49 million in

31
FY07. Zakat disbursements were as high as Rs 8 billion in FY03. Zakat is disbursed under different programmes. During FY07, a large proportion of it, about 44.9% was disbursed through Guzara allowance, just as the case of the corresponding percentage of 45% disbursed in FY06. Proportion of Zakat disbursed through educational stipend (technical and non-technical) stood at 28.2% in FY07 and at 26.77% in FY06. Stipends to students to Deeni Madaris stood at 5.2% in FY07, as compared to 5.5% in FY07. Disbursement under health care amounted to Rs 177 million in FY07, making 3.9% of total Zakat disbursement, which in FY06 stood at 4.2%. About 2.56% of Zakat was disbursed under Social Welfare/ Rehabilitation in FY07, which stood at 2.63 % in FY06. About 2.8% of Zakat was spent on marriage assistance in FY07, which stood at 2.9% in FY06. About 62.3% of Zakat disbursements were made in Punjab, 15.1% in Sindh, 15.7% in NWFP, 4.7% in Balochistan, 1.3% in ICT and 0.9% in Northern areas in FY07.
Table 5.2: Details of Zakat Programmes 2006-07
Sr.# Amount Released No. of Beneficiaries (a) Regular Zakat Programmes 1 Guzara Allowance
Educational Stipends Stipends for Students of Deeni Madaris Health Care Social Welfare Rehabilitation Marriage Assistance to unmarried women Sub Total
2 3 4 5 6 3,283,669 1,713,364 (b) Other Zakat Programmes 1 Eid Grant
Leprosy Patients Emergency Relief / Natural Calamities National Level Health Institutions National Level Deeni Madaris Sub Total
2 3 4 5 566,934 722,816 (c) Special Zakat Programmes 1 Educational Stipends (Technical)
Permanent Rehabilitation Scheme Sub Total
2 760,691 57,461 Grand Total 4,611,294 2,493,641
Source: Ministry of Religious Affairs Zakat and Ushr 5.2 Pakistan Bait-ul-Mal (PBM) 5.3 Amount disbursed by PBM increased from Rs 3.83 billion in FY06 to Rs 4.28 billion in FY07, benefiting around 1.7 million households (Table 5.3). Food Support Programme is part of PRSP budgetary expenditures. The overall disbursement through PBM has steadily increased from Rs 3.16 billion in FY04 to Rs 3.27 billion in FY05, and then from Rs 3.84 billion in FY06 to Rs 4.28 billion in FY07. PBM disburses to the needy under the following programmes and schemes: Food Support Programme (FSP), Individual Financial Assistance (IFA), Institutional Rehabilitation through Civil Society

32
Wing (CSW), National Centre for Rehabilitation of Child Labour (NCRCL), Vocational Training Institutes/ Dastakari Schools (VTIs) and Management Information System (MIS). 5.4 Food Support Programme is the largest programme of PBM. Its total disbursement increased Rs 3.1 billion in FY06 to Rs 3.5 billion in FY07, benefiting 1.5 million households. Disbursement under individual financial assistance was Rs 382 million. Disbursements under national centres for rehabilitation of child labour increased to Rs 204 million. Disbursement under vocational training centres was Rs 51 million in FY07. Disbursement under institutional rehabilitation was Rs 94 million in FY07.
Table 5.3: Programmes of Pakistan Bait-Ul-Mal (Million Rs)
Programme
FY 2005-06 FY 2006-07 Amount
disbursed Households Amount
disbursed Households
Food Support Programme* 3,081 1,460,000 3,548 1,460,000 Individual Financial Assistance 450 27,229 382 20,202 National Centres for Rehabilitation of Child Labour
139 13,440 204 15,006
Vocational Training Centres 71 13,156 51 193,981 Institutional Rehabilitation (Grant-In-Aid to NGOs)
97 1,615,938 94 17,516
Total Disbursement Under All Programmes
3,838 3,129,763 4,279 1,706,705
Source: Ministry of Social Welfare and Special Education. * Food Support Programme is included in PRSP budgetary expenditures also. 5.3 Micro-credit 5.5 Micro-credit is recognized as an effective tool to pull the poor and vulnerable out of poverty and vulnerability. Since FY02, as shown above in Table 5.1, micro-credit disbursement as increased consistently from Rs 1 billion in FY02 to Rs 6.6 billion in FY06, and further to Rs 9.9 billion in FY07. During the same period, number of beneficiaries increased from 100 thousand in FY02, to 606 thousand in FY06, and to 906 thousand in FY07.

33
Table 5.4: Micro-credit Disbursement (Million Rs)
2004-05 2005-06 2006-07 Pakistan Poverty Alleviation Fund (PPAF)
Amount disbursed 3106 3706 6228 No of districts 79 79 85 No of male beneficiaries (000) 158 202 302 No of female beneficiaries (000) 87 130 267 Total beneficiaries (000) 245 332 569
Khushali Bank Amount disbursed 2277 2922 3719 No of male beneficiaries (000) 174 229 286 No of female beneficiaries (000) 49 44 51 Total beneficiaries (000) 223 273 337
ZTBL* Amount disbursed 48 28 - No of male beneficiaries (000) 2 0.7 - No of female beneficiaries (000) 1 0.4 - Total beneficiaries (000) 2 1.2 -
Micro-credit Total credit 5431 6655 9947 Total male beneficiaries (000) 333 433 588 Total female beneficiaries (000) 137 174 318 Total beneficiaries (000) 470 606 906
Source: Pakistan Poverty Alleviation Fund; Khushali Bank & ZTBL. * Loan disbursements under micro-credit schemes for self-employment purposes under ZTBL have been stopped wef 2006-07 since a number of other banks/ organizations are already looking after such credit needs throughout the country. 5.6 In FY05, 62.6% of the total micro-credit disbursement was through the PPAF while the share of Khushali Bank was around 37.4%. Almost half (46.9%) of the borrowers in the PPAF disbursement during FY07 were females while the percentage was 15.1% in the case of Khushali Bank. Access to micro-credit seems to be one of major factors contributing to household well-being. PPAF activities are spread in 79 districts. Despite the progress made in the expansion of micro-credit through PPAF, Khushali Bank and other organizations, coverage of the poor population is still low. There is a need to enhance further micro-credit facilities in Pakistan, so that it can cater to all the poor and needy persons in the country.
Figure 3: Share of Micro-credit Disbursement, 2006-07
Source: PRSP Secretariat, Finance Division, Islamabad
37.4%
62.6%
Khushali BankPPAF

34
Khushal Pakistan Programmes/ Khushal Pakistan Fund:
Khushal Pakistan Programmes (KPP) 1 and 2 are rural works programme under the Public Sector Development Programme (PSDP) for initiating small development schemes and generating temporary employment throughout the country. Development activities are executed through Federal, Provincial
Executing Agencies and District Governments. Total allocations to KPP-1 and KPP-2 in FY07 were Rs.4.42 billion and Rs.20 billion respectively. Under the Khushal Pakistan Programme (KPP-I), 3531 development
schemes were approved during FY07. These schemes were village electrification (1292), roads (1091), water supply (488), education (104)), sanitation (244), health (77), gas (63), bulldozer hours (8), etc. Of
these schemes, 57.69% funds were released to Punjab, 17.73 to FATA, 11.47% to NWFP, 9.4% to Sindh, 3.48% to Balochistan and 0.23% to ICT.
These development schemes also generate temporary employment. Number of jobs created under KPP-I during FY 2006-07 amounted to 275,653. Benefits of these jobs reached about 17.2 million people. The jobs
were primarily generated in Sindh and Punjab with 40% and 27% respectively. Estimates for employment generation by Khushal Pakistan Programme during 2002-2007 stood at 5.5 million benefiting a population
of 76.9 million. During 2002-2007, 41% employment was generated in Sindh and 35% in Punjab (Tables 15 and 16). The Khushal Pakistan Fund also had a budget allocation of Rs. 10 billion in FY 2006-07.
5.4 Employees Old Age Benefit Institution (EOBI) 5.7 The objective of EOBI is to provide subsistence pensions to Pakistani workers who retire after completing a minimum number of years of insurable employment. The institution was established in 1976, with the core objective of providing monetary benefits as pension to the workers of private industrial and commercial establishments across the country. 5.3 Disbursement through Employees Old Age Benefit Institution (EOBI) increased from Rs 1.9 billion during FY05, to Rs 2.9 billion in FY06 and to Rs 3.4 in FY07, with the number of beneficiaries increasing from 129,000 in FY06 to 290,000 during FY07.
Box: Other Special Programmes / Schemes for Poverty Reduction
Table 5.5: Khushal Pakistan Programme-I Table 5.6: Khushal Pakistan Programme-I Temporary Employment Generated 2006-07 Temporary Employment Generated 2002-07 Provinces Jobs Created
(Man-Days) Population Benefited
Punjab 489,812 6,853,648 Sindh 727,296 5,109,681 NWFP 339,773 3,538,556 Balochistan 46,638 312,574 FATA 203,726 728,981 ICT 20,621 626,472 Total 1,827,866 17,169,912
Provinces Jobs Created (Man-Days)
Population Benefited
Punjab 1,944,399 27,415,422 Sindh 2,270,140 32,485,297 NWFP 828,498 12,909,946 Balochistan 106,003 14,315,388 FATA 299,486 1,888,435 ICT 53,326 804,556 Total 5,501,852 76,909,098

35
Khushal Pakistan Programme- I (KPP-I) Table 5.7: Number of Schemes Approved Under Each Category for 2006-07
Province Road Electrification Gas Education Health Water Supply Sanitation Bulldozers Total
SchemesPunjab 723 991 53 20 6 28 216 - 2037 Sindh 116 85 9 52 41 11 18 - 332 NWFP 155 175 - 8 2 61 1 3 405 Balochistan 21 15 - 8 2 64 8 5 123 FATA 75 22 - 14 26 488 1 - 626 ICT 1 4 1 2 - - - - 8 Total* 1091 1292 63 104 77 652 244 8 3531

36
6 Monitoring the PRSP Intermediate Indicators 6.1 This section presents a brief review of the programs related to education and health sectors and performance of some intermediate indicators related to these sectors. Recent information on land distributed among the poor households has also been analyzed below. 6.1 Education sector 6.1.1 A Brief Review of Programs in the Education Sector9 6.2 Government of Pakistan has taken several steps towards improving the quality of education within the country. At the policy level, National Education Policy (NEP) review was approved in January 2005 to be completed in three phases starting in September 2005 to December 2007. Recently, Ministry of Education published a pre- policy document titled “Education in Pakistan: A white Paper” and distributed it to all the stakeholders for comments. Another step towards strengthening the policy framework is the timely publication of National Education Census (NEC). In the past the education sector suffered from gaps in availability of authentic information constraining the government to devise sound policy framework. 6.3 To improve the quality of education at the institutional level government has launched a comprehensive reform program. Under the curriculum reform program, the objective was to review and revise the existing curriculum according to the needs of today’s world. Curriculum of 11 core subjects has so far been developed and notified to be implemented from the academic session 2007. 6.4 Reforming examination system is another part of the overall reform process. The purpose is to ensure uniform academic session stating from September 1st throughout the country, free education up to Matriculation, composite examination at the secondary level throughout the country from 2007, and English language has been made compulsory from Class-1 onwards. To facilitate these changes in the education system simultaneous training programs were launched to train the teachers to facilitate these changes in every level of education provision. 6.5 To bring the madrassas into mainstream education system within the country government of Pakistan launched in 2002-03 a Madrassa Reform Program introducing
9 Source: Economic Survey of Pakistan 2006-07

37
formal subjects in their curricula for the period of 5 years at a capital cost of Rs. 5759.395 million. The main feature of the Education Sector program reform agenda is a strategy for a holistic approach to education, including all areas of EFA and entailing legislative, administrative and financial actions at all levels. 6.6 Several other initiatives like establishment of National Education Assessment System (NEAS) aiming to improve the quality of education at the elementary level, establishment and operation of 82000 Basic Education and Literacy Authority (BELA) till 2011, formulating text book policy, and establishment of National Commission for Human Development (NCHD) are a part of the multi-pronged strategy to make the existing education system more effective and efficient. 6.1.2 Functional Schools 6.7 Education intermediate indicators discussed under this subsection include functional public schools, basic facilities in public schools, posts filled against sanctioned posts in public school and percentage of trained teachers in these schools. Number of functional public primary (including mosque schools) and middle schools in Pakistan and regions are reported in Table 6.1. Total number of functional public schools observed a decline since FY04; they declined by 3,983 schools, from 147,620 in FY04 to 143,637 in FY06. This decline in functional schools is the result of 3.6% decline in primary schools in FY06 relative to FY04, whereas middle schools during the same period increased by 6.2%. It appears that many primary schools have been upgraded to the middle level. But again in the FY 07, total number of functional public schools shows an upward trend and has increased to 154,361 schools. This improved mainly due to the 7.9% increase in the primary schools and middle schools has also been increased by 3.8% in the FY 07 as compared to FY 06. 6.8 Punjab being the most populous province also has the largest number of functional schools, which were 59,111 in FY 07. It is encouraging to see an increase of 1%, 10%, 5%, 3% and 6% in number of functional schools in Punjab, Sindh, NWFP, Balochistan and Islamabad in FY07 relative to FY04, which will assist in improving education sector outcome indicators. FANA and FATA both observed an increase of 8% in number of functional schools in FY07 compared to FY04. Only AJK witnessed a decline of 3% in total number of functional schools in FY07 as compared to FY04.

38
Table 6.1: Number of Functional Public Schools
Region/Province Year Primary Middle Total
Pakistan
2003-04 (A) 133,952 13,668 147,620 2004-05 (A) 127,040 14,146 141,186 2005-06 (A) 129,115 14,522 143,637 2006-07 (E) 139,290 15,071 154,361
Punjab
2003-04 (A) 51,698 6,801 58,499 2004-05 (A) 50,268 7,174 57,442 2005-06 (A) 50,450 7,357 57807 2006-07 (E) 51,725 7,386 59,111
Sindh
2003-04 (A) 40,121 2,373 42,494 2004-05 (A) 34,633 2,104 36,737 2005-06 (A) 36,662 2,244 38,906 2006-07 (E) 44,500 2,301 46,801
NWFP
2003-04 (A) 21,993 2,053 24,046 2004-05 (A) 22,024 2,385 24,409 2005-06 (A) 22,183 2,416 24,599 2006-07 (E) 22,759 2,456 25,215
Balochistan
2003-04 (A) 10,087 774 10,861 2004-05 (A) 10,282 772 11,054 2005-06 (A) 9,910 780 10,690 2006-07 (E) 10,341 862 11,203
AJK
2003-04 (A) 4,374 988 5,362 2004-05 (A) 4,053 1,032 5,085 2005-06 (A) 4,074 1,030 5,104 2006-07 (E) 3,844 1,344 5,188
FANA
2003-04 (A) 1,231 221 1,452 2004-05 (A) 1,253 223 1,476 2005-06 (A) 1,277 243 1,520 2006-07 (E) 1,319 245 1,564
FATA
2003-04 (A) 4,238 404 4,642 2004-05 (A) 4,318 402 4,720 2005-06 (A) 4,350 398 4,748 2006-07 (E) 4,575 423 4,998
Islamabad
2003-04 (A) 210 54 264 2004-05 (A) 209 54 263 2005-06 (A) 209 54 263
2006-07 (E) 227 54 281 A= Actual data , E= Estimated data
Source: Pakistan Education Statistics, 2005-06, NEMIS, Academy of Educational Planning and Management, Ministry of Education Note: Mosque schools are included in primary schools

39
6.1.3 Posts Filled Against Sanctioned Posts in Public Schools 6.9 Table 6.2 explains posts filled against sanctioned posts in public schools in Pakistan and regions for male and female teachers and percentage of trained teachers for male and female in Pakistan and regions. Posts filled against sanctioned posts in public schools in NWFP, Balochistan and FATA were more than 90%. In these regions percentage of posts filled against sanctioned posts were higher for males relative to females. In Punjab more than 80% positions were filled against sanctioned posts. In Islamabad about 19%-23% posts were vacant against sanctioned posts in FY05. 6.1.4 Trained Teachers in Public Schools 6.10 Table 6.2 also gives data on percentage of trained teachers in primary and middle schools. Public schools are doing well in terms of percentage of trained teachers, as 100% teachers male as well as female were trained in Punjab and NWFP in FY06.A slight decline in the percentage of trained teachers is observed in Sindh and AJK. In Balochistan and FANA percentage of trained teachers declined sharply in FY06 compared to FY05, most probably due to recruitment of untrained teachers. Percentage of trained teachers is 100 % only for middle level in FATA during the FY06.
Table 6.2: Actual Posts Filled Against Sanctioned Posts and Percentage of Trained Teachers (%)
Region / Province
Years Level Actual Posts Filled Against Sanctioned Posts %*
Percentage of Trained Teachers*
Male Female Total Male Female Pakistan 2003-04 Primary NA NA NA 98.66 98.73 Middle NA NA NA 99.21 99.22 2004-05 Primary NA NA NA 99.36 99.6 Middle NA NA NA 99.17 99.29 2005-06 Primary NA NA NA 93.42 94.68 Middle NA NA NA 89.29 96.08 Punjab 2003-04 Primary 86.66 87.32 86.94 100 100 Middle 81.83 77.86 79.61 100 100 2004-05 Primary 87.89 89.35 88.51 100 100 Middle 80.99 77.68 79.15 100 100 2005-06 Primary NA NA NA 100 100 Middle NA NA NA 100 100 Sindh 2003-04 Primary NA NA NA 96.59 95.93 Middle NA NA NA 95.46 96.89 2004-05 Primary NA NA NA 98.67 98.91 Middle NA NA NA 98.98 97.63

40
2005-06 Primary NA NA NA 96.72 96.31 Middle NA NA NA 96.31 96.05 NWFP 2003-04 Primary 98 95.38 97.12 NA NA Middle 88.08 73.76 83.12 NA NA 2004-05 Primary 98.07 95.86 97.32 100 100 Middle 91.4 79.67 87.11 100 100 2005-06 Primary NA NA NA 100 100 Middle NA NA NA 100 100 Balochistan 2003-04 Primary 97.92 96.56 97.53 100 100 Middle 91.17 85.76 89.48 100 100 2004-05 Primary 98.32 99.12 98.57 98.38 99.93 Middle 88.31 86.87 87.87 95.29 97.76 2005-06 Primary NA NA NA 49.87 47.3 Middle NA NA NA 47.19 43.82 AJK 2003-04 Primary NA NA NA 96.56 87.43 Middle NA NA NA 95.84 91.73 2004-05 Primary NA NA NA 87.47 96.56 Middle NA NA NA 91.73 95.84 2005-06 Primary NA NA NA 91.75 81.3 Middle NA NA NA 92.61 85.58 FANA 2003-04 Primary NA NA NA 100 100 Middle NA NA NA 100 100 2004-05 Primary NA NA NA 100 100 Middle NA NA NA 100 100 2005-06 Primary NA NA NA 67.87 50.72 Middle NA NA NA 85.7 76.04 FATA 2003-04 Primary 99.65 99.17 99.47 94.64 97.68 Middle 96.79 95.06 96.33 97.68 98.81 2004-05 Primary 99.59 96.34 98.35 99.9 99.96 Middle 98.35 90.13 96.18 100 99.68 2005-06 Primary NA NA NA 98.95 95.14 Middle NA NA NA 100 100 Islamabad 2003-04 Primary NA NA NA 99.57 99.79 Middle NA NA NA 100 99.75 2004-05 Primary 74.6 82.1 80.1 100 99.1 Middle 81.9 77.9 79.3 100 100 2005-06 Primary NA NA NA 93.29 97.5 Middle NA NA NA 97.2 98.4
NA = Not available * Data for the FY 2006-07 has not been provided by Ministry of Education. Source: Ministry of Education
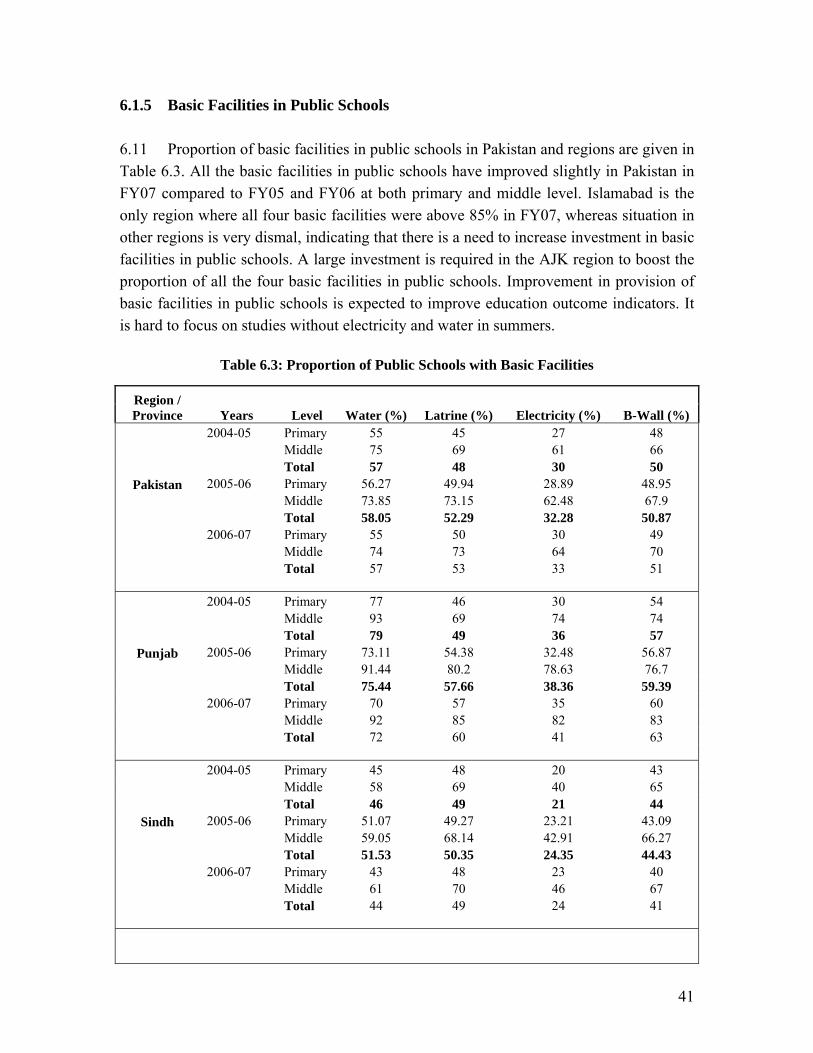
41
6.1.5 Basic Facilities in Public Schools 6.11 Proportion of basic facilities in public schools in Pakistan and regions are given in Table 6.3. All the basic facilities in public schools have improved slightly in Pakistan in FY07 compared to FY05 and FY06 at both primary and middle level. Islamabad is the only region where all four basic facilities were above 85% in FY07, whereas situation in other regions is very dismal, indicating that there is a need to increase investment in basic facilities in public schools. A large investment is required in the AJK region to boost the proportion of all the four basic facilities in public schools. Improvement in provision of basic facilities in public schools is expected to improve education outcome indicators. It is hard to focus on studies without electricity and water in summers.
Table 6.3: Proportion of Public Schools with Basic Facilities
Region / Province Years Level Water (%) Latrine (%) Electricity (%) B-Wall (%)
Pakistan
2004-05 Primary 55 45 27 48 Middle 75 69 61 66 Total 57 48 30 50 2005-06 Primary 56.27 49.94 28.89 48.95 Middle 73.85 73.15 62.48 67.9 Total 58.05 52.29 32.28 50.87 2006-07 Primary 55 50 30 49 Middle 74 73 64 70 Total 57 53 33 51
Punjab
2004-05 Primary 77 46 30 54 Middle 93 69 74 74 Total 79 49 36 57 2005-06 Primary 73.11 54.38 32.48 56.87 Middle 91.44 80.2 78.63 76.7 Total 75.44 57.66 38.36 59.39 2006-07 Primary 70 57 35 60 Middle 92 85 82 83 Total 72 60 41 63
Sindh
2004-05 Primary 45 48 20 43 Middle 58 69 40 65 Total 46 49 21 44 2005-06 Primary 51.07 49.27 23.21 43.09 Middle 59.05 68.14 42.91 66.27 Total 51.53 50.35 24.35 44.43 2006-07 Primary 43 48 23 40 Middle 61 70 46 67 Total 44 49 24 41

42
NWFP
2004-05 Primary 49 57 35 58 Middle 61 75 55 64 Total 50 59 37 58 2005-06 Primary 53.89 61 36.97 57.8 Middle 64.65 77.07 58.69 66.97 Total 54.95 62.58 39.1 58.7 2006-07 Primary 54 62 39 60 Middle 67 78 60 70 Total 55 64 41 61
Balochistan
2004-05 Primary 15 19 11 26 Middle 39 49 34 60 Total 17 21 12 29 2005-06 Primary 23.14 19.54 13.21 26.52 Middle 45 48.33 37.44 57.44 Total 24.73 21.64 14.98 28.77 2006-07 Primary 61 23 14 29 Middle 68 54 41 62 Total 62 26 16 31
AJK
2004-05 Primary 23 33 11 10 Middle 43 68 32 15 Total 27 40 15 11 2005-06 Primary 19.07 26.71 9.82 8.35 Middle 37.18 47.18 13.5 13.98 Total 22.73 30.84 10.56 9.48 2006-07 Primary 14 15 9 7 Middle 24 20 20 10 Total 17 17 12 8
FANA
2004-05 Primary 33 26 25 36 Middle 65 70 62 60 Total 38 33 31 40 2005-06 Primary 19.58 30.38 30.93 37.82 Middle 36.21 54.32 57.2 51.44 Total 22.24 34.21 35.13 40 2006-07 Primary 29 28 27 35 Middle 47 45 51 49 Total 31 30 31 37
FATA
2004-05 Primary 37 41 45 52 Middle 55 70 71 85 Total 39 44 47 54 2005-06 Primary 36.37 42.71 43.47 51.56 Middle 59.55 73.12 71.36 86.68 Total 38.31 45.26 45.81 54.51 2006-07 Primary 35 41 42 53 Middle 58 76 68 90 Total 37 44 44 56

43
Islamabad
2004-05 Primary 93 92 95 93 Middle 98 91 100 87 Total 94 92 96 92 2005-06 Primary 92.34 89.47 98.09 95.22 Middle 96.3 85.19 100 94.44 Total 93.16 88.59 98.48 95.06 2006-07 Primary 90 89 98 96 Middle 96 85 100 94
Total 91 89 98 95 Note: Mosque schools are included in primary schools. *Figures for the year 2006-07 are based on estimation. Source: Pakistan Education Statistics, 2005-06, NEMIS, Academy of Educational Planning and Management, Ministry of Education. 6.2 Health sector 6.2.1 A Brief Review of Programs in Health Sector 6.12 The government views health sector interventions as part of a comprehensive poverty alleviation plan. A National Health Policy Unit (NHPU) has been established under the Ministry of Health to serve the strategic function of reviewing, refining and reformulating the national health policy with identification of cost effective pro-poor policy interventions. The unit will advise on strategy and resource allocation, it will monitor and evaluate strategies across the entire health centre, and ensure that national policies react quickly to the emerging data and evidence. Government has introduced several programs to provide better health facilities and health care coverage which ensures that the medical needs of the poor will not be overlooked. The project “National Health Surveillance System” is under approval of Government of Pakistan and will be launched soon. 6.13 The National Maternal & Child Health (MCH) Program has recently been launched in order to improve the accessibility of effective MNH services for all, particularly the poor and the disadvantaged. It will provide improved access to high quality MCH and FP services, induce 10,000 community skilled birth attendants, provide comprehensive EmONC services in 275 hospitals/ health facilities, provide basic EmONC services in 550 health facilities, provide family planning services in all health outlets, train 15,000 health facility staff on IMNCI, create a demand for MCH services (especially for the poor), innovate and test alternate management arrangements for strengthening provincial and district MCH programs, build strategic partnership to enhance the role of NGOs and private sector, and provide evidence-based program management and capacity building.

44
6.14 A nutrition program has been launched implementing interventions to address the issues of low birth-weight babies, maternal and child malnutrition, deficiency of micronutrients, and to promote breast feeding. The National Nutrition Program has been strengthened, especially in its components of breast-feeding, fortification, and provision of vitamin A, iron, and iodine. The last Nutrition Survey was accomplished in 2001. It is expected that Nutrition survey will be conducted in 2009 and its report will be available in 2010. This will fulfill a long felt need for updated information on a key sector like Nutrition which impinges on the health of infants and mothers alike. 6.15 The TB-DOTS program is integrated in district health systems. The LHWs, health staff, NGO workers and community volunteers undertake DOT. The DOTS expansion as of mid-2003 resulted in detection of 20 percent cases and a treatment success rate of 77 percent. Technical guidelines and training modules are in place. The TB coordinators will receive necessary training at different levels. The government is instituting a strategic plan that will include the expansion of the laboratory network, development of guidelines for quality assurance of sputum microscopy, and the establishment of a system of annual feedback from the districts, where TB-DOTS interventions are already showing visible results as (indicated by the recent reports of STOP-T.B. Coordination Board reviews). 6.2.2 Monitoring Health Indicators: Immunization 6.16 In the health sector, data on immunization and coverage of the lady health workers (LHWs) program are available. TT-1 and TT-2 immunization coverage of pregnant women in FY06 and FY07 is shown in Table 6.4. At the national level TT-1 immunization coverage decreased by 2 percentage points to 49% and TT-2 immunization coverage decreased by 3 percentage points to 51% in FY07 compared to FY06. AJK has the highest coverage of TT-1 immunization at 61% and Capital Development Authority (CDA) has the lowest coverage at 16% in FY07. Except for AJK and FANA all regions experienced a decrease in coverage of TT-1 immunization in FY07. During the same period FATA also has the largest coverage of TT-2 immunization at 68%, whereas Balochistan and ICT have lower coverage at 29% and 33%, respectively.

45
Table 6.4: TT- Immunization Coverage for Pregnant Women
2004-05 2005-06 2006-07
TT-Immunization
TT-Immunization
TT-Immunization
Target Population
TT-1 TT2+ Target Population
TT-1 TT2+ Target Population
TT-1 TT2+
Province / Region
(+4.1% Pop) Cov%
Cov% (+4.1% Pop)
Cov%
Cov% (+4.1% Pop)
Cov% Cov%
Punjab 3,508,680 46 47 3,167,410 55 57 3,705,564 54 56 Sindh 1,426,182 43 48 1,328,073 52 58 1,531,062 47 49 NWFP 891,762 26 26 777,402 47 45 924,780 43 42 FATA 136,914 56 67 132,632 62 81 143,486 51 68
Balochistan 333,336 23 30 282,434 26 27 337,458 24 29
AJK 142,494 55 55 125,785 46 49 149,256 61 58 FANA 41,676 17 18 36,705 25 29 49,902 27 36
ICT 12,978 40 31 11,429 54 39 15,594 41 33 CDA 36,606 18 67 32,239 20 68 37,824 16 39
Others - - - - - - - - - Pakistan 6,530,628 42 44 5,894,109 51 55 6,894,924 49 51
Source: Federal EPI/CDD Cell, National Institute of Health 6.17 Data on the immunization of children for only Punjab, Sindh, NWFP and Balochistan is available. The coverage of DPT-3/OPV-3 immunization of children increased by 5 percentage points to 82% in FY 07 over FY06 (Table 6.5). The big increase in immunization coverage of DPT-3/OPV-3 took place in NWFP (10%) and decline in immunization coverage occurred in Balochistan (12%) in FY07 over FY06.
Table 6.5: DPT-3/OPV-3 Coverage of Children %
Region/Province 2004-05 (0-11 Months)
2005-06 (12-23 months)
2006-07 (12-23 months)
Punjab 70 82 88 Sindh 71 73 75 NWFP 75 69 79 FATA 70 - - Balochistan 51 70 58 AJK 92 - - FANA 39 - - ICT 56 - - CDA 38 - - Pakistan 70 77 82

46
6.2.3 Lady Health Workers 6.18 LHWs program was started in 1994 to provide basic health care services to the communities at their doorstep and to bridge the gap between communities and static health care services. It has proved to be a successful programme. LHWs at national level covered 52% of population and 66% of target population in FY07 (Table 6.6). About 32% of urban population and 54% of rural population was covered in FY07. LHWs at national level (National Programme and Rural Health Project) decreased by 1.6% to 91,355 in FY07 relative to FY06. During the same period, in urban areas LHWs decreased by 22% to 15,354 and in rural areas they increased by only 0.6% to 73,729 (Table 6.7). About 81% of total LHWs were deployed in rural areas and 17% in urban areas. Proportion of LHWs situated in Punjab, Sindh, NWFP and Balochistan stood at 51%, 22%, 15% and 6%, respectively.
Table 6.6: Coverage of Lady Health Workers (LHWs)
Projected 2006
Population Covered by LHWs in 2006 (%)
Projected 2007
Population Covered by LHWs in 2007 (%)
Total Population 158,014,555 57.7 158,014,555 52 Urban Population
52,873,250 40.9 47,404,367 32
Rural Population
105,141,305 66.1 110,610,189 54
Target Population
121,003,280 75.3 124,831,498 66
Source: Ministry of Health, National Programme for Family Planning & Primary Health Care
Table 6.7: Number of Lady Health Workers*
2004-05 2005-06 2006-07 Province Urban Rural Total Urban Rural Total Urban Rural Total Punjab 7,384 37,950 45,334 9,760 38,552 48,312 7,701 39,054 46,755Sindh 6,220 11,951 18,171 5,654 14,689 20,343 4,409 15,619 20,028NWFP 1,536 10,358 11,894 1,548 12,093 13,641 1,437 11,975 13,412Balochistan 745 4,420 5,165 880 4,769 5,649 1,476 4,448 5,924 AJK 176 2,253 2,429 175 2,115 2,290 173 2,294 2,467 FANA 184 1,063 1,247 172 801 973 124 918 1,042 FATA 0 1,414 1,414 1,362 0 1,362 0 1,436 1,436 ICT 51 237 288 39 240 279 34 257 291 Total 16,296 69,646 85,942 19,590 73,259 92,849 15,354 73,729 91,355
* Includes LHWs who are under training. Source: Ministry of Health, National Programme for Family Planning & Primary Health Care

47
6.3 Land Distribution 6.19 The Government of Pakistan has designed a programme to distribute the state land among the rural landless households. State land distributed by number of beneficiaries during FY02 to FY07 is given in Table 6.8. In FY02, 49.98 thousand acres of land was distributed among 2,694 beneficiaries in all provinces, in the later years this activity slowed down as during FY05, only 384 acres of land was distributed among 51 beneficiaries in Punjab. In FY06, 2.48 thousand acres of land was distributed among 543 beneficiaries in Punjab and Sindh.1,704 acres of land was distributed among 171 beneficiaries only in Punjab during the FY07.During the FY 06 and FY 07, 1466 katchi abadies were regularized in Punjab, Sindh and ICT.
Table 6.8: State Land Distribution by Number of Beneficiaries in Each Province
Punjab Sindh NWFP Balochistan Total 2001-02
Land (acres) 15,878 11,394 17619 5,089 49,980 Benficiaries (number) 1,386 1,127 24 157 2,694
2002-03 Land (acres) 3,260 4,241 0 0 7,501 Benficiaries (number) 330 490 0 0 820
2003-04 Land (acres) 3,452 0 0 0 3,452 Benficiaries (number) 354 0 0 0 354
2004-05 Land (acres) 384 0 0 0 384 Benficiaries (number) 51 0 0 0 51
2005-06 Land (acres) 1,010 1,465 0 0 2,475 Benficiaries (number) 326 217 0 0 543
2006-07 Land (acres) 1,704 0 0 0 1,704 Benficiaries (number) 171 0 0 0 171
Source: Federal Land Commission 6.5 Employment 6.21 The relationship between poverty reduction and productive employment is well established. Growth is the main source for employment generation, although several schemes are in progress in the country to provide support to unemployed labour force for self-employment. PRSP monitors trends in unemployment, based on the Labour Force Survey (LFS)10 data.
10 Conducted by Federal Bureau of Statistics

48
6.22 The age specific unemployment rate shows a typical U-shaped pattern (figure 4); higher rate for younger and older groups and lower for the prime age persons11 (Table 6.9). The interesting observation, however, is a visible fall in the unemployment rate in all age-groups in 2006-07 as compared to 2005-06except for 10-14 and 60+ age bracket. The decline in unemployment in the younger age groups is the result of aggressive education campaign of the government. Increasing enrolment in schools is reducing not only the incidence of child labour but their unemployment as well. The goal of universal primary education along with achieving other Millennium Development Goals (MDGs) is expected to contribute significantly in the withdrawal of working children from the labour market, thus reducing unemployment. 6.23 The incidence of unemployment rate in older age group is significantly high. A number of facilities and social services are being extended for senior citizens; absence of an adequate institutional mechanism of social protection is greatly felt. Table 6.9 shows that unemployment rate starts declining from the age group of 15-19 years till the age group of 55-59 and again start rising from the age group of 60+. The highest unemployment rate is observed in the age group of 10-14 i.e. 9.10 percent mainly due to lack of employment opportunities available to young children.
Figure-4: Age Specific Unemployment Rate 2006-07
02468
10121416
Overall(≥10
years)
10'-14 15-19 20- 24 25 - 29 30 - 34 35 - 39 40 - 44 45 - 49 50- 54 55- 59 ≥60
%
Source: Labour Force Survey 2006-07
Table 6.9: Age- Specific Unemployment Rate
Age groups years LFS 2003-04 LFS 2005-06 LFS 2006-07
Total Male Female Total Male Female Total Male Female Overall (≥10 years) 7.7 6.6 12.8 6.2 5.4 9.3 5.3 4.5 8.4 10'-14 12.8 13.6 10.4 7.9 8.8 5.71 9.1 10.7 5.7 15-19 13.2 12.8 14.9 10 10 9.9 8.4 8.4 8.4 20- 24 10.3 9.3 15 7.4 6.9 9.4 6.7 6.0 9.4 25 - 29 7.1 6.1 12.5 4.9 4.3 7.3 4.1 3.4 6.8 30 - 34 4.5 3.8 7.4 2.8 2.4 4.3 2.0 1.6 3.3 35 - 39 2.9 2 7.2 2.4 1.7 4.9 1.5 1.2 2.5 40 - 44 2.9 2.5 4.8 2.7 2 5.4 1.8 1.0 4.5 45 - 49 3.5 2.3 9.5 2.9 2 6 2.6 2.0 5.2 50- 54 5.1 3.5 12.2 6.3 4.5 14.5 4.8 3.0 12.4 55- 59 7.1 4.5 20.7 8.3 5.9 19.5 7.4 4.6 19.7 ≥60 12.8 8.9 36.1 11.6 7.2 34.1 13.7 9.6 34.6
Source: Labour Force Survey 2005-06 & 2006-07, Federal Bureau of Statistics 11 Those who fall between 25-49 years

49
Table 6.10: Unemployment Rate by Gender and Rural-Urban Areas
Source: Labour Force Survey 2003-04, 2005-06 & 2006-07 *T=Total M=Male F=Female 6.24 The overall unemployment rate has declined from 6.2% in 2005-06 to 5.3% in 2006-07. It is worth noting that in the beginning of the PRSP process (2001-02) overall unemployment rate was 8.3%. Thus during this process, unemployment rate has declined by 3 percentage points. This is the period when poverty also declined considerably in the country. It is encouraging to note that while unemployment between the 2001-02 and 2006-07 period declined primarily among females, the decline during the more recent period, 2005/06-2006/07, is among both sexes. Both male and female unemployment declined by only 0.9 percentage points. The unemployment rate in rural areas is lower than that of the urban areas. The urban unemployment rate has decreased by 3.14 percentage points during 2002-07 (Table 6.10). Female unemployment rate declined in rural as well as urban areas while for males a modest decline was observed in both rural as well as urban areas. The decline in female unemployment in rural and urban areas can be attributed to two reasons. Females were able to get job opportunities or they withdrew from the labour force mainly because of "discourage phenomenon". It thus appears that female unemployment reduced primarily due to expansion in job opportunities for females. Microfinance facilities focusing on women particularly in rural areas may be the major contributing factor in lower female unemployment rate.
Region 2001-02 2003-04 2005-06 2006-07
T* M F T M F T M F T M F
Rural 7.6 6.1 14.2 6.7 5.7 10.9 5.4 4.6 7.7 4.7 4 7.1
Urban 9.8 7.9 24.2 9.7 8.4 19.8 8 6.9 15.8 6.7 5.6 14.6 All Areas 8.3 6.7 16.5 7.7 6.6 12.8 6.2 5.4 9.3 5.3 4.5 8.4

50
7 Performance of the PRSP/MDG Indicators 7.1 PRSP progress reports have been regularly monitoring the performance of input, intermediate and outcome PRSP indicators primarily at the national level. In the previous report, for the year 2005-06, the Federal Bureau of Statistics (FBS) generated data through the PSLM 2004/05 household survey, representative at the district level. 7.2 One of the priorities in the PRSP is to help to improve these indicators while gradually increasing pro-poor expenditures. Improving social outcomes is as much an issue of increasing resources, as that of appropriately targeting and improving the efficacy of spending through improved governance. The focus here is on the literacy rate, primary and middle-level school enrolment, child immunization, pre-and post-natal consultation, tetanus toxoid injection, water supply and sanitation, housing and changes in economic situation (household perception). 7.1 Education Indicators 7.3 Literacy and primary school enrolment rates in Pakistan have shown improvement during last five years but they are still low compared with the countries of the region. A number of studies of the education system in Pakistan have revealed that the quality of education being provided by government primary schools is poor, with many schools lacking adequate teachers and resources. Basic objective of Government’s Education Policy is to expand and improve the quality of publicly provided primary education. The PRSP strategy for the sector includes, improving the functioning, utilization of existing schools, improving the quality of education, increase enrolment, improving access to education and expanding the primary education system. 7.1.1 Primary Schooling 7.4 For primary-level schooling two measures are commonly used: Gross Enrolment Rate (GER) and Net Enrolment Rate (NER). The GER sometimes referred to as the participation rate and is presented in two different ways: excluding and including the katchi class and for different age groups. 7.5 At the national level, GER12 at primary level for children 5-9 years old, excluding katchi class, was increased from 72% in 2001-02 to 91% in 2006-07, recording an increase of 19 percentage points. In urban areas GER increased from 91% in 2000-01 to 106% in 2006-07. Rural areas though have lower GER than urban areas, but it recorded an increase of 18 percentage points, from 66% in 2000-01 to 84% in 2006-07. Overall Punjab has the highest GER at 100%, followed by NWFP at 82%, Sindh at 79% and Balochistan at 72% in 2006-07 (Table 7.1). 7.6 The efforts of the public and privates sectors have resulted in an increase in education expenditure during the last few years; at the same time primary-level enrolment 12 Gross Enrolment Rate at primary level: Number of children attending primary level (classes 1-5) divided by number of children aged 5-9 years multiplied by 100.

51
rates have increased. In urban areas, GER is impressive in all provinces, ranging from 112% in Punjab to 103% in Balochistan. In rural areas, Punjab has made a marked progress particularly in female GER which increased from 61% in 2001-02 to 88% in 2006-07. This progress has been modest in NWFP; it has been slow in Balochistan as well as Sindh. In rural Balochistan, for example, female GER could increase only marginally from 41% in 2004-05 to 45% in 2006-07.
Table 7.1: Gross Enrolment Rate at the Primary Level (Age 5-9) By Province & Region (Excluding Katchi Class)
2004-05 PSLM 2005-06 PSLM 2006-07 PSLM Region and
Province Male Female Both Male Female Both Male Female Both
Urban Areas 107 100 104 107 100 104 108 104 106
Punjab 111 108 110 112 107 110 113 111 112 Sindh 103 94 99 103 96 100 105 101 103 NWFP 100 84 92 98 84 91 98 89 94 Balochistan 101 86 94 100 83 92 104 78 92 Rural Areas 89 68 79 89 71 80 95 72 84 Punjab 96 82 89 93 83 88 103 88 96 Sindh 70 44 58 79 51 66 77 45 63 NWFP 92 62 78 93 67 81 96 63 80 Balochistan 79 41 61 72 41 57 85 45 67 Overall 94 77 86 94 80 87 99 81 91 Punjab 100 89 95 98 89 94 106 95 100 Sindh 84 65 75 88 71 80 88 68 79 NWFP 93 65 80 93 70 83 96 67 82 Balochistan 83 49 67 79 50 65 89 52 72
Source: PSLM 2006-07
Figure (5): Overall Change in GER-Primary (FY 2005 Vs 2007)
8695
75 8067
91100
79 8272
0
20
40
60
80
100
120
Overall Punjab Sindh NWFP Balochistan
2004-052006-07
Source: PSLM 2006-07
7.7 The overall GER have changed to 88 percent when katchi is also included and the age group is expanded to 4-9 years old. Balochistan compared to other provinces has shown significant increase, particularly in urban areas.

52
7.8 Gender disparity13 in education is one of major challenges in Pakistan. Table 7.2 and graph 2 show an overall decline in gender gap in GER at the primary level; from 22% in 2001-02 to 17% in 2004-05. This decline was due to relatively greater increase in female GER than in male GER between the 2001-02 and 2004-05 period. Gender disparity in GER at primary level declined in all provinces except in Balochistan where it increased by one percentage point. Punjab province has the lowest gender disparity at 11% and Balochistan has the highest gender disparity at 34%. Gender disparity in urban areas remained the same at 7% during 2001-02 and 2004-05 because male and female GER increased by the same proportion (13%).
Table 7.2: Gender Gap in GER at the Primary Level (Age 5-9)
Region and Province 1998-99 PIHS
2001-02 PIHS 2004-05 PSLM
Urban Areas 3 7 7 Punjab -6 2 3 Sindh 12 13 9 NWFP 14 14 16 Balochistan 22 23 15 Rural Areas 25 28 21 Punjab 21 19 14 Sindh 26 32 26 NWFP 33 44 30 Balochistan 35 35 38 Overall 19 22 17 Punjab 14 15 11 Sindh 21 25 19 NWFP 30 41 28 Balochistan 33 33 34
Source: PSLM 2004-05
Figure 2: Overall Gender Gap-GER Primary (1998-99 to 2004-05)
19
3
25
7
22
28
17
7
21
0
5
10
15
20
25
30
Pakistan Rural Areas Urban Areas
1998-992001-022004-05
Source: PSLM 2004-05
13 Data on Gender Gap in education for the year 2005-06 and 2006-07 is not available.

53
7.9 The Pakistan MDG report 2004 has set the target of 100% NER by 2015. Pakistan seems to have made a sound progress in NER14 at the primary level (age 5-9), which increased by 14 percentage points from 42% in 2001-02 to 56% in 2006-07 (Table 7.3 and Figure 3). All the provinces have shown increase but there is more increase in rural areas as compared to urban areas. Again the performance of Punjab, particularly in female NER in rural areas, has been impressive. But this performance of Punjab has increased the regional disparities in NER. There is a need for designing education programs for rural areas of Sindh, NWFP and Balochistan to bring them at par with Punjab in primary school enrolment.
Table 7.3: Net Enrolment Rate at the Primary Level (Age 5-9) By Province & Region (Excluding Katchi Class)
Region and Province
Baseline Year PRSP 2005-06 PSLM 2006-07 PSLM 2001-02 PIHS
Male Female Both Male Female Both Male Female Both Urban Areas 57 54 56 66 64 65 67 65 66 Punjab 57 58 57 72 68 70 69 70 70 Sindh 56 50 53 62 63 62 67 61 64 NWFP 59 51 55 59 52 55 59 53 56 Balochistan 55 41 49 51 42 47 58 49 54 Rural Areas 43 33 38 53 42 47 57 46 52 Punjab 44 38 41 56 47 52 62 55 59 Sindh 41 25 33 48 34 42 49 31 41 NWFP 47 31 39 54 40 47 56 39 48 Balochistan 36 21 29 36 23 30 46 28 38 Overall 46 38 42 56 48 53 60 51 56 Punjab 47 43 45 60 53 57 64 59 62 Sindh 46 34 40 54 47 50 56 43 50 NWFP 48 33 41 54 42 49 56 41 49 Balochistan 39 24 32 39 27 34 49 32 41
Source: PSLM 2006-07
Figure 3: Urban / Rural NER-Primary Level (2001-02 vs 2006-07)
56
38
42
66
52
56
0 10 20 30 40 50 60 70
Urban
Rural
Pakistan
2006-07
2001-02
Source: PSLM 2006-07
14 Net Enrolment Rate at primary level: Number of children aged 5-9 years attending primary level (classes 1-5) divided by number of children aged 5-9 years multiplied by 100.

54
7.10 Gender gap15 in NER at the primary level remained unchanged at Pakistan level between 2001-02 and 2004-05. As gender gap in GER at the primary level declined during the same period this implies that the number of over age children attending primary school is quite substantial. Gender disparity in Punjab province is lowest at 5% in 2004-05 but it increased by one percentage point in 2004-05 relative to 2001-02. This increase was due to larger increase in NER for males (13%) and relatively low increase in female NER (12%) at primary level between 2001-02 and 2004-05. Gender gap in NER at primary level declined in Sindh and NWFP province and remained unchanged in Balochistan between 2001-02 and 2004-05. 7.11 Gender gap in NER at primary level is though quite low in urban areas but remained unchanged between 2001-02 and 2004-05. Gender disparity in urban Balochistan in NER has reduced by 8 percentage points and has come at par with the NWFP province at 6%. Gender gap increased by one percentage point in NER at primary level in rural areas between 2001-02 and 2004-05. In rural Balochistan gender gap in NER at primary level increased by two percentage points (Table 7.4).
Table 7.4: Gender Gap in NER at the Primary Level (Age 5-9) 1998-99 2001-02 2004-05 Region and Province PIHS PIHS PSLM Urban Areas 2 3 3 Punjab -3 -1 1 Sindh 6 6 5 NWFP 10 8 6 Balochistan 7 14 6 Rural Areas 13 10 11 Punjab 9 6 7 Sindh 16 16 16 NWFP 18 16 15 Balochistan 17 15 17 Overall 10 8 8 Punjab 7 4 5 Sindh 12 12 11 NWFP 17 15 13 Balochistan 16 15 15
Source: PSLM 2004-05 7.1.2 Increasing Role of Private Sector in Primary Education 7.12 The public sector is unable to fully meet the educational requirement of the whole school aged and illiterate population of the country. In this connection the role of private sector in education has increased over time. Out of the total primary level GER of 91% in 2006-07, the government school GER has been computed as 63%. In other words private school GER was 28% in 2006-07. The government school GER increased by 20% between 2001-02 and 2006-07. It suggests that new enrolment has taken place in both types of schools, public as well as private. On the other hand relatively greater increase in
15 This section has been taken from PRSP Annual Progress Report 2004-05, since PSLM 2005-06 & 2006-07 does not contain the data on Gender Gap in NER. Also, the data on Gender Gap in Literacy is not available in PSLM 2005-06 and 2006-07 therefore it is not being reported.

55
private school GER suggests some shifting of children from public to private schools. But the percentage of primary school students who are enrolled in government schools has also risen from 65 percent in 2005-06 to 69 percent in 2006-07. 7.13 In urban areas approximately half of the total primary enrolment is currently in private schools. However, in rural areas where majority of the poor live, public schools remain the main source for primary education.
Figure 4: Primary Enrolment in Government Schools as % of Total Primary Enrolment
0102030405060708090
Mal
e
Fem
ale
Both
Mal
e
Fem
ale
Both
Mal
e
Fem
ale
Both
Mal
e
Fem
ale
Both
2001-02 PIHS 2004-05 PSLM 2005-06 PSLM 2006-07 PSLM
Urban Areas
Rural Areas
Overall
Source: PSLM 2006-07
7.1.3 Middle and Secondary education 7.14 Overall, the middle-level GER16 for children aged 10-12 increased from 41% in 2001-02 to 51 in 2006-07 (Figure 5). The increase for males is 57% and for females it is 44%. There is a large gap between urban and rural areas in the middle-level GER - 69% and 43% respectively.
Figure 5: GER at the Middle Level (Pakistan)
0
10
20
30
40
50
60
2001-02 PIHS 2004-05 PSLM 2005-06 PSLM 2006-07 PSLM
Male
Female
Both
Source: PSLM 2006-07
16 GER at middle level: Number of children attending middle level (classes 6-8) divided by number of children aged 10-12 years multiplied by 100.

56
7.15 Net enrolment rates at the middle-level are much lower than GER (Figure 6). This is due to the large number of overage children that are enrolled in these classes. The middle-level NER increased only marginally from 16% in 2001-02 to 18% in 2006-07. But it remained same between 2005-06 and 2006-07 i.e. 18%.
Figure 6: NER at the Middle Level (Pakistan)
0
5
10
15
20
25
2001-02 PIHS 2004-05 PSLM 2005-06 PSLM 2006-07 PSLM
Male
Female
Both
Source: PSLM 2006-07
7.16 At the matric level, GER show improvement from 44% in 2005-06 to 48% in 2006-07 however NER remained unchanged at 10% with a wide gender gap (Figures 7 and 8). Middle and matric-level enrolments can be enhanced by upgrading the existing primary- and middle-level schools to the next higher level. It would increase the school accessibility particularly for girls in low income households
Figure 7: GER at the Matric Level (Pakistan)
0
10
20
30
40
50
60
Pakistan Punjab Sindh NWFP Balochistan
2001-02 PIHS
2004-05 PSLM
2005-06 PSLM
2006-07 PSLM
Source: PSLM 2006-07
Figure 8: NER at the Matric Level (Pakistan)
0
2
4
6
8
10
12
14
Pakist an Punjab Sindh NWFP Balochist an
2001-02 PIHS
2004-05 PSLM
2005-06 PSLM
2006-07 PSLM
Source: PSLM 2006-07
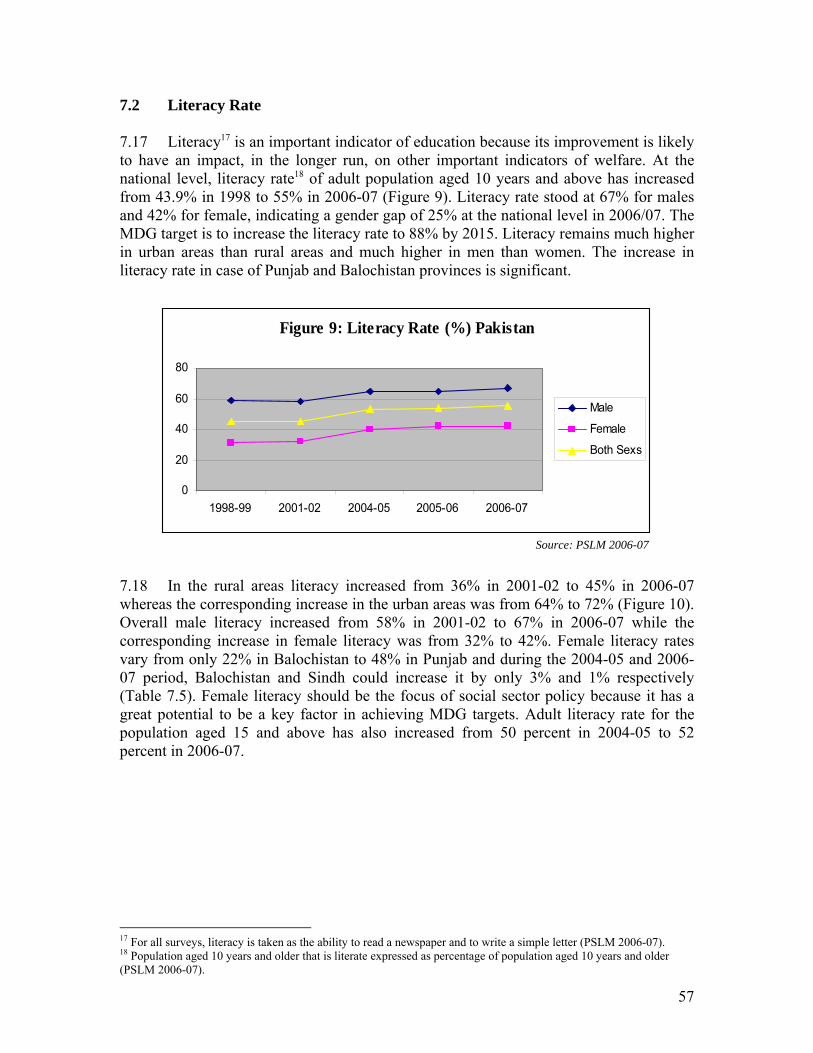
57
7.2 Literacy Rate 7.17 Literacy17 is an important indicator of education because its improvement is likely to have an impact, in the longer run, on other important indicators of welfare. At the national level, literacy rate18 of adult population aged 10 years and above has increased from 43.9% in 1998 to 55% in 2006-07 (Figure 9). Literacy rate stood at 67% for males and 42% for female, indicating a gender gap of 25% at the national level in 2006/07. The MDG target is to increase the literacy rate to 88% by 2015. Literacy remains much higher in urban areas than rural areas and much higher in men than women. The increase in literacy rate in case of Punjab and Balochistan provinces is significant.
Figure 9: Literacy Rate (%) Pakistan
0
20
40
60
80
1998-99 2001-02 2004-05 2005-06 2006-07
Male
Female
Both Sexs
Source: PSLM 2006-07
7.18 In the rural areas literacy increased from 36% in 2001-02 to 45% in 2006-07 whereas the corresponding increase in the urban areas was from 64% to 72% (Figure 10). Overall male literacy increased from 58% in 2001-02 to 67% in 2006-07 while the corresponding increase in female literacy was from 32% to 42%. Female literacy rates vary from only 22% in Balochistan to 48% in Punjab and during the 2004-05 and 2006- 07 period, Balochistan and Sindh could increase it by only 3% and 1% respectively (Table 7.5). Female literacy should be the focus of social sector policy because it has a great potential to be a key factor in achieving MDG targets. Adult literacy rate for the population aged 15 and above has also increased from 50 percent in 2004-05 to 52 percent in 2006-07.
17 For all surveys, literacy is taken as the ability to read a newspaper and to write a simple letter (PSLM 2006-07). 18 Population aged 10 years and older that is literate expressed as percentage of population aged 10 years and older (PSLM 2006-07).

58
Table 7.5: Literacy Rates - Population 10 Years and Older (%)
Region and Province
Percentage of Population 10 years and Older 2004-05 PSLM 2005-06 PSLM 2006-07 PSLM
Male Female Both Male Female Both Male Female Both Urban Areas 78 62 71 79 64 71 79 65 72 Punjab 78 66 72 80 67 73 79 68 73 Sindh 80 62 72 80 65 72 80 65 73 NWFP 75 47 61 73 45 59 75 46 61 Balochistan 74 42 60 77 40 59 76 42 61 Rural Areas 58 29 44 57 31 44 60 30 45 Punjab 59 35 47 58 37 47 61 38 50 Sindh 56 18 38 54 17 37 52 16 36 NWFP 61 23 41 62 27 44 65 24 44 Balochistan 47 13 32 46 13 31 52 15 35 Overall 65 40 53 65 42 54 67 42 55 Punjab 65 44 55 66 47 56 67 48 58 Sindh 68 41 56 67 42 55 67 42 55 NWFP 64 26 45 64 30 46 67 28 47 Balochistan 52 19 37 54 20 38 58 22 42
Source: PSLM 2006-07
Figure 10: Literacy Population (2001-02 vs 2006-07)
64
36
45
71
44
53
71
44
54
72
45
55
0 10 20 30 40 50 60 70 80
Urban
Rural
Pakistan
2006-07
2005-06
2004-05
2001-02
Source: PSLM 2006-07
7.19 It is worth reviewing here briefly the education policy of the government to see its relevance with the geographical variations in literacy. The government has instituted a number of programs that support education and literacy. ‘Education For All: National Plan of Action 2001-2015’ has specific goals for increased literacy such as: ensuring that the needs of all young people and adults are met through equitable access to appropriate learning, life skills and citizenship programs; improvement in levels of adult literacy by 2015, especially for women and equitable access to basic and continuing education for all adults; and improving all aspects of quality education and ensuring excellence of all so that recognized and measurable learning outcomes are achieved by all, especially in literacy, numeracy and essential life skills. To meet these goals, the government has instituted a broad-based Adult Literacy Plan that is to be implemented in phases up until the year 2015, by the end of which the Government hopes to achieve an overall literacy

59
rate of 86%. The enabling tool in this case is meant to be Literacy Centres. A total number of 270,000 centres are proposed. Districts with low literacy rates, like south Punjab have given a priority in the literacy program. Implementation of the Adult Literacy Plan will enable to achieve the literacy targets by monitoring geographical variations. 7.3 Health Indicators 6.20 The PSLM surveys 2005-06 and 2006-07 provide useful information on self-reported morbidity, use of health services, child immunization coverage, use of ORS during the diarrhea episode, pre- and post-natal care and drinking water supply and sanitation. Some of these indicators are discussed below. 7.3.1 Immunization 7.21 Immunization has a positive impact on reduction in child malnutrition as well as mortality. Full immunization of a child includes eight recommended vaccines – BCG, DPT1, DPT2, DPT3, Polio1, Polio2, Polio3 and measles. Percentage of children aged 12-23 months who have immunized19 based on recall and record (fully immunized) increased by 23 percentage points to 76% in 2006-07 as compared to 2000-01. In urban areas this percentage increased from 70% to 85% and in rural areas from 46% to 73% showing appreciable improvement. This indicator has highest value in Punjab at 83%, followed by NWFP at 76%, Sindh at 65% and Balochistan at 54% in 2006-07 (Table 7.6). 7.22 At least one immunization, based on ‘recall’ method, increased from 74% in 2001-02 to 86 % in 2006-07. Based on this method full immunization has increased from 53% in 2001-02 to 76% in 2006-07. The increase (in full immunization) is particularly impressive in rural areas, from 46% in 2001-02 to 73% in 2006-07 (Table 7.6 and Figure 13). Under the ‘record’ method, full immunization rate is quite low, 50% in 2006-07 compared to 76% under the ‘recall’ method. However, there has been an improvement in record-based immunization rate, from only 27% in 2001-02 to 50% in 2006-07. 7.23 Increase in the immunization coverage in Pakistan, particularly of children, seems to be a success story. By and large, all provinces have shown significant improvement in measures that includes recall and also in record except Sindh province. MDG target is more than 90% by 2015. Sustainability in the immunization programs as well as on-going awareness campaign can help achieve the MDG targets. It would result in reduction in child mortality as well as malnutrition.
19 Based on Recall: Children reported as having received at least one immunization expressed as percentage of all children aged 12-23 months. Based on Record: Children who reported having received full immunization who also have an immunization card, expressed as percentage of all children aged 12-23 months. To be fully immunized a child must have received: BCG, DPT1, DPT2, DPT3, Polio1, Polio2, Polio3 and Measles.

60
Figure 13: Percent of Children Aged 12-23 Months Immunized
0
20
40
60
80
100
2001-02PIHS
2004-05PSLM
2005-06PSLM
2006-07PSLM
Based on Recall
Based on Record
Source: PSLM 2006-07
Table 7.6: Percent of Children Aged 12-23 Months Immunized Based on Recall and Record Method Fully Immunized
Region and Province
2001-02 PIHS 2005-06 PSLM 2006-07 PSLM
Male Female Both Male Female Both Male Female Both Urban Areas 70 71 70 83 86 84 86 85 85 Punjab 72 80 76 84 91 87 87 86 87 Sindh 66 63 64 82 81 82 84 84 84 NWFP 81 57 70 77 79 78 88 86 87 Balochistan 34 37 36 69 70 69 68 72 70 Rural Areas 48 45 46 67 65 66 74 72 73 Punjab 52 50 51 71 71 71 82 81 82 Sindh 39 26 33 64 63 63 52 53 53 NWFP 52 57 55 63 59 61 77 71 74 Balochistan 22 21 22 50 37 41 53 46 49 Pakistan 53 52 53 72 71 71 77 75 76 Punjab 57 58 57 75 76 76 84 83 83 Sindh 49 40 45 70 71 71 65 65 65 NWFP 56 57 57 65 62 64 79 73 76 Balochistan 24 24 24 56 43 48 56 52 54
Source: PSLM 2006-07 7.3.2 Pre- and post-natal care 7.24 Quality pre-natal care can contribute to the prevention of maternal mortality by detecting and managing potential complications and risk factors, including pre-eclampsia, anaemia, and sexually transmitted diseases. Pre-natal care also provides opportunities for women to learn the danger signs of pregnancy and delivery, to be immunized against tetanus, to learn about infant care, and be treated for existing conditions, such as malaria and anaemia.

61
7.25 At the national level, pre-natal consultation20 by pregnant women increased from 35% in 2000-01 to 53% in 2006-07, recording an increase of 18 percentage points. Punjab and Sindh provinces have highest rate of prenatal consultation at 56%, followed by NWFP at 46%, and Balochistan at 31% (Table 7.7 and Figure 14). The attendance rate was much higher in urban areas (73%) than in rural areas (45%). Compared to pre-natal, the post-natal consultation21 rate is low, 24% in 2006-07. However, considerable improvement has been witnessed during the last five years, from only 9% in 2001-02 to 24% in 2006-07. Urban areas have higher rates (38%) than the rural areas (18%). This indicator has highest value in Sindh at 31%, followed by Punjab and NWFP at 22% and Balochistan at 17% in 2006-07. Table 7.7: Percentage of Pregnant Women Visiting Health Facility for Pre-and Post-Natal
Consultation Region and Province 2001-02 PIHS 2005-06 PSLM 2006-07 PSLM Urban Rural Overall Urban Rural Overall Urban Rural OverallPre-Natal Consultation Pakistan 63 26 35 74 42 52 73 45 53 Punjab 64 31 40 73 45 53 71 50 56 Sindh 68 22 38 82 38 56 82 37 56 NWFP 45 19 22 53 42 43 64 43 46 Balochistan 45 16 21 60 30 36 56 25 31 Post-natal consultation Pakistan 16 6 9 35 17 22 38 18 24 Punjab 15 8 10 31 17 21 33 18 22 Sindh 19 6 10 43 14 26 49 18 31 NWFP 8 4 4 22 21 21 29 20 22 Balochistan 16 5 7 25 9 12 31 14 17
Source: PSLM 2006-07
20 Currently married women aged 15-49 years who had given birth in the last three years and who had attended at least one pre-natal consultation during the last pregnancy expressed as a percentage of all currently married women aged 15-19 years who had given birth in the last three years. 21 Currently married women aged 15-49 years who received post-natal checkup expressed as a percentage of all currently married women aged 15-49 years who gave birth in the last 3 years.

62
7345 53
7442 52
6640 50
6326 35
0
50
100
Urban Rural Overall
2001-022004-05
2005-062006-07
Figure 14: Pre-Natal Consultation (2001-02 vs 2006-07)
2001-02
2004-05
2005-06
2006-07
Source: PSLM 2006-07 7.3.3 Tetanus Toxoid Injection 7.26 Overall, percentage of pregnant women who received Tetanus Toxoid22 injection increased by 10 percentage points to 56% in 2006-07 as compared to 2000-01. Punjab has the highest value of this indicator at 64%, followed by Sindh at 47%, NWFP at 46%, and Balochistan at 25%. 7.3.4 Water Supply and Sanitation 7.27 Access to safe drinking water, an indicator of the PRSP and MDGs, is at the top of the Government’s Policy Agenda. Hand pumps23 and motor pumps24 together provide 56 percent of households with drinking water in 2005-06, which decreased to 51 percent in 2006-07, whereas the percentage of households using tap water25 has shown a slight increase. However, this change appears to be mainly a change in convenience since there seems to be a substitution from hand pumps and motor pumps. Moreover, the percentage of households is depending on lower water sources i.e. dug well and other is either increased or slightly decreased. 7.28 Tap water has increased from 34 percent in 2005-06 to 36 percent in 2006-07. Sindh has highest value of this indicator at 47% followed by NWFP at 44%, Balochistan at 37%, and Punjab at 29% in 2006-07. In 2000-01, 44% of households had access to hand pump in Pakistan, which declined to 30% in 2006-07, probably due to tap water availability to households. In 2000-01, 17% of households have access to motor pump, which increased to 21% in 2006-07 (Figure 15 and Table 7.8).
22 Currently married women aged 15-49 years who had a birth in the last 3 years and received a tetanus toxoid injection during the last pregnancy. 23 Hand pump includes hand pumps both inside and outside house. 24 Motor pump includes motor pump and tube well inside and outside the house. 25 Tap water consists of both tap water inside and outside house.

63
Table 7.8: Main Sources of Drinking Water in Pakistan (Percentage Distribution)
Pakistan 2001-02 PIHS 2005-06 PSLM 2006-07 PSLM
Urban Rural Overall Urban Rural Overall Urban Rural OverallPopulation with Access to Clean Drinking Water * 94 80 86 96 86 90 95 83 87 Tap water 58 10 25 59 21 34 62 22 36 Hand pump 14 56 44 12 42 32 9 41 30 Motor pump 22 14 17 25 23 24 24 20 21 Dug well 2 10 7 2 7 5 1 6 4 Other 3 10 7 3 8 6 4 10 8 Total 100 100 100 100 100 100 100 100 100
* Sum of tap water, hand pump and motor pump Source: PSLM 2006-07
Figure 15: Main Source of Drinking Water
Tap water37%
Hand pump30%
Motor pump21%
Dug well4%
Other8%
Source: PSLM 2006-07 7.29 The overall proportion of households with a flush toilet26 facility increased by 14 percentage points to 58% in 2006-07 compared to 2001-02. The use of flush toilets is 92% for the urban households, Punjab with 93% is highest and Balochistan with 78% is the lowest. About 15% of households in 2006-07 have non-flush toilet and 27% do not have any toilet (Figure 16). This varies greatly between urban and rural areas i.e. 4% of urban households have no toilet compared to 39% of rural households. Proportion of households with a flush toilet in 2006-07 in Punjab, Sindh, NWFP and Balochistan stood at 64%, 55%, 52%, and 25%, respectively. Rural Punjab has the highest proportion of households reporting no toilet at all, at 44%. Rural Sindh has the lowest, at 27%.
26 Flush consists of flush connected to public sewerage, flush connected to septic tank and flush connected to open drain.

64
Figure 16: Type of Toilet Used by Household
54
2026
60
11
30
58
15
27
0
10
20
30
40
50
60
70
Flush Non-Flush No Toilet
PSLM 2004-05
PSLM 2005-06
PSLM 2006-07
Source: PSLM 2006-07
7.3.5 Utilization of Health Services 7.30 The PSLM survey provides information on the use of different types of health services during recent self-reported illness, diarrhea episode among children and pre-natal and post-natal consultation by married women who had given birth during the last three years. 7.31 PSLM 2006-07 shows that the largest proportion (69% overall, 74% urban areas and 66% rural areas) of sick people consulted a private doctor/dispensary/hospital. Around one-fifth of the sick population consulted a public dispensary/hospital in urban as well as rural areas. A very small proportion of the sick population consulted other health providers such as RHC/BHC, hakeem /herbalist and homeopath. However, in the NWFP province a relatively larger proportion of sick people consulted a chemist/pharmacy (Table 7.9). 7.32 Dehydration caused by diarrhea is a major cause of mortality among children. Childhood diarrhea has been a serious health problem in Pakistan. Preventing dehydration by increasing fluid intake is important strategy for managing diarrhea. In case of diarrhea among children, it is encouraging to see a considerable increase in the use of ORS, an effective way of preventing dehydration. This increase is more profound in rural areas than in urban areas. More than two-thirds of children suffering from diarrhea consulted private doctors/hospitals (Table 7.10). The use of public dispensary/hospital for diarrhea treatment has declined by 6% between 2005-06 and 2006-07. This decline was higher in the rural areas than in the urban areas. Only a small proportion of respondents reported the use of RHC/BHU, LHW, LHV/Nurse, chemist or hakeem / homeopath / herbalist for diarrhea treatment.

65
Table 7.9: Percentage Distribution of Health Consultations in Past Two Weeks by Type of Health Provider/ Consulted during 2006-07
Region and Practitioner
Private/ Dispensary/
Hospital
Public Dispensary/
Hospital RHC/BHU Hakeem/ Herbalist Homeopath
Chemist/ Pharmacy
Saina/ Saini Other
Urban Areas 74 18 1 1 1 4 1 0 Punjab 72 18 1 2 1 5 1 0 Sindh 82 14 1 1 1 0 0 0 NWFP 51 34 1 1 1 11 1 0 Balochistan 60 37 1 0 1 1 0 0 Rural Areas 66 18 3 4 1 6 2 0 Punjab 71 15 2 5 1 4 2 0 Sindh 72 21 5 1 0 0 1 0 NWFP 50 21 4 3 1 21 1 0 Balochistan 38 39 11 3 0 2 7 0 Pakistan 69 18 2 3 1 5 1 0 Punjab 71 16 2 4 1 4 1 0 Sindh 78 17 2 1 0 0 1 0 NWFP 50 23 3 2 1 19 1 0 Balochistan 44 39 8 2 0 2 5 0
Source: PSLM 2006-07
Table 7.10: Types of Practitioner Consulted for Diarrhea Treatment
Region and Practitioner
Percentage of Diarrhea Cases 1998-99
PIHS 2001-02
PIHS 2004-05 PSLM
2005-06 PSLM
2006-07 PSLM
Private Dispensary/Hospital 54 59 68 65 72 Government Hospital/Dispensary 24 21 15 19 13 RHC/BHC 3 3 5 4 6 LHW 0 1 1 0 1 LHV/Nurse - - 0 0 0 Chemist/Pharmacy 9 10 6 8 5 Hakeem/Homeopathic/Herbalist 6 4 3 3 2 Other 3 2 1 1 1
Source: PSLM 2006-07 7.33 The proportion of married women who attended at least one pre- and post-natal consultation has been reported earlier. The three most commonly consulted sources for pre-natal care were private hospital/clinic, government hospital/clinic and home trained birth attendants (TBA), see table 7.11.

66
Table 7.11: Health Facilities Used for Pre-Natal Consultation
Person/Facility Consulted
2001-02 PIHS 2005-06 PSLM 2006-07 PSLM
Urban Rural Both Urban Rural Both Urban Rural Both
Home TBA 3 5 4 4 6 5 7 15 12 Home LHW 1 4 3 2 4 3 3 9 7 Home LHV 1 4 3 2 3 3 3 6 5 Home Doctor 1 1 1 1 1 1 4 3 3
Govt Hospital /RHC/ BHC/BHU 41 42 42 34 39 37 25 25 25 Private Hospital/Clinic 49 37 43 55 43 48 57 40 47 Other 2 7 5 2 3 3 1 2 1 Total 100 100 100 100 100 100 100 100 100
Source: PSLM 2006-07 7.4 Satisfaction from Basic Services 7.34 The PSLM survey-CWIQ has generated information on the satisfaction from schooling, health facilities, family planning, veterinary hospital, agriculture and police. The percentage of people satisfied with schools in Pakistan stood at 61.23% in 2006-07 (Table 7.12). The highest level of satisfaction from schooling (67%) has been found in the NWFP while the lowest level of satisfaction (52%) is in Balochistan. The level of satisfaction from schooling is higher in urban areas (66%) compared to rural areas (58%), indicating better quality of schools in urban areas. The percentage of population satisfied with Basic Health Units stood at 35.31% in 2006-07, which is alarmingly low. The level of satisfaction from services of Basic Health Unit in NWFP is highest at 45%, followed by Sindh at 42.8%, Punjab at 30.5%, and Balochistan at 30%. The level of satisfaction in rural areas (37.89%) from the services of Basic Health Unit is higher than in urban areas (30.44%).
Table 7.12: Household Satisfaction By Facilities and Services Use (%)
Region and Province
Facilities and Services Use in 2004-05
Facilities and Services Use in 2006-07
Basic Health unit School Basic Health unit School Urban Area 29.36 66.38 30.44 66.56 Punjab 20.47 67.63 20.72 69.62 Sindh 31.35 61.57 41.14 60.51 NWFP 58.78 72.98 52.79 73.06 Balochistan 36.67 66.71 37 67.9 Rural Areas 40.96 54.85 37.89 58.42 Punjab 38.89 59.11 35.19 60.47 Sindh 40.98 47.87 44.42 47.47 NWFP 48.76 64.7 43.31 66.65 Balochistan 36.62 40.89 27.94 47.73

67
Overall 35.94 59.84 35.31 61.23 Punjab 30.04 63.2 30.46 63.46 Sindh 36.33 54.49 42.78 53.98 NWFP 51.92 67.31 44.93 67.75 Balochistan 36.64 48.29 30.07 52.47
Source: PSLM 2006-07 7.5 Housing 7.35 There are 86% households in Pakistan who own a dwelling in 2006-07 (87% in 2005-06), while 7% of households have rented dwelling units and about 6.12% have rented free houses but a small number of 0.96% households have on subsidized housing units. At the provincial level, households which own dwelling stood at 86% in Punjab, NWFP and Balochistan, and 84% in Sindh. The percentage of houses owned in the rural areas (91%) is quite high than in the urban areas (76%) in 2006-07 (Table 7.13). The percentage of households which used RCC/RBC for roof stood at 32% in 2006-07. Majority of households used wood/bamboo for construction of roof. In the rural areas only 17% households used RCC/RBC for construction of roof where as in urban areas 61% roofs are made of RCC/RBC material. At the provincial level Sindh (40%) province has the highest percentage of houses with this roof material and Balochistan has the lowest percentage with roofs of RCC/BCC (12%). The situation is similar in the urban areas. However, in rural areas NWFP has the highest proportion (20%) of houses with this roof material followed by Punjab (18.6%), Sindh (12%) and again Balochistan has the lowest (3.6%) proportion of houses with roofs made of RCC/RBC. 7.36 According to the PSLM survey-CWIQ, there are 24.33% dwelling units with one room and 69% housing units with 2-4 rooms during 2006-07. 6.62% of households have five and more living rooms in their dwelling units. In rural areas the proportion of dwelling with one room (27%) are greater than in urban areas (19.5%). 7.37 Electricity has become a necessity of life. In Pakistan in 2006-07 there are 86.6% households who use electricity for lighting. At the provincial level NWFP province has the highest proportion of households (91%) and Balochistan has the lowest proportion of households (65%) which use electricity for lighting. In urban areas there are 97% households and in rural areas there are 81% households which use electricity for lighting the remaining households use gas/oil or candle for lighting.
Table 7.13: Distribution of Household By Type of Housing and Electricity Use (%)(2006-07)
Region and Province Owned
Households
RCC/RBC Used for
Roof
Housing Units with One
Room
% Households Using Electricity
for Lighting Urban Areas 75.67 60.77 19.47 97.58
Punjab 76.71 57.54 21.53 97.84 Sindh 75.49 68.6 17.24 97.05 NWFP 69.14 54.8 16.18 98.31
Balochistan 72.11 39.38 14.35 97.44

68
Rural Areas 91.28 16.98 26.89 80.82 Punjab 91.29 18.65 25.17 86.36 Sindh 92.35 12.34 40.82 61.53 NWFP 90.23 20.13 19.07 90.04
Balochistan 90.47 3.61 20.55 55.65 Pakistan 85.88 32.11 24.33 86.61 Punjab 86.52 31.36 23.98 90.11 Sindh 83.93 40.44 29.04 79.27 NWFP 86.62 26.07 18.57 91.46
Balochistan 86.18 12.02 19.09 65.47 Source: PSLM 2006-07
7.6 Changes in Economic Condition: Household Perception 7.38 This type of information has been collected for the first time in FBS household surveys. Since government is spending a lot to improve the economic situation of people and also investing considerable amount in providing different types of facilities/services, households were asked to compare their economic situation with last year. In response to this question 51.52% in 2006-07 reported no change, 21.35% reported worse or much worse and 27% reported better or much better.28% of households in urban areas and 26.5% in rural areas reported an improvement in their economic situation compared to last year (Table 7.14 and Figure 17). Proportionately more households in Punjab and NWFP reported improvement in their well-being than households in the other two provinces, Sindh and Balochistan.
Table 7.14: Percentage Distribution of Household by the Perception of the Economic Situation of the Household Compared to the Year Before 2006-07
Region and Province
Economic Situation of the Household Much Worse Worse Same Better Much Better Don't Know Total
Urban Area 2.69 18.12 51.06 24.16 3.79 0.18 100 Punjab 2.70 17.05 48.52 27.14 4.40 0.19 100 Sindh 2.70 21.13 55.12 18.08 2.78 0.18 100 NWFP 3.13 13.83 46.83 31.71 4.44 0.06 100 Balochistan 1.34 10.77 59.37 25.10 3.11 0.31 100 Rural Areas 2.95 18.68 51.76 23.98 2.51 0.12 100 Punjab 2.34 18.42 51.63 24.98 2.49 0.13 100 Sindh 3.70 20.16 58.69 16.24 1.16 0.15 100 NWFP 4.60 20.60 39.88 30.37 4.51 0.05 100 Balochistan 2.03 9.79 66.38 20.16 1.23 0.41 100 Overall 2.86 18.49 51.52 24.04 2.95 0.14 100 Punjab 2.46 17.97 50.61 25.69 3.12 0.15 100 Sindh 3.20 20.64 56.91 17.16 1.97 0.12 100 NWFP 4.35 19.44 41.07 30.60 4.50 0.05 100 Balochistan 1.87 10.02 64.73 21.32 1.67 0.38 100
Source: PSLM 2006-07

69
Figure17: Percentage Household Perception of Economic Situation (PSLM 2006-07)
2.86
18.49
51.52
24.04
2.95 0.140.0010.0020.0030.00
40.0050.0060.00
MuchWorse
Worse Same Better MuchBetter
Don'tKnow
Source: PSLM 2006-07

70
8 Conclusion and the Way Forward 8.1 PRSP progress reports have been monitoring the performance of input, intermediate and outcome PRSP/MDG indicators primarily at the national and provincial levels. While national and provincial level performance of different socio-economic indicators, based on PSLM data has been discussed in detail in previous PRSP reports, district-level analysis of selected indicators was carried out for the first time, in last year’s PRSP Annual Report (2005-06), based on the district report of PSLM, 2004/05 published by the Federal Bureau of Statistics (FBS). District-level differentials in selected PRSP/MDG indicators were illustrated through maps generated by the Geographical Information System (GIS). The main focus was on the literacy rate, primary and middle-level school enrolment, child immunization, pre-and post-natal consultation and water supply and sanitation. Gender gaps in literacy and enrolment were also discussed. 8.2 In the current Annual Progress Report (2006-07), an effort has been made to reveal, to the extent possible, district-wise expenditure data. The PRSP Secretariat has, from time to time, highlighted the intentions of the Ministry of Finance to publish input, that is, expenditure data that encompasses all three tiers of the Government - national, provincial and district. While data at the federal and provincial levels has been reported regularly, district data has not been available (for all provinces) through civil accounts. However, now with the change over from the Chart of Classification based upon the legacy system to the Chart of Accounts based upon the New Accounting Model, developed under the Project for Improvement of Financial Reporting and Auditing (PIFRA), it has now become possible, at selected sites, to separately account for district expenditures. This innovation in classification has been accompanied by the shift to districts of the operation of selected heads of expenditure, notably those pertaining to the sectors of education, health, water and sanitation, etc. In other words, some expenditure under these heads is now being accounted for by districts themselves. 8.3 With this increased fiscal autonomy being placed on the districts in terms of incurring current and part of development expenditures related to these sectors, there has also come increased responsibility in terms of timely preparation of Account IV (pertaining to district expenditures) and its submission to provincial Accountant General Offices for consolidation and further reporting. Different provinces have made varied progress in preparing these Accounts. In fact, part of the delay in the publication of this report has been due to the difficulties encountered by the districts in carrying out this exercise de novo. Gathering this data from Sindh took the longest time, followed by NWFP. Punjab and Balochistan have been regularly reporting Account IV both under the new and old systems of classification. It is hoped that the institutional capacities at the

71
district level would gradually be strengthened so that the new reporting system is able to take root and become a periodic and timely exercise. 8.1 NWFP Expenditure Tracking 8.4 In this year’s Annual Report, NWFP has been chosen as a case study with regards to analysis of expenditure data incurred at the district level. It is hoped that the PRSP Secretariat would, at a future time, also be able to report national district-wise data. The following tables provide district wise data for NWFP for each head of account being operated at the district level in NWFP. This is followed by an analysis of the expenditure data.
Table 8.1: Break-up of District PRSP Expenditure* for NWFP FY 07 (Rs.)
S.# District Roads & Highways
Water Supply & Sanitation Education Health
Social Welfare
Rural Development
Natural Calamities
& Disasters
1 Abbottabad 64279643 45423416 1068815813 153531008 25092115 8673898 0 2 Bunnair 82474 420999 415494642 58597487 3293015 3968713 0 3 Battagram 5951075 4608039 291703758 56261907 748774 26020052 0 4 Bannu -5815563 58894171 792349820 88251440 15334089 595779556 0 5 Charsada 33792814 25088098 954029690 131557200 4597881 147679959 0 6 Chitral 41681494 12377766 303071058 96485079 5680336 29192874 0 7 Dir (Lower) 36295973 37705185 932782837 102435061 2445337 197209554 0 8 D. I. Khan 40698642 138210341 1088069667 112400304 3826808 231964408 0 9 Dir (Upper) 23414780 3821998 427494432 77046478 1018899 115350964 0
10 Hangu 18686081 7878825 194716795 37413052 1035631 50339688 0 11 Hari pur 81745266 38368158 627885502 90260021 1186434 119990820 0 12 Kohistan 17229157 12102379 294951418 37307933 1173327 129334016 0 13 Karak 27320338 78614732 382277211 83217109 4275819 66489792 0 14 Kohat 25337462 30930428 643551805 142697491 6678209 79452520 0
15 Lakki Marwat 37398867 65253369 656464745 89279799 1471057 64753086 0
16 Mansehra 29899871 28343308 1267971775 142815645 16701050 3871784 0 17 Malakand 33204957 20265995 558580068 111475997 2047445 46045300 0 18 Mardan 56534482 34286176 1422561463 214228074 5422792 13983397 0 19 Nowshera 89852864 41178549 792059784 128550330 3048426 108219393 0 20 Peshawar 38685286 40195395 1550370384 188631848 10992980 19290716 0 21 Shangla 25348494 1142139 335743175 50594816 621241 54765661 0 22 Swabi 45719616 14399120 998603231 108692709 2459886 348474700 0 23 Swat 45785046 75062042 1166351567 125811503 40179830 367600383 27756014 24 Tank 20319178 16630542 248661140 39439502 1131158 34154113 0
Total district expenditure in
each sector 833448297 831201170 17414561780 2466981793 160462539 2862605347 27756014 * Includes both current and development expenditure Source: Accountant General Office, NWFP.

72
Table 8.2: Percentage of District PRSP Expenditure as Compared to Total PRSP Expenditure in NWFP FY 07
Roads & Highways
Water Supply & Sanitation Education Health
Social Welfare
Rural Development
Natural Calamities & Disasters
Total district expenditure in each sector (Rs. Million) 833 831 17415 2467 160 2862 28 Total NWFP Expenditure (Rs. Million) 4471 1065 19447 5979 1324 6320 991 District expenditure as % of total NWFP expenditure 18.63 78.03 89.55 41.26 12.08 45.28 2.83
Source: PRSP Secretariat, Finance Division, Islamabad 8.1.1 Analysis of the NWFP Expenditure Data 8.5 Total district expenditure in NWFP was Rs 23.09 billion. Maximum district expenditure was incurred on education (Rs 17.41 billion), which was 75.42% of the total district expenditure. The greatest amount of NWFP district expenditure on roads and highways was incurred in the district of Nowshera, followed by Abbottabad, whereas the largest amount of NWFP district expenditure on water supply and sanitation was incurred in district D. I. Khan, followed by Abbottabad. The greatest amount of district expenditure on education was spent in Peshawar, followed by Mansehra. The district of Mardan incurred the largest expenditure on health, followed by district Peshawar. The district of Swat incurred the greatest expenditure in social welfare, followed by Abbottabad, while the greatest amount of district expenditure on rural development was spent in Bannu, followed by Swat. Expenditure on natural calamities and disasters was only incurred in the district of Swat. 8.2 ‘Strengthening Poverty Reduction Strategy Monitoring’ 8.6 Based on the lessons learned during the implementation of PRSP-I, there is a recognition of the need to strengthen the existing monitoring mechanism, upgrade institutional networks, improve coherence with sectoral management information systems, and reinforce evaluation systems at provincial and district levels. Realizing the significance of and need for consistent monitoring of government efforts, particularly those policies directly reaching out to the poor and vulnerable, the Ministry of Finance and UNDP have instituted a joint project titled ‘Strengthening PRS Monitoring’.
8.7 The new monitoring framework is envisaged to put in place a sustainable system to deliver timely and reliable data against a set of well-selected indicators, which feeds into the policy process and engages national and sub-national levels through participatory processes. Overall, this project will ensure improved institutional capacity that will

73
facilitate the PRSP Secretariat in improved pro-poor policy formulation and implementation, alongside efficient and effective spending aimed at poverty reduction and maintaining an integrated system which will enable precise comparison of past achievements with future objectives. 8.3 Moving Forward 8.8 Pakistan’s Poverty Reduction Strategy involves a fully participative process, incorporating the views and suggestions of all stakeholders – government, donors, civil society and the poor communities. The Draft Summary of PRSP-II was launched at the Pakistan Development Forum during April, 2007 so as to further gain input from various stakeholders.
8.9 With a changed economic landscape characterized by globalization and a demographic transition through which the country is currently passing, PRSP-II aims to achieve the targets of high sustained growth and poverty reduction. Based on these new realities faced by the country, PRSP-II will have a new extensive monitoring framework. While this year’s PRSP Annual Report will only reflect indicators identified in PRSP-I (2003-06), a final detailed account of the new indicators reflecting new developments in PRSP-II will be illustrated subsequent to the launch of PRSP-II.