Embed Size (px)
Citation preview
POVERTY AND INEQUALITY IN
SOUTH AFRICA AND THE WORLD
By P Govender, N Kambaran, N Patchett, A Ruddle, G Torr and N van Zyl
ABSTRACT
This article begins with a discussion of various definitions and concepts of poverty and inequality.
It then distinguishes between objective and subjective concepts of poverty, temporary versus
chronic poverty, and absolute versus relative poverty. The concept of inequality is discussed and
compared with that of poverty. Specific measures of poverty and inequality are considered next.
The measurement of poverty requires the choice of a welfare measure, a benchmark welfare
level for identifying those in poverty (a poverty line), and the selection of one or more appropriate
poverty indicators. The mathematically desirable features of a poverty or inequality measure are
discussed, and the most commonly used measures are described. Some of the special
considerations that arise when measuring poverty and inequality at the world level are then
investigated, and this is followed by a discussion of the datasets available for producing these.
Finally, actual estimates of poverty and inequality in South Africa and the world are examined,
with a particular focus on trying to assess the trend in recent years.
It seems fairly certain that the proportion of people in the world living in absolute poverty has
declined significantly and consistently over the last few decades, and this trend is continuing. There
is less agreement about trends in inequality. Progress against poverty has been very uneven across
regions: there have been dramatic declines in Asia, but the situation in Africa has worsened. There
is an ongoing debate about poverty and inequality trends in South Africa.
KEYWORDS
Poverty; inequality; South Africa; world
CONTACT DETAILS
Mrs Natalie van Zyl, Department of Statistics and Actuarial Science, University of Stellenbosch,
Private Bag X1, Matieland, 7602. Tel: +27(0)21 808 3526; Fax: +27(0)21 808 3830;
E-mail: [email protected]
� Actuarial Society of South Africa � 117
SOUTH AFRICAN ACTUARIAL JOURNAL
SAAJ 7 (2007) 117–60

1. INTRODUCTION
This paper presents the results of some of the most prominent recent research intothe extent and trend of poverty and inequality in South Africa and the world. To place thedebate in context, a brief overview of the theory and practice of poverty and inequalitymeasurement is also provided. The paper is structured as follows. In section 2, variousdefinitions of poverty and inequality are explored. Section 3 considers measures ofpoverty in more detail and section 4 does the same for inequality. A brief introduction tosome of the issues involved with the finding of appropriate data is given in section 5.Section 6 then considers the way that the data are combined to consider world poverty andinequality and the issues that arise when comparing different countries. This is followedin section 7 with a discussion of the actual results arising from the different measures forthe world. Section 8 looks at the results specifically for South Africa.
2. CONCEPTS OF POVERTY AND INEQUALITY
Broadly speaking, poverty refers to different forms of deprivation (e.g. income,basic needs and human capabilities) whilst inequality is concerned with the distribution ofwell-being within a population group (Lok-Desallien, unpublished). Although there areinherent links between the two (ibid.), they are discussed separately in the sections below.
2.1 POVERTY
2.1.1 DEFINITION OF POVERTY
2.1.1.1 As a point of departure for this discussion, it is useful to consider aconception of poverty readily accessible to a layperson. From the Concise Oxford
Dictionary definition of ‘poverty’, combined with the definitions of those terms therein,the following concept can be derived: poverty is the state of lacking adequate means tolive comfortably and the want of things or needs indispensable to life (Pearsall, 1999).
2.1.1.2 This immediately exposes three of the most important dichotomies inthe concept of poverty. Firstly, it covers both the more tangible concept of ‘thingsindispensable to life’ and the broader, more subjective concept of ‘needs indispensableto life’. The latter can refer to biological needs and needs that are socially determined(Boltvinik, unpublished). Secondly, being an overall poverty definition, it does not,however, distinguish between the concepts of temporary and chronic poverty. Thedimension of time is nevertheless an important part of our everyday understanding ofpoverty. Thirdly, the concepts of relative and absolute poverty are also alluded to.Living comfortably is different to sustaining life or achieving a minimum, sociallyacceptable level of well-being. The remainder of this section expands on these threedichotomies:
2.1.2 OBJECTIVE VERSUS SUBJECTIVE IDENTIFICATION
2.1.2.1 The determination of the extent or level of poverty (in whichever formsof deprivation it occurs) requires ‘a comparison between an observed and a normativecondition’ (Boltvinik, op. cit.). This comparison can be made objectively or subjectively.
SAAJ 7 (2007)
118 � POVERTY AND INEQUALITY IN SOUTH AFRICA AND THE WORLD
2.1.2.2 Objective comparisons are generally associated with quantitativemeasures. Economic, educational and some forms of biological deprivation can beobjectively identified. A person can be in economic deprivation from any of threeperspectives, namely: their income, their expenditure or consumption, or their assetpossession. These three perspectives are evident in the discourse on poverty. Somecommentators use education enrolments and achievements as a poverty indicator (Baulch& Masset, 2002). Biological deprivation could mean suffering from malnutrition(Woolard & Leibbrandt, 1999), a chronic disease or a disabling condition (Citro &Michael, 1995).
2.1.2.3 Subjective comparisons are generally associated with qualitativemeasures and often involve participatory identification techniques (Bigsten & Levin,2001). In contrast to objective comparisons, they place a premium on individualpreferences and utility (Lok-Desallien, op. cit.). Such subjective indicators of povertymay include experiences (e.g. stress), livelihood issues (e.g. lack of jobs or arduous, oftenhazardous work), social conditions and political issues (Bigsten & Levin, 2001).Chambers, as quoted in Woolard & Leibbrandt (1999), identifies five dimensions ofpoverty. Two are objective (corresponding to economic and biological deprivation) andthree are subjective. The three subjective poverty dimensions identified are as follows:– physical or social isolation due to peripheral location, lack of access to goods and
services, ignorance or illiteracy;– powerlessness within existing social, economic, political and cultural structures; and– vulnerability to a crisis or the risk of becoming even poorer.
2.1.2.4 A mix of both objective and subjective indicators is given when apopulation’s perception of poverty is elicited. In the South African context,
“Poverty is perceived by the poor to include alienation from the community, food
insecurity, crowded houses, usage of unsafe and inefficient forms of energy, lack of jobs
that are adequately paid and/or secure, and fragmentation of the family.”
May, unpublished
In practice, however, poverty is most commonly measured in money-metric terms (that is,with reference to economic deprivation), whilst social indicators (generally subjective innature) are monitored alongside these. This is the approach followed by the World Bank(Boltvinik, op. cit.).
2.1.2.5 A real understanding of the different concepts and indicators of poverty isnecessary. Not only do different concepts and indicators give rise to different anti-povertystrategies (Lok-Desallien, op. cit.), but they give different measurement results in practice.A study was conducted covering living standards in two villages in India over two periods:from 1963 to 1966, and from 1982 to 1984. Objective (income) and subjective (quality-of-life) indicators were used. Income data revealed that 38% of households in the village hadbecome poorer and that the incidence of poverty had increased from 17% to 23%. Bycontrast, quality-of-life indicators for those households whose income declined revealedoverwhelmingly that their standard of living had improved (Lok-Desallien, op. cit.). Acommon approach used in addressing such contradictory results is to restrict the
SAAJ 7 (2007)
POVERTY AND INEQUALITY IN SOUTH AFRICA AND THE WORLD � 119
definition of poverty to human needs that are economically based (Boltvinik, op. cit.).This approach can be used to distinguish the concept of poverty from that of well-being(where ‘well-being’ is used to capture the overall condition of the person) (Citro &Michael, 1995). Under this distinction, a lonely affluent person cannot be consideredpoor (Boltvinik, op. cit.).
2.1.3 TEMPORARY VERSUS CHRONIC
2.1.3.1 Poverty is not a static condition (May, op. cit.), and a more nuancedunderstanding of it must consequently include the dimension of time. It is possible, forexample, for a wealthy person to suffer a financial reversal or for a poor person to rise outof poverty.
2.1.3.2 The discourse on poverty distinguishes between temporary and chronicpoverty (Carter & May, 2001). Temporarily poor entities (individuals, families orhouseholds) move between poor and non-poor over time. Conversely, chronically poorentities are observed as being poor at each successive observation. In the South Africancontext, the persistence of poverty in rural areas is seen to be due to ‘poverty traps’, that isa lack of complementary assets and services resulting in ‘poverty of opportunity’ (May,op. cit.).
2.1.4 ABSOLUTE VERSUS RELATIVE
2.1.4.1 Key to understanding any indicator of poverty is an appreciation of thedistinction between the concepts of absolute and relative poverty.
2.1.4.2 Absolute poverty is determined without reference to the relative level ofwealth of peers. It is claimed to be an objective, scientific determination as it is based onthe minimum requirement needed to sustain life (Woolard & Leibbrandt, 1999). As such,it is usually based on nutritional needs and essential goods. These may exclude goodsconsidered essential by the relatively wealthy (Lok-Desallien, op. cit.).
2.1.4.3 Relative poverty is a“more subjective or social standard in that it explicitly recognizes that some element of
judgement is involved in determining the poverty level.” Alcock, 1997
An individual is classified as poor relative to the living standards of a society. Thisdefinition of poverty has led to two interpretations of those classified as relatively poor.
2.1.4.4 The first interpretation is that the poorest x% of the population is poor.This percentage is commonly set as 10% or 20% of the population (deciles or quintiles).The percentage that is classified as poor does not change under this definition, regardlessof whether or not their circumstances have improved. This means that, if only thisinterpretation is used, it is not possible to measure the impact of policies implemented toaddress poverty.
2.1.4.5 The second, and most common, interpretation is that poor persons aredefined as such if their living standard (as measured by consumption or income) is belowa percentage of that of their contemporaries (e.g. 50% of mean consumption or income).The percentage of poor is not preset under this minimum acceptable standard of living
SAAJ 7 (2007)
120 � POVERTY AND INEQUALITY IN SOUTH AFRICA AND THE WORLD
definition. However, neither is the level of this standard of living. A society tends to altertheir view as to what constitutes a minimum acceptable level as their mean income rises(Ravallion, 2003).
2.1.4.6 Relative poverty levels can be determined within a country or betweencountries. Poverty is judged very differently in developed and developing countries. Itmay be argued that a poor entity needs a higher level of consumption when living in adeveloped country than when living in a developing one.
2.1.4.7 Sen (1983) summarised a portion of the poverty debate well with hisquestion:
“Should poverty be estimated with a cut-off line that reflects a level below which people
are, in some sense, ‘absolutely impoverished’, or a level that reflects (minimum) standards
of living ‘common to that region’ in particular?”
This debate has yet to come to a close (Boltvinik, op. cit.). The fact that absolute andrelative poverty can move in opposite directions (Lok-Desallien, op. cit.) only serves tofuel the discussion.
2.1.4.8 Consider a situation where the income gap between the relatively rich andpoor narrows because the relatively rich are getting poorer. Relative poverty, as set out inthe second definition given above, will decrease as the mean level of consumption orincome has dropped. However, absolute poverty may increase if a greater percentage of thepopulation falls below the poverty line (the level below which a person is classified aspoor). Conversely, the relatively rich could become poorer, but still stay above the povertyline. In this case, absolute poverty would stay the same. It is useful to consider both absoluteand relative poverty levels as these concepts highlight different aspects of poverty.
2.1.4.9 It has been said that, when monitoring poverty within countries, it is bestto let each indicator speak for itself (Lok-Desallien, op. cit.).
2.2 INEQUALITY2.2.1 DEFINITION OF INEQUALITY
‘Inequality’ refers to variations in the standards of living across a wholepopulation or region. In its broadest sense, it refers to any aspect of deprivation. Thesemay include, for example, deprivation in terms of income, assets, health and nutrition,education, social inclusion, power and security. In the simplest case, using income as theaspect of deprivation, no inequality would exist if everyone had the same income andmaximum inequality would exist if only one person had all the income. Inequality is notthe same as poverty but is closely related to poverty. Higher levels of inequality in acountry usually imply higher levels of absolute and relative poverty in that country.
2.2.2 ABSOLUTE VERSUS RELATIVE INEQUALITY
2.2.2.1 Relative inequality depends on the ratios of individual incomes to theoverall mean. Thus, if all incomes grow at the same rate, then relative inequality isunchanged. Conversely, absolute inequality depends on absolute differences in the levelsof income.
SAAJ 7 (2007)
POVERTY AND INEQUALITY IN SOUTH AFRICA AND THE WORLD � 121
2.2.2.2 An example will help illustrate the difference. Consider two households,one with an income of R1000 and the other with an income of R10 000. The mean incomeof the two households is R5500. The absolute level of inequality between the twohouseholds is R9000. If we look at the relative inequality of the two households then thefirst household’s income is 82% below the mean income and the second household’sincome is 82% above the mean income.
2.2.2.3 If both household incomes grow at a real rate of 100% over a period, thehousehold incomes will be R2000 and R20 000 respectively (in the money terms existingat the commencement of that period). The mean income of the two households is nowR11 000. The absolute level of inequality between the two households is now R18 000.The first household’s income is still 82% below the mean income and the secondhousehold’s income is still 82% above the mean income. Absolute inequality has risenwhile relative inequality has stayed the same.
2.2.2.4 Relative inequality is the concept most commonly used in literaturedealing with the analysis of inequality.
3. MEASURES OF POVERTY
In order to measure poverty, there are a number of steps to be followed. Firstly,the concept of poverty being measured needs to be defined. Secondly, a povertyline—relative to the concept of poverty adopted—needs to be specified. Finally, theappropriate poverty measurements need to be selected. This section of the paper focuseson these three steps.
3.1 CHOOSING THE CONCEPT OF POVERTYAs can be seen from the previous section, the concept of poverty is not an
uncontested one. There is indeed a wide range of opinion on what best defines a situationone would call ‘poverty’. This diversity of opinion leads naturally to a diversity ofapproaches in the measurement of poverty.
3.1.1 CHOOSING THE POVERTY MEASURE
Most empirical studies tend to focus on money-based measures—either income orconsumption expenditure—when assessing the level of poverty. However, while thesetwo money-based measures do provide an intuitively appealing view of poverty, it isimportant to realise that they do not necessarily capture the full, often nuanced, picture ofpoverty, not all of which can easily be reduced to a single measure. Nevertheless, they doprovide a useful feel for the level of poverty of the geographical areas or communities thatis observed at a point in time and across time. The assumed link between the distributionof income or expenditure and the distribution of welfare has a theoretically coherentunderpinning. This link, although it will not be delved into here, is generally accepted bythose involved in the measurement of poverty. It is thus money-based measures ofpoverty that are the focus of this paper.
SAAJ 7 (2007)
122 � POVERTY AND INEQUALITY IN SOUTH AFRICA AND THE WORLD
3.1.2 INCOME VERSUS EXPENDITURE
3.1.2.1 Having acknowledged such money-based measures as acceptablemeasures of poverty, the debate moves into the consideration of the relative merits of theincome and expenditure methods. The aim of such measures is to assess the level ofconsumption of market goods, and thus an individual’s or household’s level of welfare.
3.1.2.2 Expenditure is often the preferred measure, and indeed the World Bankofficially measures poverty in these terms (Woolard & Leibbrandt, 1999). There aremany reasons for this, the most important of which are:– Expenditure is a more direct measure of consumption than income, reflecting more
directly the degree of commodity deprivation. It is thus often regarded as being a betterindicator of household welfare (Samson et al, unpublished).
– Income tends to vary more over time, while expenditure is usually smoothed, and thusgives a more reliable picture of the actual consumption of the individual or household(Samson et al, op. cit.).
– Income tends also to be a more delicate topic, and is thus less reliably reported insurveys, than expenditure (Samson et al, op. cit.; Woolard, unpublished).
There are, however, those who argue that income provides a more sensitive measure ofthe exposure to deprivation. This is grounded in the idea that deprivation should beconsidered relative to both actual consumption and consumption security or wealth. Therelatively more variable nature of income over time, as observed above, adds to its appealas a measure of poverty. The main advantage of an expenditure approach, under thisargument, lies in its relative reliability in surveys.
3.1.3 UNITS OF MEASURE
3.1.3.1 Poverty can be measured at an individual or at a household level. Ingeneral the household level is preferred for the following reasons (Samson et al, op. cit.):– Income and expenditure data are usually derived from household surveys and are
therefore difficult to break down further to an individual level. This is particularly thecase with expenditure.
– The household is often considered to be the level at which economic decisions aretaken. Income from individuals within a household is often pooled, especially in thecase of the poor.
There are a number of methodological and practical issues that arise when using thehousehold as the unit of measurement. These are caused by the fact that households differin both size and demographic composition, making a straightforward comparison ofconsumption of households very difficult to interpret (Woolard & Leibbrandt, 1999).
3.1.3.2 To address these methodological issues, it is common practice to use someform of normalisation. This involves adjustments to household income or expenditureusing household equivalence scales, which allow direct comparison between households ofdifferent size and composition. Such household equivalence scales generally have twotypes of adjustment to income or expenditure in common (Samson et al, op. cit.):
SAAJ 7 (2007)
POVERTY AND INEQUALITY IN SOUTH AFRICA AND THE WORLD � 123
– Household income or expenditure is multiplied by a factor to allow for economies ofscale.
– Different ‘weights’ are applied to different household members (for example, childrenvs. adults) to allow for the different consumption requirements of households ofdiffering composition.
3.2 POVERTY LINES3.2.1 Having defined the concept of poverty to be used, we must then
determine the level of the concept that must be attained in order for the entity not to beconsidered poor. This level is the poverty line.
3.2.2 A poverty line is the welfare level below which people are regarded asbeing poor, for example the level of income or expenditure. Any poverty line is eitherabsolute or relative in nature. An absolute poverty line is defined relative to the level ofincome or expenditure consistent with a minimum standard of living. For example, anabsolute poverty line could be the level of income needed to purchase a defined basicbasket of food that would provide adequate nutrition. A relative poverty line is defined byreference to others in the population, so that the line could increase in line with anincrease in the average income of the population. A simple relative poverty line would bethat level of income or expenditure below which 40% of the population falls. While theidea of a relative poverty line is in one sense intuitively appealing, absolute poverty linestend to be used in general. This is because, as discussed in the previous section, relativepoverty lines often predetermine the extent of poverty, thus making it difficult to assessthe impact of interventions designed to alleviate poverty (Woolard, op. cit.).
3.2.3 There is always an element of arbitrariness in poverty lines, despite thescience that appears to exist in the determination of an appropriate level (e.g. through acalorie norm), and particularly in view of the essentially political nature of the definitionof a level below which people are considered to be poor. The main use of poverty linesshould thus be to assess changes in levels of poverty over time, rather than the absoluteextent of poverty at a particular time (Deaton, 2004; Samson et al, op. cit.).
3.2.4 Given the impossibility of drawing up a single poverty line that meets allrequirements, most researchers argue that it is useful to use multiple poverty lines (bothabsolute and relative), or a poverty critical range (a range of income or expenditure withinwhich poverty levels are assessed). This allows for the testing of the sensitivity ofmeasures to small changes in the setting of the poverty line (Ravallion, 1992).
3.3 POVERTY MEASUREMENT TOOLSFinally, having decided which concept of poverty to use and the critical level of this
concept, as expressed in a poverty line, it is necessary to consider the actual tools required toprovide an indication of the level of poverty in the population under consideration.
3.3.1 PRINCIPLES IN DEFINING A POVERTY MEASUREMENT TOOL
There are certain generally accepted principles for a sound measurement tool orindex. These provide a good benchmark against which to assess any potential poverty
SAAJ 7 (2007)
124 � POVERTY AND INEQUALITY IN SOUTH AFRICA AND THE WORLD
measurement tool under consideration. Four key principles, put forward by Sen (1976)that should be aimed for are:– the monotonicity axiom:
If the income or expenditure of a poor individual falls (rises), the index must rise (fall).– the transfer axiom:
If a poor individual transfers income or expenditure to someone less poor than herself(whether poor or non-poor), the index must rise.
– the population-symmetry axiom:If two or more identical populations are pooled, the index must not change.
– the proportion-of-poor axiom:If the proportion of the population which is poor grows (diminishes), the index mustrise (fall).
3.3.2 FGT FAMILY OF MEASUREMENT TOOLS
3.3.2.1 The most commonly used and quoted poverty measurement tools are theheadcount index and the poverty gap index. The headcount index is defined as theproportion of the population under consideration that is poor. The poverty gap provides areflection of the depth of poverty among the poor—i.e. the average distance over thewhole population that those who are poor are from the poverty line (Woolard, op. cit.).Both these indices are special cases of the class of measures put forward by Foster, Greer& Thorbecke (1984). This grouping of measures is generally referred to as the FGT classof poverty measures. A generic formulation of the FGT class of measures can be given as(Woolard & Leibbrandt, 1999):
P for�� �� � �
�
�10
1nz y zi
i
q
[( / ] ;
where: z is the poverty line;yi is the welfare measure or indicator of the ith individual or household for which
yi < z;a is the ‘aversion to poverty’ parameter;n is the total number of individuals or households in the population; andq is the number of ‘poor’ individuals or households, i.e. where yi < z.
When á = 0, the FGT class yields the headcount index. When á = 1, the outcome is thepoverty-gap index. Higher-order values of á simply increase the sensitivity of themeasure to the welfare of the poorest person in the population. At the extreme (an á valueapproaching infinity), the FGT class would yield an indicator reflecting the welfare of thepoorest person alone.
3.3.2.2 One of the advantages of the FGT class of poverty measures is that totalpoverty can be decomposed into additive sub-group poverty shares. Suppose that thepopulation of n individuals is split into m mutually exclusive and exhaustive subgroupsthat we index by {1,2,…,m}. Let ng be the size of group g. The FGT index can bedecomposed additively as:
SAAJ 7 (2007)
POVERTY AND INEQUALITY IN SOUTH AFRICA AND THE WORLD � 125

Fn
nF
g
g
m
g��
�1
;
where Fg is the FGT index for group g. The contribution of subgroup g to overall povertyis:
n
nF
g
g .
This property allows for flexibility in the measurement of poverty, in particular thechanges in poverty over time and the relative contribution of individual subgroups to thelevel of poverty. This is because if we change the level of income or expenditure insubgroup g so that we reduce poverty in this subgroup and leave the other subgroupsunchanged, then total poverty in the population should decrease.
3.3.2.3 The headcount index does not meet the monotonicity axiom, as themeasurement is not necessarily affected by shifts in the distribution of income orexpenditure among the poor. Thus, a policy that only results in making the poor evenpoorer would not affect the headcount index (May & Woolard, unpublished). It also doesnot meet the transfer axiom, as a transfer from a poor person to someone less poor doesnot result in a rise in the headcount index. In fact, the index would fall if there were a netredistribution from the very poor to the just-poor that results in the just-poor being liftedout of poverty. This treatment of poverty as a discrete condition fails to capture the factthat one does not acquire or shed the things associated with poverty merely by passing aparticular income or expenditure line (Woolard & Leibbrandt, 1999). Social-welfarepolicy based purely on the headcount index can thus clearly lead to undesirable actions, asit gives no indication of the severity of poverty with regard to income or expenditure(May & Woolard, op. cit.). The index does, however, meet the population-symmetryaxiom—its additive decomposability ensures this—and, by its very definition, meets theproportion-of-poor axiom.
3.3.2.4 The poverty-gap index meets the monotonicity axiom as it is strictlydecreasing in the living standards of the poor (May & Woolard, op. cit.). If the income ofa poor individual falls, the poverty gap will rise, and vice versa. It also meets thepopulation-symmetry axiom—its additive decomposability ensures this. It does not,however, meet the transfer axiom, as the poverty gap is not affected by transfers amongthe poor that make for greater inequality in income or expenditure distribution (May &Woolard, op. cit.). It also does not always meet the proportion- of-poor axiom; as it doesnot depend on the actual number of poor people, it will not necessarily change when thenumber or proportion of poor people is increasing or decreasing.
3.3.3 COMPOSITE INDICATORS
3.3.3.1 There are a number of widely quoted poverty or development indicatorsin use. These are based on a variety of different combinations of welfare measures andpoverty lines. Two of the best known are the United Nations Development Programme(UNDP) Human Development Index (HDI), and the Sen Index.
3.3.3.2 The HDI, used since 1993 by the UNDP, measures welfare in a standard
SAAJ 7 (2007)
126 � POVERTY AND INEQUALITY IN SOUTH AFRICA AND THE WORLD
way across countries. It uses objective or quantitative information to measure the averageachievements in a country in three basic dimensions of human development (Vella &Vichi, 1997; Bhorat, Poswell & Naidoo, 2004):– a long and, by implication, healthy life, as measured by life expectancy at birth index;– knowledge, as measured by an education index, measuring both adult literacy and the
general enrolment in primary, secondary or tertiary education; and– a decent standard of living, as measured by an index of gross domestic product (GDP)
per capita.3.3.3.3 Another composite index proposed by Amartya Sen, hence known as the
Sen Index, is a combination of the headcount index, the poverty gap index, and the Ginicoefficient (discussed in more detail in the next section on measuring inequality) (May &Woolard, op. cit.). It is an attempt to reflect the degree of inequality in the distribution ofincome or expenditure among the poor, and is calculated as the average of the headcountindex and poverty-gap index weighted by the Gini coefficient of the poor. As a formula itis:
S HG P G� �( )1 ;
where: H is the population headcount index;P is the population poverty-gap index; andG is the Gini coefficient of the poor.
It can thus be seen that if G = 0 (i.e. no inequality among the poor), the Sen Index is simplythe same as the poverty-gap index. Likewise, if G = 1 (i.e. one household among the poorhad all the income), the Sen Index would simply be the same as the headcount index. Inother words, the Sen Index takes into account the number of poor, their shortfall inincome or expenditure relative to the poverty line, and the degree of inequality in thedistribution of their income or expenditure.
4. MEASURES OF INEQUALITY
Income inequality relates to the distribution of income in a population. There aremany ways to measure inequality, although most simply yield summary statistics of theincome distribution. For example, one could measure the share of the poorest 10% or20% of the population in total income, the ratio of the income of the richest 10% or 20%of the population to that of the poorest 10% or 20% of the population or the variance ofincome in a population. Two of the most common measures of relative income inequalityare discussed in this section: the generalised entropy class of measures and the Ginicoefficient. As previously discussed, the focus is on income inequality in particular.
4.1 DESIRABLE FEATURES OF AN INCOME INEQUALITY INDEXThere are many ways to measure inequality. However, some measures that are
mathematically and intuitively very appealing can produce misleading results. Forexample, the variance, which must be one of the simplest measures of inequality, is notindependent of the income scale. The simple doubling of all incomes would lead to a
SAAJ 7 (2007)
POVERTY AND INEQUALITY IN SOUTH AFRICA AND THE WORLD � 127
fourfold increase in the estimate of inequality. Hence, inequality measures shouldgenerally meet the following set of axioms (Litchfield, unpublished1):– the Pigou–Dalton transfer principle:
An income transfer from a poorer person to a richer person should register as a rise (orat least not as a fall) in inequality and an income transfer from a richer to a poorerperson should register as a fall (or at least not as an increase) in inequality.
– income scale independence:The inequality measure should not depend on the magnitude of total income; i.e. ifeveryone’s income changes by the same proportion, the measure of inequality shouldnot change.
– the principle of population:The inequality measure should not depend on the number of income receivers.
– anonymity:It should only be affected by the incomes of the individuals. No other characteristics ofthe individual should affect the index.
– decomposability:This requires overall inequality to be related consistently to constituent parts of thedistribution, such as population sub-groups. For example, if inequality is seen to riseamongst each sub-group of the population then one would also expect overallinequality to increase. Some measures are easily decomposed into intuitively appealingcomponents of within-group inequality and between-group inequality, while othermeasures can be decomposed but the two components of within-group andbetween-group inequality do not sum to total inequality.
Any measure that satisfies all these axioms is a member of the generalised entropy (GE)class of inequality measures.
4.2 INCOME INEQUALITY MEASURES4.2.1 GE CLASS OF MEASURES
4.2.1.1 Members of the GE class of measures have the following general formula(Litchfield, op.cit.):
Gn
y
yi
n
( )( )
�� �
�
��
��
�
��� �
���
�
�
��
�
�1 11
2
1
1
;
where:n is the number of individuals in the sample;yi is the income of individual i;i {1,2,…..,n};� � 0; and
y =1
1nyi
i
n
�
� is the arithmetic mean income.
SAAJ 7 (2007)
128 � POVERTY AND INEQUALITY IN SOUTH AFRICA AND THE WORLD
1 Source: Inequality: Methods and Tools World Bank,www1.worldbank.org/prem/poverty/inequal/methods/litchfie.pdf, 2006
The value of G(�) ranges from 0 to �, zero representing an equal distribution (i.e. allincomes identical) and higher values representing higher levels of inequality. Theparameter � represents the weight given to distances between incomes at different partsof the income distribution, and can take any real value. For lower values of �, G(�) ismore sensitive to changes in the lower tail of the distribution, and for higher values it ismore sensitive to changes that affect the upper tail. The most commonly used values of �are 0, 1 and 2. The value � = 0 gives more weight to distances between incomes in thelower tail, � = 1 applies equal weights across the distribution and � = 2 givesproportionately more weight to gaps in the upper tail. Putting � = 0 and � = 1 in the aboveformulae will result in indeterminate values. The values can only be determined as limitsusing l’Hopital’s rule. The GE measures with parameters 0 and 1 become two of Theil’smeasures of inequality, the mean logarithm deviation and the Theil index respectively(Litchfield, op. cit.); i.e.:– the mean logarithm deviation:
Gn
y
yii
n
( ) log01
1
��
� ; and
– the Theil Index:
Gn
y
y
y
y
i
i
n
i( ) log11
1
��
� .
Both of these measures are widely used because of their property of decomposability. Inthis manner, total group inequality can be split into within-sub-group inequality andbetween-sub-group inequality. The mathematics of this is outside the scope of this paper.
4.2.1.2 The point of this decomposition is to separate total inequality in thedistribution into a component of inequality between the chosen groups (Ib), and theremaining within-group inequality (Iw). Two types of decomposition are of interest:firstly the decomposition of the level of inequality in any one year, i.e. a staticdecomposition, and secondly a decomposition of the change in inequality over a period oftime, i.e. a dynamic decomposition.
4.2.1.3 When total inequality, I, is decomposed by population subgroups, the GEclass can be expressed as the sum of within-group inequality, Iw, and between-groupinequality, Ib. Within-group inequality Iw is defined as:
I w Gw j
j
k
j��
�1
( )� ;
where:w v fj j j
� �� �1 ;
fj is the population share and vj the income share of each partition j, j=1, 2,.. k. In practicalterms, the inequality of income within each sub-group is calculated and then these aresummed, using weights of population share, relative incomes or a combination of thesetwo, depending on the particular measure used. Between-group inequality, Ib, ismeasured by assigning the mean income of each partition j, y
jto each member of the
partition and calculating:
SAAJ 7 (2007)
POVERTY AND INEQUALITY IN SOUTH AFRICA AND THE WORLD � 129

I fy
yb j
j
j
k
��
�
��� �
���
�
�
��
���
� �
�11
21( )� �
�
.
Cowell & Jenkins (1995) show that the within-group and between-group components ofinequality, defined as above, can be related to overall inequality in the simplest possibleway (Litchfield, op. cit.):
I I Ib w � .
4.2.2 GINI COEFFICIENT
4.2.2.1 The Gini coefficient is the most widely used measure of incomeinequality. It is a summary statistic of income inequality, which varies from 0 (when thereis perfect equality and all the individuals earn equal income) to 1 (when there is perfectinequality and one individual earns all the income and the other individuals earn nothing).
4.2.2.2 The Gini coefficient is calculated from the Lorenz curve. The Lorenzcurve plots the cumulative percentage of households against the cumulative percentage ofhousehold incomes, households being ordered in increasing order of income. Figure 4.1provides a hypothetical example of a Lorenz curve. The Gini coefficient measures thearea between the Lorenz curve and the hypothetical line of absolute equality, expressed asa fraction of the area under the line.
4.2.2.3 In a situation of perfect equality the Lorenz curve would coincide withthe line of perfect equality and the Gini coefficient would equal zero. In the theoreticalsituation of one household earning all the income, the Lorenz curve would coincide withthe horizontal axis and the Gini coefficient would equal 100%. The Gini coefficientsatisfies the transfer principle, the income-scale-independence feature and the anonymityprinciple. However, it is not easily decomposable.
SAAJ 7 (2007)
130 � POVERTY AND INEQUALITY IN SOUTH AFRICA AND THE WORLD
0%
10%
20%
30%
40%
50%
60%
70%
80%
90%
100%
0%10% 20% 30% 40% 50% 60% 70% 80% 90%
100%
Cumulative % of Income
Cu
mu
lati
ve
%o
fH
ou
seh
old
s
Line of Perfect Equality
Lorenz Curve
Figure 4.1. Lorenz Curve
5. DATA
5.1 USING HOUSEHOLD SURVEYS TO MEASURE POVERTY & INEQUALITYIn order to estimate poverty or inequality, the distribution of income or
expenditure over the population needs to be estimated. The data for estimating thisdistribution come from household surveys, in which random samples of households arevisited and asked questions about their income or expenditure. The results of theserandom samples can then be used to estimate the distribution of the population as a whole,e.g. the Lorenz curve. The quality of the data captured by the survey is affected by manydifferent factors some of which are discussed below (Deaton, op. cit.):– Questionnaire design and the manner of posing questions can influence survey answers.– The period over which the survey is conducted may not allow appropriately for
seasonality of income and expenditure.– In a survey, a single member of a household tends to be interviewed, and the survey is
reliant on such individuals’ ability to recall the consumption or income over a period.– Items such as implicit rent for owner-occupiers are often not included in surveys,
whilst questions regarding illegal items may give rise to misleading responses.In particular, surveys tend to underestimate household consumption and incomeparticularly at higher incomes as richer households are both less likely to respond tosurveys and more likely to under-report their incomes. The level of adjustment needed tobring survey incomes back to actual incomes tends to be minimal for the lower deciles butcan be as much as 30 to 50% for the richest decile (Ravallion, 2003).
5.2 USING NATIONAL ACCOUNTS TO ADJUST MEASURES OF POVERTYAND INEQUALITY
5.2.1 The average consumption or income measured by surveys does notgenerally equal that measured by the national accounts of countries. Some researchersbelieve that the average as measured by the national accounts is more accurate and thatthe mean of the distribution from the household surveys should be scaled up to match themean from the national accounts. Although average consumption is in fact often scaledup, the actual distribution must still be taken from the surveys.
5.2.2 National accounts do not fully reflect average consumption either, asthey are not produced with the aim of measuring poverty or inequality; they are designedto measure macro-economic aggregates. While they do not capture all non-marketincome and expenditure, own production, gifts and wages in kind, they usually includeitems not consumed by households. Any estimation involved in producing the finalnumbers is structured to capture large transactions and not small ones (Deaton, op. cit.).
5.3 WHICH DATA SOURCE IS BETTER5.3.1 Neither household surveys nor national accounts can provide accurate
estimates of poverty and inequality. Household surveys tend to show a pessimistic viewof poverty while national accounts show a more optimistic view. In addition to this,household surveys are increasingly capturing smaller proportions of national-accountsincome and, as a result, the trends over time are diverging. This may in part be because
SAAJ 7 (2007)
POVERTY AND INEQUALITY IN SOUTH AFRICA AND THE WORLD � 131

richer households are less likely to participate in surveys. The true answer probably liessomewhere between the two views. It is impossible for many countries to makeappropriate adjustments to the national accounts to make them comparable with surveytotals. In such cases, both types of data should be used but not necessarily combined, as itis almost impossible to compare and pull the results together (Deaton, op. cit.).
5.3.2 Until 1990 most of the World Bank’s poverty work used nationalaccounts to scale up the means derived from surveys. In the early 1990s the World Bankswitched to using the results derived directly from the surveys both for the worldestimates and for the work on individual countries.
5.3.3 Some researchers measuring world poverty still think it is better to scale upthe mean incomes using national accounts. In general, their results tend to show far greaterreduction in world poverty—see section 7 for a detailed discussion of the different results.
5.4 COMPARISON OF RESULTS FROM NATIONAL ACCOUNTS ANDHOUSEHOLD SURVEYS
Table 1 shows the average unweighted ratio of survey consumption to nationalaccounts consumption for a range of countries. The results shown were taken mostly fromWorld Bank surveys and cover 127 countries from 1979 to 2000. In that table, the ratiofor Sub-Saharan Africa probably says more about underestimation in national accountsthan it does about true differences between the different types of data.
Table 1. Average unweighted ratio of survey consumptionto national accounts consumption2
Countries Ratio
All countries 0,86
OECD countries 0,78
Sub-Saharan Africa 1,00
6. ANALYSIS OF WORLD POVERTY AND INEQUALITY
So far, it has been unnecessary to be specific about the group of people whosepoverty or inequality is being measured. Most of the concepts and measures that havebeen discussed could just as easily be applied to all the people in a town, country and soon. Most often, poverty and inequality measurements tend to be carried out for aparticular country or sub-groups within a country (e.g. urban vs. rural areas). This isusually the level at which policy is formulated and economic progress measured. In recentyears, however, increasing attention has been focused on worldwide poverty andinequality. While the basic concepts and measures apply equally well, there are specificproblems that arise in trying to calculate world poverty and inequality rates that simply donot arise at the local or national levels. This section discusses these issues.
SAAJ 7 (2007)
132 � POVERTY AND INEQUALITY IN SOUTH AFRICA AND THE WORLD
2 Deaton (op. cit.)
6.1 CONVERTING INTO A COMMON CURRENCY6.1.1 Income and expenditure data for each country will be expressed in that
country’s own currency. In order to be able to compare these amounts across countries, orto produce aggregate figures for the world as a whole (e.g. a world Gini coefficient), it isnecessary to express the data in a common currency.
6.1.2 The obvious way to do this is to use market exchange rates. This isproblematic though, as converting currencies at market exchange rates can introduceserious distortions in the comparison of living standards in different countries. Inparticular, it makes poor countries seem even poorer than they are in reality because,when converted into a common currency at market exchange rates, many goods andservices in poor countries are significantly cheaper than they are in rich countries. Forexample, a United States of America (USA) dollar converted into Indian rupees at marketexchange rates can buy much more in India than it would be able to buy in the USA.
6.1.3 The solution used by almost all researchers is to convert at a different setof exchange rates, called purchasing-power parity (PPP) exchange rates. These aredesigned to convert currencies in a way that preserves purchasing power. Under PPPexchange rates, a dollar would be converted into the number of rupees required to be ableto purchase in India whatever a dollar can purchase in the USA.
6.1.4 Differences between incomes or expenditures converted at market versusPPP exchange rates can be substantial. For example, calculations based figures in ProfileBooks (2006) show that the ratio of market-rate GDP to PPP GDP was around 5:1 forChina and India and around 3:1 for South Africa, Brazil and Indonesia in 2005. Clearly,such large differences would have a massive effect on calculations of world poverty andinequality (calculations based on market exchange rates showing much higher povertyand inequality). One of the first questions to ask, then, when analysing world poverty andinequality figures, is whether they are based on market or PPP exchange rates.
6.1.5 While almost everyone agrees that using PPP exchange rates gives amuch more comparable measure of living standards in different countries than is achievedby using market rates, the procedure is not without its problems. PPP rates generally usedare not constructed with the purpose of measuring poverty, so they will not necessarilyaccurately convert living standards of the poor from one country to another. Also, PPP ratesare not always updated frequently and are not even calculated for every country. Possiblyinaccurate interpolations and imputations are thus often required to fill in the gaps.
6.2 MEASURING POVERTY – WHAT IS THE APPROPRIATE POVERTY LINE?6.2.1 One way of estimating the number of poor people in the world would be
to simply add up the poverty counts from each country (assuming these exist). Thisestimate would not really be of much use as different countries use a variety of differentpoverty lines. The adding together of poverty counts based on completely different levelsof poverty would have little meaning. For example, Deaton (2004) reports that accordingto the USA Census Bureau there were 32,9 million poor people in the United States in2001. The Indian government estimates that there were 260 million poor people in Indiaat roughly the same time. As Deaton says,
SAAJ 7 (2007)
POVERTY AND INEQUALITY IN SOUTH AFRICA AND THE WORLD � 133
“there are few people who take a strong enough relativist view of poverty so as to argue
that these poverty counts are commensurate and simply add them up.”
The use of national poverty lines, which are generally higher the richer the country, istherefore inappropriate for the calculation of world poverty.
6.2.2 By far the best known and most widely used international poverty line isthe ‘$1 a day’ line used by the World Bank. Part of the appeal of this measure is the factthat it is simple and memorable. It is important to be aware, however, that differentestimates of world poverty and inequality are often based on slightly different definitionsof ‘$1 a day’. This is not surprising because $1 a day is not enough to fully define apoverty line. Two further factors need to be specified: the base year and the PPPconversion factors to be used. The original $1-a-day line was defined by the World Bankto mean a (USA) $1 a day in 1985 prices, converted to local currencies using 1985 PPPfactors, and scaled up or down for other years using local price indices. The definitionwas changed in the late 1990s to become $1–08 in 1993 prices and converted to localcurrencies using the revised 1993 PPP factors. Other researchers often use different baseyears and PPP factors.
6.3 DIFFERENT CONCEPTS OF WORLD INEQUALITYTo understand what is happening to inequality on a global level, it is necessary to
distinguish between three very different concepts of world inequality:6.3.1 Concept 1 is concerned with inequality across countries. Mean incomes
of the individual countries of the world are combined to calculate the desired measure ofworld income inequality, such as the world Gini coefficient. Concept-1 measures, such asthe ratio of the per-capita GDP of the world’s richest and poorest countries, are often usedas the justification for claims that world inequality has dramatically increased in recentdecades. While they do have their uses, such measures do not tell us much aboutinequality among the world’s individuals because different countries have differentpopulation sizes. Using concept-1 measures, a fast increase in the average income of asmall poor country such as Swaziland will have a similar impact on world inequality tothat of an equivalent increase in the average income of China, even though China hasmore than 1000 times as many people.
6.3.2 Concept-2 measures of world inequality overcome this problem byweighting the mean income of each country by its population size. This simple adjustmentcan make a dramatic difference to the estimate of the trend in world inequality. Whereasunweighted concept-1 measures have shown a clear divergence in average incomes acrosscountries in recent decades, population-weighted measures equally clearly indicateconvergence. This is discussed further in section 7. For now, it is worth simply noting thatthe conceptual difference between the two measures makes such a finding entirelyplausible. A few large and populous Asian countries have experienced very rapid growth,while Africa, with its large number of relatively small countries, has stagnated.
6.3.3 Concept-2 inequality still does not represent the true inequality betweenall the individuals of the world, however, because it takes no account of inequality within
SAAJ 7 (2007)
134 � POVERTY AND INEQUALITY IN SOUTH AFRICA AND THE WORLD
countries. It is effectively assumed that everybody within a country has the same level ofincome (the national average income). Concept-3 inequality abandons this assumptionand refers to the inequality between all the individuals of the world, regardless of wherethey happen to live. It consists of the population-weighted inequality between the averageincomes of individuals in the different countries of the world and the inequality betweenthe individuals within those countries.
6.3.4 Despite the fact that concept-3 inequality is probably the most naturaland theoretically correct concept of world inequality among individuals, it was not untilrecently that researchers began to pay a great deal of attention to it. The probable reasonfor this is the complexity of the data requirements for calculating concept-3 inequality.Whereas the calculation of concept-2 inequality requires knowledge only of the averageincome and the population size of each country, the calculation of true world inequalityrequires knowledge of the full income distribution of each country. It may be possible togain a deeper understanding of world inequality by breaking the overall estimate into thecomponents that represent inequality between countries (this is effectively concept-2inequality) and those that represent inequality within countries. Decomposable inequalitymeasures (see section 4) are capable of showing this breakdown.
6.3.5 Finally, it is worth mentioning a common pitfall that arises in thediscussion of inequality on a global level. This is the assumption that if unweightedinequality between countries (concept 1) is increasing, and inequality within countries isgenerally increasing, then world inequality among individuals must also be increasing.This is incorrect, because it is population-weighted (concept-2) inequality that matters forthe between-country component of concept-3 inequality. It is possible for inequality to beincreasing in every single country in the world and for unweighted inequality amongcountries to be increasing, while world inequality among individuals remains constant ordecreases. All that is required is for a number of populous, relatively poor countries togrow faster than the world average, so that population-weighted inequality betweencountries decreases. In fact, as seen in section 7 below, this is almost exactly what hasactually been happening.
6.4 DATASETS AVAILABLE TO MEASURE WORLD POVERTY6.4.1 Before 1980 there were very little data available to measure global
poverty and to determine how the poor were faring as economic circumstances changed.In the early 1980s the World Bank established the Living Standard Measurement Survey(LSMS) to remedy this lack of data (Deaton, op. cit.).
6.4.2 The situation is completely different in 2006. PPP exchange rates arewell defined and many internationally comparable national accounts are now available(Deaton, op. cit.). There are upwards of 400 household surveys available, covering 100countries (Ravallion, 2003). The World Bank has laid out minimum criteria that must bemet for them to use the results of a household survey. Amongst other things, such surveysmust be nationally representative and must include own production (Ravallion, 2003).
6.4.3 Despite the wealth of datasets available it is not always easy to comparethe results of surveys across countries or to develop an overall picture of world poverty.
SAAJ 7 (2007)
POVERTY AND INEQUALITY IN SOUTH AFRICA AND THE WORLD � 135
Some surveys measure income and others measure expenditure. Survey protocols alsodiffer across countries and over time (Ravallion, 2003; Deaton, op. cit.).
7. ESTIMATES OF WORLD POVERTY AND INEQUALITY
In this section, the findings of some of the most prominent research into the extentand trend of poverty and inequality in the world are presented and key aspects of theglobal debate are highlighted.
7.1 WORLD POVERTY7.1.1 LATEST WORLD BANK POVERTY ESTIMATES
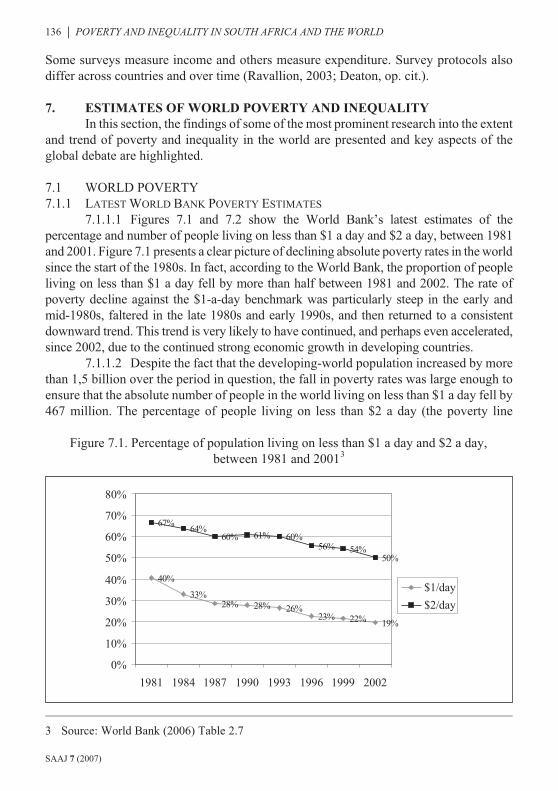
7.1.1.1 Figures 7.1 and 7.2 show the World Bank’s latest estimates of thepercentage and number of people living on less than $1 a day and $2 a day, between 1981and 2001. Figure 7.1 presents a clear picture of declining absolute poverty rates in the worldsince the start of the 1980s. In fact, according to the World Bank, the proportion of peopleliving on less than $1 a day fell by more than half between 1981 and 2002. The rate ofpoverty decline against the $1-a-day benchmark was particularly steep in the early andmid-1980s, faltered in the late 1980s and early 1990s, and then returned to a consistentdownward trend. This trend is very likely to have continued, and perhaps even accelerated,since 2002, due to the continued strong economic growth in developing countries.
7.1.1.2 Despite the fact that the developing-world population increased by morethan 1,5 billion over the period in question, the fall in poverty rates was large enough toensure that the absolute number of people in the world living on less than $1 a day fell by467 million. The percentage of people living on less than $2 a day (the poverty line
Figure 7.1. Percentage of population living on less than $1 a day and $2 a day,between 1981 and 20013
SAAJ 7 (2007)
136 � POVERTY AND INEQUALITY IN SOUTH AFRICA AND THE WORLD
40%
33%28% 28% 26%
23% 22% 19%
67%64%
60% 61% 60%56% 54%
50%
0%
10%
20%
30%
40%
50%
60%
70%
80%
1981 1984 1987 1990 1993 1996 1999 2002
$1/day
$2/day
3 Source: World Bank (2006) Table 2.7
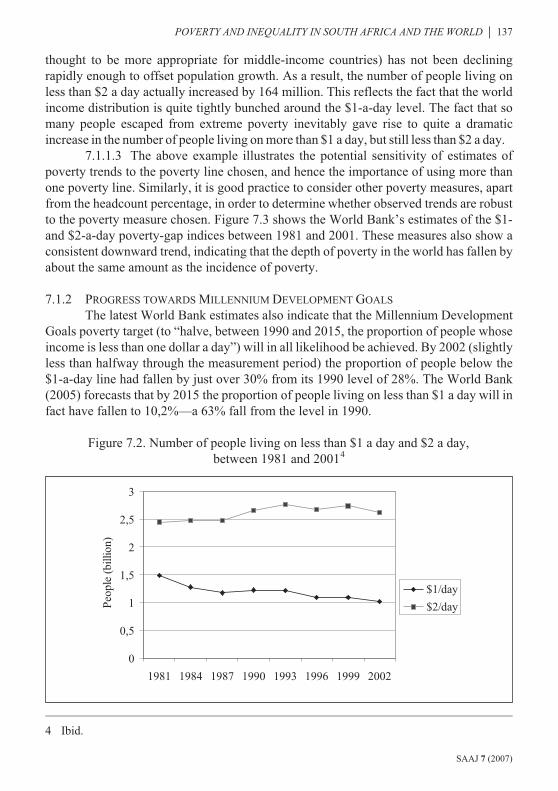
thought to be more appropriate for middle-income countries) has not been decliningrapidly enough to offset population growth. As a result, the number of people living onless than $2 a day actually increased by 164 million. This reflects the fact that the worldincome distribution is quite tightly bunched around the $1-a-day level. The fact that somany people escaped from extreme poverty inevitably gave rise to quite a dramaticincrease in the number of people living on more than $1 a day, but still less than $2 a day.
7.1.1.3 The above example illustrates the potential sensitivity of estimates ofpoverty trends to the poverty line chosen, and hence the importance of using more thanone poverty line. Similarly, it is good practice to consider other poverty measures, apartfrom the headcount percentage, in order to determine whether observed trends are robustto the poverty measure chosen. Figure 7.3 shows the World Bank’s estimates of the $1-and $2-a-day poverty-gap indices between 1981 and 2001. These measures also show aconsistent downward trend, indicating that the depth of poverty in the world has fallen byabout the same amount as the incidence of poverty.
7.1.2 PROGRESS TOWARDS MILLENNIUM DEVELOPMENT GOALS
The latest World Bank estimates also indicate that the Millennium DevelopmentGoals poverty target (to “halve, between 1990 and 2015, the proportion of people whoseincome is less than one dollar a day”) will in all likelihood be achieved. By 2002 (slightlyless than halfway through the measurement period) the proportion of people below the$1-a-day line had fallen by just over 30% from its 1990 level of 28%. The World Bank(2005) forecasts that by 2015 the proportion of people living on less than $1 a day will infact have fallen to 10,2%—a 63% fall from the level in 1990.
Figure 7.2. Number of people living on less than $1 a day and $2 a day,between 1981 and 20014
SAAJ 7 (2007)
POVERTY AND INEQUALITY IN SOUTH AFRICA AND THE WORLD � 137
0
0,5
1
1,5
2
2,5
3
1981 1984 1987 1990 1993 1996 1999 2002
Peo
ple
(bill
ion)
$1/day
$2/day
4 Ibid.
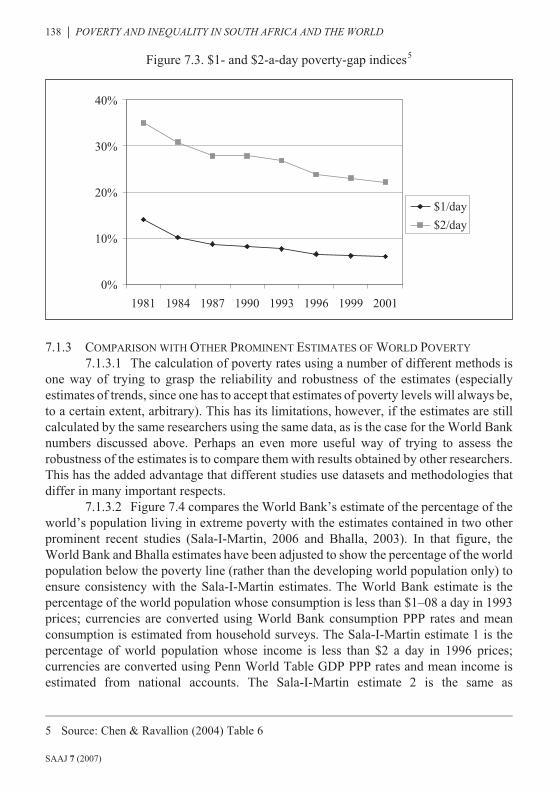
Figure 7.3. $1- and $2-a-day poverty-gap indices5
7.1.3 COMPARISON WITH OTHER PROMINENT ESTIMATES OF WORLD POVERTY
7.1.3.1 The calculation of poverty rates using a number of different methods isone way of trying to grasp the reliability and robustness of the estimates (especiallyestimates of trends, since one has to accept that estimates of poverty levels will always be,to a certain extent, arbitrary). This has its limitations, however, if the estimates are stillcalculated by the same researchers using the same data, as is the case for the World Banknumbers discussed above. Perhaps an even more useful way of trying to assess therobustness of the estimates is to compare them with results obtained by other researchers.This has the added advantage that different studies use datasets and methodologies thatdiffer in many important respects.
7.1.3.2 Figure 7.4 compares the World Bank’s estimate of the percentage of theworld’s population living in extreme poverty with the estimates contained in two otherprominent recent studies (Sala-I-Martin, 2006 and Bhalla, 2003). In that figure, theWorld Bank and Bhalla estimates have been adjusted to show the percentage of the worldpopulation below the poverty line (rather than the developing world population only) toensure consistency with the Sala-I-Martin estimates. The World Bank estimate is thepercentage of the world population whose consumption is less than $1–08 a day in 1993prices; currencies are converted using World Bank consumption PPP rates and meanconsumption is estimated from household surveys. The Sala-I-Martin estimate 1 is thepercentage of world population whose income is less than $2 a day in 1996 prices;currencies are converted using Penn World Table GDP PPP rates and mean income isestimated from national accounts. The Sala-I-Martin estimate 2 is the same as
SAAJ 7 (2007)
138 � POVERTY AND INEQUALITY IN SOUTH AFRICA AND THE WORLD
0%
10%
20%
30%
40%
1981 1984 1987 1990 1993 1996 1999 2001
$1/day
$2/day
5 Source: Chen & Ravallion (2004) Table 6

Figure 7.4. Prominent estimates of world poverty6
Sala-I-Martin 1, except that the poverty line is $3 a day. The Bhalla estimate is thepercentage of world population whose consumption is less than $1–50 a day in 1993prices; currencies are converted using World Bank GDP PPP rates and meanconsumption is estimated from national accounts.
7.1.3.3 There are a number of differences between the three studies, which makeit difficult to directly compare their estimates of poverty headcount percentages using acommon poverty line. Some adjustments can be made to ensure greater comparabilitybetween the figures. For example, all the figures have been adjusted to represent thepercentage of the whole world’s population living in poverty, rather thandeveloping-world population only (this is why the World Bank figures do not matchthose presented earlier).
7.1.3.4 It is more difficult to make allowances for other differences between thestudies. For example, Bhalla and Sala-I-Martin both take mean consumption or incomefrom national accounts, and only use surveys to estimate the distribution around the mean.The World Bank, on the other hand, uses surveys to estimate the entire distribution. Arough method of attempting to allow for this difference is to use a higher poverty line whenthe national-accounts mean is used (because surveys tend to underestimate the mean, andbecause national accounts consumption figures include items that are not consumed byhouseholds, as discussed in section 6). Bhalla uses a poverty line of $1–50 a day, believingthis to be roughly equivalent to the World Bank’s $1-a-day figures. Sala-I-Martin’s figuresneed to be assessed against an even higher poverty line because his study estimatesincome (rather than consumption) poverty. Figure 7.4 shows Sala-I-Martin’s estimates of
SAAJ 7 (2007)
POVERTY AND INEQUALITY IN SOUTH AFRICA AND THE WORLD � 139
0%
10%
20%
30%
40%
50%
1980 1985 1990 1995 2000
World Bank
Sala-I-Martin 1
Sala-I-Martin 2
Bhalla
6 Sources: World Bank (2006), Bhalla (2002), Sala-I-Martin (2006)
the percentage of people below $2 and $3 a day in 1996 prices. The Bhalla andSala-I-Martin studies confirm the World Bank finding of a significant and sustained fallin world poverty since 1980. The main difference is that their estimates (especiallyBhalla’s) show a faster fall since the late 1980s.
7.1.4 THE CHANGING REGIONAL BREAKDOWN OF WORLD POVERTY
7.1.4.1 So far, we have concentrated on the level and trend of poverty for theworld as a whole. To gain a deeper understanding of world poverty, however, it is veryinstructive to look at the regional breakdown and how it has changed over time. Thenumber and percentage of people below the $1-a-day and $2-a-day international povertylines for each of the six developing country regions used by the World Bank highlight anumber of salient facts about the regional breakdown of world poverty.
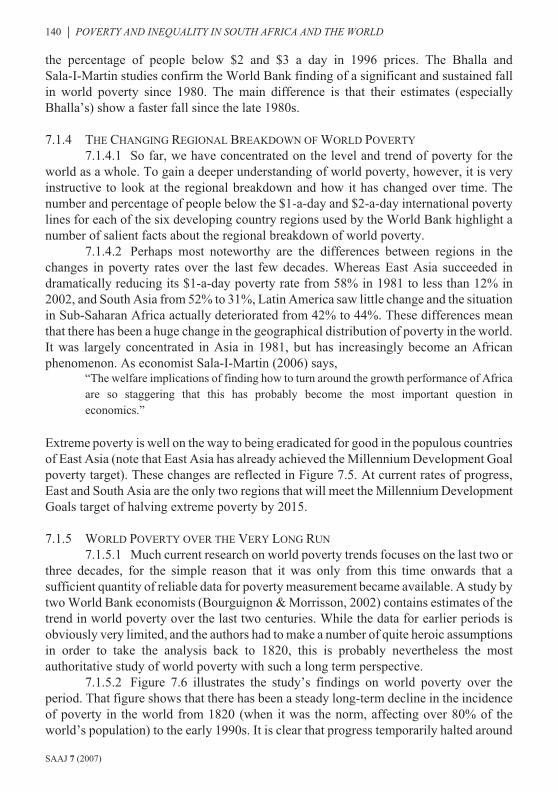
7.1.4.2 Perhaps most noteworthy are the differences between regions in thechanges in poverty rates over the last few decades. Whereas East Asia succeeded indramatically reducing its $1-a-day poverty rate from 58% in 1981 to less than 12% in2002, and South Asia from 52% to 31%, Latin America saw little change and the situationin Sub-Saharan Africa actually deteriorated from 42% to 44%. These differences meanthat there has been a huge change in the geographical distribution of poverty in the world.It was largely concentrated in Asia in 1981, but has increasingly become an Africanphenomenon. As economist Sala-I-Martin (2006) says,
“The welfare implications of finding how to turn around the growth performance of Africa
are so staggering that this has probably become the most important question in
economics.”
Extreme poverty is well on the way to being eradicated for good in the populous countriesof East Asia (note that East Asia has already achieved the Millennium Development Goalpoverty target). These changes are reflected in Figure 7.5. At current rates of progress,East and South Asia are the only two regions that will meet the Millennium DevelopmentGoals target of halving extreme poverty by 2015.
7.1.5 WORLD POVERTY OVER THE VERY LONG RUN
7.1.5.1 Much current research on world poverty trends focuses on the last two orthree decades, for the simple reason that it was only from this time onwards that asufficient quantity of reliable data for poverty measurement became available. A study bytwo World Bank economists (Bourguignon & Morrisson, 2002) contains estimates of thetrend in world poverty over the last two centuries. While the data for earlier periods isobviously very limited, and the authors had to make a number of quite heroic assumptionsin order to take the analysis back to 1820, this is probably nevertheless the mostauthoritative study of world poverty with such a long term perspective.
7.1.5.2 Figure 7.6 illustrates the study’s findings on world poverty over theperiod. That figure shows that there has been a steady long-term decline in the incidenceof poverty in the world from 1820 (when it was the norm, affecting over 80% of theworld’s population) to the early 1990s. It is clear that progress temporarily halted around
SAAJ 7 (2007)
140 � POVERTY AND INEQUALITY IN SOUTH AFRICA AND THE WORLD
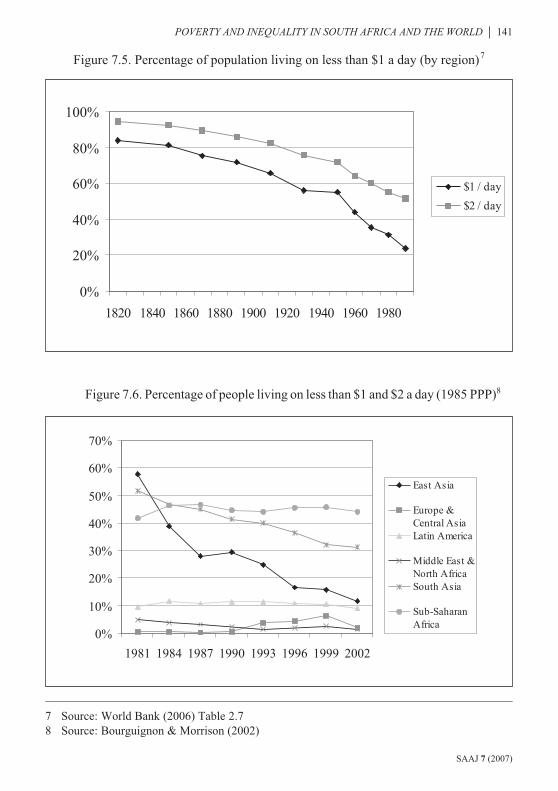
Figure 7.5. Percentage of population living on less than $1 a day (by region)7
Figure 7.6. Percentage of people living on less than $1 and $2 a day (1985 PPP)8
SAAJ 7 (2007)
POVERTY AND INEQUALITY IN SOUTH AFRICA AND THE WORLD � 141
0%
10%
20%
30%
40%
50%
60%
70%
1981 1984 1987 1990 1993 1996 1999 2002
East Asia
Europe &Central AsiaLatin America
Middle East &North AfricaSouth Asia
Sub-SaharanAfrica
0%
20%
40%
60%
80%
100%
1820 1840 1860 1880 1900 1920 1940 1960 1980
$1 / day
$2 / day
7 Source: World Bank (2006) Table 2.78 Source: Bourguignon & Morrison (2002)
the time of the Great Depression and the Second World War, but accelerated considerablythereafter. This was arguably the period that saw the greatest historic reduction in theproportion of humankind living in poverty.
7.2 WORLD INEQUALITY7.2.1 ESTIMATES OF WORLD INEQUALITY AMONG INDIVIDUALS
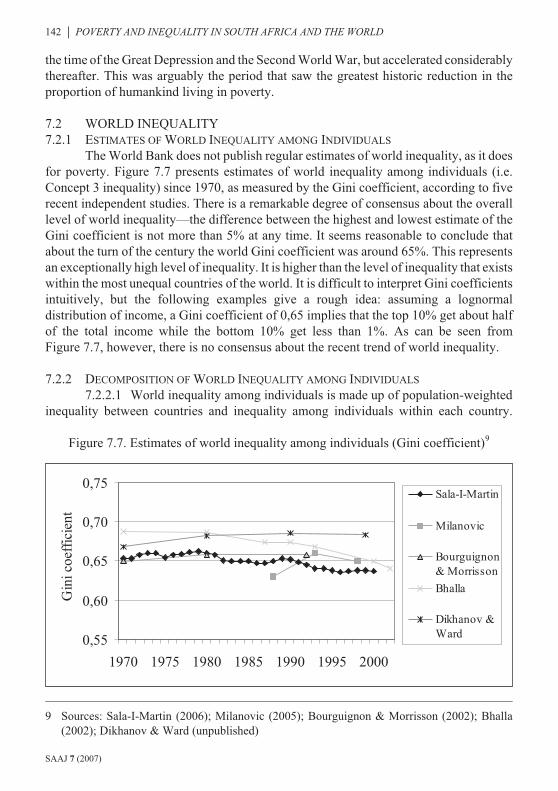
The World Bank does not publish regular estimates of world inequality, as it doesfor poverty. Figure 7.7 presents estimates of world inequality among individuals (i.e.Concept 3 inequality) since 1970, as measured by the Gini coefficient, according to fiverecent independent studies. There is a remarkable degree of consensus about the overalllevel of world inequality—the difference between the highest and lowest estimate of theGini coefficient is not more than 5% at any time. It seems reasonable to conclude thatabout the turn of the century the world Gini coefficient was around 65%. This representsan exceptionally high level of inequality. It is higher than the level of inequality that existswithin the most unequal countries of the world. It is difficult to interpret Gini coefficientsintuitively, but the following examples give a rough idea: assuming a lognormaldistribution of income, a Gini coefficient of 0,65 implies that the top 10% get about halfof the total income while the bottom 10% get less than 1%. As can be seen fromFigure 7.7, however, there is no consensus about the recent trend of world inequality.
7.2.2 DECOMPOSITION OF WORLD INEQUALITY AMONG INDIVIDUALS
7.2.2.1 World inequality among individuals is made up of population-weightedinequality between countries and inequality among individuals within each country.
Figure 7.7. Estimates of world inequality among individuals (Gini coefficient)9
SAAJ 7 (2007)
142 � POVERTY AND INEQUALITY IN SOUTH AFRICA AND THE WORLD
0,55
0,60
0,65
0,70
0,75
1970 1975 1980 1985 1990 1995 2000
Gin
icoe
ffic
ient
Sala-I-Martin
Milanovic
Bourguignon& Morrisson
Bhalla
Dikhanov &Ward
9 Sources: Sala-I-Martin (2006); Milanovic (2005); Bourguignon & Morrisson (2002); Bhalla(2002); Dikhanov & Ward (unpublished)
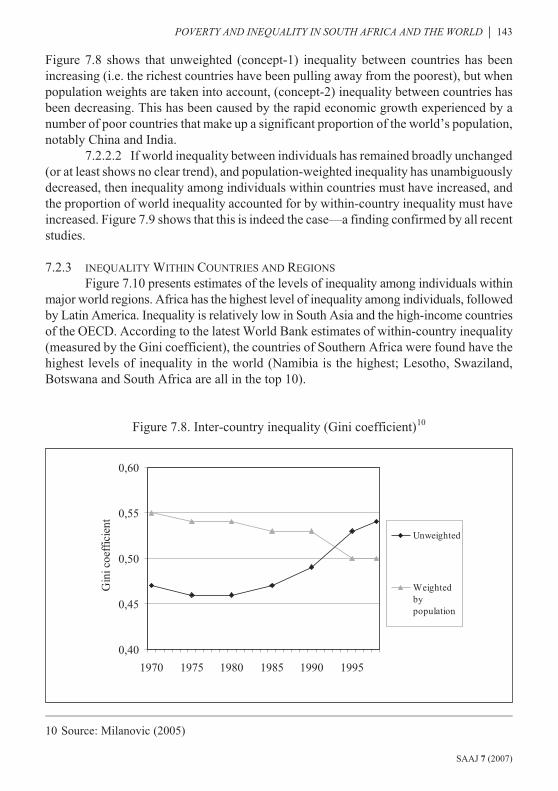
Figure 7.8 shows that unweighted (concept-1) inequality between countries has beenincreasing (i.e. the richest countries have been pulling away from the poorest), but whenpopulation weights are taken into account, (concept-2) inequality between countries hasbeen decreasing. This has been caused by the rapid economic growth experienced by anumber of poor countries that make up a significant proportion of the world’s population,notably China and India.
7.2.2.2 If world inequality between individuals has remained broadly unchanged(or at least shows no clear trend), and population-weighted inequality has unambiguouslydecreased, then inequality among individuals within countries must have increased, andthe proportion of world inequality accounted for by within-country inequality must haveincreased. Figure 7.9 shows that this is indeed the case—a finding confirmed by all recentstudies.
7.2.3 INEQUALITY WITHIN COUNTRIES AND REGIONS
Figure 7.10 presents estimates of the levels of inequality among individuals withinmajor world regions. Africa has the highest level of inequality among individuals, followedby Latin America. Inequality is relatively low in South Asia and the high-income countriesof the OECD. According to the latest World Bank estimates of within-country inequality(measured by the Gini coefficient), the countries of Southern Africa were found have thehighest levels of inequality in the world (Namibia is the highest; Lesotho, Swaziland,Botswana and South Africa are all in the top 10).
Figure 7.8. Inter-country inequality (Gini coefficient)10
SAAJ 7 (2007)
POVERTY AND INEQUALITY IN SOUTH AFRICA AND THE WORLD � 143
0,40
0,45
0,50
0,55
0,60
1970 1975 1980 1985 1990 1995
Gin
icoe
ffic
ient
Unweighted
Weightedbypopulation
10 Source: Milanovic (2005)
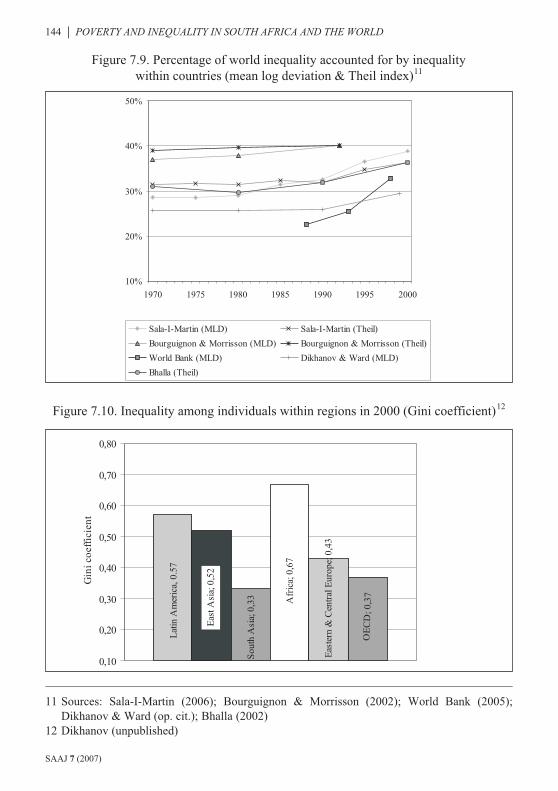
Figure 7.9. Percentage of world inequality accounted for by inequalitywithin countries (mean log deviation & Theil index)11
Figure 7.10. Inequality among individuals within regions in 2000 (Gini coefficient)12
SAAJ 7 (2007)
144 � POVERTY AND INEQUALITY IN SOUTH AFRICA AND THE WORLD
10%
20%
30%
40%
50%
1970 1975 1980 1985 1990 1995 2000
Sala-I-Martin (MLD) Sala-I-Martin (Theil)
Bourguignon & Morrisson (MLD) Bourguignon & Morrisson (Theil)
World Bank (MLD) Dikhanov & Ward (MLD)
Bhalla (Theil)
Lat
inA
mer
ica,
0.57
Eas
tAsi
a;0,
52
Sou
thA
sia;
0,33 A
fric
a;0,
67
Eas
tern
&C
entr
alE
urop
e;0,
43
OE
CD
; 0,3
7
0,10
0,20
0,30
0,40
0,50
0,60
0,70
0,80
Gin
ico
effi
cien
t
11 Sources: Sala-I-Martin (2006); Bourguignon & Morrisson (2002); World Bank (2005);Dikhanov & Ward (op. cit.); Bhalla (2002)
12 Dikhanov (unpublished)
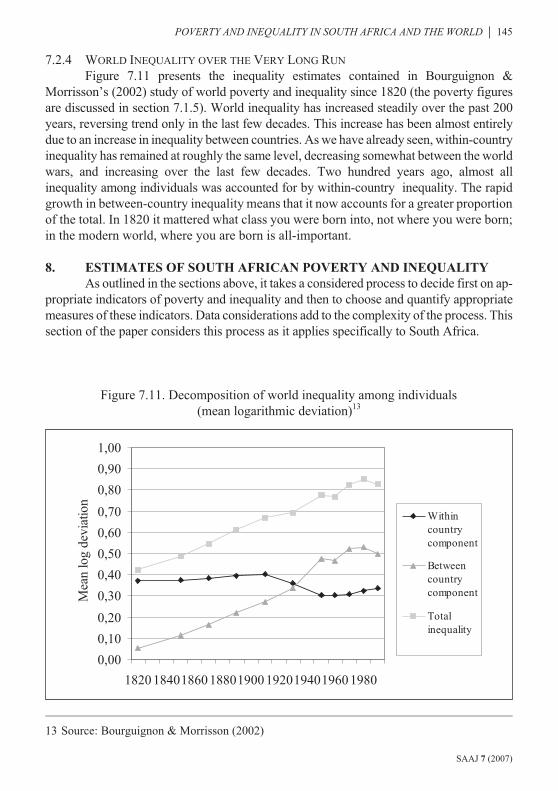
7.2.4 WORLD INEQUALITY OVER THE VERY LONG RUN
Figure 7.11 presents the inequality estimates contained in Bourguignon &Morrisson’s (2002) study of world poverty and inequality since 1820 (the poverty figuresare discussed in section 7.1.5). World inequality has increased steadily over the past 200years, reversing trend only in the last few decades. This increase has been almost entirelydue to an increase in inequality between countries. As we have already seen, within-countryinequality has remained at roughly the same level, decreasing somewhat between the worldwars, and increasing over the last few decades. Two hundred years ago, almost allinequality among individuals was accounted for by within-country inequality. The rapidgrowth in between-country inequality means that it now accounts for a greater proportionof the total. In 1820 it mattered what class you were born into, not where you were born;in the modern world, where you are born is all-important.
8. ESTIMATES OF SOUTH AFRICAN POVERTY AND INEQUALITY
As outlined in the sections above, it takes a considered process to decide first on ap-propriate indicators of poverty and inequality and then to choose and quantify appropriatemeasures of these indicators. Data considerations add to the complexity of the process. Thissection of the paper considers this process as it applies specifically to South Africa.
Figure 7.11. Decomposition of world inequality among individuals(mean logarithmic deviation)13
SAAJ 7 (2007)
POVERTY AND INEQUALITY IN SOUTH AFRICA AND THE WORLD � 145
0,00
0,10
0,20
0,30
0,40
0,50
0,60
0,70
0,80
0,90
1,00
1820 18401860 18801900 192019401960 1980
Mea
nlo
gde
viat
ion
Withincountrycomponent
Betweencountrycomponent
Totalinequality
13 Source: Bourguignon & Morrisson (2002)
8.1 DATASETS AVAILABLE TO MEASURE POVERTY IN SOUTH AFRICAThere are several datasets that are commonly used by researchers to measure poverty inSouth Africa. A brief description of each dataset, as well as any problems associated withthe collection of the data, is given below. In most cases the data tend to be adjusted beforethey are used.
8.1.1 STATISTICS SOUTH AFRICA OCTOBER HOUSEHOLD SURVEYS (OHS)These annual household surveys have been run since 1993 by Statistics South
Africa (Stats SA). The survey collects a variety of household information, excludingincome and expenditure data, and statistical data about individuals. However, the mainaim of the surveys has been to collect the information required for labour-force statistics(May & Woolard, op. cit.). The October Household Survey (OHS) ran from 1994 to1999. It was then replaced in 2000 by the Labour Force Survey (LFS) which focused onlabour market information, and which is still run twice a year. In 2002, Stats SAreintroduced the OHS but changed the name to the General Household Survey (GHS).As, in addition to changing their names, the surveys were continually modified in the1990s, any observed changes in the data could simply be driven by data dynamics(Roberts, 2004). This, together with some evidence of sloppy fieldwork, makes it difficultto use the data without appropriate adjustments (Simkins, unpublished).
8.1.2 1995 AND 2000 INCOME AND EXPENDITURE SURVEYS
8.1.2.1 In 1995 and 2000, Income and Expenditure Surveys (IESs) were run inconjunction with the 1995 OHS and September 2000 LFS, respectively. The intention inboth years was to use exactly the same households for both surveys, so that variables fromone survey could be merged with data from the other. 95% of the households in bothsurveys are the same.
8.1.2.2 The main purpose for collecting the information for the income andexpenditure surveys was to compile a list of goods to use in a CPI basket. However, thequantity of goods included in the survey means that the data can be used to measurepoverty and inequality (Woolard, op. cit.).
8.1.2.3 The main criticisms of the IESs have been around the sampling weightsused. In general, before the datasets are used, they are adjusted by revised weightsprovided by Stats SA, using information from the population census (Hoogeveen &Özler, 2004). Alternative weights derived by Simkins and Woolard are also used, butthese tend to undercount upper-income African households (Seekings, Leibbrandt &Nattrass, 2004).
8.1.2.4 Despite these problems, the IESs combined with the Household Surveysprovide the most comprehensive database of living conditions and poverty for SouthAfrica to date. Almost all researchers, including the World Bank, use the data from thesesurveys. The 2005 IES is being performed as a one-year rolling survey, but the field workis not yet completed.
SAAJ 7 (2007)
146 � POVERTY AND INEQUALITY IN SOUTH AFRICA AND THE WORLD

8.1.3 1996 AND 2001 POPULATION CENSUS
Population censuses were undertaken in 1996 and 2001. The main point of theexercise was to determine the population of South Africa, and not to measure levels ofpoverty and inequality. However, the census data are used to determine the weights to beused in many other surveys, including the IESs. The population censuses undertaken in1996 and 2001 asked questions about income. However, the income information wasincomplete. In order to use these data, income needs to be imputed to the missinghouseholds, e.g. old age income is imputed to households with zero reported income butold-age pensioners living in them (Simkins, op. cit.).
8.1.4 PROJECT FOR STATISTICS ON LIVING STANDARDS AND DEVELOPMENT SURVEY
(1993)8.1.4.1 The Project for Statistics on Living Standards and Development Survey
(PSLSD) was undertaken in late 1993. Technical assistance was provided by the WorldBank and the survey questionnaire loosely followed the Living Standards MeasurementSurvey questionnaires used by the World Bank in other countries (Woolard, op. cit.).
8.1.4.2 The aim of the survey sampling was to include all types of householdsand to approximate the racial and geographic breakdown of the nation, including theindependent homelands. Some of the households originally chosen had to be replaced byother households as a result of their inaccessibility due to violence (Woolard, op. cit.).
8.1.4.3 Other than the IESs, this is the only other survey that is used by the WorldBank when calculating country figures for South Africa.
8.1.5 ALL MEDIA AND PRODUCTS SURVEY
The All Media and Products Survey (AMPS) is a household survey conductedonce or twice a year by the South African Advertising Research Foundation. It has beencarried out since 1993 and its main objective is to collect information of use toadvertisers. However, it also collects extensive demographic data including householdincome and these data can be used to look at changes in income distribution over time.
8.1.6 NATIONAL PANEL STUDY
In 2006, the Office of the Presidency commissioned a national panel study to beundertaken over the following three years. The initial survey will provide a baseline ofpoverty information as it will be a nationally representative household survey. After thebaseline three-year period, some of the households will be regularly interviewed. Thiswill provide the first truly comparable national study of changes in income and povertyover time.
8.2 ESTIMATES OF SOUTH AFRICAN POVERTY8.2.1 POVERTY IN SOUTH AFRICA OVER THE LATE 1900S
8.2.1.1 A comprehensive attempt to trace the trends in South African povertyover the past few decades was carried out by Van der Berg & Louw (2003). Theyobtained their income-based poverty estimates by breaking down current income from
SAAJ 7 (2007)
POVERTY AND INEQUALITY IN SOUTH AFRICA AND THE WORLD � 147
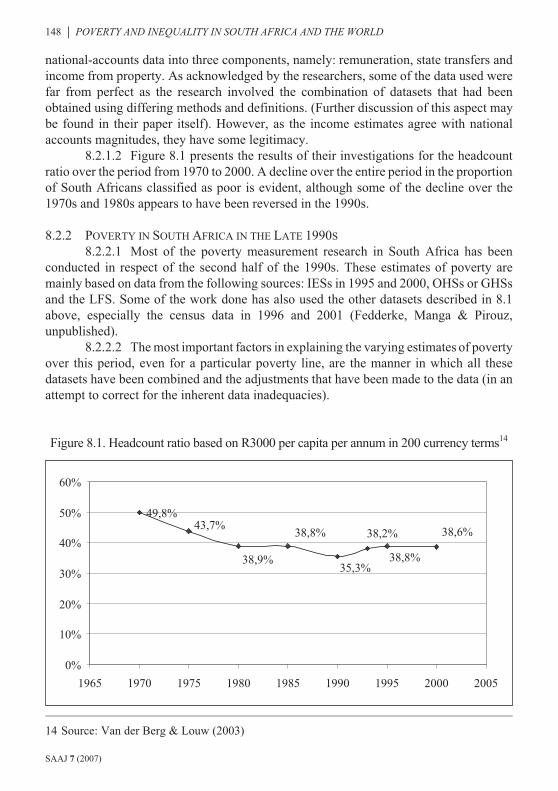
national-accounts data into three components, namely: remuneration, state transfers andincome from property. As acknowledged by the researchers, some of the data used werefar from perfect as the research involved the combination of datasets that had beenobtained using differing methods and definitions. (Further discussion of this aspect maybe found in their paper itself). However, as the income estimates agree with nationalaccounts magnitudes, they have some legitimacy.
8.2.1.2 Figure 8.1 presents the results of their investigations for the headcountratio over the period from 1970 to 2000. A decline over the entire period in the proportionof South Africans classified as poor is evident, although some of the decline over the1970s and 1980s appears to have been reversed in the 1990s.
8.2.2 POVERTY IN SOUTH AFRICA IN THE LATE 1990S
8.2.2.1 Most of the poverty measurement research in South Africa has beenconducted in respect of the second half of the 1990s. These estimates of poverty aremainly based on data from the following sources: IESs in 1995 and 2000, OHSs or GHSsand the LFS. Some of the work done has also used the other datasets described in 8.1above, especially the census data in 1996 and 2001 (Fedderke, Manga & Pirouz,unpublished).
8.2.2.2 The most important factors in explaining the varying estimates of povertyover this period, even for a particular poverty line, are the manner in which all thesedatasets have been combined and the adjustments that have been made to the data (in anattempt to correct for the inherent data inadequacies).
Figure 8.1. Headcount ratio based on R3000 per capita per annum in 200 currency terms14
SAAJ 7 (2007)
148 � POVERTY AND INEQUALITY IN SOUTH AFRICA AND THE WORLD
49,8%43,7%
38,9%
38,8% 38,6%
35,3%
38,2%
38,8%
0%
10%
20%
30%
40%
50%
60%
1965 1970 1975 1980 1985 1990 1995 2000 2005
14 Source: Van der Berg & Louw (2003)
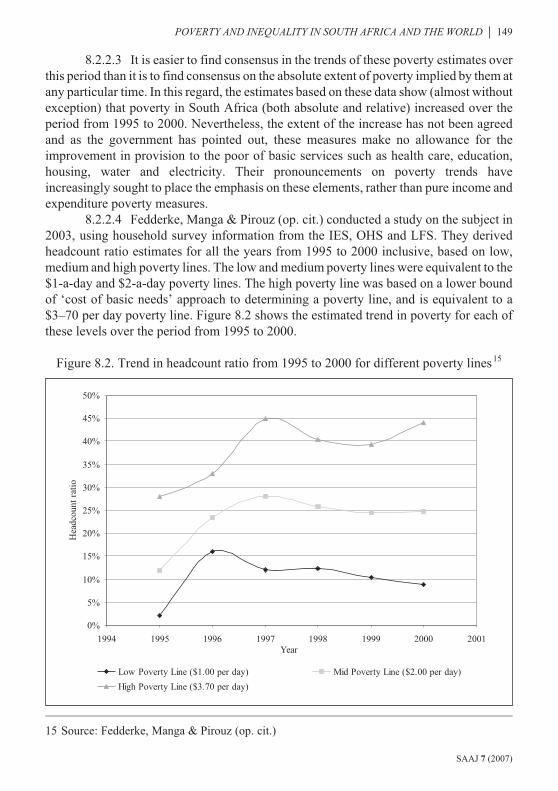
8.2.2.3 It is easier to find consensus in the trends of these poverty estimates overthis period than it is to find consensus on the absolute extent of poverty implied by them atany particular time. In this regard, the estimates based on these data show (almost withoutexception) that poverty in South Africa (both absolute and relative) increased over theperiod from 1995 to 2000. Nevertheless, the extent of the increase has not been agreedand as the government has pointed out, these measures make no allowance for theimprovement in provision to the poor of basic services such as health care, education,housing, water and electricity. Their pronouncements on poverty trends haveincreasingly sought to place the emphasis on these elements, rather than pure income andexpenditure poverty measures.
8.2.2.4 Fedderke, Manga & Pirouz (op. cit.) conducted a study on the subject in2003, using household survey information from the IES, OHS and LFS. They derivedheadcount ratio estimates for all the years from 1995 to 2000 inclusive, based on low,medium and high poverty lines. The low and medium poverty lines were equivalent to the$1-a-day and $2-a-day poverty lines. The high poverty line was based on a lower boundof ‘cost of basic needs’ approach to determining a poverty line, and is equivalent to a$3–70 per day poverty line. Figure 8.2 shows the estimated trend in poverty for each ofthese levels over the period from 1995 to 2000.
Figure 8.2. Trend in headcount ratio from 1995 to 2000 for different poverty lines15
SAAJ 7 (2007)
POVERTY AND INEQUALITY IN SOUTH AFRICA AND THE WORLD � 149
0%
5%
10%
15%
20%
25%
30%
35%
40%
45%
50%
1994 1995 1996 1997 1998 1999 2000 2001Year
Hea
dcou
ntra
tio
Low Poverty Line ($1.00 per day) Mid Poverty Line ($2.00 per day)
High Poverty Line ($3.70 per day)
15 Source: Fedderke, Manga & Pirouz (op. cit.)

8.2.2.5 The shapes of the three curves suggest that most of the increase inpoverty from 1995 to 2000 occurred in the years immediately after the first democraticelections. For the low and medium poverty lines, there appears to have been alevelling-off in the poverty rate towards the end of the millennium, while at the same timethe poverty rate for the high poverty line appears to have been on the increase.
8.2.3 POVERTY IN SOUTH AFRICA SINCE THE TURN OF THE MILLENNIUM
8.2.3.1 There is much less literature available on the movement in poverty sincethe start of the millennium. In 2005, Van der Berg led a collaborative research effort thatconsidered poverty in South Africa over this period (Van der Berg et al., 2005). As forVan der Berg & Louw’s (2003) poverty research into trends since 1970, (see section8.2.1), the methodology bases the mean income estimates on national-accounts datawhile using survey data to determine the distributions of income around this mean. Adifference from the earlier work is that this study includes data from AMPS, which isconducted once or twice a year.
8.2.3.2 The results of this study suggest that the headcount ratio (based onR3 000 per capita per annum in 2000 currency terms, which is roughly equivalent to a$3-a-day poverty line) dropped from 41,3% (18,5m people) in 2000 to 33,2% (15,4mpeople) in 2004. This decreasing trend was also tested for sensitivity to the chosenpoverty line, using R500 increments from R2000 to R4000. The conclusion was that thetrend was independent of the poverty line chosen.
8.2.3.3 The reduction is not just in the proportion of people classified as poor,but also in the actual numbers of poor people, and may be attributed to the slowing ofpopulation growth in South Africa. Further results from this study suggest that thepoverty-gap ratio (for the poverty line of R3000 per capita per annum) has also declinedover the same period from 0,23 to 0,17. These trends in estimated poverty levels areattributed to the dramatic increase in social spending by the government via its socialgrant payment bill (an increase of some R22 billion over the period in 2000 currencyterms).
8.2.3.4 Van der Berg et al. (op. cit.) argue that these trend results are morecredible than those from other studies. This is because there are more time points andhence the results are less dependent on values at just the start and end of the periods underconsideration. They do, however, state that they may be at risk of overestimating thepoverty reduction over this recent period. They further state that more rapid job creationis required to fight poverty further, since the effect of the revamped social grant systemwill have mostly run its course.
8.2.3.5 While the results produced by Van der Berg et al. (op. cit.) have beenwidely accepted in government circles as showing the success of its various povertyalleviation measures, the accuracy of the results has been questioned by severalacademics. In particular, Meth (2006) questions the way in which Van der Berg et al.adjusted for under-reporting in the AMPS surveys. Meth also questions the way inwhich Van der Berg et al. allocated all disability grant payments to the lowest incomegrouping.
SAAJ 7 (2007)
150 � POVERTY AND INEQUALITY IN SOUTH AFRICA AND THE WORLD

8.2.3.6 In Meth’s (op. cit.) opinion it is more likely that the headcount ratio wascloser to 38% of the population being below the R3000 per capita per annum poverty linein 2004, i.e. that Van der Berg et al. (op. cit.) did indeed overestimate poverty reductionover this period.
8.3 INEQUALITY IN SOUTH AFRICA8.3.1 Published inequality statistics are not always consistent with one another,
even when they are a measure covering the same year and based on the same data. This isas a result of various measurement and data issues. For this reason, there does not appearto be a narrow consensus on the extent of income inequality in South Africa. For example,Gini coefficients for 1995 based on IES data vary from 0,59 to 0,73 (May, op. cit.).Despite this, there is very little debate on the relative severity of the inequality. SouthAfrica is consistently placed in the top range of the most unequal countries in the world,irrespective of the measure used and the data on which it is based.
8.3.2 The main sources of data used for calculation of inequality statistics forSouth Africa are the two IESs and the national census data. As the measures derived fromthese surveys ignore (non-income) social transfers e.g. housing provision andelectrification, the measures are considered by some commentators to show higherinequality than the real picture.
Table 8.1. Gini coefficients for South Africa with and without social transfers16
Source Year Gini excl. socialtransfers
Gini incl. socialtransfers
Van der Berg & Burger (unpublished) 1995 0,68 0,44
StatsSA 2002 0,59 0,35
8.3.3 The two sets of data used in the above estimates of the Gini coefficient for1995 and 2002 respectively are not directly comparable, as the method of calculation andbase data are not identical. However, they do illustrate the marked impact that socialtransfers in South Africa have on income inequality.
8.3.4 To give some perspective to the Gini coefficient of 0,59 shown inTable 8.1, the data that it is based on yield the following statistics: the lowest quintile(20%) of SA households shared 2,8% of the total national income, while the highestquintile (20%) shared 64,5%.
8.3.5 It is important to note that these South African inequality figuresincluding the effect of social transfers are not directly comparable with data from othercountries. Without similar methodologies for the measurement of inequalities in the othercountries, it is difficult to say if these levels of social transfer contribute to a decrease inthe inequality in South Africa relative to that in the rest of the world or not.
SAAJ 7 (2007)
POVERTY AND INEQUALITY IN SOUTH AFRICA AND THE WORLD � 151
16 Based on Statistics SA (unpublished). A poverty profile of SA, 2005
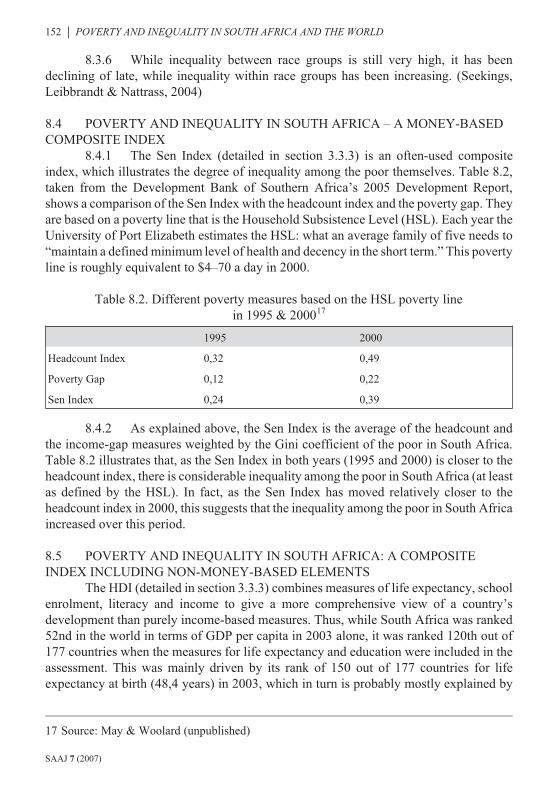
8.3.6 While inequality between race groups is still very high, it has beendeclining of late, while inequality within race groups has been increasing. (Seekings,Leibbrandt & Nattrass, 2004)
8.4 POVERTY AND INEQUALITY IN SOUTH AFRICA – A MONEY-BASEDCOMPOSITE INDEX
8.4.1 The Sen Index (detailed in section 3.3.3) is an often-used compositeindex, which illustrates the degree of inequality among the poor themselves. Table 8.2,taken from the Development Bank of Southern Africa’s 2005 Development Report,shows a comparison of the Sen Index with the headcount index and the poverty gap. Theyare based on a poverty line that is the Household Subsistence Level (HSL). Each year theUniversity of Port Elizabeth estimates the HSL: what an average family of five needs to“maintain a defined minimum level of health and decency in the short term.” This povertyline is roughly equivalent to $4–70 a day in 2000.
Table 8.2. Different poverty measures based on the HSL poverty linein 1995 & 200017
1995 2000
Headcount Index 0,32 0,49
Poverty Gap 0,12 0,22
Sen Index 0,24 0,39
8.4.2 As explained above, the Sen Index is the average of the headcount andthe income-gap measures weighted by the Gini coefficient of the poor in South Africa.Table 8.2 illustrates that, as the Sen Index in both years (1995 and 2000) is closer to theheadcount index, there is considerable inequality among the poor in South Africa (at leastas defined by the HSL). In fact, as the Sen Index has moved relatively closer to theheadcount index in 2000, this suggests that the inequality among the poor in South Africaincreased over this period.
8.5 POVERTY AND INEQUALITY IN SOUTH AFRICA: A COMPOSITEINDEX INCLUDING NON-MONEY-BASED ELEMENTS
The HDI (detailed in section 3.3.3) combines measures of life expectancy, schoolenrolment, literacy and income to give a more comprehensive view of a country’sdevelopment than purely income-based measures. Thus, while South Africa was ranked52nd in the world in terms of GDP per capita in 2003 alone, it was ranked 120th out of177 countries when the measures for life expectancy and education were included in theassessment. This was mainly driven by its rank of 150 out of 177 countries for lifeexpectancy at birth (48,4 years) in 2003, which in turn is probably mostly explained by
SAAJ 7 (2007)
152 � POVERTY AND INEQUALITY IN SOUTH AFRICA AND THE WORLD
17 Source: May & Woolard (unpublished)
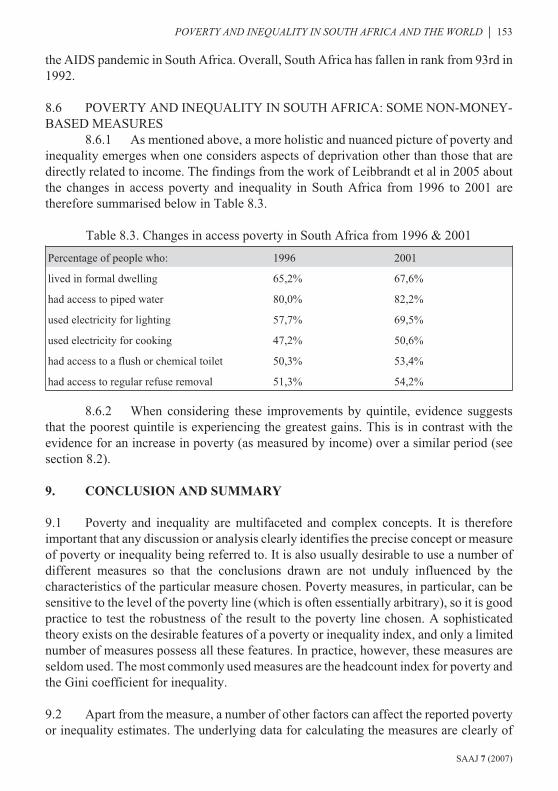
the AIDS pandemic in South Africa. Overall, South Africa has fallen in rank from 93rd in1992.
8.6 POVERTY AND INEQUALITY IN SOUTH AFRICA: SOME NON-MONEY-BASED MEASURES
8.6.1 As mentioned above, a more holistic and nuanced picture of poverty andinequality emerges when one considers aspects of deprivation other than those that aredirectly related to income. The findings from the work of Leibbrandt et al in 2005 aboutthe changes in access poverty and inequality in South Africa from 1996 to 2001 aretherefore summarised below in Table 8.3.
Table 8.3. Changes in access poverty in South Africa from 1996 & 2001
Percentage of people who: 1996 2001
lived in formal dwelling 65,2% 67,6%
had access to piped water 80,0% 82,2%
used electricity for lighting 57,7% 69,5%
used electricity for cooking 47,2% 50,6%
had access to a flush or chemical toilet 50,3% 53,4%
had access to regular refuse removal 51,3% 54,2%
8.6.2 When considering these improvements by quintile, evidence suggeststhat the poorest quintile is experiencing the greatest gains. This is in contrast with theevidence for an increase in poverty (as measured by income) over a similar period (seesection 8.2).
9. CONCLUSION AND SUMMARY
9.1 Poverty and inequality are multifaceted and complex concepts. It is thereforeimportant that any discussion or analysis clearly identifies the precise concept or measureof poverty or inequality being referred to. It is also usually desirable to use a number ofdifferent measures so that the conclusions drawn are not unduly influenced by thecharacteristics of the particular measure chosen. Poverty measures, in particular, can besensitive to the level of the poverty line (which is often essentially arbitrary), so it is goodpractice to test the robustness of the result to the poverty line chosen. A sophisticatedtheory exists on the desirable features of a poverty or inequality index, and only a limitednumber of measures possess all these features. In practice, however, these measures areseldom used. The most commonly used measures are the headcount index for poverty andthe Gini coefficient for inequality.
9.2 Apart from the measure, a number of other factors can affect the reported povertyor inequality estimates. The underlying data for calculating the measures are clearly of
SAAJ 7 (2007)
POVERTY AND INEQUALITY IN SOUTH AFRICA AND THE WORLD � 153
critical importance. Almost all estimates of poverty or inequality are based on householdsurvey data of some sort. The quality of this data is highly variable, both across countriesand over time (although the situation has improved dramatically in recent decades). Someresearchers adjust survey data to tie up with aggregates in national accounts, while othersdo not. There are also a number of additional factors that can influence estimates ofpoverty and inequality at world level, such as whether PPP or market exchange rates areused or whether individuals or countries are used as the unit of analysis.
9.3 Recent research suggests that about one fifth of the world’s population—morethan a billion people—live in extreme poverty on less than $1 a day. Half of all the peoplein the world live on less than $2 a day. However, the proportion of the world’s populationliving in poverty has almost certainly fallen quite significantly over the last few decades.It is possible that the proportion of the world’s population living in extreme poverty hashalved since 1980, and the Millennium Development Goal of halving world povertybetween 1990 and 2015 looks well on the way to being met. These recent falls in theproportion of the world’s population living in poverty represent a continuation of along-term trend that started around the time of the industrial revolution. Only in recentdecades, however, has the fall in percentage of people living in poverty been fast enoughto offset population growth—resulting in a likely fall in the actual number of peopleliving in extreme poverty.
9.4 The key driver of the fall in world poverty in recent decades has been the rapideconomic growth experienced by a number of large Asian countries, particularly China.Apart from driving the overall figures, this growth has caused a dramatic change in theregional breakdown of world poverty. A few decades ago, world poverty wasconcentrated in Asia. However, the spectacular success of Asia in reducing its povertyrates, coupled with stagnation in Africa, means that extreme poverty is increasinglybecoming an African phenomenon. The depth of poverty in Africa is such that it isprobable that, in a few years’ time, the continent will have an almost complete monopolyon extreme poverty in the world.
9.5 The rise of Asia, particularly China, and the stagnation of Africa are also the keyfactors explaining recent trends in world income inequality. While differences betweenthe average incomes of the poorest and richest countries continue to grow,population-weighted income inequality between countries has been declining in recentdecades. Inequality within countries, however, has generally been rising. The net result isthat overall inequality between all the individuals of the world shows no conclusive trend.In contrast to poverty, these recent trends in world inequality represent a departure fromthe trend of the last 200 years, resulting in rapidly rising inequality between individuals,driven by huge increases in (both weighted and unweighted) inequality betweencountries. The product of this long-term trend is today’s highly unequal world—worldinequality among individuals is even higher than the inequality that exists withinfamously unequal societies such as Brazil and South Africa. The highest levels of
SAAJ 7 (2007)
154 � POVERTY AND INEQUALITY IN SOUTH AFRICA AND THE WORLD
inequality in the world are to be found in Latin America and Africa, particularly SouthernAfrica.
9.6 The situation in South Africa is somewhat confused, with a number ofcontradictory estimates of the levels and trends of poverty and inequality. One of thereasons for this is that there is no official national poverty line. Different researchers havetended to use different lines, resulting in a wide range of reported figures for thepercentage of people living in poverty. Perhaps more importantly, poverty measurementin South Africa is held back by the relatively poor quality of the data available fromincome and expenditure surveys. Data quality problems and inconsistencies betweensurveys lead to divergent poverty estimates as different researchers try to get around theproblems in different ways. Inconsistencies in survey design over time have causedparticular problems for researchers trying to establish the poverty trends. Until these dataproblems are resolved, uncertainty about whether poverty in South Africa is getting betteror worse will remain.
9.7 Most recent attempts to analyse South African poverty and inequality trends havefocused on the period between 1995 and 2000, and almost all studies have found thatincome and expenditure poverty worsened over this period, and inequality widened.Government has however pointed out that these measures make no allowance for theimprovement in provision to the poor of basic services such as health care, education,housing, water and electricity. Their pronouncements on poverty trends haveincreasingly sought to place the emphasis on these elements, rather than pure income andexpenditure poverty measures. The limited research that has so far been done on thepost-2000 period suggests that poverty rates have started to decline, probably because ofthe wide expansion in cash grants from government. Appendix A shows a table of thepoverty measures for South Africa at different points in times using some of the differentpoverty measures mentioned in this paper.
9.8 One fact that is uncontroversial is that inequality is extraordinarily high. SouthAfrica’s Gini coefficient is almost certainly amongst the highest in the world (not thehighest though, as is commonly reported). A consequence of this high inequality is thatSouth Africa has higher poverty rates than many other countries with comparable averageincome levels.
SAAJ 7 (2007)
POVERTY AND INEQUALITY IN SOUTH AFRICA AND THE WORLD � 155
REFERENCES
Alcock, P (1997). Understanding Poverty. 2nd edn. Trans-Atlantic Publications
Bhalla, S (2003). Imagine there’s No country: Poverty, Inequality and Growth in the era of
Globalization. Penguin, New Delhi
Baulch, B & Massett, E (2002). Do monetary and non-monetary indicators tell the same story about
chronic poverty? A study of Vietnam in the 1990s. World Development 31 (3), 441–53
Bhorat, H, Poswell, L & Naidoo, P (2004). Dimensions of Poverty in Post-Apartheid South Africa
1996–2001. A Poverty Status Report, Development Policy Research Unit, University of Cape Town
Bigsten, A & Levin, J (2000). Growth, Inequality, and Poverty – Prospects for Pro-Poor Economic
Development. Oxford University Press, Oxford
Boltvinik, J (unpublished). Poverty Measurement Methods – An Overview. Unpublished article,
United Nations Development Programme. www.undp.org/poverty/publications/pov_red/
Poverty_Measurement_Methods.pdf, 2006
Bourguignon, F & Morrisson, C (2002). Inequality among world citizens 1820–1992. American
Economic Review 92, 727–44
Carter, M & May, J (2001). One kind of poverty: poverty dynamics in post-apartheid South Africa.
World Development 29 (12), 1987–2006
Chen, S & Ravallion, M (2004). How have the world’s poorest fared since the early 1980s? The
World Bank Research Observer 19 (2), 141–69
Citro, CF & Michael, RT (1995). Measuring Poverty: A New Approach. National Academies Press,
Washington, D.C.
Deaton, A (2004). Measuring poverty in a growing world (or measuring growth in a poor world).
The Review of Economics and Statistics 87 (1), 1–19
Dikhanov, Y (unpublished). Trends in global income distribution 1970–2000, and scenarios for
2015. Unpublished occasional paper, UNDP Human Development Report Office
Dikhanov, Y & Ward, M (unpublished). Evolution of the global distribution of income 1970–99.
Unpublished paper presented at 5th Conference on Globalisation Growth and (In)equality held
in Warwick, England, March 15–17, 2002, www.eclac.cl/povertystatistcs/documentos/
dikhanov.pdf, 2006
Fedderke, J, Manga, J & Pirouz, F (unpublished). Challenging Cassandra: household and per capita
household income distribution in the October Household Surveys 1995–1999, Income and
Expenditure Surveys 1995 & 2000, and the Labour Force Survey 2000. Unpublished
mimeograph, University of the Witwatersrand, 2003
Hoogeveen, JG & Özler, B (2004). Not Separate, Not Equal – Poverty and Inequality in
Post-Apartheid South Africa. William Davidson Institute Working Paper No 739. Ann Arbor,
University of Michigan
Human Sciences Research Council (unpublished). Poverty in South Africa: HSRC Fact Sheet. Human
Sciences Research Council, 2004, www.sarpn.org.za/documents/d0000990/index.php, 2006
Leibbrandt, M, Poswell, L, Naidoo, P, Welch, M & Woolard, I (2005). Measuring Recent Changes
in South African Inequality and Poverty using 1996 and 2001 Census Data. Centre for Social
Science Research Working Paper No 84. Cape Town, University of Cape Town
Litchfield, J (unpublished). Inequality: Methods and Tools. World Bank, 1999
SAAJ 7 (2007)
156 � POVERTY AND INEQUALITY IN SOUTH AFRICA AND THE WORLD

Lok-Desallien, R (unpublished). Review of Poverty Concepts and Indicators. United Nations
Development Program, 1999, www.undp.org/poverty/publications/pov_red/
Review_of_Poverty_Concepts.pdf, 2006
May, J (ed.) (unpublished). The Poverty and Inequality Report in South Africa. Unpublished report
prepared for the Office of the Executive Deputy President and the Inter-Ministerial Committee for
Poverty and Inequality, 1999 http://www.polity.org.za/html/govdocs/reports/poverty.html, 2006
May, J & Woolard, I (unpublished). The State of Underdevelopment in South Africa, 1995–2005.
Unpublished paper prepared for the Development Bank of Southern Africa, School of
Development Studies, University of KwaZulu-Natal, 2005
Meth, C (2006). What was the poverty headcount in 2004 and how does it compare to recent
estimates by van der Berg et al? South African Labour and Development Research Unit
Working Paper, University of Cape Town. Hard copies are available; website:
www.saldru.uct.ac.za/saldru_pubs.html
Milanovic, B (2005). Worlds Apart: Measuring International and Global Inequality. Princeton
University Press, New Jersey
Pearsall, J (1999), Editor, Concise Oxford Dictionary. 10th edn., Oxford University Press, Oxford
Profile Books (2006). The Economist Pocket World in Figures, 2006 Edition, London
Ravallion, M (1992). Poverty Comparisons: a Guide to Concepts and Methods Living Standards.
World Bank, Washington, D.C.; cited in Woolard & Leibbrandt, 1999
Ravallion, M (2003). The debate on globalisation, poverty and inequality: why measurement
matters. International Affairs 79 (4), 739–753
Roberts, B (2004). Empty Stomachs, empty pockets: poverty and inequality in post-apartheid
South Africa. In J. Daniel, R. Southall & J. Lutchman (eds). State of the nation: South Africa
2004–2005. HSRC Press, Cape Town
Sala-I-Martin, X (2006). The world distribution of income: falling poverty and…convergence,
period. The Quarterly Journal of Economics 121 (2), 351–397
Samson, S, Babson, O, Haarman, C, Haarman, D, Khathi, G, Quene, KM & Van
Niekerk, I (unpublished). Impact of the social security system on poverty in South Africa.
Unpublished research paper, Economic Policy Research Institute, www.epri.org.za/rp19.htm, 2006
Seekings, J, Leibbrandt, M & Nattrass, N (2004). Income Inequality after Apartheid. Centre for
Social Research Working Paper 04/75, University of Cape Town, Cape Town
Hard copies are available; website: www.cssr.uct.ac.za/wp75.html
Sen, A (1976). Poverty: an ordinal approach to measurement. Econometrica 44 (2), 219–31
Sen, A (1983), ‘Poor, Relatively Speaking,’ Oxford Economic Papers, No. 37, 669–76.
Reproduced in Sen, Amartya K. 1984, 325–345
Simkins, C (unpublished). What happened to the distribution of income in SA between
1995 & 2002? Unpublished paper, University of the Witwatersrand, 2005 www.polity.org.za/
pdf/DistributionOfIncome95-2001.pdf, 2006
Statistics South Africa and the Presidency (2005). SA Millennium Development Goals Country
Report 2005
Van der Berg, S & Louw, M (2003). Changing patterns of South African income distribution:
towards time series estimates of distribution and poverty. South African Journal of Economics
72 (3), 546–72
SAAJ 7 (2007)
POVERTY AND INEQUALITY IN SOUTH AFRICA AND THE WORLD � 157
Van der Berg, S & Burger, R (unpublished). The stories behind the numbers: an investigation of
efforts to deliver services to the South African poor. Unpublished report prepared for the World
Bank, University of Stellenbosch, Stellenbosch, 2002 www.sarpn.org.za/documents/
d0000846/P913_Stories-behind-numbers_vdBerg_Nov2002.pdf, 2006
Van der Berg, S, Burger, R, Burger, R, Louw, M & Yu, D (2005). Trends in poverty and inequality
since the political transition. Stellenbosch Economic Working Papers, No. 1/2005, University
of Stellenbosch, Stellenbosch
Vella, V & Vichi, M (1997). Identification of Standards of Living and Poverty in South Africa.
World Bank and University of Chieti, World Bank Development Sources
Woolard, I & Leibbrandt, M (1999). Measuring Poverty in South Africa. Development Policy
Research Unit (DPRU) Working Paper 99/33, University of Cape Town, Cape Town
Woolard, I (unpublished). Income Inequality & Poverty: Methods of Estimation and Some Policy
Applications for South Africa. Unpublished PhD thesis, University of Cape Town.
Woolard, I (2002). An Overview of Poverty and Inequality in South Africa. Working Paper
prepared for DFID (SA), 2002
World Bank (2005). World Development Report 2006: Equity and Development. World Bank
World Bank (2006). World development indicators 2006. World Bank
SAAJ 7 (2007)
158 � POVERTY AND INEQUALITY IN SOUTH AFRICA AND THE WORLD
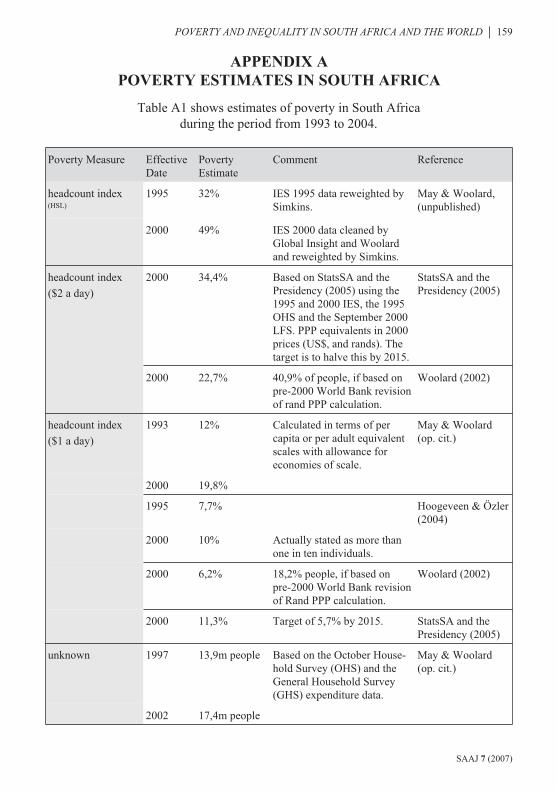
APPENDIX A
POVERTY ESTIMATES IN SOUTH AFRICA
Table A1 shows estimates of poverty in South Africaduring the period from 1993 to 2004.
Poverty Measure EffectiveDate
PovertyEstimate
Comment Reference
headcount index(HSL)
1995 32% IES 1995 data reweighted bySimkins.
May & Woolard,(unpublished)
2000 49% IES 2000 data cleaned byGlobal Insight and Woolardand reweighted by Simkins.
headcount index
($2 a day)
2000 34,4% Based on StatsSA and thePresidency (2005) using the1995 and 2000 IES, the 1995OHS and the September 2000LFS. PPP equivalents in 2000prices (US$, and rands). Thetarget is to halve this by 2015.
StatsSA and thePresidency (2005)
2000 22,7% 40,9% of people, if based onpre-2000 World Bank revisionof rand PPP calculation.
Woolard (2002)
headcount index
($1 a day)
1993 12% Calculated in terms of percapita or per adult equivalentscales with allowance foreconomies of scale.
May & Woolard(op. cit.)
2000 19,8%
1995 7,7% Hoogeveen & Özler(2004)
2000 10% Actually stated as more thanone in ten individuals.
2000 6,2% 18,2% people, if based onpre-2000 World Bank revisionof Rand PPP calculation.
Woolard (2002)
2000 11,3% Target of 5,7% by 2015. StatsSA and thePresidency (2005)
unknown 1997 13,9m people Based on the October House-hold Survey (OHS) and theGeneral Household Survey(GHS) expenditure data.
May & Woolard(op. cit.)
2002 17,4m people
SAAJ 7 (2007)
POVERTY AND INEQUALITY IN SOUTH AFRICA AND THE WORLD � 159

headcount index
(R800 per month in1999 rands)
2000 37% Woolard (op. cit.)
headcount index
(R1000 per monthin 2002 rands)
2000 55% Woolard (op. cit.)
headcount index
(R3000 per capitaper annum in 2000terms)
1970 49,8%
11,3m people
See section 8.2.1 for a moredetailed description.
Van der Berg &Louw (2003)
1980 38,9%
11,4m people
1990 35,3%
13,3m people
2000 38,6%
17,2m people
1993 40,6%
16,2m people
See section 8.2.3 for a moredetailed description.
Van der Berg et al.,(2005)
2000 41,3%
18,5m people
2004 33,2%
15,4m people
relative povertylevel of 40% ofpopulation
(~19m people)
1998 Impliedpoverty line ofR353 p.m.
Per adult equivalent.
Based on 1995 IES.
May (unpublished)
poverty gap (basedon 40% relativepoverty line)
1995 R28bn
poverty gap(R323–R587 pp permonth)
1996 R56bn Based on a poverty line thatvaries by household size e.g.R323 for a 4-memberhousehold and R587 for a1-member household.
Human SciencesResearch Council(unpublished)
poverty gap(R323–R587 pp permonth)
2001 R81bn Based on a poverty line thatvaries per household size e.g.R323 for a 4-memberhousehold and R587 for a1-member household
SAAJ 7 (2007)
160 � POVERTY AND INEQUALITY IN SOUTH AFRICA AND THE WORLD