Embed Size (px)
Citation preview

4Rapid Poverty Reduction
THE POOR IN INDIA: A PROFILE4.1 India is a nation with over 300 million poor people,a number that has barely declined over the last threedecades of development. It is therefore essentialthat the Eleventh Five Year Plan address the task ofreducing the numbers of the poor frontally. It is clearthat rapid growth will be essential to reduce the num-ber of the poor and for sustainable poverty reduction,but for growth to benefit the poor disproportionately,it will have to be accompanied by more rapid employ-ment expansion than hitherto, greater investment inhealth, education, water/sanitation, and child nutritionthan so far, and directly targeted poverty-reductionprogrammes.
MEASURING AND PROFILING THE POORIN INDIA
THE HEADCOUNT RATIO (HCR)4.2 India has successfully reduced the share of thepoor in the population by 27.4 percentage points from54.9 in 1973 to 27.5 in 2004. Between 1973 and 1983,the HCR of the poor had declined from 54.9% to44.5%, and it fell further to 36% in 1993–94 andto 27.5% by 2004–05 (Table 4.1). Thus, 60 years afterindependence, over a quarter of our population stillremains poor. There is growing consensus that thepoverty line (Rs 356 monthly per capita consumptionexpenditure for rural areas and Rs 539 for urbanareas in 2004–05) in India is much too low, and con-tinues to be based on a consumption basket that is toolean. If the poverty line was higher, the share of the
population below the poverty line would be accord-ingly higher.
TABLE 4.1Percentage of People Below Poverty Line
in India (1973–2004)
Years Rural Urban Combined
1973 56.4 49.0 54.91983 45.7 40.8 44.51993 37.3 32.3 36.02004 28.3 25.7 27.5
Source: Planning Commission.
4.3 Some States have been particularly successful inreducing the share of the poor in the total population.In 2004–05, the States with the lowest HCR wereJ&K (5.4%), Punjab (8.4%), Himachal Pradesh(10%), Haryana (14%), Kerala (15%), Andhra Pradesh(15.8%), and Gujarat (16.8%); at the other end of thespectrum are Orissa (46.4%), Bihar (41.4%), MadhyaPradesh (38.3%), and Uttar Pradesh (32.8%)—whichalso happen to be among the most populous Statesof India. The States that were formed recently(Chhattisgarh 40.9%, Jharkhand 40.3%, Uttarakhand39.6%) also have among them the highest povertyratio (Annexures 4.1 to 4.3).
THE ABSOLUTE NUMBER OF POOR4.4 Over time, while the HCR of the poor fell, thenumber of the poor barely changed over the last threedecades, remaining constant over two decades beforefalling (3213 lakhs in 1973, 3229 lakhs in 1983, 3204

80 Eleventh Five Year Plan
lakhs in 1993–94) to 3017 lakhs in 2004–05 (Table 4.2).Therefore, number of poor in the country has declinedover the last decade (1993–94 to 2004–05) by 1.86.
TABLE 4.2Number of Persons Below Poverty Line
in India (1973–2004)(in Lakh)
Years Rural Urban Combined
1973 2612.90 600.46 3213.361983 2519.57 709.40 3228.971993 2440.31 763.37 3203.682004 2209.24 807.96 3017.20
Source: Planning Commission.
4.5 In some States, the absolute numbers of the poorin the population has actually increased over the lastthree decades: in Uttar Pradesh (including Uttaranchal)from 535.7 lakhs in 1973 to 626 lakhs in 2004–05;in Rajasthan from 128.5 lakhs to 134.9 lakhs; inMaharashtra from 287.4 lakhs to 317.4 lakhs, andin Nagaland from 2.9 lakhs to 4.0 lakhs. The totalnumber of poor has also increased in Madhya Pradesh(including Chhattisgarh) taken together from 276 lakhsto 341 lakhs and in Bihar (including Jharkhand) from370 lakhs to 485.5 lakhs over the same period. Thereare many States where the number of poor overall hasremained roughly constant over the last two decades:Haryana, Himachal Pradesh, Orissa, and Mizoram.However, there are also States that have succeededin reducing the absolute number of the poor in ruralareas over the three decades from 1973 to 2004–05:Andhra Pradesh from 178.2 lakhs to 64.7 lakhs;Karnataka from 128.4 lakhs to 75 lakhs; Kerala from111.4 lakhs to 32.4 lakhs; Tamil Nadu from 172.6 lakhsto 76.5 lakhs; and West Bengal from 257.9 lakhs to 173.2lakhs (Annexures 4.1 to 4.3), and Assam and Gujarat toa much smaller extent. These are the relative successstories in reducing the numbers of the poor in India.
4.6 Overall, the number of poor in rural areas inthe country as a whole has declined from 2613 lakhsin 1973 to 2209 lakhs in 2004–05, i.e., by just 404lakh people over a 31 year period. That means therate of decline in the numbers of the poor has been13 lakhs per year. But in urban areas the numbers ofthe poor has gone on increasing from 600.5 lakhsin 1973 to 808.0 lakhs in 2004–05 (Annexures 4.1 to4.3); this is hardly surprising since the share of the
urban population in India’s total population hasalso gone on increasing, driven partly by rural urbanmigration.
4.7 The fact that the numbers of the poor have de-clined in rural areas, and increased in urban areas overthe last three decades suggests that to escape ruralpoverty, the poor migrate to urban areas. In fact, thetotal number of migrant workers in India in 1999–2000was 10.27 crore—a staggering number. The numberof seasonal or cyclical migrants in India may be 2 croreor so. But migration, both rural–rural (from relativelypoor to relatively richer States and districts) andrural–urban, has the effect of disenfranchising thepoor, leaving them without a safety net. Nevertheless,rural–urban migration will, and should continue; thepolicy imperative is that migrants are provided thebasic social services that all citizens are entitled toaccording to the Constitution of India.
4.7(a) While the earlier two subsections examined theheadcount ratio and the absolute numbers of the poor,it is also useful to examine which States contribute mostof India’s Poor. Four States account for nearly 58% ofIndia’s poor population in 2004–05: Uttar Pradesh(19.6%), Bihar (12.23%), Madhya Pradesh (8.3%) andMaharashtra (10.5%). In 1983, these States (includingundivided Bihar and Madhya Pradesh) accounted for49% of India’s total poor population (Annexure 4.1).
COMPOSITION OF THE POOR4.8 The composition of the poor has been changingand rural poverty is getting concentrated in agricul-tural labour and artisanal households and urbanpoverty in casual labour households. Agriculturallabour households accounted for 41% of rural poorin 1993–94 as well as in 2004–05. The share of self-employed in agriculture among the rural poor hadfallen from 32% to 21.6%. Casual labour householdsaccounted for 62.6% in 1993–94 in urban areas and56.5% in 2004–05.
4.9 The occupational composition of rural poor var-ied across the States. In general, in developed Statespoverty was highly concentrated among agriculturallabour households, and in contrast in backward Statespoverty extended to other occupational groups includ-ing self employed in agriculture.

Rapid Poverty Reduction 81
4.10 Among social groups, SCs, STs, and backwardcastes accounted for 80% of the rural poor in 2004–05, considerably more than their share in the ruralpopulation (Working Group on Poverty, PlanningCommission, 2006). In 2004–05, while the HCR of thepoor in the total rural population was 28.3%, amongthe SCs it was 36.8%. In urban areas, the HCR overallwas 25.7%, but among SCs it was even higher than inrural areas at nearly 40%.
4.11 The proportion of STs population among therural population living in poverty is high. It is about15% in 2004–05—double that of their share in thetotal population of India. For rural population, theincidence of poverty among STs had fallen from51.94% in 1993–94 to 47.3 % in 2004–05 whereas ithad fallen from 37.3% to 27.5% in the total popula-tion. In 2004–05, the incidence of poverty among theSTs had barely fallen compared to a decade earlier andit was a good 20 percentage points higher for the STsthan for the rest of the population.
4.12 The share of poor in the total urban populationin 2004–05 was 25.7% but 33.3% of the STs in urbanareas were poor. The HCR of the STs (47.3%) ishigher than that of SCs (36.8%) in rural areas, but thesituation is the other way around in urban areas, i.e.,of all STs living in rural areas a higher proportion ispoorer than all SCs living in rural areas. On the otherhand, of all SCs living in urban areas, more SCs arepoor than all STs. In rural areas SCs don’t have accessto land and therefore are forced to migrate to urbanareas more often. On the other hand, STs (unlike SCs)in rural areas have much better access to land, espe-cially in the forested areas, but the quality of that land,and its productivity is low, and yields low incomes.
In terms of assets, unlike SCs, the STs have less of aproblem in respect to land. Thus, in the total ruralpopulation, 63.2% of households held land, and thatshare was 61.3% for STs.
4.13 In terms of both income poverty and otherindicators of human development (such as educationand health) the STs are at the bottom. The increasingconcentration of the tribals among those who sufferfrom multiple deprivations is a matter of concern.
MULTIPLE DEPRIVATIONS OF THE POOR4.14 Deprivation of SCs and STs shows itself also inthe form of inequalities of wealth. SCs own fewerassets than the rest of the population. Most SCs livein rural areas, where land is the main asset. In theoverall population, 60% of the rural households werecultivator households. But SC households are moredisadvantaged among rural households; only 47% werecultivators and a quarter of the SC households wereagricultural labour households (Table 4.3). About 6%to 7% of the SC households were artisan households.If we examine the value of assets held by social groupsin rural areas, we find that in the total populationabout 12% of the households in the ‘Other category’(i.e., non-SC, non-ST, and non-OBC) have assets worthless than Rs 30000; but 22% of rural SCs have assetsworth less than Rs 30000. Conversely, only 9% of SChouseholds have assets worth Rs 3 lakh and above,while 37% of households in the ‘Other category’ (whoare not either SC or ST or OBC) hold such assets. Thisdifference in asset holdings becomes sharper in urbanareas, with as much as 29% of SC households with as-sets less than Rs 30000. Only 16.7% of SC householdshold assets worth Rs 3 lakh, while 43.5% of ‘otherhouseholds’ hold such assets in urban areas.
TABLE 4.3Percentage of Households by Asset-holding Categories, by Social Group
Social Group Household Asset-holding (Rs in ’000s)
Rural Urban
less than 30 300 and above less than 30 300 and above
ST 23.5 9.1 32.5 20.1SC 22.1 9.0 29.1 16.7OBC 13.3 24.4 23.7 28.5Others 11.9 37.1 20.0 43.5All 15.9 24.8 23.0 33.7
Source: All-India debt and investment survey, Ministry of Statistics and Programme Implementation,GoI, NSS 59th Round, 2003.

82 Eleventh Five Year Plan
4.15 Land is the most important asset for ruralpeople. Although SCs were 21.6% of the rural house-holds, they held only 9% of the land (Table 4.4).On average SC households barely owned 0.3 ha ofland in rural areas. Land distribution was even furtherskewed against the SCs in urban areas. Other Back-ward Classes (OBCs) on average held 0.758 ha (orapprox. 1.5 acres) per household, although the shareof total rural land held by them was comparable totheir share in the population.
4.16 With fewer assets, it was also not possible for SCsand STs to borrow (Table 4.5), and thus emerge out ofpoverty. This is true for both sets of communities inboth rural and urban areas.
4.17 SCs and STs have much worse health, education,and nutrition indicators than the rest of the popula-tion, followed by OBCs, and others (Table 4.6). Whileinfant mortality rates (IMR) were 49 for Others, forSCs it was 66, for STs 62 and for OBCs 57. Their nutri-tional status is also worse; the mean body mass index(BMI) for SCs, STs, and OBCs is 5–10% below that forOthers, and very close to the cut-off for malnutrition(>18.5). (BMI is a measure of a person’s nutritionalstatus [weight for height, measured in kg per squaremetre, sq m, of height.])
4.18 SCs and STs have Gross Enrolment Rates at pri-mary level which are comparable with the generalpopulation (Table 4.7), as they have risen sharply for
TABLE 4.4Land Owned per Household by Social Group, 2003
Characteristic Rural
SC ST OBC Others All
Percentage of area of land owned 9.04 11.2 43.5 36.3 100Average area (ha) owned per household 0.3 0.77 0.76 1.003 0.73Percentage of households 21.6 10.6 41.6 26.26 100
Urban
SC ST OBC Others All
Percentage of area of land owned 4.76 3.25 36.8 55.21 100Average area (ha) owned per household 0.04 0.15 0.14 0.151 0.13Percentage of households 15 2.91 34.5 47.57 100
Source: Household Ownership Holdings in India, Ministry of Statistics and Programme Implementation, GoI, NSS 59th Round, 2003.
TABLE 4.5Incidence of Indebtedness by Social Group
Indicators Rural
ST SC OBC Others All
Average debt per household (Rs ) 3205 4641 8288 10437 7539Debt asset ratio (%) 2.3 3.7 3.1 2.4 2.8Incidence of indebtedness (%) 17.9 27.1 28.9 25.7 26.5
Urban
ST SC OBC Others All
Average debt per household (Rs ) 9233 7744 11200 13577 11771Debt asset ratio (%) 3.8 4.2 3.4 2.4 2.8Incidence of indebtedness (%) 12.2 19.2 21.2 15.3 17.8
Source: All-India debt and investment survey, Ministry of Statistics and Programme Implementation, GoI, NSS 59th Round, 2003.

Rapid Poverty Reduction 83
all sections of the population in the recent decade.However, their dropout rates, before they completefive years of schooling (a minimum if they are to
retain literacy acquired during those five years), arehigher than for the general population. ST childrenare dropping out far more. Thus, we have a serioussituation, in that in 2004–05 not only were 29% of theentire nation’s children dropping out before complet-ing primary schooling, but the SCs and STs weredoing even worse.
POVERTY AMONG WOMEN4.19 The incidence of income poverty among femalestended to be marginally higher in both rural andurban areas. The percentage of female persons livingin poor households was 28% in rural and 26% inurban areas in 1993–94, and 29 and 23 respectivelyin 2004–05. In contrast, the percentage of male per-sons living in poverty was 27 in rural and 26 in urbanareas in 1993–94, and 27 and 23 in 2004–05 . The lowerpercentage of female persons among the poor despitehigher female poverty ratio was due to an adverse sexratio—which itself is a reflection of the discrimina-tion that women and girls face over their life-cycle. Itshould be noted that the above measure of genderpoverty ignores intra-household inequalities in con-sumption. There are other dimensions of poverty suchas food insecurity, malnutrition, and illness associatedmore with female members.
4.20 That women are much worse off in terms of mostsocial indicators is quite well known. SC and ST girlsare the worst off in terms of most educational out-come indicators. For instance, in the critical age-groupof 15–49 years, when women are in their reproductiveand most productive years, it is remarkable that 73%of SC women , 79% of ST women , and 61% of OBCwomen are illiterate. 61% of Muslim women were alsoilliterate; this percentage is relatively low, only becausethe rate of urbanization among Muslims is higher thanfor other social groups.
4.21 The nutritional status of SC and ST womenremains a source of worry as well. A good 42% ofSC women and 46% of ST women had a BMI lessthan 18.5, which is seen as the cut-off for malnutri-tion. The fact that as much as 30% of the ‘Other’women were also malnourished clearly indicates thatthere is a serious problem of under-nutrition amongmost segments of the population, not just SCs and STs.
TABLE 4.6Health and Nutrition Indicators bySocial Groups in 2005–06 (NFHS-3)
Indicators Rural
SC ST OBC Others
Infant Mortality 71.0 63.9 61.1 55.7Under-five Mortality 94.7 99.8 78.7 68.2
Urban
SC ST OBC Others
Infant Mortality 50.7 43.8 42.2 36.1Under-five Mortality 65.4 53.8 54.5 42.1
Total (Combined)
SC ST OBC Others
Fertility 2.92 3.12 2.75 2.35Infant Mortality 66.4 62.1 56.6 48.9Under-five Mortality 88.1 95.7 72.8 59.2
Nutritional Status Mean BMI for Men 19.7 19.3 20.2 20.9Mean BMI for Women 19.9 19.1 20.4 21.3
Source: National Family Health Survey (NFHS-3), 2005–06,International Institute for Population Sciences, Mumbai.
TABLE 4.7Gross Enrolment, Dropout at Primary Stage (I–V)
by Social Groups, 2004–05
Indicators SC
Boy’s Girl’s Total
Gross Enrolment Ratio (GER) 123.33 106.62 115.30Dropout Rate 32.73 36.14 34.21
ST
Boy’s Girl’s Total
Gross Enrolment Ratio (GER) 128.06 115.49 121.91Dropout Rate 42.55 42.04 42.32
General
Boy’s Girl’s Total
Gross Enrolment Ratio (GER) 110.70 104.70 107.80Dropout Rate 31.81 25.42 29.00
Source: Selected Educational Statistics, Ministry of HumanResource Development (MHRD), GoI, 2007.
84 Eleventh Five Year Plan
POVERTY AMONG CHILDREN4.22 Child poverty is widespread in India both inrural and urban areas. The percentage of childrenbelow 15 years living in below poverty line (BPL)households constituted 39 in rural and 41 in urbanareas in 1993–94 and 44 in rural and 32 in urban areasin 2004–05. Among the poor population, the percent-age of children increased from 44 in rural and 39 inurban areas in 1993–94, to 46 and 42 respectivelyin 1999–2000. This rising tendency in the proportionof children among the poor contrasts with the pro-portion of children in the population which was aconstant 44% in rural areas in 1993–94 as well as in2004–05 and a marginal decline from 39% to 32%in urban areas during the same period. The high andrising level of child poverty is not only linked to a highincidence of child malnutrition, but also underminestheir future capabilities and adversely affects equalityof opportunity.
MEASURING AND IDENTIFYING THE POOR: A NOTEON REVISION OF POVERTY LINES4.23 There are two policy-relevant sets of issues aboutpoverty in the country at present. First, there has beencontroversy around the measurement of poverty, aspresented in the official statistics of the Planning Com-mission. Second, there are issues around the identifica-tion of the poor who are potential beneficiaries ofgovernment programmes, as carried out by the UnionMoRD. The two are not unconnected, since for someprogrammes State Governments have to accept theHCR of poor as measured by the Planning Commission.
4.24 There are many unresolved issues regardingmeasurement of poverty in India and upon thequestion of poverty line itself, which necessitate arevisit of this entire question. Accordingly, an ExpertGroup has been constituted by the Planning Commis-sion whose recommendations, hopefully, will provideacceptable measures of both poverty and the popula-tion below the poverty line.
4.25 The identification of the poor since 1992 has beendone in quinquennial surveys carried by the MoRD.The first one (1992) used income to identify the poor,the second one (1997) used consumption. The thirdone (2002) adopted a 13-criteria questionnaire giving
each criteria equal weightage. This survey has beenquestioned in the Supreme Court in Public InterestLitigation. Before commissioning a new BPL surveyfor identification of poor, which is due, there is needto constitute an Expert Group with representativesfrom States, academics, and civil society and evolvean acceptable criteria and methodology for the forth-coming BPL survey. Suitable adjustments of the dis-trict specific and State specific poverty populationyielded from this survey should be negotiated withthe State Governments so that this number is not outof sync excessively with the poverty as measured byPlanning Commission based on National SampleSurvey (NSS) data.
DIRECTLY TARGETED POVERTY REDUCTIONPROGRAMMES AND THE STRATEGY FORINCLUSIVE GROWTH4.26 Given the chronic and multi-dimensional natureof poverty in India, it is imperative that the program-mes to address poverty rely on a multi-pronged ap-proach. The preceding analysis has identified that thereis a geography of poverty, with poverty being concen-trated in the rural areas of certain States. It also pointedout that there is a sociology of poverty, with certainsocial groups increasingly concentrated among thosewho are identified as poor. It also noted that there areidentifiable occupational features of the poor: they areconcentrated in agricultural labour and artisanalhouseholds in rural areas, and among casual labourersin urban areas. Casual labourers in urban areas areessentially distress migrants from rural areas in Stateswhere agricultural land-man ratio is very adverse, andwhere agricultural incomes have not been growing—reinforcing the need for both land reforms as well asmeasures to increase productivity. Accordingly, in thenext section, the strategy and programmes directlyrelevant to the emerging features of poverty groups inIndia are discussed.
4.27 First, regions which have large number of chronicpoor people include tribal in forests concentratedin arid, semi-arid, and sub-humid areas in centraland eastern parts of the country. However, in manysemi-arid regions, where agriculture is mainly rainfedrather than irrigated, located in the more industrialStates of western and southern India, there has been
Rapid Poverty Reduction 85
more dynamism. Migration from semi-arid areas mayresult in improvement of economic conditions forpeople in the rainfed areas due to better investmentopportunities and market functioning compared tothe forest-based regions. In forest regions, poor people’saccess to the resources which are located there in thoseregions have been limited, and their own low humancapital endowment (e.g., low literacy and poor healthservices) have resulted in their incorporation intolabour markets at disadvantageous terms. It is forthis reason that the strategies that are needed foreach of these agro-climatic regions have to rely uponan area-development approach. This is particularlytrue of rain dependent water stressed areas, wherewatershed development has been neglected. Thuswatershed development in rainfed agriculture has totake center-stage in the poverty reduction strategyfor the Eleventh Plan. Watershed development isdiscussed in the chapter on Agriculture (Chapter 1,Volume III). Similar initiatives that hold promise toimpart dynamism to Backward districts/regions are(i) the Backward Regions Grant Fund, (ii) Border AreaDevelopment Programme, and (iii) Hill Area Develop-ment Programme. These initiatives are discussed inthe chapter on Spatial Development (Chapter 6,Volume I).
4.28 Second, the poor are geographically concentratedin India. They also happen to be in States where a sig-nificant proportion of agriculture is irrigated, and notrainfed (and where the land-man ratio is the lowest inthe country). In other words, without effective (i) landreforms and (ii) agricultural services, none of theseregions are likely to be able to reduce poverty. There isalso a need for programmes to modernize land rela-tions in an era of rapid industrialization. We discussagricultural services in the chapter on Agriculture, aswe do land reforms including issues related to alien-ation of tribal lands.
4.29 Third, dependence on casual labour has grown,and a large proportion of the chronic poor are depen-dent on wage labour. There has been a steady increasein the share of the Indian population working as hiredlabour. All of the increase in recent decades has beendue to the expansion of the share of casual hired labour.Most of these are SCs and STs. While male rural casual
labourers have increasingly worked in the non-farmsector over time, women have increasingly been con-centrated in agricultural casual labour and have lostjobs overall, especially in the 1990s. Growth in casuallabour was strong among the landless and especiallyrapid after the 1987 drought. In the 1990s there wasan explosion of self-employed people choosing to dosubsidiary work as casual labourers. The incidence ofpoverty among rural casual workers is greatest amongnon-workers who do occasional casual work and es-pecially among women. Most ST and 40% of SCcasual workers are poor, the landless casual workersbeing the poorest. On an average, women are poorerthan men casual labourers. Clearly, this calls for aneffective wage employment programme in rural areas,especially focusing on women, of the NREG kind.
4.30 Fourth, the poor have to be enabled to increasetheir incomes by diversifying away from agriculture,and relying on non-farm sources for at least a subsid-iary income. Casual labourers and artisans, especiallywomen, can be brought together through socialmobilization to form SHGs, and with credit support,to diversify their sources of income. In certain partsof India (e.g., Kerala, Andhra Pradesh, Gujarat) thesuccess of such efforts have already borne fruit, and itis essential to make sure that this programme goes toscale in the country in regions which need it most—inthe eastern and northern parts—where it has hardlytaken root.
4.31 Finally, the poor need a safety net, if they are toescape the cycle of inter-generational transfer of pov-erty. At least 18 million rural people do not have a homeover their heads, and the rural housing programmeneeds to focus on giving a homestead to at least thosewho are houseless. Homesteads will not only give thema home, but also provide a small plot of land wherethey can diversify their income by rearing goats andpoultry and growing vegetables on the family plot.Similarly, the elderly destitute, widows, and disabledamong the rural poor, need social assistance.
4.32 The poor also suffer from low human capital.Household size is closely related to both malnutritionof adults and children, and to the inter-generationaltransfer of poverty. The directly-targeted poverty

86 Eleventh Five Year Plan
reduction efforts of the government will fail in the Elev-enth Plan if the quality of public health services andthe integrated child development services do not im-prove, and also if the universalization of elementaryeducation with quality does not happen. However, aninclusive growth strategy that focuses only on humancapital formation or directly targeted poverty reduc-tion is likely to fail. The structure of growth and alsothe pattern of production have to be employment-gen-erating, especially outside agriculture. In other words,the simultaneous focus on a three-legged strategy—economic growth, income-poverty reduction throughtargeted programmes, and human capital formation—will put India on a sustainable growth path, since thereis a recognized synergy between these outcomes.
GUARANTEED WAGE EMPLOYMENT—NATIONALRURAL EMPLOYMENT GUARANTEE ACT (NREGA)4.33 Workfare programmes have been importantprogramme interventions in India and elsewhere indeveloping countries since long. These programmestypically provide unskilled workers with short-termemployment on public works. They provide incometransfers to poor households during periods when theysuffer on account of absence of opportunities of em-ployment. In areas with high unemployment rates andunder employment, transfer benefits from workfareprogrammes can prevent poverty from worsening,especially during lean periods. Durable assets that theseprogrammes create have the potential to generatesecond-round employment benefits as requisite infra-structure is developed.
4.34 We have a long history and experience in imple-menting wage employment programmes. However,beginning with Jawahar Rojagar Yojana in 1989, theoutreach of these programmes increased significantlyas in the period 1989 to 2006, ultimately culminatingin NREGA. These wage employment programmesimplemented by State Governments with Central as-sistance were self-targeting, and the objective was toprovide enhanced livelihood security, especially ofthose dependent on casual manual labour.
4.35 Based on the experience of these programmesthe NREGA was enacted to reinforce the commitmenttowards livelihood security in rural areas. The Act was
notified on 7 September 2005. The significance ofNREGA lies in the fact that it creates a right basedframework for wage employment programmes andmakes the government legally bound to provide em-ployment to those who seek it. In this way the legisla-tion goes beyond providing a social safety net, andtowards guaranteeing the right to employment. Theexperience with NREGA so far suggests that it is oneof the main planks of rapid poverty reduction in theEleventh Five Year Plan.
4.36 Starting with 200 districts across the country inPhase-I during 2006–07, NREGA was extended toadditional 130 districts in Phase-II during 2007–08.From 1 April 2008 onwards the Act will cover the wholeof rural India. As a district is notified under the Act,Sampoorna Grameen Rozgar Yojana (SGRY) is auto-matically merged in the NREGA and would thereforecease to exist with effect from 1 April 2008.
4.37 The objective of the NREGA is to enhance thelivelihood security of the people in rural areas by guar-anteeing 100 days of wage employment in a financialyear to a rural household whose members volunteerto do unskilled manual work. The Act further aims atcreating durable assets and strengthening the liveli-hood resource base of the rural poor. The choice ofworks suggested in the Act address causes of chronicpoverty like drought, deforestation, soil erosion, etc.,so that the process of employment generation is on asustainable basis.
4.38 Employment is dependent upon the worker ex-ercising the choice to apply for registration, obtain ajob card, and then to seek employment through a writ-ten application for the time and duration chosen byher. The legal guarantee has to be fulfilled within thetime limit prescribed and this mandate is underpinnedby the provision of unemployment allowance. TheAct is thus designed to offer an incentive structureto the States for providing employment as 90% of thecost for employment provided is borne by the Centre,and there is a concomitant disincentive for not pro-viding employment, if demanded, as the States thenbear the double indemnity of unemployment andthe cost of unemployment allowance. Earlier wageemployment programmes were allocation based.
Rapid Poverty Reduction 87
However, NREGA is not supply driven but demanddriven. Resource transfer under NREGA is based onthe demand for employment and this provides anothercritical incentive to States to leverage the Act to meetthe employment needs of the poor. The deliverysystem has been made accountable, as it envisages anAnnual Report on the outcomes of NREGA to be pre-sented by the Central Government to the Parliamentand to the State Legislature by the State Government.
FUNDING4.39 The Central Government bears the costs on thefollowing items:
• The entire cost of wages of unskilled manualworkers.
• 75% of the cost of material, wages of skilled andsemi skilled workers.
• Administrative expenses as may be determinedby the Central Government, which will include,inter alia, the salary and the allowances of theProgramme Officer and his supporting staff andwork site facilities.
• Expenses of the National Employment GuaranteeCouncil.
4.40 The State Government bears the costs on thefollowing items:
• 25% of the cost of material, wages of skilled andsemi skilled workers (as a ratio of 60:40 is to bemaintained for wages of the unskilled manual work-ers and the material, skilled/semi-skilled workers’wages, the State Government has to bear only 25%of the 40% component, which means a contribu-tion of 10% of the expenditure).
• Unemployment allowance payable in case the StateGovernment cannot provide wage employment ontime.
• Administrative expenses of the State EmploymentGuarantee Council.
KEY ISSUES4.41 The key issues that require focus in the EleventhPlan so that NREGA can be optimally realized forsupplementing wage employment opportunities arebriefly highlighted here.
(i) Articulation of Demand for Employment4.42 Since NREGA is a right-based programme, ar-ticulation of demand by the rural poor is the basicpremise of its operation, especially if wage seekers arenot literate and not organized. Generating awarenessamong local rural communities through Information,Education, and Communication becomes critical forenabling the rural poor to articulate demand. Stateshave forged a variety of methods for communicationand social mobilization that include preparation ofcommunication material on NREGA processes insimple local language, one day orientations ofsarpanches/ward members, convening gram sabhas,using district teams for village level interactions, localvernacular newspapers, TV and radio spots, pamphletsand brochures, local cultural forums, informationcounters on local market days, village informationwall, fixing a Rozgar Day in a week, and establishing ahelpline. Full knowledge of the rights that NREGAconfers to the rural poor is the most important pre-requisite to enable them to seek employment as pertheir choice of time and duration.
(ii) Preparing a Labour Budget, Annual Shelfof Projects, and Perspective Plan4.43 The Act guarantees providing employmentwithin 15 days of demand and the instrument for pro-viding employment is unskilled manual work selectedfrom the list of permissible works. This legal guaran-tee has implications for the way in which works haveto be planned. A Labour Budget as stipulated underthe Act is required to be prepared to facilitate advanceplanning, whereby districts estimate their labour de-mand for the ensuing financial year by December-end.The National Guidelines indicate the way in which theannual shelf of projects may be prepared to meet theestimated labour demand. Districts have attempted toprepare shelves of projects to keep a list of works readyto meet employment demand. Greater precision inplanning works has been suggested through assigninga unique location code to each work and mentioningthe plot numbers of the sites where works are to beexecuted. Estimated benefits in terms of person daysneed to be assessed, so that the employment expectedto be generated through the works planned may beclearly matched with the estimated employment de-mand. Physical improvement envisaged (land/water

88 Eleventh Five Year Plan
conservation etc.) has to be quantified so that thefocus remains on creating durable and productiveassets that support further self sustaining employment.Displaying the list of approved works at the GP Officeand the details of works taken up on the work sitehas been stipulated so that the workers know the workopportunities locally available.
4.44 National Guidelines lay down the broad prin-ciples of preparing a Five Year District Perspective Panthat must have the following components viz., villagemapping of natural resources and social infrastruc-ture, identification of gaps and works that can be takenup as per NREGA permissible list, assessment of worksthat respond to what local people want, what will builda livelihood base to enable them to move out ofNREGA to sustainable employment, and assessmentof labour demand.
4.45 The planning capacity of the PRIs and districtlevel functionaries needs to be strengthened to infusethe Plans with a long term vision of sustainable liveli-hoods.
(iii) Record of Work Done and Paymentof Wages4.46 The legal guarantee of the Act mandates thatwages due to workers be paid within 15 days of workcompletion. This requires that a fair record be main-tained for the work done. To ensure that authenticmuster rolls are used, numbered muster rolls are tobe issued for each sanctioned work by ProgrammeOfficer and maintained on the work site by the ex-ecuting agency. Muster rolls must mention Job Cardnumbers of workers, days worked, quantum of workdone, amount paid and must have space for recordinginspections. Muster rolls should be read out on thework site during measurement and wage paymentto prevent bogus records. Entries of the muster rollshould be correspondingly recorded in the job cardsof the workers. Updating of muster roll data at theBlock level computers in a 15-day cycle needs to beensured. Regular measurement and supervision ofworks should be done by qualified technical person-nel on time. There is a need for stricter complianceof all the provisions of the Act so that payment to thelabourers can be made in time.
(iv) Vigilance and Transparency4.47 NREGA places a strong emphasis on vigilanceand transparency. A web enabled management infor-mation systems (MIS) www.nrega.nic.in has beendeveloped that seeks to place all information inpublic domain. It is a household level database andhas internal checks for ensuring consistency and con-formity to normative processes. All critical parametersget monitored in the public domain.
4.48 The field verification of NREGA processes isthrough external and internal agencies and the feed-back is shared with the States for follow up. Indepen-dent concurrent studies have also been taken up.Monitoring at the State level needs to be strengthenedand States are expected to ensure 100% verification atblock, 10% at district, and 2% at the State level espe-cially of works muster rolls, and records. Guidelinesfor muster roll verification have been evolved and needto be rigorously followed. The setting up and traininglocal vigilance and monitoring committees is also re-quired for bringing in lateral transparency.
(v) Public Accountability4.49 The Act contains specific provisions for publicaccountability. This has to be accomplished throughthe provisions made in the Act and guidelines regard-ing Right to Information, proactive disclosure ofinformation, and a transparent social audit process.
4.50 The Right to Information should be followed inboth letter and spirit in all matters relating to NREGAas stipulated in Section 4 and Schedule I, Para 17 ofthe Act.
4.51 The Section 17 of NREGA provides for socialaudit of all works in a GP by the Gram Sabha and theGP has to provide records for social audit. This neces-sitates a need for creating capacity for social auditamong officials, GP members, and the Gram Sabha.A significant feature here is the active role played bycivil society organizations in facilitating social auditprocesses in partnership with State Government aswell as independently.
(vi) Grievance Redressal4.52 Enforcement of the right to employment requires

Rapid Poverty Reduction 89
setting up an effective grievance redressal system. TheAct vests the responsibility for grievance redressalwith the Programme Officer. To ensure prompt griev-ance redressal certain basic arrangements must beensured, such as setting up a grievance redressalcell at the Programme Officer/District ProgrammeCo-ordinator (DPC) offices, preferably with a tollfree helpline. The Programme Officer and DPC mustreview the disposal of complaints on a monthly basisand the persons concerned must be informed.
(vii) Strengthening Administrative Systems4.53 Technical Resource Support Groups are requiredto bring in multidisciplinary professional expertise inMoRD, to provide resource support in critical areas,inter alia, assisting the Ministry in formulating andcodifying standard operating procedures for settingmeasurable outcomes, for laying down standards ofprogramme delivery, for designing appropriate man-agement information systems (MIS) for monitoringprogramme outcomes. They would also carry outtraining needs assessment for capacity building atthe State, district, and sub-district level and formulatethe framework for training and capacity building atvarious levels.
4.54 Another issue critical to strengthening adminis-trative systems pertains to training of different stake-holders. The requirements of training are considerableat all levels and include functionaries, PRIs and thelocal vigilance committees. The challenge is to designtraining programmes calibrated in content andprocess according to different target groups and tomanage large scale training needs without compro-mise on quality.
(viii) Financial Management4.55 A non-lapsable Central Employment GuaranteeFund has been set up to ensure that availability of fundsmatch working season demands. Districts have dedi-cated accounts for NREGA funds and submit theirproposals based on clearly delineated guidelines so thatfunds may be devolved efficiently at each level, andadequate funds may be available to respond to demand.
4.56 The funds are released on the basis of demandfor employment received in a district and are based on
an appraisal of both financial and physical indicatorsof outcomes. To meet the norms for fund release,districts need to strengthen their capacity for both pre-paring a Labour Budget to project an annual require-ment of funds based on an estimation of labourdemand, and undertake rigorous monitoring of fundsspent and the physical outcomes to track current trendsof employment generation, so that adequate funds canbe demanded and deployed efficiently.
ROAD AHEAD
(i) Empowering Workers4.57 NREGA is a right-based statute and its effective-ness lies eventually in the extent to which wage seekerscan exercise their choice and assert their rights to claimentitlements under the Act. The issues involved inempowering workers are in the range of enhancementof knowledge levels, development of literacy skills,organizing workers, and enhancing social securitylevels of workers. Opening savings accounts of work-ers’ in banks and post offices that has been initiatedneeds to be supported on a larger scale so that thriftand small savings can be encouraged among workers.The inclusion of NREGA workers under the cover ofvarious life and health insurance schemes will also raisetheir security thresholds.
(ii) Linkages with Other DevelopmentProgrammes4.58 Empowerment of workers and creation of du-rable assets depend to a great extent on the linkagesbetween NREGA and other development programmes.Linkages with human development programmes suchas National Rural Health Mission (NRHM), NationalMission for Literacy and Elementary Education, andother livelihood and infrastructure initiatives areneeded to ensure basic human entitlements to theworkers and to strengthen the natural resource baseof livelihoods. The full potential of the kind of workspermissible under NREGA can be tapped if planningfor these works is coordinated with other developmentprojects, for example watershed management, agricul-tural pro-grammes, horticultural projects, etc. Initia-tives for NRM also need to be dovetailed with incomegeneration projects to enable workers to move fromwage employment to self-sustaining employment.

90 Eleventh Five Year Plan
(iii) Exploring the Possibility of Other Works4.59 The list of permissible works under NREGArecognizes the possibility of a need arising for worksother than those specifically indicated in ScheduleI which may be notified by the Central Ministry inconsultation with the States. The Ministry mayconsider formulating guidelines for the States thatmay enable them to identify other works in confor-mity with the general principles of the Act and therationale for them.
4.60 The allocation for the Eleventh Plan (at currentprice) is tentatively provided at Rs 100000 crore. How-ever, since NREGA is a demand driven programmeand the government is legally bound to provideemployment mandated under the act, this figure isonly indicative.
SELF-EMPLOYMENT—SWARNJAYANTI GRAMSWAROZGAR YOJANA (SGSY)
Rationale4.61 Persistent efforts made by the government tofine-tune the self employment programmes duringvarious Plan periods, especially oriented towardsimproving the implementation quality, yielded somenew concepts that emerged at various times andgot consolidated. The need to integrate the clusterapproach, capacity building, skill upgradation, infra-structure including marketing development and tech-nology penetration were felt more acutely with everypassing year. Emphasis also was necessary to be laidon micro enterprise development with effective for-ward and backward linkages, so as to ensure bestreturns on the investment. Therefore, the SGSY waslaunched with effect from 1 April 1999 to bring theassisted poor families above the poverty line by ensur-ing appreciable sustained level of income over aperiod of time. This objective was to be achievedby organizing the rural poor into SHGs through theprocess of social mobilization, their training andcapacity building and provision of income generatingassets. The SHG approach helps the poor to build theirself-confidence through community action. Groupprocesses and collective decision were to enable themin the identification and prioritization of their needsand resources. This process would ultimately lead to
the strengthening and socio-economic empowermentof the rural poor as well as improve their collectivebargaining power.
4.62 The SGSY is, by design, meant to create wide-spread income generating activities, through the em-powering mechanism of SHGs, where group dynamicsare expected to compensate for the basic weaknessesof the individual rural poor and present them as creditworthy and financially accountable units. The systemof grading the SHGs through a rigorous process isexpected to separate the more vibrant of the SHGs andeventually give them a capital subsidy assistance so thatthey undertake self-employment oriented livelihoodopportunities.
4.63 The SGSY scheme has been successful in deliver-ing the outcomes in terms of poverty alleviationwherever capacity building and beneficiary mobiliza-tion have been carried out. Thrift, multiple lending,participatory process of identification, and pursuitof economic activities have succeeded in States likeAndhra Pradesh, Tamil Nadu, and Kerala substantiallybecause the basic processes had been grounded.
4.64 The higher performance parameter of multiplelending and increased quantum of lending have beenachieved in States like Andhra Pradesh due to theSHGs having been federated at different levels fromthe village to the district. With the emergence of a wellfederated organizational base, the SHG network hasbeen observed to acquire dynamism and versatility inactivities in States like Kerala and Andhra Pradesh.There have been diverse models of Self Help in vari-ous parts of the country, most important amongthem being the Kudumbashree in Kerala with activelinkages with the PRIs, and the AP model that relieson the fulcrum of federations of SHGs that have growninto organizations of the poor. The NABARD alsosponsors SHGs.
Key Issues4.65 The SGSY is being implemented since 1999. Closeto 2.6 million SHGs have been formed under the SGSYsince its inception. Of these SHGs 16 lakh have alreadycrossed the Grade-I stage. About 8 lakh SHGs havepassed the Grade-II stage and of them, slightly less than
Rapid Poverty Reduction 91
five lakh SHGs have taken up economic activities.About 60% of the Grade-II SHGs have taken upeconomic activities, the balance number waiting forfinancial assistance. Of the nearly Rs 25000 crore creditflow targeted under the programme, less than 50% hasbeen achieved. SHGs have several in-built strengths,most of which are intangible, such as group cohesion,enhanced ability for articulation of common demands,better and efficient use of available local resources, etc.While it would be necessary to work on the strengthsof the SHGs, it is equally necessary to learn the lessonsfrom the experience of implementing the SGSY overthe past eight years. There are several issues—someconceptual ones pertaining to larger aspects of theprogramme, such as the role and utility of the subsidycomponent, and some programme specific secondgeneration issues such as forming federations, provi-sion of interest subsidy, social mobilization issues,etc. Some such issues are highlighted below:
• Diverse views are being expressed in various quar-ters about the relevance or otherwise of subsidy-driven programmes. A rational response would haveto be found for such positions. Subsidy is a form ofsupport to the poor and stopping it entirely wouldbe unwarranted. However, the idea of directing thesubsidy flows properly and to examine if there wasany case for putting conditionalities to the systemof subsidy flow so that the targeted populations arebetter served, merits examination.
• The number of SHGs formed under the SGSY is verylarge, but there is a feeling about whether such largenumbers mean anything from the point of viewof poverty alleviation. Agencies such as NABARD,Small Industries Development Bank of India(SIDBI), and Rashtriya Mahila Kosh (RMK), andMinistries such as Women and Child Developmenthave their own models of SHG formation and theirsustenance. Some State Governments such as AndhraPradesh and Kerala have their own models. There istherefore, a need for placing the SGSY programmeon this large canvas and fitting it in the broadercontext of the SHG movement of the country.
• There is tremendous shortage of manpower in thearea of technical support for rural development.Andhra Pradesh continually engages about 6.00lakh SHGs through a separate structure, Society
for the Elimination of Rural Poverty that has inde-pendent units that deal with Risk Mitigation, FoodSecurity, Micro Finance, Institution Building,Marketing, and Livelihood Promotion. At the dis-trict level too they have equivalent units that go uptothe Mandal level. The dedicated institutionalmachinery seems to have made a difference. Thereis a case for similar efforts from other States as well.
• Going by the experience of the States like AndhraPradesh, Kerala, and Tamil Nadu, federating theSHGs appears essential for improving the bargain-ing power of the SHGs and better sustainability ofthe SHG movement. Encouraging the inter-state,inter-district networking of the SHGs/SHG Federa-tions for marketing of the SHG products would bethe next step. Current institutional arrangementsfor social mobilization and livelihood generationare somewhat limited in scope. Therefore, a mis-sion mode approach to enhance facilitation, insti-tutional building, and hand holding support to SHGmovement is required over a long period of time tosecure sustainability of SHGs and their apex orga-nizations. The social mobilization aspect of theSGSY programme has hitherto not been given dueattention. Social mobilization is both a means andan end in itself. Expansion of political rights of themobilized poor will have tremendous intrinsicvalue, not always measurable. A few of the SHGsthat acquire the characteristics of good entrepre-neurs may be encouraged to become entrepreneurs.SGSY is actually lagging behind in keeping pace withthe SHG movement sweeping the country.
• Credit is a very important issue. It would be neces-sary to enhance the credit flow to the SHGs in amore creative manner than what has been possibleso far. The credit achievement, in terms of the totalvolume as well as the rate of flow, in Andhra Pradeshmodel seems to be much higher than the nationalachievement. An issue that requires to be looked intois also the possibility of introducing interest sub-sidy as an alternative to the capital subsidy. Thereare no two opinions about the utility of financialintermediation for making the lending under theprogramme cost effective for the banks. Federationsof SHGs having their own corpus can work as in-termediaries. An investment on making the SHGscredit-worthy cannot be wished away. In terms of

92 Eleventh Five Year Plan
priority, saving followed by risk mitigation and thencredit would be the natural sequence for financialintervention. Federations acting as financial inter-mediaries is a high skill activity and it is essentialthat investments are made on enhancing the skillbase of the Federations. There is a need to promoteinstitutional partnerships between the SHGs/Fed-erations with the bankers. Enhancing the credit flowto the poor may call for grounding several strate-gies and partnerships and not just one. The coun-try is also on the threshold of a major initiative formicro finance. Again, there are diverse views onthe role, utility, and relevance of micro finance inpoverty alleviation. The issue of harmonizing theSGSY and the micro finance models also requiresto be looked at.
• New areas are emerging in view of the changes inthe economy due to liberalization, privatization, andglobalization. It may not be possible for the SGSY, apure self-employment programme to capture all theaspects of poverty. Purely from a family’s economicsecurity point of view, BPL families might want tohave at least one wage earner among them, so as toprovide the requisite certainty to their family in-comes. In such a situation there may be a case forintroducing a placement-oriented skill enhance-ment model for youth as a sub-set of the SGSY.This programme will be a hybrid of the wage-employment and self-employment programmes.
• Special projects of the SGSY, that were expected toground innovative and alternative ways of reducingpoverty do not seem to have actually made muchdifference. The higher quantum of subsidy availablethrough special projects appeared to have drivenlarge number of projects. Often activities proposedare eligible to be funded by different schemes of theline departments of the concerned sectors. Even thenfunds are sought in the project proposals throughspecial projects. States and other agencies follow upproposals vigorously till the sanction of the projectand thereafter virtually no monitoring of projectsseemed to have been undertaken. Of the 231 specialprojects that have already been sanctioned, onlyabout 29 have been completed. Due to the indiffer-ent performance it does not appear that there is acase for continuing with the special project compo-nent under the SGSY. There have been very wide
inequities in the sanction of special projects amongthe States so far.
THE WAY FORWARD—STRATEGY FOR THEELEVENTH PLAN4.66 Eleventh Plan strategy for SGSY would have tonecessarily take the best out of what has evolved in theSelf Help movement across the country over the lastfew years and integrate it with the programme. Like-wise a few aspects of the SGSY programme that havefailed to give the desired results require a fresh lookand if necessary, dropped.
4.67 One of the most important aspects that requiresexamination is the institutional mechanism that hadbeen erected to undertake the poverty alleviationprogrammes. The District Rural Development Agency(DRDAs) in their current form and content do notappear to have the requisite wherewithal to handle acomplex issue such as poverty. The current adminis-trative setup at the national level is unequal to a largetask such as poverty elimination across the geographi-cal and social complexity and it requires a differentorder of involvement of the MoRD. It is therefore,necessary to set up a National Agency outside the min-istry to manage the National Rural Poverty Elimina-tion Programme to achieve the objectives of theprogramme meaningfully and comprehensively.The need for setting up a national level agency with aflexible administrative structure, for better planning,organizing, and coordinating the poverty eliminationeffort cannot be overstated. The national level organi-zation will be the intellectual backbone and providerequisite technical expertise and capacities, while theones at the level of the State Governments will be thefunctional bodies. These organizations would haveto be manned by people with an active commitmentto poverty alleviation as well as an undertaking fromthe States to assure minimum tenures to the officialsprior to making any funding arrangements, if neces-sary, through a MoU. The administrative set-up couldessentially be a society attached to the MoRD. Thenational organization will co-ordinate with the pov-erty elimination agencies established by the StateGovernments for implementing the SGSY in its revisedform. It will also be the agency to document and bethe clearing house for the best practices with respect
Rapid Poverty Reduction 93
to the poverty elimination programmes and strategiesof the country. It should devolve funds to the StateGovernments based on rational formulae, evolvingand working out the MoUs with the State Governmentsfor the implementation of the poverty eliminationprogrammes. The national and State level organiza-tions so created will systematically address the keysubjects of poverty alleviation like livelihood genera-tion, capacity building, skill upgradation, credit, andinternational assistance .
4.68 Considering the experiences and lessons learntfrom various development projects, the revised SGSYprogramme should aim at promoting and strength-ening member-owned, member-controlled, and mem-ber-managed institutions of the poor that enable themto secure sustainable livelihoods and better quality oflife. These institutions should provide a wide range ofservices to their members as per their demand. Therevised SGSY should promote and nurture a large cadreof activists and leaders from the poor for providingsupport services to the institutions of the poor on asustainable basis. The approach for organizing the poorstems from the conviction that there is an immensedesire and latent capability among the poor to comeout of poverty. They have a tremendous potential tohelp themselves and the potential of each member canbe harnessed by organizing them. Social mobilizationenables the poor to build their own organizations inwhich they participate fully and directly and take de-cisions on all issues concerning poverty elimination.
4.69 The current mechanism of fund flow to the SHGsthrough a graded system requires a comprehensivereview. The current scheme allows a Revolving Fundentitlement of upto Rs 10000 for the Grade-I SHGs,that will also entitle them to draw cash credit from afinancial institution. The rate of attrition betweenthe Grade-I and II indicates that a large number ofSHGs fizzle out mid-way after availing the RevolvingFund. Further, the SHGs that have cleared the Grade-II stage seem to wait for long periods before getting anopportunity to avail the subsidy assistance. Close to 3lakh such SHGs are waiting in the wings for suchassistance. The overall credit achievement under theprogramme is abysmally low. The overall credit tar-gets are achieved only by about 50%. More importantly
in a capital subsidy mechanism there is little scope toleverage higher credit flow because of the subsidyentitlements. The volume of credit extended to SHGsin one State, Andhra Pradesh, alone is higher than thenational credit achievement under the SGSY. This callsfor serious scrutiny.
4.70 The SHGs can be further strengthened and sta-bilized by federating them at, say village or cluster ofvillages or block level depending upon the number ofSHGs and their spatial distribution. The federationsshall be formal organizations registered under the mostappropriate Acts (Societies Registration Act, StateCooperative Act, Trust, Mutually Aided CooperativeSocieties Act, or Mutual Benefit Trust) that exist in theState. The second tier of Institution Building phase isthe federation of SHGs either at village or at cluster ofvillages’ level. The Village Level Federations (VLFs) arevital for demonstrating solidarity, initiating collectiveaction on various poverty related issues and reducingdependency on the external agency for information,technical support and resolving conflicts. The VLFsprovide a forum to voice the problems of the poor inthe village, exchange of experiences including flow ofinformation from various government departments,and raises resources required to take up the appropri-ate development interventions in poverty reduction.It generates income by collecting share capital, mem-bership fee, savings, interest margins and penalties, andbecome financially sustainable in a period of 3–4 years.Based on the proposals of the VLFs, the district levelagency sanctions fund for on-lending to SHGs. Oncethe VLFs attain a certain level of maturity, the BlockLevel Federation is promoted. The Block Level Fed-eration provides solidarity to all the VLFs and SHGs.It plays a vital role in bringing all the BPL families intothe SHG fold, building the capacities of the SHGsand VLFs, framing required policies and ensuring thequality of institutions, etc.
4.71 However, in order to strengthen the existingprogramme an effort should be made to graduate theallocations in such a manner that all further increasesin the allocations to the SGSY should be based on de-mand-driven model, with attendant commitmentsof the State with respect to erecting institutions ofthe poor, dedicated implementation machinery and
94 Eleventh Five Year Plan
adhering to the framework provided by the nationallevel agency. The current allocations to the SGSYcan taper off over the balance Plan period so that atthe end of the Plan period the new model will be firmlyin place.
4.72 To capture the opportunities that are emergingin the economy due to the processes of globalizationand liberalization, it will be necessary to launch a newsub-set of the SGSY—that can be known as the place-ment-linked skill enhancement programme. TheMinistry’s experience of the Reddy’s Labs initiative ofthe SGSY and more recently with the InfrastructureLeasing and Financial Services (IL&FS), are worthymodels for institutionalization and systemic action.The sectors that can be looked at are Textiles, Leather,Gems and Jewellery, Retail Chains, etc., where there isa shortage of supply of trained labour. Skill forma-tion, by use of in-house programmes, evolving spe-cific curriculum, independent accreditation, andplacement are the essential components of this pro-cess. It is suggested that a definite component of theskills programme be included in the revised SGSYprogramme.
RURAL HOUSING FOR THE HOUSELESS4.73 Housing is a basic human need. A roof over herhead endows a shelterless person with an essential as-set and improves her physical and mental well-being.
4.74 The importance of housing has been acknowl-edged and housing as a human right was recognizedway back by the Universal Declaration of HumanRights adopted by the General Assembly of the UnitedNations on 10 December 1948. Article 25 of thisdeclaration states: ‘Everyone has the right to standardof living adequate for the health and well being ofhimself, and his family, including food, clothing,housing. . . .’
4.75 Article 11 of the International Covenant onEconomic, Social and Cultural Rights, 1966 also re-quired the States Parties to the Covenant to recognizethe right of everyone to an adequate standard ofliving for herself and her family, including adequatefood, clothing, and housing and to the continuousimprovement of living conditions. It further asked the
States Parties to take appropriate steps to ensure therealization of this right.
4.76 India also embarked on the path of making‘housing for all’ a reality. The conference of ChiefMinisters, 1996 recommended the Basic MinimumServices (BMS) Programme. One of the seven BMSrequiring priority attention was ‘Provision of PublicHousing Assistance to all shelterless poor families’.Consequently, the BMS programme became part ofNinth Five Year Plan and concerted efforts in afocused manner were initiated to make these basicservices accessible to every one. Later, the NationalHousing and Habitat Policy, 1998 stated that theultimate goal of the policy was to ensure ‘Shelter to all’and better quality of life for all citizens.
INDIRA AWAAS YOJANA (IAY)4.77 Though the earliest housing programme takenup by the GoI was for rehabilitation of refugeesimmediately after the partition of the country, thegovernment started implementing its major housingscheme of IAY as an independent scheme only from1 January 1996.
4.78 In the present form, IAY is one of the verypopular schemes of the MoRD and has caught theimagination of the rural people. The popularity canbe attributed to the fact that the scheme enablesbeneficiaries to participate and involve themselvesin construction of their home. The role of the StateGovernment is confined to mere facilitating use oflocal, low cost, environment-friendly, and disaster-resistant technology and also in encouraging construc-tion of sanitary latrine and smokeless chulha. There isno prescribed design or technology and no contrac-tors are involved. Funds are released in installmentsdirectly to the beneficiaries and there is no creditportion as part of the assistance which enable timelyrelease of funds. The beneficiaries construct the housesas per their own choice of design, technology, andrequirement. Not surprisingly, evaluation studiesreveal high levels of occupancy and satisfaction.
4.79 In spite of criticism from certain quarters aboutIAY being a full subsidy scheme, experience reveals thathouses get completed more or less on time which may

Rapid Poverty Reduction 95
not have been the case if credit was part of the assis-tance. Moreover the unit assistance of Rs 25000 perdwelling in the plain areas and Rs 27500 in the tribaland hilly areas is not adequate and beneficiaries haveto contribute at least by way of their own labour forcompletion of the house. This participation makes thescheme even more meaningful.
4.80 The funds for the IAY scheme are shared betweenthe Central and the State Government in the ratioof 75:25. The Central budget is allocated to the Statesbased on a 75% weightage to housing shortage and25% weightage to poverty ratio. Similarly the districtallocation is based on a 75% weightage to housingshortage and 25% to the share of SC/ST population.To introduce transparency, the selection of beneficia-ries which was being done through the gram sabhas isnow expected to be from the permanent IAY waitlists.These lists are prepared based on the ranking givento families as part of the BPL Census 2002. Further,60% of the IAY funds are earmarked for SC/STs, 3%for persons with disability, and 15% for minorities. Itis expected that all houses will be sanctioned in thename of women or jointly with the husband. Theseprovisions have enabled effective targeting of theweaker sections and the scheme has succeeded inempowering the poorest.
ADEQUACY OF HOUSES AND TACKLINGSHELTERLESSNESS4.81 Based on building materials used for construc-tion of structure, houses have been classified as perCensus 2001 as pucca houses (the walls and roof ofwhich are made of permanent materials), semi-puccahouses (either the wall or the roof is made of perma-nent material and the other is made of temporarymaterial), temporary house (both walls and roof aremade of materials which have to be replaced fre-quently), serviceable temporary houses (wall is madeof mud, unburnt bricks, or wood), and non-service-able temporary houses (wall is made of grass, thatch,bamboo, plastic etc).
4.82 Trends indicate that share of pucca houses hasincreased. However, kutcha houses account for 26.5million, and the next important cause of shortage iscongestion (10.18 million houses).
4.83 For the Eleventh Plan, however, focus could beon targeting the poorest of the poor as far as IAY isconcerned while targeting the remaining shortage withother interventions. Hence for the purpose of IAY theshortage emerging due to factors of (i) houseless,and (ii) unserviceable kutcha house could be tackled.With these factors, the estimate of housing shortagefor 2001 stands at 148.6 lakh houses and for 2007 at159.5 lakh houses. Hence a target of constructing about150 lakh houses under IAY needs to be fixed for theEleventh Plan.
KEY ISSUES AND STRATEGIC INTERVENTIONS
IAY
(i)Selection of Beneficiaries4.84 Though selection had to be done by the gramsabhas, studies have revealed that 25% to 50% of thebeneficiaries are not being selected through the gramsabhas. Further, the selection as well as allocationamong Panchayats has been influenced by the PRIs/MLAs. The vocal and active segments of beneficiariesinfluence the selection process because of the limitedallotment under IAY. In the process, the poorest amongBPL households are left out, and non-BPL familiesalso get selected for the IAY houses. Besides, collec-tion of illegal gratification of selection by PRIs is acommon complaint often heard at the field level,as brought to light by the several studies. Moreover,only beneficiaries who have house-sites are selectedand thus, the very poor who do not have a plot ofland get out from the purview of the scheme. This is aserious problem, since these are the people who arethe most vulnerable. Some 8 million of the 14 millionhouseless are actually those who have no land, orlive on homes located on land belonging to others(e.g., landlords, public land, etc.). The focus of theIAY programme must be on the houseless (e.g., suchcommunities as the Saharyas, Musahars, the so calledde-notified tribes, those living on canal bunds or roads,and other such who are seen to be at the bottom of thesocial ladder.
4.85 A more accurate targeting may result by thepreparation of permanent IAY waitlists. These waitlistshave to be based on scores given to families as part of

96 Eleventh Five Year Plan
BPL Census 2002. This can bring about more trans-parency and tackle the problem of illegal gratification.Regarding provision of plots and homesteads for thelandless both State Government and Panchayats haveto be encouraged to play a major role. State govern-ment need to be incentivized and Panchayats have tobe appropriately empowered.
(ii) Adequacy of Unit Cost4.86 Inadequacy of cash assistance for constructionhas resulted in poor quality of house, non-fulfillmentof requirements of the disaster-prone areas, and debttrap on account of the beneficiaries having to borrowfunds to complete the construction of a pucca house.Several examples have been reported of poor qualityof construction, sagging foundation, use of temporarymaterials for roofing or leaving the construction in-complete because of inadequate finance. Even aftercontributing their labour and borrowing from localsources, a significant number of families are not ableto complete the house in all respects, and most housesremain without plastering or flooring.
4.87 There is an urgent need to increase the unit costfrom the present level of Rs 25000 for plain areas andRs 27500 for hilly areas.
(iii) Structural Facilities and Provision ofInfrastructure4.88 Studies have revealed that only about 50% of IAYhouses have sanitary latrines and even a lesser percent-age have installed smokeless chullas. This is a seriousproblem. Over a million women and children not onlysuffer from upper respiratory tract infections due toinhaling of indoor smoke but many die as a result.In addition, India is one of the countries in the worldwith much of its population not having access to sani-tary means of excreta disposal (despite the existence ofTSC, another CSS, which is part of the Bharat Nirmanset of pro-grammes). Houses built as part of theCentral Government’s own programmes, like IAY,need to succeed in building of smokeless chulhas andof sanitary latrines.
4.89 The quality of life may not improve despitethe construction of new houses unless there is provi-sion for infrastructure. There is a need to provide a
minimum level of infrastructure such as internal road,drainage, water supply stand post, along with the pro-vision of houses by way of convergence of schemes.
(iv) Ownership Issues4.90 It is found that the title of the house site tends tobe in the name of the male member of the household.Hence the benefit to accrue to women by allotment ofthe scheme is restricted only for the purpose of thescheme sanction. Some effort to ensure clear cut own-ership in the name of women needs to be made.
OTHER STRATEGIC INTERVENTIONS4.91 Other than the IAY, the States have rural houseconstruction programmes usually targeting the poor.While IAY can focus on eliminating the backlog ofhouselessness and temporary and unserviceable housesin rural India, the States should take responsibility foraddressing any emerging needs. It is necessary to havethe right kind of interventions so that the programmeobjective of tackling shelterlessness is achieved withinthe target time. Hence, the following strategic inter-ventions are suggested:
• Encourage primary lending institutions to enhancetheir credit flow to the rural population and activelyinvolve the existing institutional mechanisms ofSHGs and micro finance institutions to extend loansto the rural population.
• Encourage new, flexible financial products throughcommercial banks geared to payback cycles ofrural families to bring about a higher degree of in-clusivity in institutional lending for rural housing.
• Encourage small and medium developers to takeup housing in rural areas through a mix of fiscalincentives and business volumes after necessaryenvironment and social impact assessments andclearances from the PRIs.
• Create institutional mechanisms to address thehigher risk perception in rural areas.
• Consider housing at par with rural infrastructureas far as funding and concessions are concerned, inorder to encourage investments in the sector.
4.92 Based on the aforementioned multidimensionalapproach and strategic interventions, specific initia-tives can be taken up, as listed below.

Rapid Poverty Reduction 97
• The IAY funds are being released directly to DRDAsfor further disbursement. But it has been observedthat there is no uniformity in disbursing the amountto the beneficiaries. To streamline the process aswell as also speedy disbursement to the beneficia-ries which may also speed up physical progress,implementing agencies of IAY at district levelmay be advised to disburse the amount directlyto beneficiaries by depositing in bank accounts asfar as possible.
• To ensure transparency and fair selection ofbeneficiaries, all State Governments have eitherfinalized or are in the process of finalizing perma-nent IAY waitlist in such a manner that the poorestof the poor get the top slot. Further, implementingagencies should introduce the system of socialaudit to ensure proper utilization of funds and tomake the system leakage proof. In addition to thisthe database of the IAY beneficiaries may also beprepared by the States and put on the website forinformation of IAY beneficiaries.
• It is gratifying to note that many State Governmentsare already implementing State-run schemes tosupplement the efforts of the Central Governmentto provide houses to the poor. Still the gap betweenthe demand and supply is huge. Hence to cover upthe shortage of houses for the rural poor, theStates which do not have State-run schemes may beincentivized to have their own State-run schemes.
• Even though 164.00 lakh houses have beenconstructed under IAY till date to provide shelterto the poor, still the poorest of the poor may fail totake benefit under the scheme because of their be-ing landless people in the rural areas. To ensure so-cial and economic equity, it is necessary to reachout to these people. State should acquire land anddistribute homestead plots. Funds for this may beprovided by the government.
NATIONAL RURAL HOUSING CONSORTIUM4.93 A consortium could be created comprising nodalorganizations such as National Housing Bank (NHB),NABARD, nationalized and premier commercialbanks and apex microfinance institutions to provideequity and debt for rural housing for small andmarginal farmers, small village artisans, self employed,etc. MoRD could play the role of a Key Facilitator.
INCENTIVIZING LENDING INSTITUTIONS4.94 Presently, Housing Finance Companies (HFCs)registered with NHB are allowed to create a SpecialReserve to the extent of 40% income earned throughlong term mortgage financing (mortgage loans formore than 5 years) under Section 36(1) (vii) of theIT Act. This fiscal incentive is, however, not availableto banks, who are presently the leaders in the housingfinance market. At present, the rural housing loanportfolios of banks and HFCs, comprise only 10–12%of their total housing loans. There is need to incentivizethese institutions to increase their lending in ruralareas. It is, therefore, proposed that the limit underthis provision should be increased from the presentlevel of 40% to 60% for HFCs, banks, and NHB.The additional 20% provisions will exclusively befor lending in rural areas. It is proposed that banksmay also be allowed to create the Special Reserves onthe lines of HFCs for long term mortgage financingin rural areas. This will encourage banks and HFCsto aggressively lend for housing in rural areas. SHGsand micro finance institutions (MFIs)could also beencouraged to be actively involved in extending hous-ing loans.
ROLE OF HUDCO4.95 Housing Urban Development Corporation(HUDCO) started its rural housing activity from1977–78 by extending assistance for construction/upgradation of rural houses. As part of its commit-ment to rural housing, HUDCO makes availablefinancial assistance to State Governments and theiragencies like Housing Boards, District Taluka, andPanchayat Development Boards nominated by theState Government for undertaking housing schemeswith its assistance.
4.96 HUDCO’s normal rural housing programme byand large caters to Economically Weaker Sections(EWS) (with a monthly household income less thanRs 2500). In rural areas, the three types of schemesfinanced by HUDCO include:
(i) EWS rural housing schemes for landless persons,(ii) EWS rural housing schemes for land owning per-
sons and,(iii) The village abadi scheme including house repair.

98 Eleventh Five Year Plan
4.97 Under the first two schemes, the cost ceiling perdwelling unit is Rs 60000. The maximum extent offinance is 90% of the project cost or Rs 40000, which-ever is less. Under the first scheme HUDCO supple-ments effort of State Governments to provide freehouse sites by extending loans at low interest rates.The third scheme envisages improvement of existinghouses as well as environmental improvement of sur-rounding areas by providing for sanitation, drainage,water supply, link roads, etc. Most of the HUDCO’ssanctions pertain to the second scheme.
4.98 Over the last 28 years, HUDCO has sanctioned2472 schemes with a loan amount of Rs 5807 crore forconstruction of 86.11 lakh dwelling units in variousStates in the country (as on 31 March 2006). There isan urgent need to strengthen the role of HUDCO andprovision of its services to enhance constructionactivity in rural areas, especially to cater to EWS.
4.99 The allocation for the Eleventh Five Year Plan(at current price) is tentatively provided at Rs 26882crore.
SOCIAL PROTECTION—NATIONAL SOCIALASSISTANCE PROGRAMME (NSAP) ANDASSOCIATED PROGRAMMES4.100 The Constitution of India (Article 41) states:‘The State shall, within the limits of its economiccapacity and development, make effective provisionfor securing the right to work, to education and topublic assistance in cases of unemployment, old age,sickness and disablement, and in other cases of unde-served want’. Social protection refers to public assis-tance in all cases of underserved want. It provideshuman security to the poor and the destitute.
4.101 For the first time in India, the NSAP waslaunched on 15 August 1995. The basic aim of thisprogramme was to provide social assistance benefit tothe rural poor in case of old age, death of primarybreadwinner, and for poor women during maternity.It aims at providing them with a modicum of dignityand support, thereby ensuring a minimum quality ofcare and attention from the community. It provides anopportunity for linking the social assistance packageto schemes for poverty alleviation and provision of
basic needs. It was a CSS with 100% Central assistanceprovided to States/UTs. This programme is imple-mented through a synergistic partnership with StateGovernments and under the direct supervision ofDRDAs in close collaboration with the various PRIs.This programme included three schemes viz., NationalOld Age Pension Scheme (NOAPS), National FamilyBenefit Scheme (NFBS), and National MaternityBenefit Scheme (NMBS).
• Under NOAPS, old age pension of Rs 75 per monthwas provided to persons of 65 years and above whoare destitute. This amount has since been enhancedto Rs 200 per month from the year 2006–07. Theresponse for this scheme has been overwhelmingfrom the poor as well as the State Governments.Many States are matching these pension amountsequally and many more are extending the coverageof this scheme to all those identified from amongBPL families.
• The NFBS provides a lump sum family benefit ofRs 10000 to the bereaved household in case of thedeath (natural or accidental) of the primary bread-winner (male or female) whose earnings contrib-ute substantially to the total household income.This scheme is applicable to all the eligible personsin the age group 18 to 64. The bereaved householdshould belong to BPL families to qualify for thisbenefit.
• Under the NMBS there is a provision for paymentof Rs 500 per pregnancy to women belonging topoor households for pre-natal and post-natalmaternity care upto the first two live births. Thisbenefit is provided to eligible women of 19 yearsand above. The objective of the scheme is to extendfinancial assistance to pregnant women from BPLhouseholds, for the first two live births. To ensurebetter linkage with nutrition and national popula-tion control program-mes, NMBS was transferredto Department of Family Welfare and is renamedas Janani Suraksha Yojana in 2001–02. It is now partof the NRHM.
4.102 On the recommendations of the Group ofMinisters (GoM) a new scheme called Annapurna waslaunched on 1 April 2000 as a CSS. It aims to provid-ing food security to meet the requirement of those

Rapid Poverty Reduction 99
senior citizens who though eligible, have remaineduncovered under the NOAPS. Under the Annapurnascheme the beneficiaries should be 65 years or aboveand must be destitute. The beneficiaries are entitled to10 kg of food grains per month free of cost. The ceil-ing on the total number of Annapurna beneficiarieswill be at least 20% of the persons eligible to receivepension under NOAPS.
4.103 These schemes continued to be administered bythe MoRD upto 2001–02 as CSS, and during 2002–03these schemes were transferred to Central Assistancefor State Plans on the recommendation of the NationalDevelopment Council (NDC) with the requisite flex-ibility in the choice of implementation.
KEY ISSUES4.104 Various studies conducted in respect of theNOAPS indicate that the criteria of destitution are dif-ficult to apply. Many States have adopted the povertyline itself to define destitution. This is, in fact, reason-able since a BPL family can hardly support itself andwould not be in a position to support the aged. There-fore, the NOAPS has now been extended to all oldpersons above 65 years of age in BPL families witheffect from 2007–08. Consequently the AnnapurnaScheme which provides 10 kg of foodgrains to seniorcitizens uncovered under NOAPS would be discon-tinued soon after these beneficiaries are coveredunder NOAPS.
4.105 The National Policy for Older Persons, 1999 rec-ognizes that a person becomes a senior citizen at theage of 60 and would be eligible for the facilities andconcessions available to senior citizens. Indeed, theaged over 60 years, from among the poor families, canhardly participate in the workforce and support givento them will be more useful when above 60 years, thanif given only after 65 years. Therefore, the scheme ofNOAPS needs to be made applicable to persons of theage of 60 years or more.
4.106 The rate of pension under NOAPS has recentlybeen enhanced to Rs 200 per month. The State Gov-ernments have been urged to top it up with anotherRs 200 so that every pensioner would get a minimumof Rs 400 per month. Currently, ten States/UTs are
already providing an additionality of Rs 200 per monthor even more. Other States need to be encouragedto supplement the Central Government’s Old AgePension, so that a minimum of Rs 400 per month isprovided to the deserving aged.
4.107 NSAP requires to be extended to two more cat-egories of deserving poor in dire need of this assis-tance viz., persons with severe/multiple disabilities andwidowed women. Similarly, national schemes formaintenance of orphans, street children, and othersections of the poor in distress are needed.
4.108 The scope of the NFBS needs to be extended tocover instances of death of any adult member of thefamily without limiting to the death of breadwinner.
4.109 At present, there are two life insurance schemesoperated by Life Insurance Corporation (LIC) thatare making headway among the people below andmarginally above the poverty line viz., ‘JanashreeBima Yojana’ for the rural poor and the ‘Aam AadmiInsurance Scheme’ for the landless agricultural labour.These two schemes under which the premium iscontributed by the Centre and the State Governmentsin equal proportions provide significant supplemen-tation to the Family Benefit Scheme with enhancedbenefits on death, accidental death, and disability forthe persons insured in the BPL families.
4.110 The poor require comprehensive access tostrengthened public health system and facilities. Inaddition, they need suitable instruments in the formof health insurance in cases involving serious illnessrequiring hospitalization, which are not provided ininstitutions of public health.
4.111 In the execution of NSAP, greater professionalsupport is needed for ensuring quality, delivery andfor suitable monitoring and evaluation purposes, bothat the Centre and State levels. Advisory Committeescomprising of professionals and voluntary organiza-tions should be set up at Central, State, and districtlevels for continuous review of policy and performanceof NSAP. Technical support groups should also beestablished at all level to ensure smooth implementa-tion and closer monitoring of NSAP.

100 Eleventh Five Year Plan
ANNEXURE 4.1Headcount Ratio and Number of Poor Persons Below Poverty Line in India (Combined)
States/UTs Headcount Ratio Number of Poor Persons (in Lakh)
1973–74 1983 1993–94 2004–05 1973–74 1983 1993–94 2004–05
Andhra Pradesh 48.9 28.9 22.2 15.8 225.7 164.6 154.0 126.1Assam 51.2 40.5 40.9 19.7 81.8 77.7 96.4 55.8
Bihar 61.9 62.2 55.0 41.4 370.6 462.1 493.4 369.2
Delhi 49.6 26.2 14.7 14.7 22.8 18.4 15.5 22.9
Goa 44.3 18.9 14.9 13.8 4.2 2.2 1.9 2.0
Gujarat 48.2 32.8 24.2 16.8 138.4 117.9 105.2 90.7
Haryana 35.4 21.4 25.1 14.0 38.3 29.6 43.9 32.1
Himachal Pradesh 26.4 16.4 28.4 10.0 9.7 7.4 15.9 6.4
Karnataka 54.5 38.2 33.2 25.0 170.7 149.8 156.5 138.9
Kerala 59.8 40.4 25.4 15.0 135.5 106.8 76.4 49.6
Madhya Pradesh 61.8 49.8 42.5 38.3 276.3 278.0 298.5 249.7
Maharashtra 53.2 43.4 36.9 30.7 287.4 290.9 305.2 317.4
Orissa 66.2 65.3 48.6 46.4 154.5 181.3 160.6 178.5
Punjab 28.2 16.2 11.8 8.4 40.5 28.6 25.1 21.6
Rajasthan 46.1 34.5 27.4 22.1 128.5 126.8 128.5 134.9
Tamil Nadu 54.9 51.7 35.0 22.5 239.5 260.1 202.1 145.6
Uttar Pradesh 57.1 47.1 40.9 32.8 535.7 556.7 604.5 590.0
West Bengal 63.4 54.9 35.7 24.7 299.3 318.7 254.6 208.4
Chhattisgarh – – – 40.9 – – – 91.0
Jharkhand – – – 40.3 – – – 116.4
Uttarakhand – – – 39.6 – – – 36.0
Chandigarh 28.0 23.8 11.4 7.1 0.8 1.2 0.8 0.7
Dandra & Nagar Haveli 46.6 15.7 50.8 33.2 0.4 0.2 0.8 0.8
J&K 40.8 24.2 25.2 5.4 20.5 15.6 20.9 5.9
All India 54.9 44.5 36.0 27.5 3213.4 3229.0 3203.7 3017.2
Note: 1. Poverty Ratio of Assam is used for Sikkim, Arunachal Pradesh, Meghalaya, Mizoram, Manipur, Nagaland, and Tripura.2. Poverty Ratio of Tamil Nadu is used for Pondicherry and Andaman and Nicobar Islands (A&N Islands).3. Poverty Ratio of Kerala is used for Lakshadweep.4. Urban Poverty Ratio of Punjab is used for both rural and urban poverty of Chandigarh.5. Poverty Line of Maharashtra and expenditure distribution of Goa is used to estimate poverty ratio of Goa.6. Poverty Line of Maharashtra and expenditure distribution of Dadra & Nagar Haveli is used to estimate poverty ratio of Dadra
& Nagar Haveli.
Source: Planning Commission.
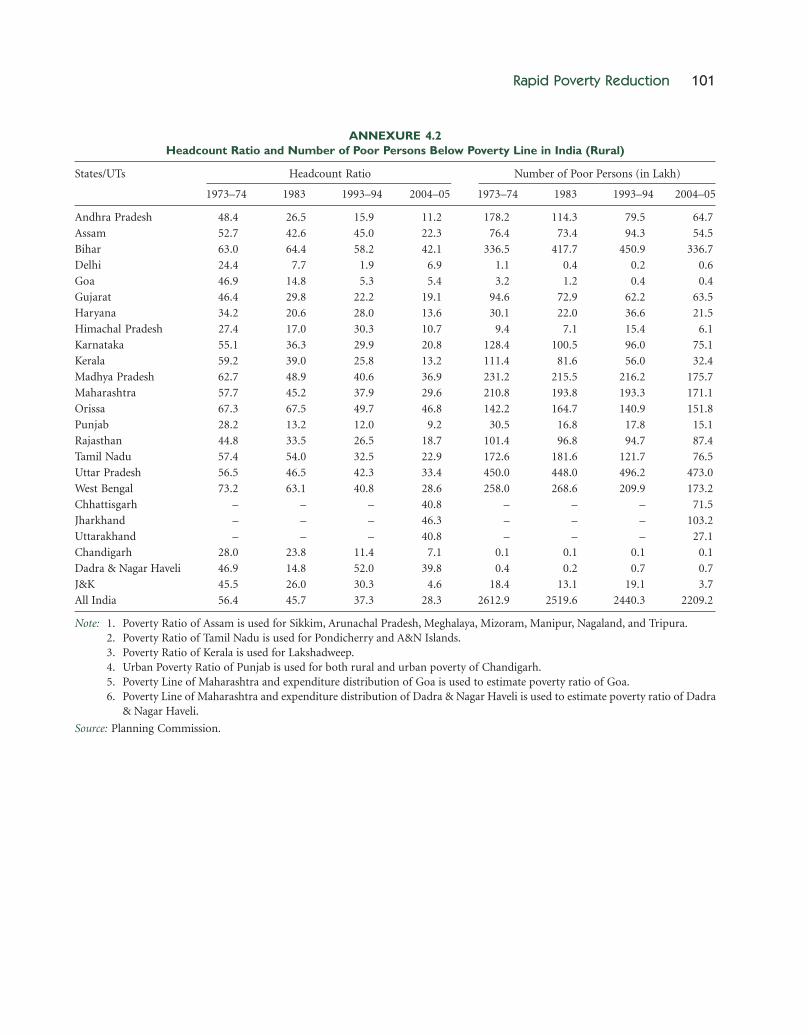
Rapid Poverty Reduction 101
ANNEXURE 4.2Headcount Ratio and Number of Poor Persons Below Poverty Line in India (Rural)
States/UTs Headcount Ratio Number of Poor Persons (in Lakh)
1973–74 1983 1993–94 2004–05 1973–74 1983 1993–94 2004–05
Andhra Pradesh 48.4 26.5 15.9 11.2 178.2 114.3 79.5 64.7
Assam 52.7 42.6 45.0 22.3 76.4 73.4 94.3 54.5
Bihar 63.0 64.4 58.2 42.1 336.5 417.7 450.9 336.7
Delhi 24.4 7.7 1.9 6.9 1.1 0.4 0.2 0.6
Goa 46.9 14.8 5.3 5.4 3.2 1.2 0.4 0.4
Gujarat 46.4 29.8 22.2 19.1 94.6 72.9 62.2 63.5
Haryana 34.2 20.6 28.0 13.6 30.1 22.0 36.6 21.5
Himachal Pradesh 27.4 17.0 30.3 10.7 9.4 7.1 15.4 6.1
Karnataka 55.1 36.3 29.9 20.8 128.4 100.5 96.0 75.1
Kerala 59.2 39.0 25.8 13.2 111.4 81.6 56.0 32.4
Madhya Pradesh 62.7 48.9 40.6 36.9 231.2 215.5 216.2 175.7
Maharashtra 57.7 45.2 37.9 29.6 210.8 193.8 193.3 171.1
Orissa 67.3 67.5 49.7 46.8 142.2 164.7 140.9 151.8
Punjab 28.2 13.2 12.0 9.2 30.5 16.8 17.8 15.1
Rajasthan 44.8 33.5 26.5 18.7 101.4 96.8 94.7 87.4
Tamil Nadu 57.4 54.0 32.5 22.9 172.6 181.6 121.7 76.5
Uttar Pradesh 56.5 46.5 42.3 33.4 450.0 448.0 496.2 473.0
West Bengal 73.2 63.1 40.8 28.6 258.0 268.6 209.9 173.2
Chhattisgarh – – – 40.8 – – – 71.5
Jharkhand – – – 46.3 – – – 103.2
Uttarakhand – – – 40.8 – – – 27.1
Chandigarh 28.0 23.8 11.4 7.1 0.1 0.1 0.1 0.1
Dadra & Nagar Haveli 46.9 14.8 52.0 39.8 0.4 0.2 0.7 0.7
J&K 45.5 26.0 30.3 4.6 18.4 13.1 19.1 3.7
All India 56.4 45.7 37.3 28.3 2612.9 2519.6 2440.3 2209.2
Note: 1. Poverty Ratio of Assam is used for Sikkim, Arunachal Pradesh, Meghalaya, Mizoram, Manipur, Nagaland, and Tripura.2. Poverty Ratio of Tamil Nadu is used for Pondicherry and A&N Islands.3. Poverty Ratio of Kerala is used for Lakshadweep.4. Urban Poverty Ratio of Punjab is used for both rural and urban poverty of Chandigarh.5. Poverty Line of Maharashtra and expenditure distribution of Goa is used to estimate poverty ratio of Goa.6. Poverty Line of Maharashtra and expenditure distribution of Dadra & Nagar Haveli is used to estimate poverty ratio of Dadra
& Nagar Haveli.
Source: Planning Commission.
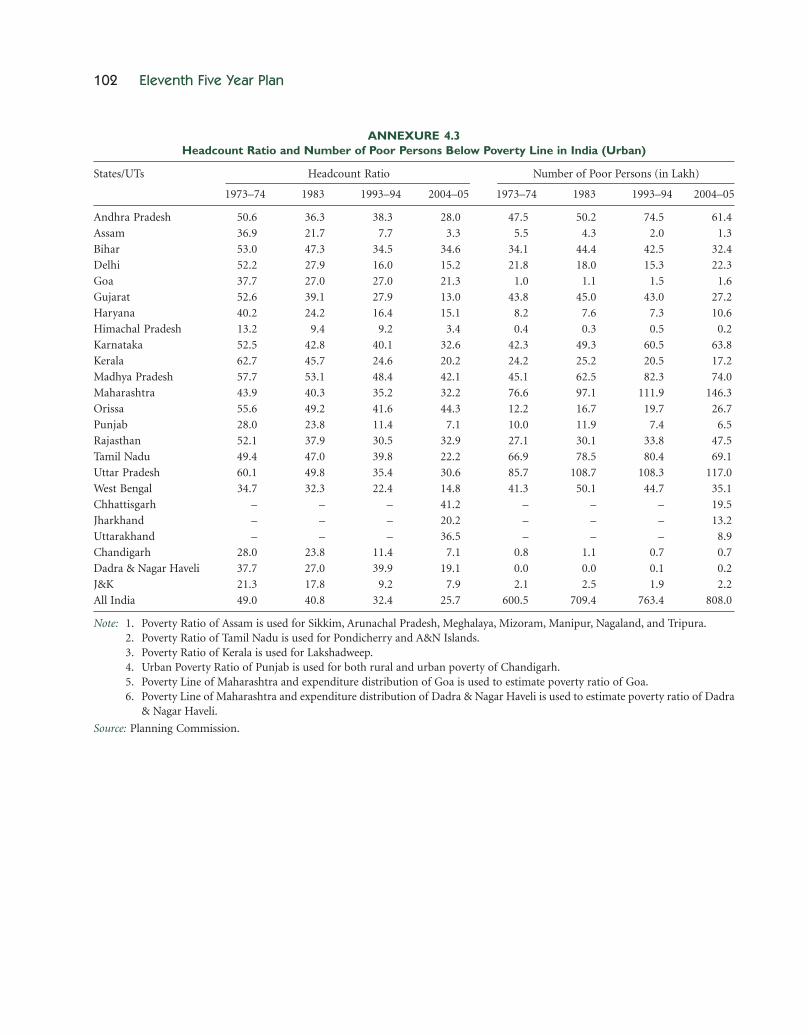
102 Eleventh Five Year Plan
ANNEXURE 4.3Headcount Ratio and Number of Poor Persons Below Poverty Line in India (Urban)
States/UTs Headcount Ratio Number of Poor Persons (in Lakh)
1973–74 1983 1993–94 2004–05 1973–74 1983 1993–94 2004–05
Andhra Pradesh 50.6 36.3 38.3 28.0 47.5 50.2 74.5 61.4
Assam 36.9 21.7 7.7 3.3 5.5 4.3 2.0 1.3
Bihar 53.0 47.3 34.5 34.6 34.1 44.4 42.5 32.4
Delhi 52.2 27.9 16.0 15.2 21.8 18.0 15.3 22.3
Goa 37.7 27.0 27.0 21.3 1.0 1.1 1.5 1.6
Gujarat 52.6 39.1 27.9 13.0 43.8 45.0 43.0 27.2
Haryana 40.2 24.2 16.4 15.1 8.2 7.6 7.3 10.6
Himachal Pradesh 13.2 9.4 9.2 3.4 0.4 0.3 0.5 0.2
Karnataka 52.5 42.8 40.1 32.6 42.3 49.3 60.5 63.8
Kerala 62.7 45.7 24.6 20.2 24.2 25.2 20.5 17.2
Madhya Pradesh 57.7 53.1 48.4 42.1 45.1 62.5 82.3 74.0
Maharashtra 43.9 40.3 35.2 32.2 76.6 97.1 111.9 146.3
Orissa 55.6 49.2 41.6 44.3 12.2 16.7 19.7 26.7
Punjab 28.0 23.8 11.4 7.1 10.0 11.9 7.4 6.5
Rajasthan 52.1 37.9 30.5 32.9 27.1 30.1 33.8 47.5
Tamil Nadu 49.4 47.0 39.8 22.2 66.9 78.5 80.4 69.1
Uttar Pradesh 60.1 49.8 35.4 30.6 85.7 108.7 108.3 117.0
West Bengal 34.7 32.3 22.4 14.8 41.3 50.1 44.7 35.1
Chhattisgarh – – – 41.2 – – – 19.5
Jharkhand – – – 20.2 – – – 13.2
Uttarakhand – – – 36.5 – – – 8.9
Chandigarh 28.0 23.8 11.4 7.1 0.8 1.1 0.7 0.7
Dadra & Nagar Haveli 37.7 27.0 39.9 19.1 0.0 0.0 0.1 0.2
J&K 21.3 17.8 9.2 7.9 2.1 2.5 1.9 2.2
All India 49.0 40.8 32.4 25.7 600.5 709.4 763.4 808.0
Note: 1. Poverty Ratio of Assam is used for Sikkim, Arunachal Pradesh, Meghalaya, Mizoram, Manipur, Nagaland, and Tripura.2. Poverty Ratio of Tamil Nadu is used for Pondicherry and A&N Islands.3. Poverty Ratio of Kerala is used for Lakshadweep.4. Urban Poverty Ratio of Punjab is used for both rural and urban poverty of Chandigarh.5. Poverty Line of Maharashtra and expenditure distribution of Goa is used to estimate poverty ratio of Goa.6. Poverty Line of Maharashtra and expenditure distribution of Dadra & Nagar Haveli is used to estimate poverty ratio of Dadra
& Nagar Haveli.
Source: Planning Commission.
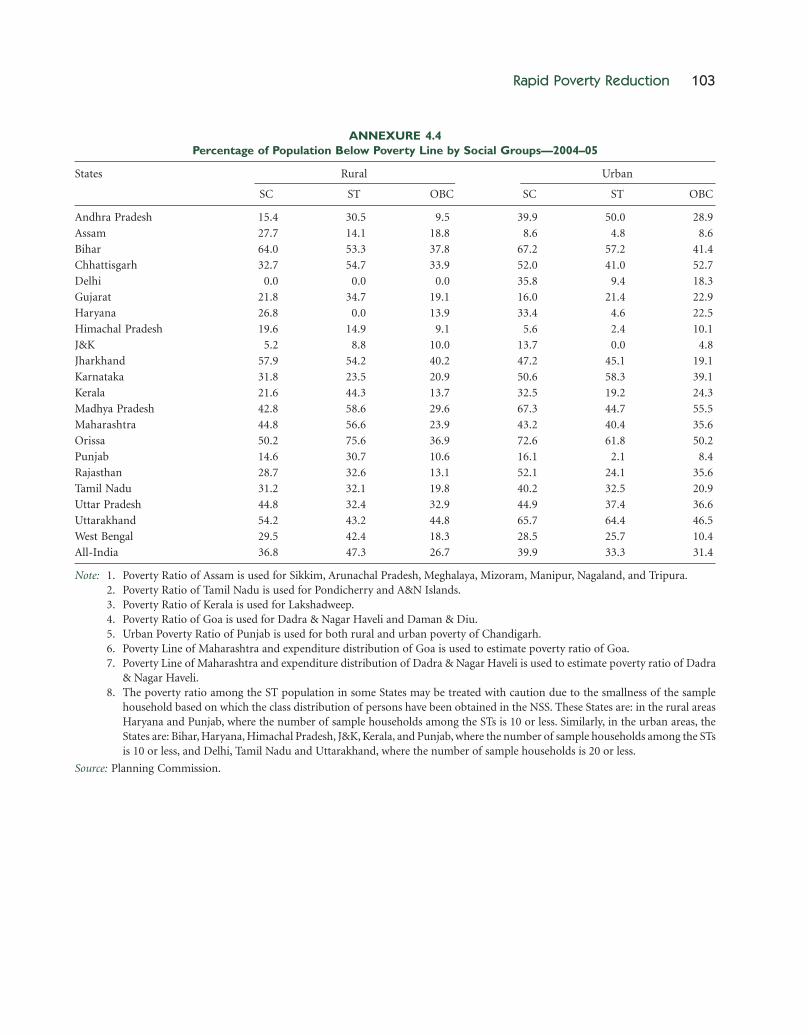
Rapid Poverty Reduction 103
ANNEXURE 4.4Percentage of Population Below Poverty Line by Social Groups—2004–05
States Rural Urban
SC ST OBC SC ST OBC
Andhra Pradesh 15.4 30.5 9.5 39.9 50.0 28.9
Assam 27.7 14.1 18.8 8.6 4.8 8.6
Bihar 64.0 53.3 37.8 67.2 57.2 41.4
Chhattisgarh 32.7 54.7 33.9 52.0 41.0 52.7
Delhi 0.0 0.0 0.0 35.8 9.4 18.3
Gujarat 21.8 34.7 19.1 16.0 21.4 22.9
Haryana 26.8 0.0 13.9 33.4 4.6 22.5
Himachal Pradesh 19.6 14.9 9.1 5.6 2.4 10.1
J&K 5.2 8.8 10.0 13.7 0.0 4.8
Jharkhand 57.9 54.2 40.2 47.2 45.1 19.1
Karnataka 31.8 23.5 20.9 50.6 58.3 39.1
Kerala 21.6 44.3 13.7 32.5 19.2 24.3
Madhya Pradesh 42.8 58.6 29.6 67.3 44.7 55.5
Maharashtra 44.8 56.6 23.9 43.2 40.4 35.6
Orissa 50.2 75.6 36.9 72.6 61.8 50.2
Punjab 14.6 30.7 10.6 16.1 2.1 8.4
Rajasthan 28.7 32.6 13.1 52.1 24.1 35.6
Tamil Nadu 31.2 32.1 19.8 40.2 32.5 20.9
Uttar Pradesh 44.8 32.4 32.9 44.9 37.4 36.6
Uttarakhand 54.2 43.2 44.8 65.7 64.4 46.5
West Bengal 29.5 42.4 18.3 28.5 25.7 10.4
All-India 36.8 47.3 26.7 39.9 33.3 31.4
Note: 1. Poverty Ratio of Assam is used for Sikkim, Arunachal Pradesh, Meghalaya, Mizoram, Manipur, Nagaland, and Tripura.2. Poverty Ratio of Tamil Nadu is used for Pondicherry and A&N Islands.3. Poverty Ratio of Kerala is used for Lakshadweep.4. Poverty Ratio of Goa is used for Dadra & Nagar Haveli and Daman & Diu.5. Urban Poverty Ratio of Punjab is used for both rural and urban poverty of Chandigarh.6. Poverty Line of Maharashtra and expenditure distribution of Goa is used to estimate poverty ratio of Goa.7. Poverty Line of Maharashtra and expenditure distribution of Dadra & Nagar Haveli is used to estimate poverty ratio of Dadra
& Nagar Haveli.8. The poverty ratio among the ST population in some States may be treated with caution due to the smallness of the sample
household based on which the class distribution of persons have been obtained in the NSS. These States are: in the rural areasHaryana and Punjab, where the number of sample households among the STs is 10 or less. Similarly, in the urban areas, theStates are: Bihar, Haryana, Himachal Pradesh, J&K, Kerala, and Punjab, where the number of sample households among the STsis 10 or less, and Delhi, Tamil Nadu and Uttarakhand, where the number of sample households is 20 or less.
Source: Planning Commission.