Embed Size (px)
Citation preview

© The Authors, published by EDP Sciences. This is an open access article distributed under the terms of the Creative Commons Attribution License 4.0 (http://creativecommons.org/licenses/by/4.0/).
E3S Web of Conferences 47, 04010 (2018) https://doi.org/10.1051/e3sconf/20184704010SCiFiMaS 2018
Potential Harmful Algal Blooms (HABs) in Segara Anakan Lagoon, Central Java, Indonesia
Rose Dewi1, 3*, Muhammad Zainuri2,4, Sutrisno Anggoro1, Tjahjo Winanto3, and Hadi Endrawati5
1Coastal Resources Management Doctoral Program, Fisheries and Marine Science Department, Diponegoro University. 2Departement of Oceanography, Fisheries and Marine Science Department, Diponegoro University. 3Fisheries and Marine Science Department, Jenderal Soedirman University. 4 Centre of Excellent Mitigation of Natural Disaster and Coastal Rehabilitation, Diponegoro University. 5Fisheries and Marine Science Department,Diponegoro University.
Abstract. Segara Anakan Lagoon (SAL), located along side of soutern coast on western part of Central Java 108º46’–109 º 05’E; 7 º 34’–7 º 48’S. SAL is necessasrily ecosistem as nursery ground. This has been becoming important research relating to primary productivity. The existance of antropogenical activities around the area, is changing inrush input into lagoon. This is going to be worried about giving influences in physical, chemistry, and biological factors of the water and causing deflation in rate value of primer productivity. Rainy and dry season’s variability with important impacts on the phytoplankton community structure, abundance and dynamics. Furthermore, the number of coastal ecosystems with identified eutrophication symptoms is increasing worldwide due to the increasing anthropogenic pressures. One of 1the first symptoms of eutrophication is enhanced phytoplankton biomass. Generally, Fitoplanton is important biological indicators in the process. However, high abundance of biomass phytoplankton could give harmful effect toward lagoon, they could produce toxic substances that will be accumulated, it can be endangering .The aim of the research is to determine and calculate potential species of Harmful Algal Blooms (HABs) in SAL with spastial and temporal approach. The spatial approach is done at seven different stations of ecological characteristics SAL, with representations: natural factors and the presence of anthropogenic activities. On the temporal approach (time series) for a year, it refers to the monsoon wind pattern, which are called season
*Corresponding author : +6281327929555 | [email protected]

2
E3S Web of Conferences 47, 04010 (2018) https://doi.org/10.1051/e3sconf/20184704010SCiFiMaS 2018
(western, the transitional season 1, eastern, and the transitional season 2).The results of laboratory tests are discussed descriptively. Phytoplankton sample were taken vertically using plankton nets, meshsize 25 µm. The result showed that SAL have been found and consisted of 82 species from 5 division phytoplankton: Chrysophyta, Chlorophyta, Cyanophyta, Pyrophyta, and Euglenophyta. 20 species from 9 genus were identified potential as HABs, with four genus of them were known having toxin and endangering for human (Nitzschia, Oscillatoria, Anabaena dan Protoperidinium).Whether, five genus do not produce toxins but giving deflation Oxygen of waters with anoxia condition (Chaetoceros, Coscinodiscus, Rhizosolenia, Thalassiosira, Thalassiotrix).The highest of HABS abundance is dominated during the transitional season II. On the spatial approach, antropoegenic characteristics station contribute to the whole height of HABs. Influence of rainfall, spatially, antropogenical pressure, and hydrodinamical watres causing enhancement of HABs potency.
1 INTRODUCTION Geographically, Segara Anakan Lagoon (SAL), locating on the ordinate of
7˚35"- 7º46" S and 108˚45" - 109º01" E, covering 14.221,8 ha, in the southern coastal area in Java island, at Kampung Laut Sub-district, Cilacap Regency. The area is accounted from a bay, the mouth of the lagoon facing to east, there is Nusa Kambangan Island as a barrier, separating the SAL from the Indian Ocean. The existence of shape changing up to now, It has occured through various level in environmental changing. SAL is an area that does not stand alone, but there are affecting various factors in ecological changes of the region [4, 7].
Lagoon is greatly affected, freshwater flow entering in high quantity with suspended sediment, mainly from Citanduy river [15]. S.Citanduy has contribution for catchment area of 3.520 km2 or supplying for 80% of the water flow to the SAL [14]. The river flow brings the supply with organic materials continuously, so it is to trigger the consolidating process of coastal sediments, as a source of nutrients and forming the physical structure of sediments. Condition causing most of the volume of water bodies from SAL, is replaced with mangrove forests, then it converted its use into various anthropogenic activities [4, 9].
Supported by continuous aquatic dynamics, this is causing physical contact complexity, aquatic chemistry as well as microbiology triggering for the availability of accumulation of concentration of macronutrient elements. The accumulation of sedimentation mainly occurs in the western part of the lagoon, while the eastern part of the lagoon is dominated by hydrodynamics of the Indian Ocean [16].
The annually high sedimentation in the lagoon, results in macronutrient accumulation, especially Nitrogen (N) and Phosphate (P), being glued on sediment particles, as the process of natural response. If the condition occurs continuously, it is worried of causing the phenomenon of "eutrophication". The initial impacted biota indicator of aquatic eutrophication is phytoplankton, indicated by adaptation or tolerating the condition in water instability [18, 3, 34]. High consentration of N

3
E3S Web of Conferences 47, 04010 (2018) https://doi.org/10.1051/e3sconf/20184704010SCiFiMaS 2018
(western, the transitional season 1, eastern, and the transitional season 2).The results of laboratory tests are discussed descriptively. Phytoplankton sample were taken vertically using plankton nets, meshsize 25 µm. The result showed that SAL have been found and consisted of 82 species from 5 division phytoplankton: Chrysophyta, Chlorophyta, Cyanophyta, Pyrophyta, and Euglenophyta. 20 species from 9 genus were identified potential as HABs, with four genus of them were known having toxin and endangering for human (Nitzschia, Oscillatoria, Anabaena dan Protoperidinium).Whether, five genus do not produce toxins but giving deflation Oxygen of waters with anoxia condition (Chaetoceros, Coscinodiscus, Rhizosolenia, Thalassiosira, Thalassiotrix).The highest of HABS abundance is dominated during the transitional season II. On the spatial approach, antropoegenic characteristics station contribute to the whole height of HABs. Influence of rainfall, spatially, antropogenical pressure, and hydrodinamical watres causing enhancement of HABs potency.
1 INTRODUCTION Geographically, Segara Anakan Lagoon (SAL), locating on the ordinate of
7˚35"- 7º46" S and 108˚45" - 109º01" E, covering 14.221,8 ha, in the southern coastal area in Java island, at Kampung Laut Sub-district, Cilacap Regency. The area is accounted from a bay, the mouth of the lagoon facing to east, there is Nusa Kambangan Island as a barrier, separating the SAL from the Indian Ocean. The existence of shape changing up to now, It has occured through various level in environmental changing. SAL is an area that does not stand alone, but there are affecting various factors in ecological changes of the region [4, 7].
Lagoon is greatly affected, freshwater flow entering in high quantity with suspended sediment, mainly from Citanduy river [15]. S.Citanduy has contribution for catchment area of 3.520 km2 or supplying for 80% of the water flow to the SAL [14]. The river flow brings the supply with organic materials continuously, so it is to trigger the consolidating process of coastal sediments, as a source of nutrients and forming the physical structure of sediments. Condition causing most of the volume of water bodies from SAL, is replaced with mangrove forests, then it converted its use into various anthropogenic activities [4, 9].
Supported by continuous aquatic dynamics, this is causing physical contact complexity, aquatic chemistry as well as microbiology triggering for the availability of accumulation of concentration of macronutrient elements. The accumulation of sedimentation mainly occurs in the western part of the lagoon, while the eastern part of the lagoon is dominated by hydrodynamics of the Indian Ocean [16].
The annually high sedimentation in the lagoon, results in macronutrient accumulation, especially Nitrogen (N) and Phosphate (P), being glued on sediment particles, as the process of natural response. If the condition occurs continuously, it is worried of causing the phenomenon of "eutrophication". The initial impacted biota indicator of aquatic eutrophication is phytoplankton, indicated by adaptation or tolerating the condition in water instability [18, 3, 34]. High consentration of N
and P affecting in the content of chlorophyll-a contained in phytoplankton will further impact on the abundance of phytoplankton [10, 16].
It is further explained that in macronutrient utilization process, there are two categories of phytoplankton namely: productive phytoplankton (non-toxic), functioning as natural food or as primary producer in food chain, so it can show the level of water productivity. Condition reflecting in the high primary productivity of waters depends so much on the ability of waters to synthesize inorganic materials into organic materials through photosynthesis by phytoplankton as primary producers [25, 18]. On the other hand, there is a type of phytoplankton being capable of producing toxin (HABs) Harmful Algal Blooms. Generically the term HABs refers to high levels of phytoplankton growth with toxin causing anoxia, ie decreased oxygen loss in water body, mass mortality of fish and resulting in negative biomagnification processes in the food chain. So it is perceived as a harmful [22].
The influence of natural factors (input of freshwater flow, sedimentation) and anthropogenic activity of land use change, supported by fluctuation of environmental change of monsoon. Ecological conditions are worried of supporting the occurrence of eutrophication phenomena that affect the composition and abundance (blooming) phytoplankton, especially potentially known as HABs, affecting the aquatic organisms and decreased dissolved oxygen content (anoxia) and decreased the average value of primary productivity. This makes identification of the type of HABs phytoplankton in the SAL area, becomes very important for further study, especially in lagoon waters as nursery ground areas.
2 MATERIAL and METHOD The analysis of the composition and abundance of phytoplanton was done in-
situ temporally (time series) for a year, based on the representation of monsoon winds [22], that based on Meteorological and Oceanographic data, Indonesian waters are affected by the monsoon wind, consisting of:
M1 : West Season : December – February (rainy season, February). M2 : Transition Season 1: March – May (rainy to dry season, May). M3 : East Season : June – August (dry season, July) M4 : Transition Season II: September-November (dry to rainy season,
Oktober ). M5 : West Season : December – February (rainy season, December).
The reference is used as an in-situ retrieval time of data of 7 times spatial repetition with different ecological characteristics in the SAL region. It is aimed to evaluate the ecological influencing (response) effect of natural factor impacts, at stations (2, 3, 4, 6) and affected anthropogenical activities of the community around the lagoon at the station (1, 5, 7). Further characteristics of the spatial approach are presented in (Table 1).

4
E3S Web of Conferences 47, 04010 (2018) https://doi.org/10.1051/e3sconf/20184704010SCiFiMaS 2018
Tabel 1. The Characteristic of Spatial approach on sampling of Phytoplankton at the area of Segara Anakan, Cilacap Sub-district.
Characteristics Ordinate
S1 TPI dan Majingklak port 108°48'02.4"BT 07°40'27.6"LS
S2 The border of gate (west plawangan) of SAL directly bordering with Indian Ocean
108°46'56.7"BT 07°41'59.0"LS
S3 The mouth of Cikonde and Cimeneng river
108°49'47.9"BT 07°40'34.6"LS
S4 The area of Mangrove 108°51'36.5"BT 07°41'44.9"LS
S5 Kampung Laut settlement 108°52'14.0"BT 07°42'19.5"LS
S6 Conservative tourism “Mina” ”Ujung Alang, district of Kampung Laut
108°52'45.4"BT 07°42'55.4"LS
S7 Cultivating place by using floating net 108°48'56.0"BT 07°41'01.0"LS
Phytoplankon sampling was done vertically, using plankton-net of 25 μm by
filtering 100 liters of water, on the surface of lagoon waters with a depth of 0.5 to 1 m [1].
Preservation of samples by using formalin up to 4% [21], as many as 10 drops. Identification was using a binocular light microscope with magnification of 40 times. The calculation is done in 20 times, the field of view and 3 times of repetition
Stages of identification of productive and HaBs phytoplankton is classified by [20, 28, 33] and classification of phytoplankton type of HABs refers to [27, 29, 30, 32]. Calculation of phytoplankton abundance with the formula based on Lackey Drop Microtransect Counting method [1] :
K F N (1) with
1 1
2 2
1 1Q VFQ V P W
(2)
Description : K : Abundance of Phyoplankton (indv/liter) N : Total of phytoplankton F : Total of plankton individu /Liter Q1 : Weidth of covering glass 18x 18 (324mm2) Q2 : Weidth of visibility (1,11279 mm2) V1 : Water volume in container bottle (100 ml) V2 : Water volume under container bottle (0,05ml) P : Total of observed Visibility (20 times)
5
E3S Web of Conferences 47, 04010 (2018) https://doi.org/10.1051/e3sconf/20184704010SCiFiMaS 2018
Tabel 1. The Characteristic of Spatial approach on sampling of Phytoplankton at the area of Segara Anakan, Cilacap Sub-district.
Characteristics Ordinate
S1 TPI dan Majingklak port 108°48'02.4"BT 07°40'27.6"LS
S2 The border of gate (west plawangan) of SAL directly bordering with Indian Ocean
108°46'56.7"BT 07°41'59.0"LS
S3 The mouth of Cikonde and Cimeneng river
108°49'47.9"BT 07°40'34.6"LS
S4 The area of Mangrove 108°51'36.5"BT 07°41'44.9"LS
S5 Kampung Laut settlement 108°52'14.0"BT 07°42'19.5"LS
S6 Conservative tourism “Mina” ”Ujung Alang, district of Kampung Laut
108°52'45.4"BT 07°42'55.4"LS
S7 Cultivating place by using floating net 108°48'56.0"BT 07°41'01.0"LS
Phytoplankon sampling was done vertically, using plankton-net of 25 μm by
filtering 100 liters of water, on the surface of lagoon waters with a depth of 0.5 to 1 m [1].
Preservation of samples by using formalin up to 4% [21], as many as 10 drops. Identification was using a binocular light microscope with magnification of 40 times. The calculation is done in 20 times, the field of view and 3 times of repetition
Stages of identification of productive and HaBs phytoplankton is classified by [20, 28, 33] and classification of phytoplankton type of HABs refers to [27, 29, 30, 32]. Calculation of phytoplankton abundance with the formula based on Lackey Drop Microtransect Counting method [1] :
K F N (1) with
1 1
2 2
1 1Q VFQ V P W
(2)
Description : K : Abundance of Phyoplankton (indv/liter) N : Total of phytoplankton F : Total of plankton individu /Liter Q1 : Weidth of covering glass 18x 18 (324mm2) Q2 : Weidth of visibility (1,11279 mm2) V1 : Water volume in container bottle (100 ml) V2 : Water volume under container bottle (0,05ml) P : Total of observed Visibility (20 times)
W : Netted water volume (100 liter)
Measurement of water quality parameters of dissolved oxygen content (DO) in situ, is to support the study, carried out by using Water Quality Checker (WQC) (Merk Toa DKK-Japan : Type WQC-22A), by inserting (dipping) the device on the surface of the water, recording after the tool shows a constant number.
3 RESULT AND DISCUSSION Phytoplankton was obtained from the identification in 82 species of Segara
Anakan from 5 (five) divisions: 54 species of Chrysophyta, 13 species of Chlorophyta, 8 species of Cyanophyta, 3 species of Pyrophyta, and 4 species of Euglenophyta are spatially distributed. These types of phytoplankton are from the Chrysophyta Division, Bacillariophceae class (diatoms) dominating the entire station and season. Diatoms are an important species (adaptive) in phytoplankton populations and are key to identification of plankton [6]. Phytoplankton Bacillariophyceae can produce cell division quickly, with time intervals of every four hours. In the increase of macronutrient nutrient concentration, diatoms are able to reproduce three times in 24 hours [5, 11, 28].
There are variations of the phytoplankton of freshwater, estuarine and marine waters identified during the spatio-temporal approach. According to [32] is suspected due to the hydrodynamic factors of the waters: the direction and velocity of currents, which affect the composition and abundance of plankton. These factors play a role in the process of migration and the spread of plankton, the passive organism of its movement.
Decent potential phytoplankton as (HABs) is 20 species (9 genera) of all identified phytoplankton. The variability of SAL phytoplankton showed there are distributed HABs species and in spatial (stationary) or seasonal (temporal) periods during the study. The results of the research that at waters with semi-covered system as lagoon, will be identifying species with the type of HABs [8].
Table.2 The measurement of Phytoplankton abundance and dissolved oxygen content at the area of Segara Anakan Lagoon Cilacap Sub-district
The Abundance of Phytoplankton (indv/ L) Dissolved Oxygen (mg/ L) Spatial Approach (S) Temporal Approach (M)
S1 8355,60 ± 3049,46 M1 6873,43 ± 2296,90 2,46 ± 1.09 S2 4474,80 ± 3408,25 M2 9956,57 ± 5300,23 3,23 ± 2.01 S3 6058,80 ± 1860,57 M3 6618,86 ± 3650,68 2,03 ± 1.43 S4 8712,00 ± 6444,89 M4 5685,43 ± 2075,74 2,90 ± 0.74 S5 7286,40 ± 4137,68 M5 4129,71 ± 3139,88 5,40 ± 2.45 S6 5940,00 ± 4356,00 S7 5742,00 ± 1945,04
In the nine genera of HABs identified, there are four toxic genera and make human sick of, such as Nitzschia, Oscillatoria, Anabaena and Protoperidinium. While there are non-toxic species that are included to damaging phytoplankton in ecosystem, obstructing fish’s gill function with its sharpened and chained morphology. Moreover, some of them create insuffenciency of oxygen in waters.
6
E3S Web of Conferences 47, 04010 (2018) https://doi.org/10.1051/e3sconf/20184704010SCiFiMaS 2018
Types of phytoplankton are: Chaetoceros, Coscinodiscus, Rhizosolenia, Thalassiosira, Thalassiotrix
The results of the other research stated that there are phytoplankton generally, being able to cause HABs such as Chaetoceros, Pseudo-Nitzschia, Trichodesmium erytrhraeum (Oscillatoria) and Anabaena [15]. Types of Pseudo-Nitzschia multiseries diatoms and Anabaena are included to phytoplankton that can produce poisoned. The types of toxic phytoplankton are such as Nitzschia, Protoperidinium, Anabaena, Mycrocystis, Oscillatoria, Alexandrium and Dinophisis, there are also non-toxic species that can have a detrimental effect in the waters of Bacteriastrum, Chaetoceros, Coscinodiscus, Skeletonema, Ceratium, Rhizosolenia, Thalassiosira, Thalassiotrix and Noctiluca [2].
The types of phytoplankton are a type of tropical phytoplankton, so they likely can be found in Indonesian waters [28]. Several occurrences of HABs in Indonesian waters are including found in July 1996, there was a blooming type Oscillatoria in Ambon Bay [30]. Lastest event which is blooming is Coscinodiscus, sp. causing mass mortality in the Bay of Jakarta (Ancol Waters) at the end of November 2015.
The group of potential HABs phytoplankton in the SAL come together and the types of Chaetoceros, sp., Rhizosolenia and Coscinodiscus, sp. can be found mostly in both coastal and estuary waters [5]. Although, those three types of HABs phytoplankton are a type of diatom plankton living in marine waters [33]. However, it is suspected that the hydrodynamic factors in the waters producing the types of marine phytoplankton (ocean of Indonesia) could be distributed into the SAL.
Table. 2 The Type and Abundance of potential Phytoplankton as HABs (indv/ L) in the area of Segara Anakan lagoon, regency of Cilacap.
No.
Types of Phytoplankton
West Season
Transitional
season I
East Season
Transitional
season II
West season
(February) (May) (July) (Octobe
r) (December)
(M1) (M2) (M3) (M4) (M5)
1 Anabaena hallensis 0 0 0 198-3960 0-198
2 Oscillatoria princeps 198-792 990-2376
396-3564
594-1584 0-792
3 Chaetoceros, sp. 0 – 198 0 0 0 0
4 Coscinodiscus linetus 198-594 0 0-594 396-990 0-198
5 Nitzschia acicularis 0 594-1188
198-594 0 0-396
6 Nitzschia actinastroides 198-396 0 0 0 0
7 Nitzschia apectabilis 0 – 198 0 0 0 0
8 Nitzschia closteria 0 0 0 0-594 0
9 Nitzschia longissima 0 0 0
396-1188 0

7
E3S Web of Conferences 47, 04010 (2018) https://doi.org/10.1051/e3sconf/20184704010SCiFiMaS 2018
Types of phytoplankton are: Chaetoceros, Coscinodiscus, Rhizosolenia, Thalassiosira, Thalassiotrix
The results of the other research stated that there are phytoplankton generally, being able to cause HABs such as Chaetoceros, Pseudo-Nitzschia, Trichodesmium erytrhraeum (Oscillatoria) and Anabaena [15]. Types of Pseudo-Nitzschia multiseries diatoms and Anabaena are included to phytoplankton that can produce poisoned. The types of toxic phytoplankton are such as Nitzschia, Protoperidinium, Anabaena, Mycrocystis, Oscillatoria, Alexandrium and Dinophisis, there are also non-toxic species that can have a detrimental effect in the waters of Bacteriastrum, Chaetoceros, Coscinodiscus, Skeletonema, Ceratium, Rhizosolenia, Thalassiosira, Thalassiotrix and Noctiluca [2].
The types of phytoplankton are a type of tropical phytoplankton, so they likely can be found in Indonesian waters [28]. Several occurrences of HABs in Indonesian waters are including found in July 1996, there was a blooming type Oscillatoria in Ambon Bay [30]. Lastest event which is blooming is Coscinodiscus, sp. causing mass mortality in the Bay of Jakarta (Ancol Waters) at the end of November 2015.
The group of potential HABs phytoplankton in the SAL come together and the types of Chaetoceros, sp., Rhizosolenia and Coscinodiscus, sp. can be found mostly in both coastal and estuary waters [5]. Although, those three types of HABs phytoplankton are a type of diatom plankton living in marine waters [33]. However, it is suspected that the hydrodynamic factors in the waters producing the types of marine phytoplankton (ocean of Indonesia) could be distributed into the SAL.
Table. 2 The Type and Abundance of potential Phytoplankton as HABs (indv/ L) in the area of Segara Anakan lagoon, regency of Cilacap.
No.
Types of Phytoplankton
West Season
Transitional
season I
East Season
Transitional
season II
West season
(February) (May) (July) (Octobe
r) (December)
(M1) (M2) (M3) (M4) (M5)
1 Anabaena hallensis 0 0 0 198-3960 0-198
2 Oscillatoria princeps 198-792 990-2376
396-3564
594-1584 0-792
3 Chaetoceros, sp. 0 – 198 0 0 0 0
4 Coscinodiscus linetus 198-594 0 0-594 396-990 0-198
5 Nitzschia acicularis 0 594-1188
198-594 0 0-396
6 Nitzschia actinastroides 198-396 0 0 0 0
7 Nitzschia apectabilis 0 – 198 0 0 0 0
8 Nitzschia closteria 0 0 0 0-594 0
9 Nitzschia longissima 0 0 0
396-1188 0
10
Nitzschia nyassensis 0 – 198 0 0 0 0-198
11
Nitzschia philiphinarum 198-396 0 0 0 0
12 Nitzschia ricta 0 198-990 0 0 0 13
Nitzschia subrostrata 0 – 198 0 0 0 0
14
Nitzschia vermicularis 198-396
1782-3366
198-594 0 – 198 0
15 Nitzschia zigma
396 – 594 0 0 0 0
16 Rhizosolenia, sp. 0 0 0 0 – 198 0
17 Rhizosolenia robusta 0 0 0 0 0-594
18 Thalassiosira rotula 0 – 198 0 0 0 0
19
Thalassiotrix frauenfeldii 0 – 198 0 0 0 0
20 Peridinium, sp. 198-792 0-594 0 0 198-396
Jumlah Spesies 13 5 4 7 7
Adaptation by Coscinodiscus, sp. is easily found in the whole research station (S) with morphologically forming large round. In other hand, Thalassiosira and Thalassiotrix have good adaptation in the environment, colonizing with long arranged chain. The type of Chaetoceros, sp. has a very quick response to added nutrients in the waters and potentially create the dominant group in the nutrification competition [17]. The result in the identification, which is obtained in 11 species of Nitzschia in SAL region is one of diatom that can produce toxin beside Chaetoceros, sp [33].
In spatial approach, the types of high phytoplankton (HABs) are existing in stations with anthropogenic characteristics, with much more dominated by phytoplankton being capable of adapting into environmental conditions with the highest organic material, with containing of 20 species of HABs (Table 2). According to [27] that 50% of (N) inorganic dissolved nitrogen derive from agricultural activities, while 70% of total phosphates come from a variety of domestic activities. The condition resulted in phosphate concentration (P) larger in lagoon than open sea [36].
M1 M2
M3
M4
M5
8
E3S Web of Conferences 47, 04010 (2018) https://doi.org/10.1051/e3sconf/20184704010SCiFiMaS 2018
Fig 1. The averaged rainfall in regency of Cilacap during 2016.
Fig 2. Relative abundance of (%KR) potential Phytoplankton as HABs pada at the area of
lagoon of Segara anakan Kabupaten Cilacap.
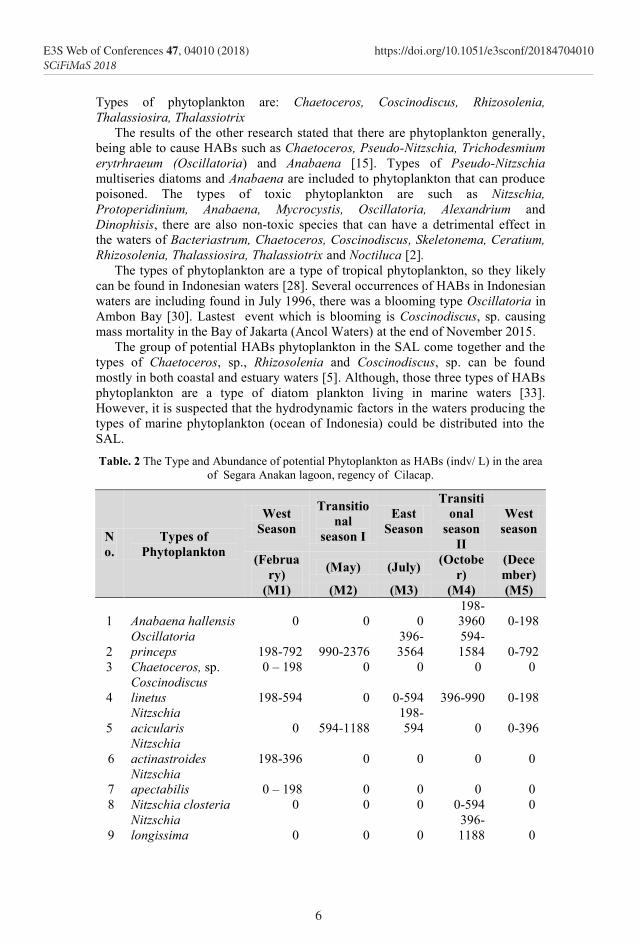
Description : (M1) : West Season (February); (M2) : Transitional season I (May); (M3) : east season (July); (M4) : Transitional Season II (October); (M5) : west season (December).
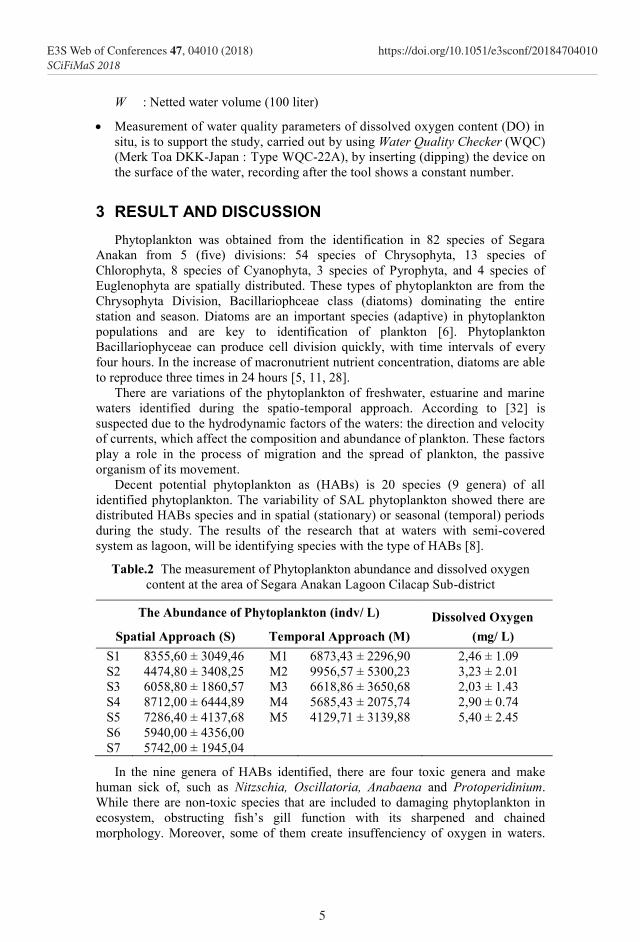
In the temporal approach, season (M1) with abundance of (6873,43 ± 2296,90) is a potential season having the highest composition of phytoplankton HABs (Table 2). Allegedly this season is a transitional season between the waiting phase until the mechanism of flushing time, ie macronutrient flushing into the sea waters (freshwater change) and is the transition from west season to come into the transition I. Flushing time, is a time required by waters, to have freshwater rinsing in the lagoon, is mainly influenced by high rainfall and river flow [12]. So, it resulted in the abundance of distributed phytoplankton into the waters of the sea (Indian Ocean). In the subsequent season, flushing time is coming along with increased rainfall is accompanied by the increase in the relative abundance (KR) of potential phytoplankton as HABs. It is shown from the calculation of % KR phytoplankton HABs (Figures 2 and 3).
In season (M3) with 658 mm rainfall, which is supporting the abundance of phytoplankton of (6618,86 ± 3650,68) indv / L, has KR HABs potential of 27.78% of total phytoplankton. Furthermore, the increased rainfall reached 968 mm. at

9
E3S Web of Conferences 47, 04010 (2018) https://doi.org/10.1051/e3sconf/20184704010SCiFiMaS 2018
Fig 1. The averaged rainfall in regency of Cilacap during 2016.
Fig 2. Relative abundance of (%KR) potential Phytoplankton as HABs pada at the area of
lagoon of Segara anakan Kabupaten Cilacap.
Description : (M1) : West Season (February); (M2) : Transitional season I (May); (M3) : east season (July); (M4) : Transitional Season II (October); (M5) : west season (December).
In the temporal approach, season (M1) with abundance of (6873,43 ± 2296,90) is a potential season having the highest composition of phytoplankton HABs (Table 2). Allegedly this season is a transitional season between the waiting phase until the mechanism of flushing time, ie macronutrient flushing into the sea waters (freshwater change) and is the transition from west season to come into the transition I. Flushing time, is a time required by waters, to have freshwater rinsing in the lagoon, is mainly influenced by high rainfall and river flow [12]. So, it resulted in the abundance of distributed phytoplankton into the waters of the sea (Indian Ocean). In the subsequent season, flushing time is coming along with increased rainfall is accompanied by the increase in the relative abundance (KR) of potential phytoplankton as HABs. It is shown from the calculation of % KR phytoplankton HABs (Figures 2 and 3).
In season (M3) with 658 mm rainfall, which is supporting the abundance of phytoplankton of (6618,86 ± 3650,68) indv / L, has KR HABs potential of 27.78% of total phytoplankton. Furthermore, the increased rainfall reached 968 mm. at
(M4), with phytoplankton abundance only at the range of (5685.43 ± 2075.74) invd / L, but it supports the highest KR HABs of 31.84% of total phytoplankton. Furthermore, the decreased rainfall reaching 483 mm, went with the decrease of phytoplankton abundance to (4129,71 ± 3139,88) indv / L and KR HABs was only about 10,27%.
The result of the research showed that the high potency of phytoplankton HABs in the SAL region, occurred in the rainy season. Eutrophication is possible to happen in the rainy season and the rainfall affected runoffs subsequently give contribution to the spatial-temporal distribution patterns of types of phytoplankton, especially HABs in tropics [24, 25]. In other hand, in the dry season, there is an increase in sea water temperature producing rising nutrients from the bottom to the water column above it. The main source of eutrophication phenomena comes from wastes on the land, supported by seasonal changes, resulting in blooming of phytoplankton
The dynamics of phytoplankton abundance are affected by the ecological conditions of the waters, and the community of it, is controlled by dominanting species, showing the strength of the species against other species (blooming). These conditions bring important change to the ecological community [23]. But so far, there is no clear threshold regarding to quantity of phytoplankton at the time of the blooming. Further that the condition of phytoplankton blooming, can occur when the quantity of abundance can be much more than the averaged quantity of phytoplankton per month [19].
The excessive macronutrient accumulation in waters (eutrophication), derived from wastes on the land and seasonal changes leading to blooming of phytoplankton [24]. This is due to phytoplankton being able to show the tolerance of aquatic instability, by responding quickly to the entrance of pollutants in aquatic bodies [8, 15]. Explosive population of blooming of phytoplankton can happen in non-toxic (productive) phytoplankon as well as on phytoplankton species which are capable of producing toxin HABs [22].
The result of measurement of dissolved oxygen content (DO) with a temporal approach (time series) is ranged from 2.03 to 5.40 mg / L with an annual average of 3.20 mg / L (Table 2). The low DO at (M4) is due to the relative abundance of HABs of (31.84%). The use of macronutrients by potentially toxin-containing phytoplankton (HABs), can lead to anoxia, ie the decreased and even dissolved oxygen (DO) loss in water bodies, thus, negatively impacting degradation of waters. Another impact from phytoplankton blooming is also shown after mass death, which will be described by bacteria, this process requires high oxygen consumption, resulting in dissolved oxygen concentrations depleted, resulting in conditions (anoxia) or oxygen depletion in waters [19, 22]
4 Conclusion
What to be paying attentiont for the relative abundance (KR) of HABs in the Area of Segara Anakan Lagoon area during the study period, averaged 22.28% of the total phytoplankton abundance, with proportions: (M1) 22.22% (13 species); (M2) 18.18% (5 species); (M3): 27.78% (4 species); (M4): 31.84% (7 species); (M5) 10.27% (7 species) of the total identified phytoplankton each season. Patterns show with increasing rainfall will be accompanied by increased relative abundance
10
E3S Web of Conferences 47, 04010 (2018) https://doi.org/10.1051/e3sconf/20184704010SCiFiMaS 2018
of phytoplankton potentially as HABs, and vice versa. Spatially, stations with anthropogenic activity characteristics also support high phytoplankton potential HABs. This indicates that the whole research station contains many organic materials that can be transformed into nutrients, which are then fully utilized by potentially HABs as phytoplankton. However, it should be noted that the dominance of phytoplankton group capable of adaptation to environmental conditions with the content high of organic material macronutrients, will contribute to the occurrence of eutrophication phenomenon
References
1. American Public Healt Assosciatin (APHA). Standart methods for the examination of water and waste water. 21th Edition. Edited by: Andrew. D Eaton, Lenore.S Clesceri, Eugene.W Rice, Arnold. E Greenberg. Centennial Edition (2005).
2. Aryawati, R., D.G Bengen, T. Prartomo, H. Zulkifli. Harmful Algal in Banyuasin Coastal Water, South Sumatra. Biosaintifika. Journal of Biology and Biology Education. UNNES. 8(2) (2016).
3. Ayuningsih, M.S, I.B. Hendrart and P.W. Purnomo. Distribution and Abundance of Phytoplankton and Chorophyll-a in the Sekumbu Bay JeparaRegency: Relationship with Nitrate and Phosphate Content in Water. Diponegoro Journal Of Maquares. Manajement Of Aquatic Resources. 3(2): 138-147 (2014).
4. Ardli, E.R., and M. Wolff. Land use and land cover change affecting habitat distribution at Segara Anakan lagoon, Cilacap, Indonesia. Reg. Environmental Change. 9: 235-243 (2009b).
5. Arinardi, O.H., A.B. Sutomo., S.A Yusuf., Trimaningsih, Asnaryanti, dan Riyono S.H. Kisaran Kelimpahan dan Komposisi Plankton Predominan di Perairan Kawasan Timur Indonesia. LIPI - Pusat Penelitian Oseanografi, Jakarta. 140 hlm (1997).
6. Basmi, J. Planktonologi: Bioekologi Plankton Algae. Fakultas Perikanan dan Ilmu Kelautan, Institut Pertanian Bogor (1999a).
7. Carolita, I, E. Parwati, B. Trisakti, T. Kartika dan G.Nugroho. Pendekatan prediksi perubahan lingkungan di Kawasan Perairan Segara Anakan. Pertemuan Ilmiah Tahunan MAPIN XIV. Pemanfaatan efektif penginderaan jauh untuk peningktan kesejahteraan bangsa. Institut Teknologi Sepuluh Nopember, Surabaya (2005).
8. Coutinho, M.T., A. C. Brito., P. Pereira., A.S. Gonçalves and M.T Moita. A phytoplankton tool for water quality assessment in semi-enclosed coastal lagoons: Open vs closed regimes. Journal Estuarine, Coastal and Shelf Science. 110: 134-146 (2012).
9. Dewi, R., M. Zainuri., S. Anggoro., dan T. Winanto. Analisis Perubahan Lahan Kawasan Laguna Segara Anakan Selama Periode Waktu (1978 – 2016) Menggunakan Satelit Landsat Multitemporal. Jurnal Omni Akuatika. 12 (3) : 144-14, 2016. Research Article. ISSN: 1858-3873 print/ 2476-9347 online (2016).

11
E3S Web of Conferences 47, 04010 (2018) https://doi.org/10.1051/e3sconf/20184704010SCiFiMaS 2018
of phytoplankton potentially as HABs, and vice versa. Spatially, stations with anthropogenic activity characteristics also support high phytoplankton potential HABs. This indicates that the whole research station contains many organic materials that can be transformed into nutrients, which are then fully utilized by potentially HABs as phytoplankton. However, it should be noted that the dominance of phytoplankton group capable of adaptation to environmental conditions with the content high of organic material macronutrients, will contribute to the occurrence of eutrophication phenomenon
References
1. American Public Healt Assosciatin (APHA). Standart methods for the examination of water and waste water. 21th Edition. Edited by: Andrew. D Eaton, Lenore.S Clesceri, Eugene.W Rice, Arnold. E Greenberg. Centennial Edition (2005).
2. Aryawati, R., D.G Bengen, T. Prartomo, H. Zulkifli. Harmful Algal in Banyuasin Coastal Water, South Sumatra. Biosaintifika. Journal of Biology and Biology Education. UNNES. 8(2) (2016).
3. Ayuningsih, M.S, I.B. Hendrart and P.W. Purnomo. Distribution and Abundance of Phytoplankton and Chorophyll-a in the Sekumbu Bay JeparaRegency: Relationship with Nitrate and Phosphate Content in Water. Diponegoro Journal Of Maquares. Manajement Of Aquatic Resources. 3(2): 138-147 (2014).
4. Ardli, E.R., and M. Wolff. Land use and land cover change affecting habitat distribution at Segara Anakan lagoon, Cilacap, Indonesia. Reg. Environmental Change. 9: 235-243 (2009b).
5. Arinardi, O.H., A.B. Sutomo., S.A Yusuf., Trimaningsih, Asnaryanti, dan Riyono S.H. Kisaran Kelimpahan dan Komposisi Plankton Predominan di Perairan Kawasan Timur Indonesia. LIPI - Pusat Penelitian Oseanografi, Jakarta. 140 hlm (1997).
6. Basmi, J. Planktonologi: Bioekologi Plankton Algae. Fakultas Perikanan dan Ilmu Kelautan, Institut Pertanian Bogor (1999a).
7. Carolita, I, E. Parwati, B. Trisakti, T. Kartika dan G.Nugroho. Pendekatan prediksi perubahan lingkungan di Kawasan Perairan Segara Anakan. Pertemuan Ilmiah Tahunan MAPIN XIV. Pemanfaatan efektif penginderaan jauh untuk peningktan kesejahteraan bangsa. Institut Teknologi Sepuluh Nopember, Surabaya (2005).
8. Coutinho, M.T., A. C. Brito., P. Pereira., A.S. Gonçalves and M.T Moita. A phytoplankton tool for water quality assessment in semi-enclosed coastal lagoons: Open vs closed regimes. Journal Estuarine, Coastal and Shelf Science. 110: 134-146 (2012).
9. Dewi, R., M. Zainuri., S. Anggoro., dan T. Winanto. Analisis Perubahan Lahan Kawasan Laguna Segara Anakan Selama Periode Waktu (1978 – 2016) Menggunakan Satelit Landsat Multitemporal. Jurnal Omni Akuatika. 12 (3) : 144-14, 2016. Research Article. ISSN: 1858-3873 print/ 2476-9347 online (2016).
10. Dewi, R., M. Zainuri., S. Anggoro., T. Winanto.,and Endrawati, H. Characteristic and The distributtion of Spasio – Temporal Macronutrient in the Lagoon area of Segara Anakan. International Journal of Marine and Aquatic Resource Conservation and Co-existence. Research Article 2 (1): 51-57, October 2017. http://ejournal.undip.ac.id/index.php/ijmarcc (2017a).
11. Dewi, R., M. Zainuri., S. Anggoro., dan T. Winanto. Analisis Komposisi dan Kelimpahan Fitoplankton Secara Spasio-Temporal Kawasan Laguna Segara Anakan. Prosiding Seminar Nasional Tahunan XIV. Hasil Penelitian Perikanan dan Kelautan, 22 Juli 2017. Jilid II MSP. Departemen Perikanan, Fakultas Pertanian, UGM (2017b).
12. Dyer, K.R. Estuaries: A physical Introduction (2nd Edition), John Wiley and Sons, New York, 195 pp (2000).
13. Hallegraeff,G,M. Harmfull Algal Blooms : A Global Overview. In Hallegraeff,G,N, D.M Anderson, A.D Cambella, Editor. Manual on Harmfull Marine Microalgae. Franch: UNESCO Publishing.p. 1-22 (1995a).
14. Holterman P, Burchard H, and Jennerjahn T.C. Hydrodynamic of The Segara Anakan lagoon. Regional Environmental Change 9 (4), 245 – 258 (2009).
15. Jennerjahn, T.C., Holtermann., I. Pohlenga and B. Nasir. Environmental Conditions in The Segara Anakan Lagoon, Java, Indonesia. Synopsis of Ecological and Socio- Economic Aspect of Tropical Coastal Ecosystem With Special Reference to Segara Anakan (2007a).
16. Jennerjahn, T.C., B. Nasir, and I. Pohlenga. Spatio-temporal variation of dissolved inorganic nutrients related to hydrodynamics and land use in the mangrove-fringed Segara Anakan Lagoon, Java, Indonesia. Reg Environ Change 9:259–274 (2009).
17. Lagus, A., J. Suomela., G. Weithoff., K. Heikkila., H. Helminen., dan J. Sipura. Species- specific Differences in Phytoplankton Responses to N and P Enrichment and The N : P ratio in The Archipelago Sea, Northern Baltic Sea. J. Plankt. Res. 26 : 779-798. Doi : 10.1093/plankt/fbh070 (2004).
18. Livingston, R.J. Eutrophication Processes in Coastal Systems. Origin and Succession of Plankton Blooms and Effect on Secondary Production in Gulf Coast Estuaries.. CRC Press LLC. Marine Science Series Boca Raton. Printed in the United State of America. ISBN. 0-8493-9062-1. Pp 327 (2001).
19. Mulyasari, R. Peranginangin, Th. D. Suryaningrum, dan A. Sari. Penelitian Mengenai Keberadaan Biotoksin pada Biota dan Lingkungan Perairan Teluk Jakarta. Jurnal Penelitian Perikanan Indonesia. 9(5): 39-64 (2003).
20. Newell, G.E and R.C Newell. Marine Plankton, A Practical Guide. Hutchinson of London. 244 hal (1993).
21. Nontji, A. Tiada Kehidupan di Bumi Tanpa Keberadaan Plankton. LIPI-Pusat Penelitian Oseanografi, Jakarta (2006).
22. Nontji, A. Plankton Laut. Jakarta: Lembaga Ilmu Pengetahuan Indonesia. LIPI Press. Jakarta. ISBN: 978-979-799-085-5. 331 Hlm (2008).
23. Odum, E.P. Fundamental of Ecology. (3rd edition).W.B. Saunders Co (1971a).
12
E3S Web of Conferences 47, 04010 (2018) https://doi.org/10.1051/e3sconf/20184704010SCiFiMaS 2018
24. Panggabean, L.M.G. “Red Tide” di Indonesia.: Perlukah Diwaspadai? Oseana. 19(1):33-38 (1994).
25. Parslow, J.J. Hunter and A. Davidson. Estuarine Eutrophication Model. Final Report Project E6 National River Health Program Water Services Association of Australian Melbourne Australian. CSIRO Marine Research. Hobarth, Tasmania (2008).
26. Pednekar, S.M, S.G.P, Matondkar and V. Kerkar. Spatio Temporal Distribution of Harmfull Alga Florain The Tropical Estuarine Complex of Goa, India. The Scientific World. 2012: 11. P.doi : 10.1100/2012/592676 (2012).
27. Pintado, J. G., M.M. Mena, G.G. Barbéra., J. Albaladejo and V.M. Castillo. Anthropogenic Nutrient Sources and Loads From a Mediterranean Catchment into a Coastal Lagoon: Mar Menor, Spain. Science of the Enviroment. 373:220-239 (2007).
28. Praseno, D.P dan Sugestiningsih. Red tide di Perairan Indonesia. Pusat Penelitian dan Pengembangan Oseanografi-LIPI. Jakarta. 82 hlm. 2-34 (2000).
29. Sachlan, M. Planktonologi. Fakultas Perikanan dan Ilmu Kelautan Universitas Diponegoro (1982).
30. Sidabutar, T. Red tide phenomenon which can result in losses to the fisheries sector. Proceedings of the Annual National Seminar II Research and Marine Fisheries. Department of Fisheries and Marine Resources, Faculty of Agriculture, University of Gajah Mada, 114-126 (2006a).
31. Sidharta, B. R. The Current Status of Research on Harmfull Algal Bloom (HAB) in Indonesia. Jurnal of Coastal Development. Februari 2005, 8(2): 75-88. ISSN: 1410-5217 (2005).
32. Suryanti. Kajian Tingkat Saprobitas di Muara Sungai Morodemak pada saat Pasang dan Surut. Universitas Diponegoro. Semarang. Jurnal Saintek Perikanan. 4(1)2: 76-83, (2008).
33. Sze, P. A Biology of The Algae. Second Edition. Wm. C. Brown Publishers. ISBN 0-697-01373-1. 259 pp (1993).
34. Tomas, C,R,. Identifiying Marine Phytoplankton. Academic Press, United States Of America.ISBN 0-12-693018-X(Pbk:Alk.paper) (1997).
35. Vadrucci, M.R., E. Stanca., C. Mazzioti, N. Ungaro and A. Basset. Ability of Phytoplankton trait sensitivity to tighlight antropogenic pressures in Mediteranean lagoons:A size spectra sensitivity index (ISS-phyto). Ecological Indicators. 34: 113-125 (2013).
36. Zaaboub, N., A. Ounis., M. A Helali., B. Béjaoui., A.I. Lillebø., E.F. Silva and L. Aleya. Phosphorus Speciation in sediments and assessment of nutrient exchange at the water-sediment interface in a Mediterranean lagoon: Implications for management and restoration. Journal Ecological Engineering. 73: 115-125 (2014).


![Historic American Building Survey [HABS]](https://img.dokumen.tips/doc/110x75/577c80001a28abe054a6e902/historic-american-building-survey-habs.jpg)


