Embed Size (px)
Citation preview
22
Chapter 2
Potassium Intercalated Graphite
2.1 Introduction
Graphite intercalation compounds (GICs) are a unique class of lamellar materials formed
by the insertion of atomic or molecular guests between the layer planes of the host graphite.
Electrical, thermal and magnetic properties can be varied by intercalation, making these
materials interesting technologically. Graphite intercalation compounds exist for all alkali
metals, but only the K, Rb, and Cs compounds are known to adsorb hydrogen. The
maximum adsorption capacity of these materials is only around 1 wt%, but their high degree
of structural ordering makes them a model system for studying hydrogen adsorption in a
carbon nanostructure. They share many similarities with a chemically-modified carbon
slit-pore structure, and are readily synthesized. Due to the attractiveness of potassium as
a lightweight dopant for carbon adsorbents, potassium intercalated graphite is the focus of
this thesis.
2.2 History
Alkali metal GICs were first prepared by Fredenhagen and co-workers in the 1920’s with the
compositions C8M and C16M [43]. Further studies were carried out on the potassium com-
23
12
10
8
6
4
2
0
K/C
× 1
00
350300250200150100500Tgraphite- Tpotassium (°C)
KC8
KC24
KC36
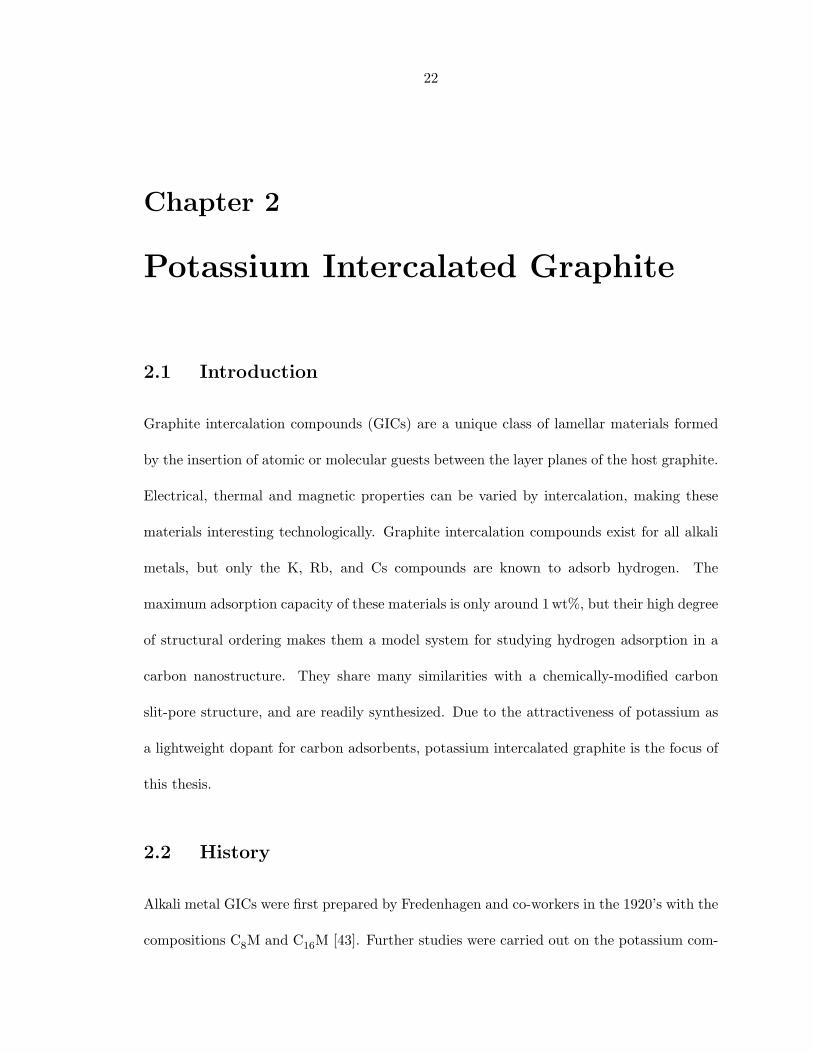
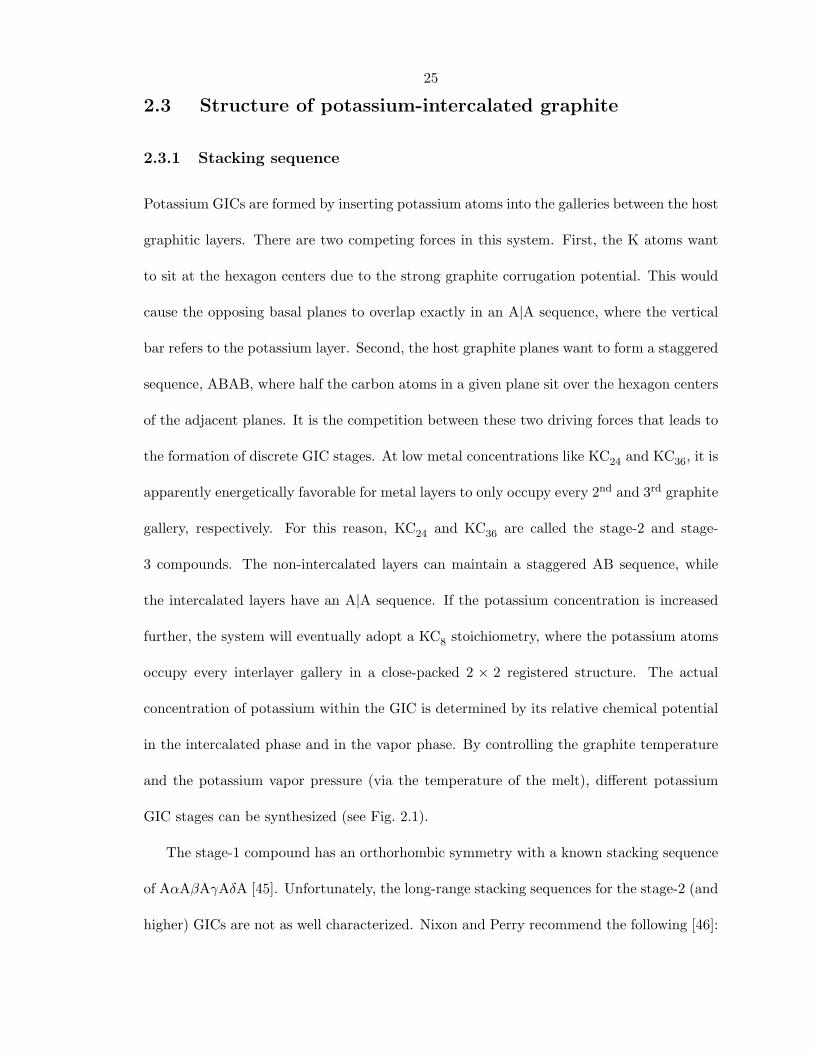
Figure 2.1: Composition of the potassium-graphite system based on the temperature differencebetween the graphite host and potassium vapor. Adapted from Ref. [44].
pound in the 1950’s by Herold, who developed a two-zone, vapor-phase synthesis technique
where the potassium melt was kept at a constant temperature (250 °C) while the graphite
temperature was varied (250 °C to 600 °C) [44]. Stoichiometric compounds of KC8 and KC24
are visible as plateaus in the potassium-graphite isobar illustrated in Fig. 2.1. Structural
studies of staging in potassium GICs were performed by Rudorff and Schulze [45]. Discrete
compositions of MC8, MC24, and MC36 were linked to the formation of stage 1, stage 2, and
stage 3 intercalation compounds, respectively. The staging index, n, of the GIC indicates
that the intercalant layer is found between every nth pair of host graphite planes. The stack-
ing sequences in the alkali-metal GICs were further characterized by Perry and Nixon in the
1960’s [46]. In the early 1960’s, Saehr and Herold discovered that KC8 chemisorbs hydrogen
at elevated temperatures up to maximum values of about KC8H0.67 [47]. Chemisorption
was also noted for RbC8 and KC24, but not for CsC8. Physisorption of H2 by the stage
2 compounds of K, Rb, and Cs at low temperatures was discovered by Tamaru and co-
24
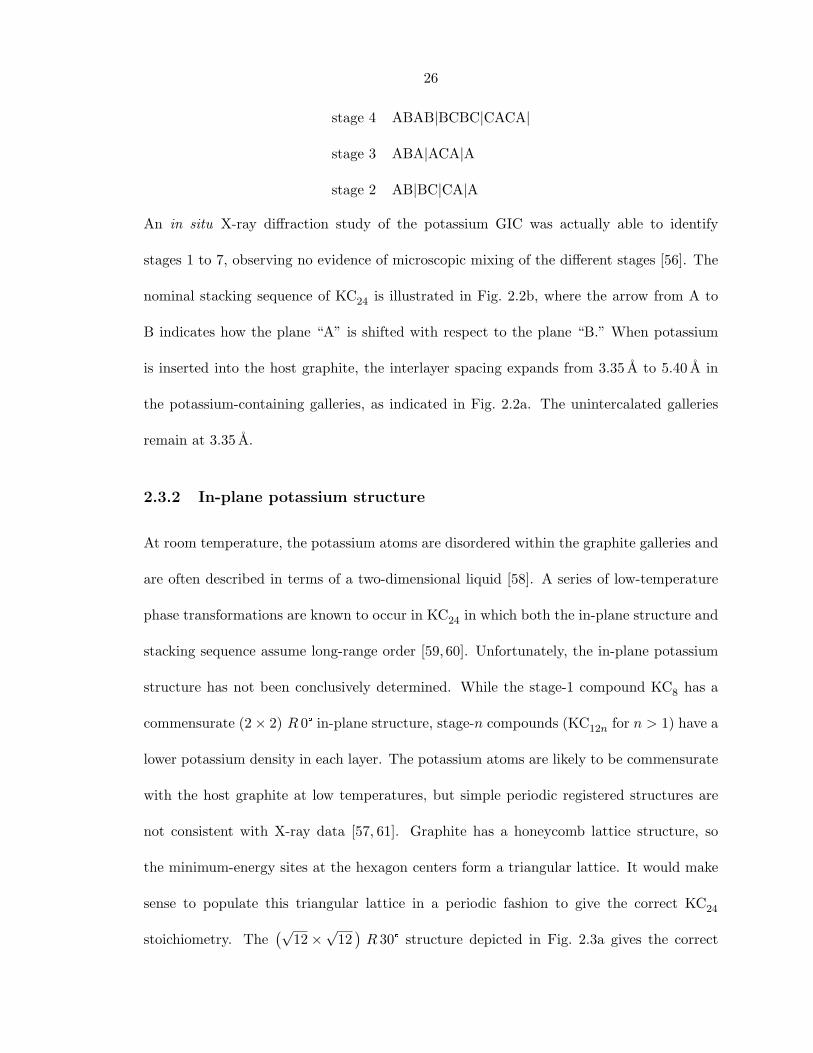
(a) Side view (b) Top view
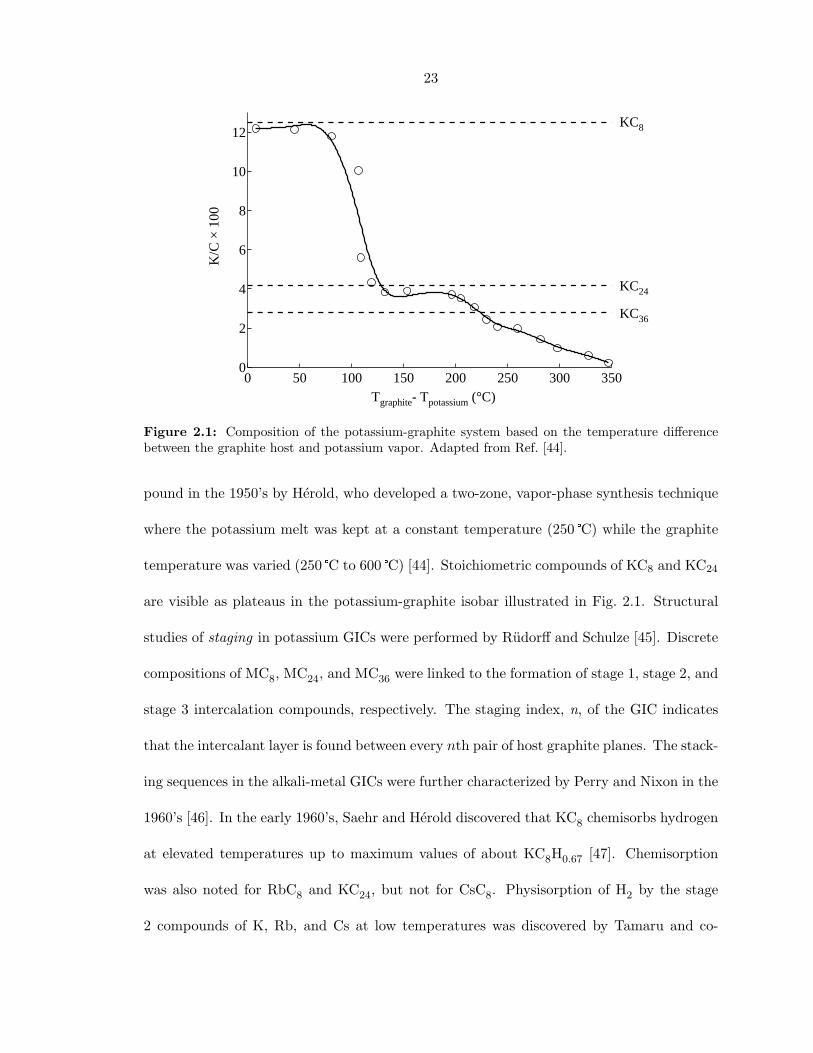
Figure 2.2: Structure of KC24. (a) The A|AB|BC|CA stacking sequence. (b) Possible in-planepotassium structure. Arrows from A�B�C describe the relative positions of the layer planes inthe stacking sequence.
workers in the early 1970s [48]. These measurements were reproduced by a number of
subsequent studies [49,50]. The first inelastic neutron scattering studies of H2 adsorbed in
the stage-2 alkali metals compounds were performed by White and co-workers in the early
1980’s [51]. Low-energy “rotational tunneling” peaks observed in the spectra indicated that
the adsorbed hydrogen was in a strong anisotropic field. They were explained in terms of
a one-dimensional hindered diatomic rotor model [52, 53]. By the late 1980’s, a substan-
tial body of research existed on hydrogen-alkali-metal graphite intercalation systems (see
Ref. [54] and [55] for reviews on this subject). Interest in the area dwindled during the
1990’s, as reflected in the small number of publications during the period. However with
the emergence of hydrogen storage materials as a major topic of research, there has been a
resurgence of interest in the hydrogen adsorption properties of the alkali-metal GICs.
25
2.3 Structure of potassium-intercalated graphite
2.3.1 Stacking sequence
Potassium GICs are formed by inserting potassium atoms into the galleries between the host
graphitic layers. There are two competing forces in this system. First, the K atoms want
to sit at the hexagon centers due to the strong graphite corrugation potential. This would
cause the opposing basal planes to overlap exactly in an A|A sequence, where the vertical
bar refers to the potassium layer. Second, the host graphite planes want to form a staggered
sequence, ABAB, where half the carbon atoms in a given plane sit over the hexagon centers
of the adjacent planes. It is the competition between these two driving forces that leads to
the formation of discrete GIC stages. At low metal concentrations like KC24 and KC36, it is
apparently energetically favorable for metal layers to only occupy every 2nd and 3rd graphite
gallery, respectively. For this reason, KC24 and KC36 are called the stage-2 and stage-
3 compounds. The non-intercalated layers can maintain a staggered AB sequence, while
the intercalated layers have an A|A sequence. If the potassium concentration is increased
further, the system will eventually adopt a KC8 stoichiometry, where the potassium atoms
occupy every interlayer gallery in a close-packed 2 × 2 registered structure. The actual
concentration of potassium within the GIC is determined by its relative chemical potential
in the intercalated phase and in the vapor phase. By controlling the graphite temperature
and the potassium vapor pressure (via the temperature of the melt), different potassium
GIC stages can be synthesized (see Fig. 2.1).
The stage-1 compound has an orthorhombic symmetry with a known stacking sequence
of AαAβAγAδA [45]. Unfortunately, the long-range stacking sequences for the stage-2 (and
higher) GICs are not as well characterized. Nixon and Perry recommend the following [46]:
26
stage 4 ABAB|BCBC|CACA|
stage 3 ABA|ACA|A
stage 2 AB|BC|CA|A
An in situ X-ray diffraction study of the potassium GIC was actually able to identify
stages 1 to 7, observing no evidence of microscopic mixing of the different stages [56]. The
nominal stacking sequence of KC24 is illustrated in Fig. 2.2b, where the arrow from A to
B indicates how the plane “A” is shifted with respect to the plane “B.” When potassium
is inserted into the host graphite, the interlayer spacing expands from 3.35 A to 5.40 A in
the potassium-containing galleries, as indicated in Fig. 2.2a. The unintercalated galleries
remain at 3.35 A.
2.3.2 In-plane potassium structure
At room temperature, the potassium atoms are disordered within the graphite galleries and
are often described in terms of a two-dimensional liquid [58]. A series of low-temperature
phase transformations are known to occur in KC24 in which both the in-plane structure and
stacking sequence assume long-range order [59, 60]. Unfortunately, the in-plane potassium
structure has not been conclusively determined. While the stage-1 compound KC8 has a
commensurate (2× 2) R 0° in-plane structure, stage-n compounds (KC12n for n > 1) have a
lower potassium density in each layer. The potassium atoms are likely to be commensurate
with the host graphite at low temperatures, but simple periodic registered structures are
not consistent with X-ray data [57, 61]. Graphite has a honeycomb lattice structure, so
the minimum-energy sites at the hexagon centers form a triangular lattice. It would make
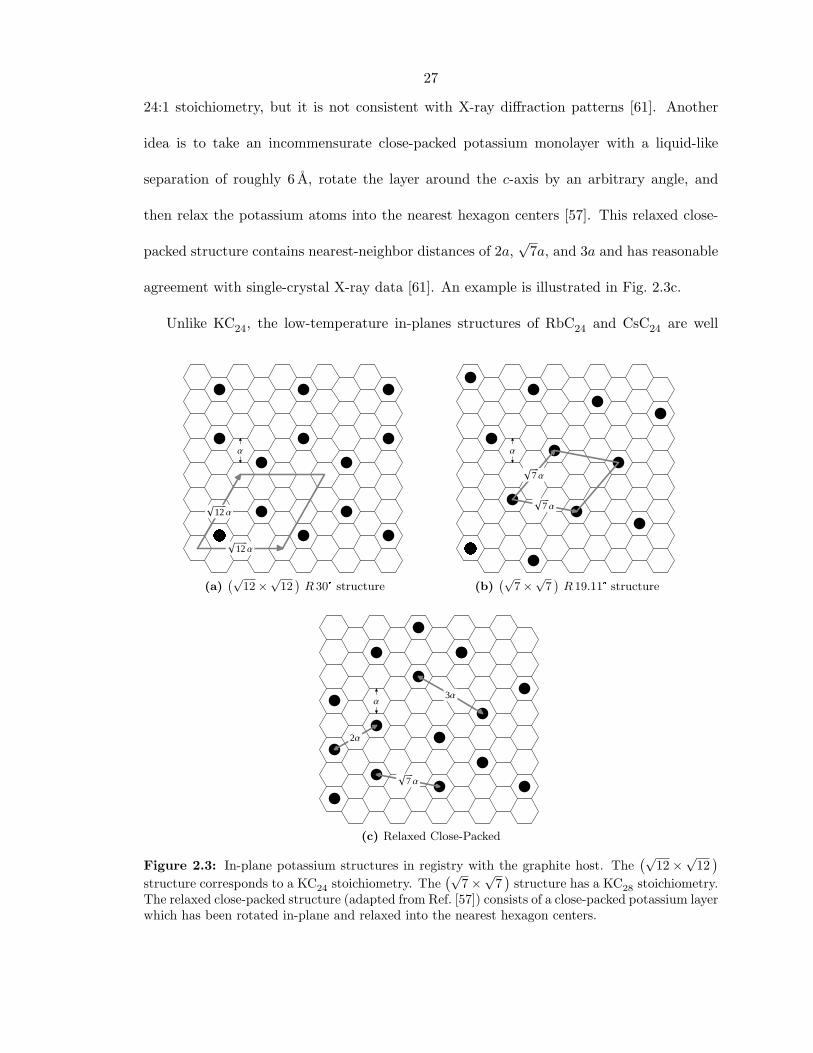
sense to populate this triangular lattice in a periodic fashion to give the correct KC24
stoichiometry. The(√
12×√
12)R 30° structure depicted in Fig. 2.3a gives the correct
27
24:1 stoichiometry, but it is not consistent with X-ray diffraction patterns [61]. Another
idea is to take an incommensurate close-packed potassium monolayer with a liquid-like
separation of roughly 6 A, rotate the layer around the c-axis by an arbitrary angle, and
then relax the potassium atoms into the nearest hexagon centers [57]. This relaxed close-
packed structure contains nearest-neighbor distances of 2a,√
7a, and 3a and has reasonable
agreement with single-crystal X-ray data [61]. An example is illustrated in Fig. 2.3c.
Unlike KC24, the low-temperature in-planes structures of RbC24 and CsC24 are well
�!!!!!!12 Α
�!!!!!!12 Α
Α
(a)(√
12×√
12)R 30° structure
�!!!!7 Α
�!!!!7 Α
Α
(b)(√
7×√
7)R 19.11° structure
2Α
3Α
�!!!!7 Α
Α
(c) Relaxed Close-Packed
Figure 2.3: In-plane potassium structures in registry with the graphite host. The(√
12×√
12)
structure corresponds to a KC24 stoichiometry. The(√
7×√
7)
structure has a KC28 stoichiometry.The relaxed close-packed structure (adapted from Ref. [57]) consists of a close-packed potassium layerwhich has been rotated in-plane and relaxed into the nearest hexagon centers.
28
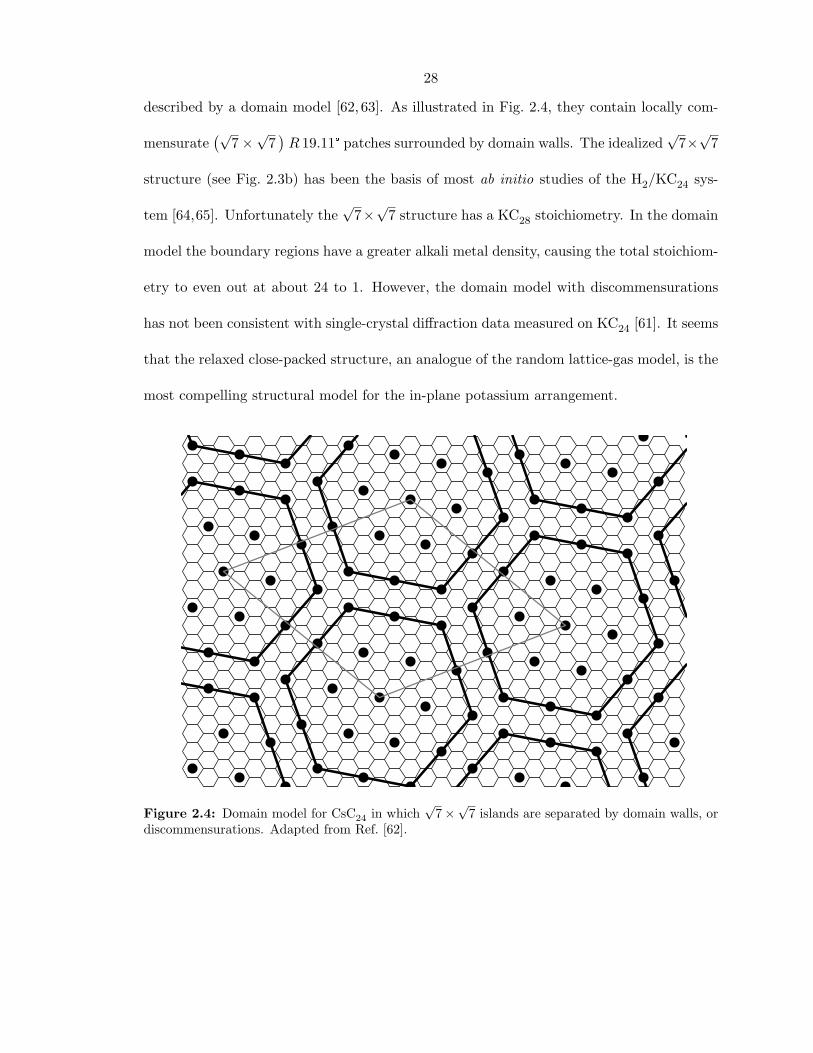
described by a domain model [62, 63]. As illustrated in Fig. 2.4, they contain locally com-
mensurate(√
7×√
7)R 19.11° patches surrounded by domain walls. The idealized
√7×√
7
structure (see Fig. 2.3b) has been the basis of most ab initio studies of the H2/KC24 sys-
tem [64,65]. Unfortunately the√
7×√
7 structure has a KC28 stoichiometry. In the domain
model the boundary regions have a greater alkali metal density, causing the total stoichiom-
etry to even out at about 24 to 1. However, the domain model with discommensurations
has not been consistent with single-crystal diffraction data measured on KC24 [61]. It seems
that the relaxed close-packed structure, an analogue of the random lattice-gas model, is the
most compelling structural model for the in-plane potassium arrangement.
Figure 2.4: Domain model for CsC24 in which√
7×√
7 islands are separated by domain walls, ordiscommensurations. Adapted from Ref. [62].
29
2.4 Properties of potassium-intercalated graphite
Graphite is a semi-metal with a complex band structure. It has only about 10−4 charge
carriers per carbon atom. Alkali metal GICs, like KC24, are classified as donor compounds
because the metal atoms donate charge to the graphite conduction band. This results in a
large increase in both the in-plane conductivity (σa) and c-axis conductivity (σc). Due to
the layered structure of GICs, there is also considerable anisotropy in the charge transport
properties. For KC24, the c-axis conductivity is about 24 times larger than for pristine
graphite, and the anisotropy factor σa/σc is about 860 [66]. Partial charge transfer from
potassium to the empty graphite bands appears to be experimentally established [67].
Hydrogen physisorption in KC24, RbC24, and CsC24 has been previously investigated
[48]. The Li and Na compounds do not physisorb hydrogen because the widths of the
metal-containing galleries are too small. Notably, KC24 has molecular sieving properties in
which it adsorbs smaller molecules (e.g., hydrogen), but does not adsorb larger molecules
(e.g. methane). Quantum sieving effects are also present in KC24, in which D2 is adsorbed
preferentially over H2 [50]. The hydrogen adsorption characteristics depend on the quality
of the starting graphite. The best adsorption is obtained for high purity, natural flake crys-
talline graphite. As the amount of amorphous impurities in the starting graphite increases,
the H2 adsorption amount decreases [68].
Hydrogen is adsorbed into the metal-containing layers of KC24, forming a quasi-two-
dimensional binary solution with potassium. There is no evidence for anything other than
a monolayer structure in which the potassium and H2 are mixed. The potassium-containing
layer expands from 5.4 A to 5.6 A following hydrogen adsorption. This is an interlayer ex-
pansion of almost 5 %, which is surprisingly large, but is still too small to support a bilayer or
30
trilayer H2-K-H2 structure. There is also no evidence for H2 dissociation during physisorp-
tion, as verified by a chromatographic analysis of an H2/D2 mixture [48]. It is unclear
whether the potassium superstructure is rigid, or whether it undergoes rearrangement after
the introduction of hydrogen.
Interactions between hydrogen and KC24 are likely to have both dispersion and elec-
trostatic components. Charge transfer from potassium to graphite results in a strongly
polarized potential field which can have significant charge-quadrupole and charge-induced-
dipole interactions with the adsorbed H2 molecules. However, charge density surrounding
the potassium atoms, and present in the bounding graphite layers, can also lead to an
enhanced dispersion interaction with the H2 molecule. Computational studies report an
enhancement of the energy for the H2 interaction with an alkali-doped graphene surface,
due largely to the increased electron density on the surface surrounding the alkali impu-
rity [39, 69]. The reported H2 isosteric heat on KC24 is 8.4 kJ mol−1, about twice as large
as for adsorption on bare graphite [48]. It is also known that the in-plane resistivity in
KC24(H2)x is larger than in KC24 [55]. This is explained by the observed c-axis expansion,
which effectively reduces the in-plane carrier density. Charge back-donation from the con-
ducting π bands to the hydrogen σ∗ anti-bonding orbital seems unlikely and has not been
conclusively demonstrated [54,55].
2.5 Synthesis of KC24 samples
Samples of KC24 used in this work were synthesized using a modified single-temperature-
zone technique. The starting materials were thermally purified natural flake graphite (Su-
perior Graphite Co., 99.95–99.99% purity, 50 mesh) and potassium metal (Alfa Aesar,
99.9%). Since the starting graphite had already been subject to a high-temperature purifi-
31
(a) Grafoil (b) Flake graphite
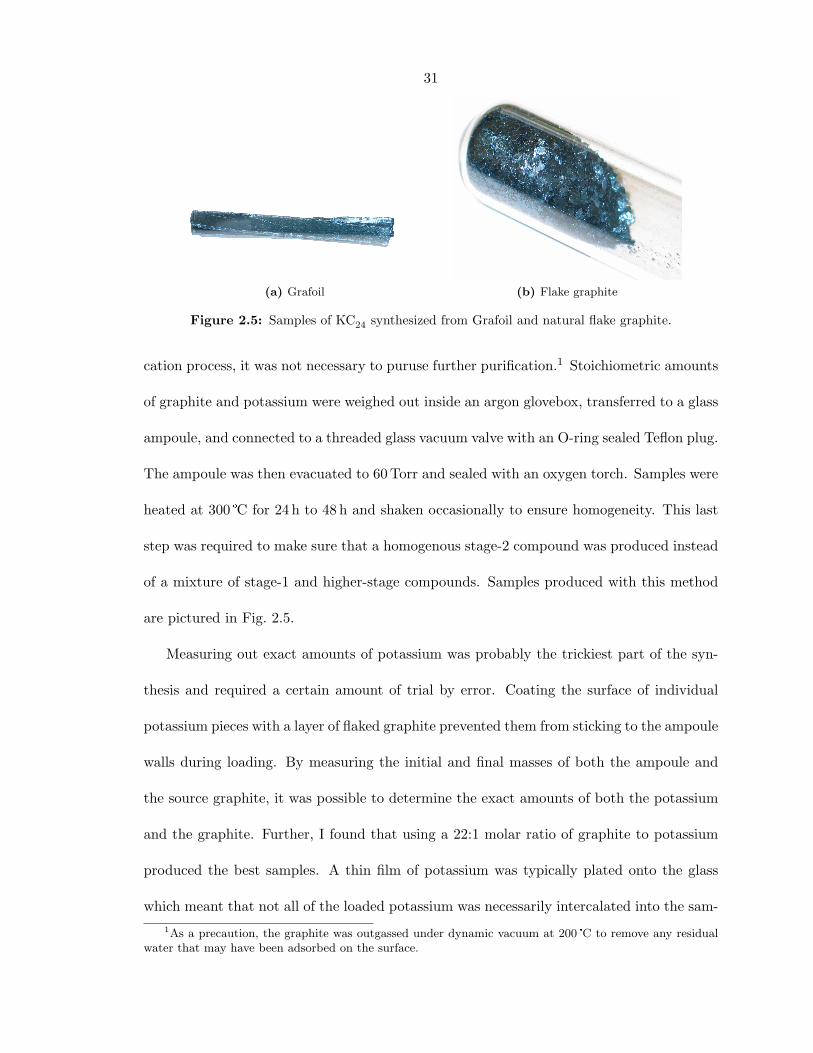
Figure 2.5: Samples of KC24 synthesized from Grafoil and natural flake graphite.
cation process, it was not necessary to puruse further purification.1 Stoichiometric amounts
of graphite and potassium were weighed out inside an argon glovebox, transferred to a glass
ampoule, and connected to a threaded glass vacuum valve with an O-ring sealed Teflon plug.
The ampoule was then evacuated to 60 Torr and sealed with an oxygen torch. Samples were
heated at 300 °C for 24 h to 48 h and shaken occasionally to ensure homogeneity. This last
step was required to make sure that a homogenous stage-2 compound was produced instead
of a mixture of stage-1 and higher-stage compounds. Samples produced with this method
are pictured in Fig. 2.5.
Measuring out exact amounts of potassium was probably the trickiest part of the syn-
thesis and required a certain amount of trial by error. Coating the surface of individual
potassium pieces with a layer of flaked graphite prevented them from sticking to the ampoule
walls during loading. By measuring the initial and final masses of both the ampoule and
the source graphite, it was possible to determine the exact amounts of both the potassium
and the graphite. Further, I found that using a 22:1 molar ratio of graphite to potassium
produced the best samples. A thin film of potassium was typically plated onto the glass
which meant that not all of the loaded potassium was necessarily intercalated into the sam-1As a precaution, the graphite was outgassed under dynamic vacuum at 200 °C to remove any residual
water that may have been adsorbed on the surface.
32
15x103
10
5
0
Cou
nts
9080706050403020102θ (degrees)
1.522.534568 1.25
d-spacing (Å)
[001
] 8.
79 Å
[002
] 4.
38 Å
[003
] 2.9
1 Å
[004
] 2.
18 Å
[005
] 1.7
5 Å
[006
] 1.
45 Å
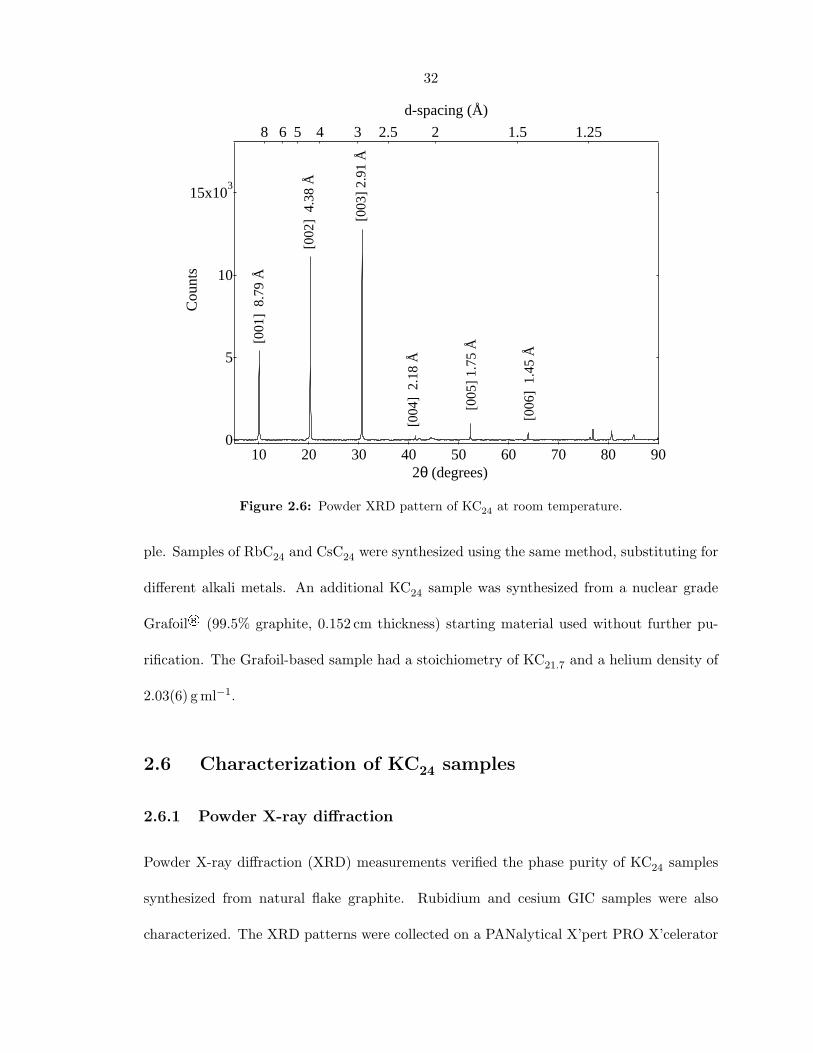
Figure 2.6: Powder XRD pattern of KC24 at room temperature.
ple. Samples of RbC24 and CsC24 were synthesized using the same method, substituting for
different alkali metals. An additional KC24 sample was synthesized from a nuclear grade
Grafoil® (99.5% graphite, 0.152 cm thickness) starting material used without further pu-
rification. The Grafoil-based sample had a stoichiometry of KC21.7 and a helium density of
2.03(6) g ml−1.
2.6 Characterization of KC24 samples
2.6.1 Powder X-ray diffraction
Powder X-ray diffraction (XRD) measurements verified the phase purity of KC24 samples
synthesized from natural flake graphite. Rubidium and cesium GIC samples were also
characterized. The XRD patterns were collected on a PANalytical X’pert PRO X’celerator
33
300
250
200
150
100
50
0
Cou
nts
per
seco
nd
1009080706050403020102θ (degrees)
1.251.522.534568d-spacing (Å)
KC36
KC24
KC8
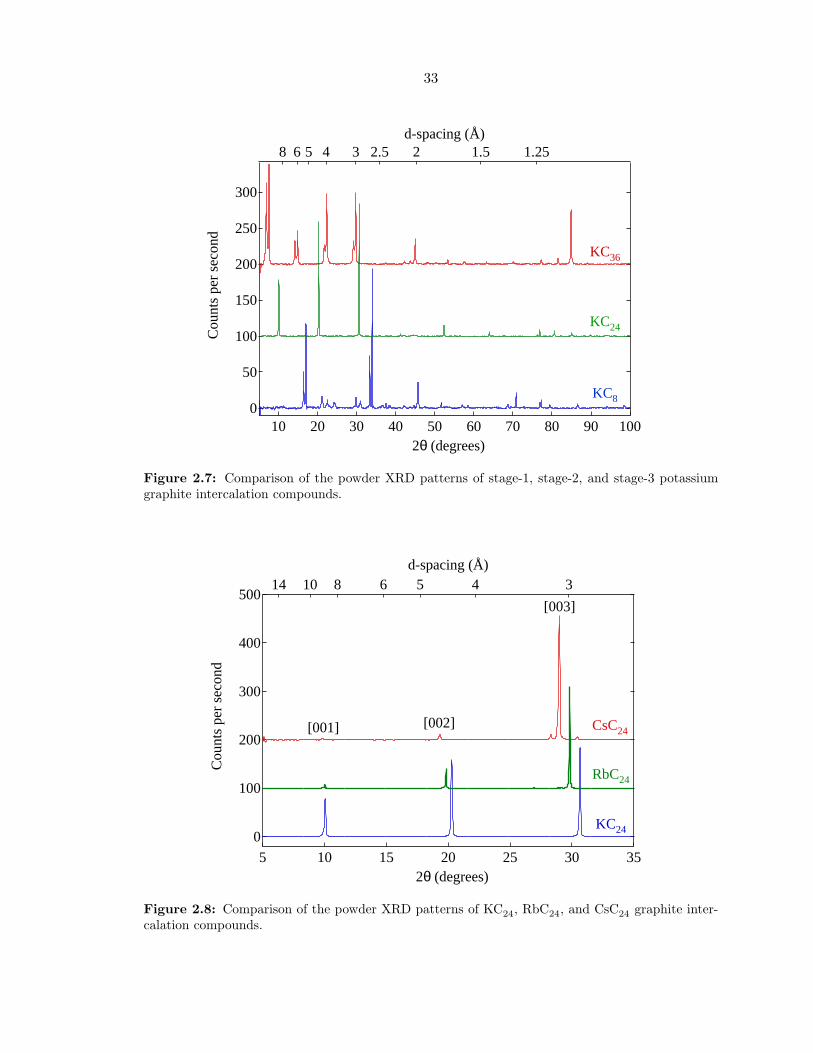
Figure 2.7: Comparison of the powder XRD patterns of stage-1, stage-2, and stage-3 potassiumgraphite intercalation compounds.
500
400
300
200
100
0
Cou
nts
per
seco
nd
35302520151052θ (degrees)
345681014d-spacing (Å)
[001] [002]
[003]
KC24
CsC24
RbC24
Figure 2.8: Comparison of the powder XRD patterns of KC24, RbC24, and CsC24 graphite inter-calation compounds.
34
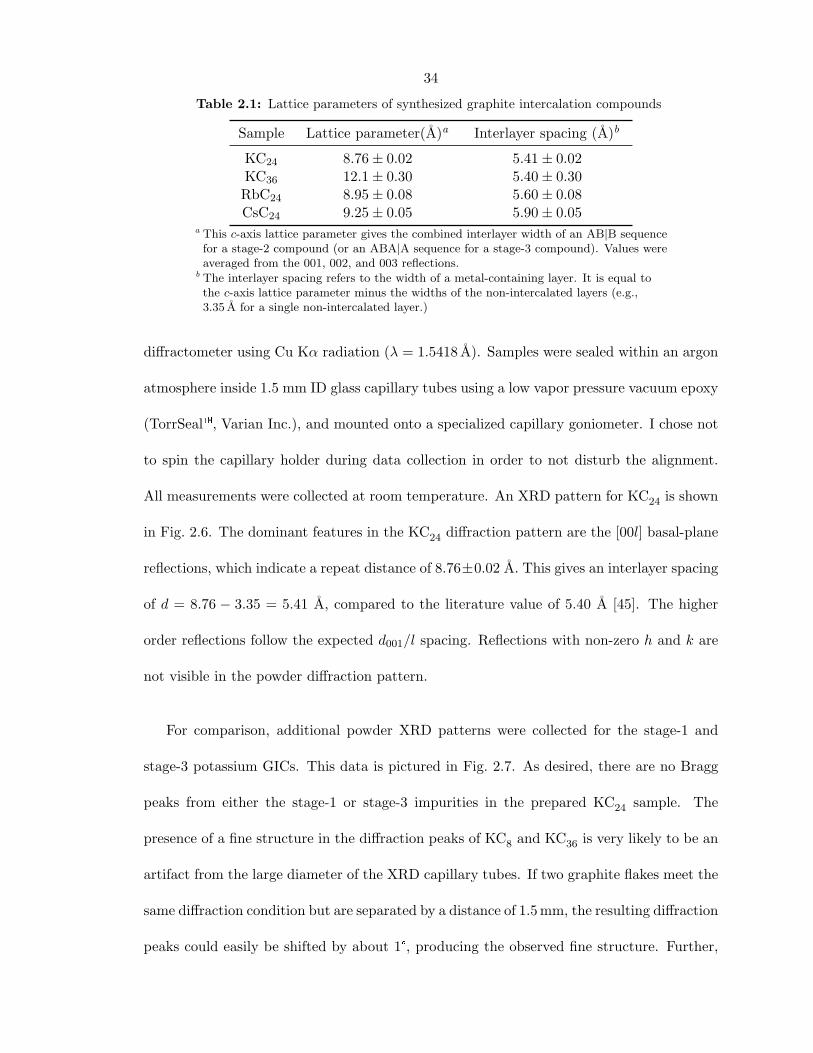
Table 2.1: Lattice parameters of synthesized graphite intercalation compounds
Sample Lattice parameter(A)a Interlayer spacing (A)b
KC24 8.76± 0.02 5.41± 0.02KC36 12.1± 0.30 5.40± 0.30RbC24 8.95± 0.08 5.60± 0.08CsC24 9.25± 0.05 5.90± 0.05
a This c-axis lattice parameter gives the combined interlayer width of an AB|B sequencefor a stage-2 compound (or an ABA|A sequence for a stage-3 compound). Values wereaveraged from the 001, 002, and 003 reflections.
b The interlayer spacing refers to the width of a metal-containing layer. It is equal tothe c-axis lattice parameter minus the widths of the non-intercalated layers (e.g.,3.35 A for a single non-intercalated layer.)
diffractometer using Cu Kα radiation (λ = 1.5418 A). Samples were sealed within an argon
atmosphere inside 1.5 mm ID glass capillary tubes using a low vapor pressure vacuum epoxy
(TorrSeal�, Varian Inc.), and mounted onto a specialized capillary goniometer. I chose not
to spin the capillary holder during data collection in order to not disturb the alignment.
All measurements were collected at room temperature. An XRD pattern for KC24 is shown
in Fig. 2.6. The dominant features in the KC24 diffraction pattern are the [00l] basal-plane
reflections, which indicate a repeat distance of 8.76±0.02 A. This gives an interlayer spacing
of d = 8.76 − 3.35 = 5.41 A, compared to the literature value of 5.40 A [45]. The higher
order reflections follow the expected d001/l spacing. Reflections with non-zero h and k are
not visible in the powder diffraction pattern.
For comparison, additional powder XRD patterns were collected for the stage-1 and
stage-3 potassium GICs. This data is pictured in Fig. 2.7. As desired, there are no Bragg
peaks from either the stage-1 or stage-3 impurities in the prepared KC24 sample. The
presence of a fine structure in the diffraction peaks of KC8 and KC36 is very likely to be an
artifact from the large diameter of the XRD capillary tubes. If two graphite flakes meet the
same diffraction condition but are separated by a distance of 1.5 mm, the resulting diffraction
peaks could easily be shifted by about 1°, producing the observed fine structure. Further,
35
14x103
12
10
8
6
4
2
0
Cou
nts
1700 1600 1500 1400 1300Raman Shift (cm
-1)
Graphite
KC8
KC24
KC36
1580 cm-1
1600 cm-1
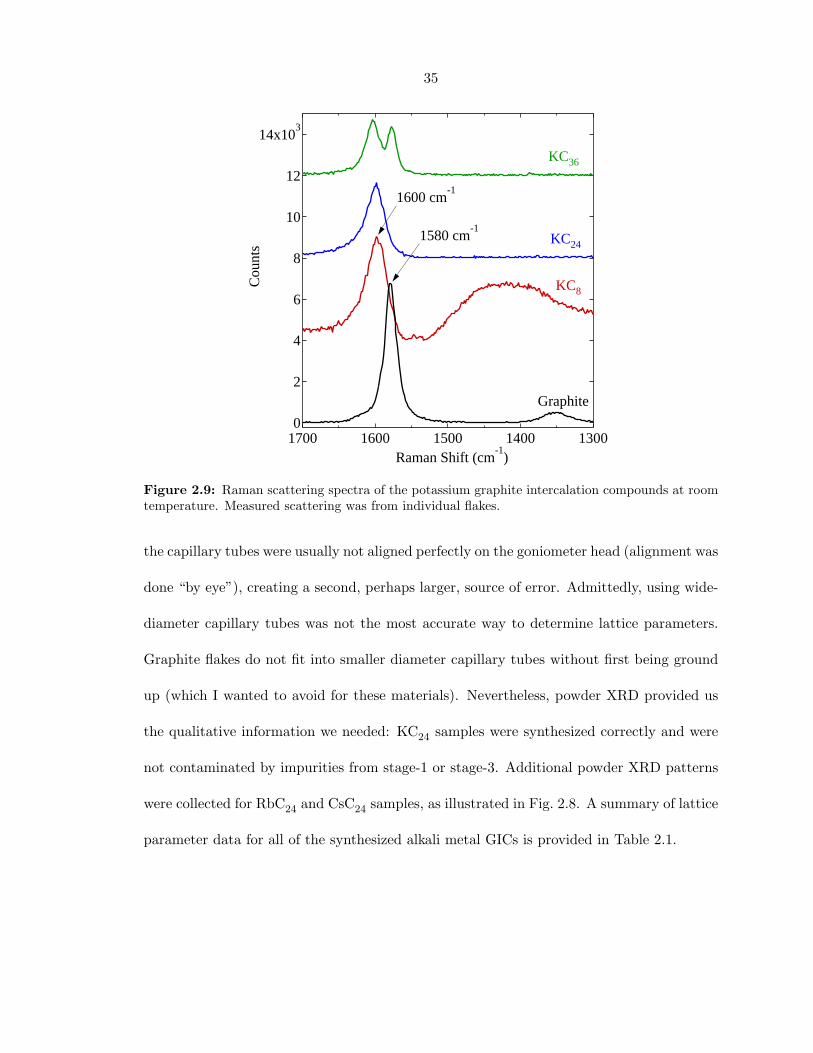
Figure 2.9: Raman scattering spectra of the potassium graphite intercalation compounds at roomtemperature. Measured scattering was from individual flakes.
the capillary tubes were usually not aligned perfectly on the goniometer head (alignment was
done “by eye”), creating a second, perhaps larger, source of error. Admittedly, using wide-
diameter capillary tubes was not the most accurate way to determine lattice parameters.
Graphite flakes do not fit into smaller diameter capillary tubes without first being ground
up (which I wanted to avoid for these materials). Nevertheless, powder XRD provided us
the qualitative information we needed: KC24 samples were synthesized correctly and were
not contaminated by impurities from stage-1 or stage-3. Additional powder XRD patterns
were collected for RbC24 and CsC24 samples, as illustrated in Fig. 2.8. A summary of lattice
parameter data for all of the synthesized alkali metal GICs is provided in Table 2.1.
36
2.6.2 Raman spectroscopy
Raman spectroscopy was used as an alternative method of verifying the phase purity of
prepared KC24 samples. Measurements were collected on Renishaw M1000 Micro-Raman
spectrometer, operating at 1 cm−1 spectral resolution with a 514.5 nm argon laser. Samples
were sealed in 1.5 mm glass capillary tubes and data was collected at room temperature.
Data for KC8, KC24, and KC36 are displayed in Fig. 2.9. The peak at around 1600 cm−1
is typically assigned to the E2g2 mode of graphite where the graphite layer is bounded by
an intercalant layer on one side and a graphite layer on the other side [70]. The peak near
1580 cm−1 is typically assigned to an E2g2 mode where the layer is bounded on both sides
by a graphite plane. As expected, the 1580 cm−1 mode is present for pristine graphite and
for KC36 (which contains an intercalant layer in every third gallery). The 1600 cm−1 mode
is present as expected in both the KC24 and KC36 spectra, though it is unclear why it is
also present in KC8 (which contains an intercalant in every layer).
2.6.3 Neutron diffraction
Neutron diffraction work on a D2/KC24 system was performed at the NPDF beamline at
the Lujan Center, located at the Los Alamos National Laboratory.2 Approximately 1 g of
powder was loaded into a leak-tight vanadium sample can with an attached capillary line
for dosing with D2 gas. The diffraction pattern of KC24 without D2 was measured at both
298 K and 35 K. Interestingly, there is no notable difference in these two diffraction patterns
except for small shifts due to thermal expansion.3 Deuterium gas was introduced to the
sample at 300 K, and the temperature was lowered at intervals down to a base temperature2Measurements performed by C. C. Ahn, B. Fultz, and R. Yazami in 2001 [71].3The observable powder diffraction peaks are apparently not sensitive to the order-disorder transforma-
tion that occurs in the potassium intercalate layers at low temperatures.
37
1.0
0.8
0.6
0.4
0.2
0.0
Inte
nsity
(a.
u.)
4.03.53.02.52.01.51.00.5d-spacing (Å)
No D2 (35 K)
D2 (35K)
D2 (16 K)
[003]
[005]
3.5
3.0
2.5
2.0
1.5
1.0
Latti
ce E
xpan
sion
(%
)
1501209060300T(K)
[0 0 5] reflection [0 0 3] reflection
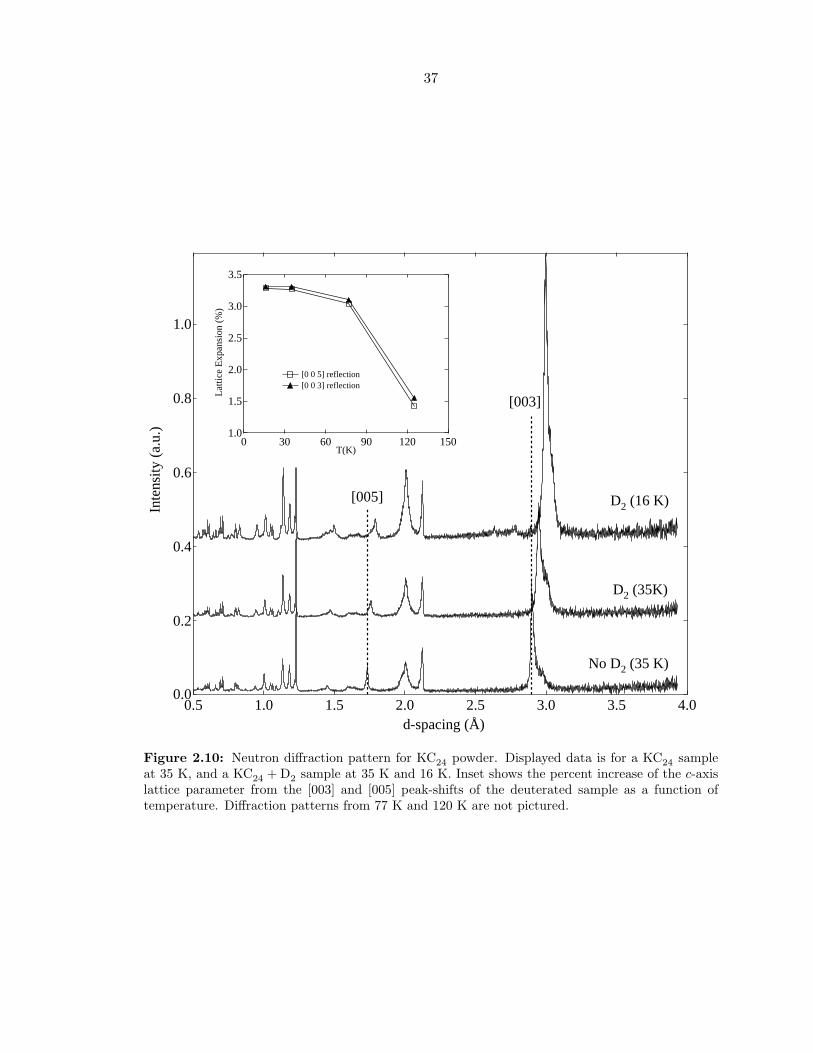
Figure 2.10: Neutron diffraction pattern for KC24 powder. Displayed data is for a KC24 sampleat 35 K, and a KC24 + D2 sample at 35 K and 16 K. Inset shows the percent increase of the c-axislattice parameter from the [003] and [005] peak-shifts of the deuterated sample as a function oftemperature. Diffraction patterns from 77 K and 120 K are not pictured.
38
-20
-10
0
10
20
G(r
) (a
rb. u
nits
)
876543210r (Å)
KC24
KC24D2
Diff.
1st NN(1.41Å)
2nd NN(2.47Å)
3rd NN(2.85Å)
5th NN(4.24Å)
4th NN(3.73Å)
6th NN(4.90Å)
7th NN(5.10Å)
8th NN(5.66Å)
NOTE: Higher order peaks are all shifted by ~0.1Å
9th NN(6.17Å)
10 NN(6.49Å)
11th NN(7.07 Å)
12th NN(7.35 Å)
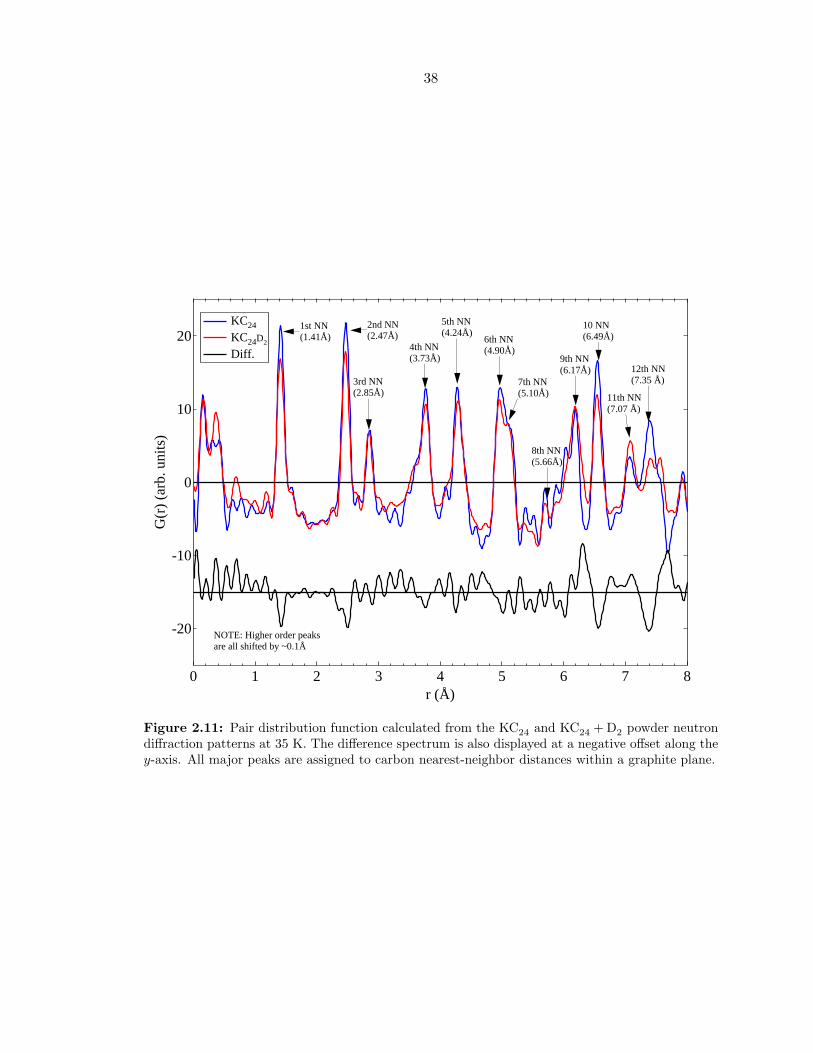
Figure 2.11: Pair distribution function calculated from the KC24 and KC24 + D2 powder neutrondiffraction patterns at 35 K. The difference spectrum is also displayed at a negative offset along they-axis. All major peaks are assigned to carbon nearest-neighbor distances within a graphite plane.
39
of 16 K. The c-axis repeat distance, as determined from the [003] and [005] peaks, increases
from 8.69 A for the un-deuterated sample to 8.97 A for the deuterated sample at 16 K
(Fig. 2.10). This corresponds to a 5 % expansion in the interlayer spacing from 5.34 A to
5.62 A, roughly consistent with previous results [48].
Pair distribution functions (PDF) for both KC24 and KC24+D2 were back-transformed
from the diffraction profiles of each sample collected at 35 K. The results are displayed in
Fig. 2.11. Peaks in the PDF can almost entirely be assigned to nearest-neighbor distances of
carbons in a graphite layer. Referring to Fig. 2.3c, the expected K−K distances are roughly
4.9 A, 6.47 A, and 7.34 A. Deuterium might be expected to have similar nearest-neighbor
distances at low loadings. Interestingly, there are some areas of intensity in the difference
plot around 6.3 A and 7.8 A which may correspond to the latter two of the expected dis-
tances. Unfortunately, it is difficult to draw any information about either the potassium or
deuterium structures from the PDF plot.