Embed Size (px)
Citation preview

www.advisian.com
Department of Environment, Land, Water & Planning, Victoria
Portsea Front Beach Wave Modelling and Monitoring Investigation
15 January 2016
Advisian is a global advisory firm that provides project and business
solutions to clients who develop, operate and maintain physical assets in
the infrastructure and resources sectors.

Advisian Portsea Front Beach Wave Modelling and Monitoring Investigation
Page i
301015-03540-Report-Rev 0 160115.docm
ISBN 978-1-74146-996-7 (pdf/online)

Advisian Portsea Front Beach Wave Modelling and Monitoring Investigation
Page ii
301015-03540-Report-Rev 0 160115.docm
Executive Summary
This investigation has considered and incorporated previous reports and data on erosion and wave
climate and has described and quantified the coastal processes relevant to the erosion of Portsea Front
Beach to inform the Department, the community and stakeholders for future coastal management
directions.
Detailed numerical models have been developed to examine tidal hydrodynamics, wave transformation
and sediment transport processes. Wave transformation modelling has incorporated the tidal
hydrodynamics to investigate the impact of tidal streams on wave propagation. The combined impacts of
wave refraction and diffraction have been simulated using a Boussinesq-type wave modelling program.
Boussinesq-type equations present the most complete solution to wave transformation that is available
and have been used to predict accurately wave evolution across large basins, wave breaking over
irregular topography, wave–structure interaction and wave-induced current patterns, among many other
advances.
Environmental monitoring instruments were deployed at four locations to provide data on waves,
currents, water levels and sediment transport to calibrate the numerical models, validating that the
models represented the physical processes in the investigation area to best practice standards. In
conjunction with recognised experts from the Australian Institute of Marine Science, Townsville and the
University of New South Wales Water Research Laboratory, advanced scientific methods have been used
to monitor sand transport in the field and the data have been applied to calibrate and verify successfully,
and to a level of resolution rarely attainable, the sand transport modelling undertaken on Quarantine
Bank.
Based on 2012 bathymetry, the modelling has provided estimates of annual nearshore wave climates and
littoral drift transport potentials along the Weeroona Bay foreshore along with gross and net annual
sediment transport rates on Quarantine Bank.
The modelling has shown that swell wave energy entering Port Phillip Bay is directed towards the
Mornington Peninsula along sand banks lying between South Channel and Sorrento Channel through
the process of wave refraction causing total internal wave reflection off the channels adjacent to
Quarantine Bank. In recent times part of this wave energy has been refracted off the sandbanks onto
Portsea Front Beach, causing erosion there.
Field monitoring and modelling has indicated that sediment transport rates on Quarantine Bank are
relatively high. Large sand wave features attest to high rates of sediment transport with comparative
surveys indicating changes in seabed levels of up to 5 metres over periods of as little as two years. In
these relatively shallow depths the sand wave lengths are of a similar scale to the incident swell
wavelengths and such depth changes have the potential to change significantly the direction and energy
of wave transformation.
Comparative wave transformation modelling based on seabed bathymetry surveyed in the years 2007,
2010 and 2012 has indicated that the direction and energy of wave incidence onto the Weeroona Bay
foreshore, which includes Portsea Front Beach, could have varied significantly between each of those
years as a result of changes in the morphology of Quarantine Bank. However, changes to the levels of
incident wave energy could be attributed also to changes in meteorological conditions. Nevertheless, as
the rate and direction of littoral drift transport and, hence, beach alignment are related directly to
nearshore wave height and direction, future changes in beach alignment at Portsea Front Beach can be
expected.

Advisian Portsea Front Beach Wave Modelling and Monitoring Investigation
Page iii
301015-03540-Report-Rev 0 160115.docm
The increased wave energy incident at Portsea Front Beach, near the pier, has resulted in an increase in
the potential rate of littoral drift transport eastward, which is greater than that being supplied from the
western part of Weeroona Bay. Also, the increased wave energy levels, particularly during storms, has
resulted in dune erosion and increased net offshore sand transport. The deficits in the rates of littoral
drift transport have resulted in foreshore recession near the pier at Portsea Front Beach. Farther
eastward the incident wave energy reduces, resulting in accretion at the eastern end of Weeroona Bay.
The design of works to manage future changes to Portsea Front Beach resulting from changes in the
nearshore wave climate can be informed by the field and modelling data delivered with this project. The
Department has advised that it will investigate coastal zone management options after the completion of
this investigation. To improve further the understanding of the changes to Portsea Front Beach, a range
of monitoring could be conducted, including:
§ regular 2-yearly LADS surveys of the Quarantine Bank, which could be compared with historical
surveys and tested for any changes in wave transformation processes with the numerical wave
models developed for this project
§ beach profiling of Weeroona Bay at six-monthly intervals and at 50 m spacing from 5 m behind the
dune crest to a water depth of -1 m LAT.
Disclaimer
This report has been prepared on behalf of and for the exclusive use of Department of Environment,
Land, Water & Planning, Victoria, and is subject to and issued in accordance with the agreement
between Department of Environment, Land, Water & Planning, Victoria and Advisian.
Advisian accepts no liability or responsibility whatsoever for it in respect of any use of or reliance upon
this report by any third party.
Copying this report without the permission of Department of Environment, Land, Water & Planning,
Victoria and Advisian is not permitted.
PROJECT NO 301015-03540– PORTSEA FRONT BEACH: WAVE MODELLING AND
MONITORING INVESTIGATION
Rev Description Author Review
Advisian
Approval Date
A For Internal Review
A Nielsen, B Williams
B Williams
A Nielsen
N/A
B For Client Review
A Nielsen, B Williams
B Williams
A Nielsen
25 Nov 2015
0 Final
A Nielsen, B Williams
B Williams
A Nielsen
16 Jan 2016

Advisian Portsea Front Beach Wave Modelling and Monitoring Investigation
Page iv
301015-03540-Report-Rev 0 160115.docm
Table of Contents
1 Introduction 1
2 Geographic Features 3
3 Coastal Processes 5
3.1 Tidal Hydraulics 5
3.1.1 Introduction 5
3.1.2 Modelling 5
3.1.3 Distribution of Tidal Streams 8
3.2 Wave Transformation 9
3.2.1 Wave Transformation Processes 9
3.2.2 Changes to Nearshore Wave Conditions 10
3.2.3 Nearshore Wave Climates 12
3.3 Sediment Transport 14
3.3.1 Methodology 14
3.3.2 Validation 14
3.3.3 Observed Changes on Quarantine Bank 16
3.3.4 Sediment Transport Rates on Quarantine Bank 18
4 Beach Processes 21
4.1 Introduction 21
4.2 Morphology Study 22
4.3 Sediment Budget 24
4.4 Littoral Drift Transport Rates 24
5 Summary and Conclusions 26
6 References 28

Advisian Portsea Front Beach Wave Modelling and Monitoring Investigation
Page v
301015-03540-Report-Rev 0 160115.docm
List of Appendices
Appendix A Field and Laboratory Data
Appendix B Tidal Hydrodynamics
Appendix C Wave Transformation
Appendix D Sediment Transport
Appendix E Glossary
Appendix F Project Brief
List of Figures
Figure 1 Location of Portsea Front Beach (PSFB) within Port Phillip Bay, Victoria (Image credit Google
Earth)
Figure 2 Portsea Front Beach circa April 2010, taken from just east of Portsea Pier (Photo credit Dept.
of Environment, Land, Water and Planning)
Figure 3 Portsea Front Beach shoreline 5 June 2014 (photos credit WorleyParsons)
Figure 4 Major morphological features of The Great Sands and the Entrance of Port Phillip Bay
(modified from Cardno, 2011)
Figure 5 Locations along the Nepean Peninsula (modified from Cardno, 2011)
Figure 6 Locations of tidal flow observations for validation of modelled tidal current hindcasts.
Underlying sea floor bathymetry shown also.
Figure 7 Detail of measured and modelled hindcasts of depth-averaged current speeds derived from
AWAC observations at Portsea. Upper Panel: AWAC deployment 1 (~6m water depth). Lower Panel:
AWAC deployment 2 (~6m water depth).
Figure 8 Measured and modelled tidal current speeds at two locations on the offshore sand bank
(Quarantine Bank)
Figure 9 Modelled tidal streams at peak flood tide (top) and peak ebb tide (bottom)
Figure 10: Refraction of T=20 s swell waves within Port Phillip Bay as indicated by the instantaneous
water surface elevation, which traces the wave crests.
Figure 11 The distribution of swell wave height coefficients in the vicinity of Portsea for a peak wave
period of 12 seconds, illustrating the refraction and diffraction of a portion of the wave energy onto
Portsea Front Beach
Figure 12 Modelled changes in nearshore wave direction along Portsea Front Beach for 2012 – 2007
(top) and for 2010 – 2007 (bottom). Note that the changes in wave direction from 2007 to 2012 are
greater than those from 2007 to 2010, which are attributed to natural changes in bathymetry after 2010.
(source: Water Technology 2013)
Figure 13 Modelled percentage changes in nearshore wave height along Portsea Front Beach (top) for
2012 – 2007 and (bottom) for 2010 – 2007 (source: Water Technology 2013). Note that in the Weeroona

Advisian Portsea Front Beach Wave Modelling and Monitoring Investigation
Page vi
301015-03540-Report-Rev 0 160115.docm
Bay west embayment, changes between 2007 and 2012 appear greater than those between 2007 and
2010, which are attributed to natural changes in bathymetry after 2010. (source: Water Technology
2013)
Figure 14 A 10 year time series of calculated wave heights at Portsea Front Beach pier based on
Boussinesq wave height coefficients applied to a 10 year time series measured offshore of Point
Lonsdale/Point Nepean.
Figure 15 Variation in the significant wave height measured offshore of Portsea Front Beach and
offshore of Point Nepean from late July to late October 2014
Figure 16 Wave height coefficients derived from measured data from Figure 15
Figure 17 Calibration of the sediment transport model for the offshore sand bank
Figure 18 Verification of the sediment transport model for the offshore sand bank
Figure 19 Error assessment for the calibration (left panel) and verification (right panel) of the offshore
sediment transport model
Figure 20 Net sediment transport vectors and the difference between LADS surveys (2010 minus 2007)
on Quarantine Bank offshore of Portsea Front Beach. Note that a scale for the net sediment transport
rates was not given. (Source Cardno 2011b)
Figure 21 Changes on the Quarantine Bank derived from LADS 2010 and 2012 surveys (data courtesy
Port of Melbourne)
Figure 22 Bed level changes on the Quarantine Bank between 2010 and 2012
Figure 23 Calculated gross sediment transport rates on Quarantine Bank resolved in the cardinal
directions
Figure 24 Net sediment transport vectors on Quarantine Bank
Figure 25 Net sediment transport rates on Quarantine Bank
Figure 26 Swells rolling in on Portsea Front Beach 25 June 2014 (photo courtesy Dept. Env., Land,
Water & Planning, Vic.)
Figure 27 Changes in foreshore alignment at Portsea Front Beach 2005 to 2015 (Courtesy Google earth)
Figure 28 Changes in beach width at Weeroona Bay West embayment 21/11/2005 to 10/2/2015
(courtesy Google earth)
Figure 29 Sediment Budget for Weeroona Bay (November 2005 to February 2015)
Figure 30 Historic (November 2005 to February 2015) annual rates of littoral drift transport (photo
courtesy Google earth)

Advisian Portsea Front Beach Wave Modelling and Monitoring Investigation
Page vii
301015-03540-Report-Rev 0 160115.docm
Department of Environment, Land, Water & Planning, Victoria
Portsea Front Beach
Wave Modelling and Monitoring Investigation
Advisian Portsea Front Beach Wave Modelling and Monitoring Investigation
Page 1
301015-03540-Report-Rev 0 160115.docm
1 Introduction
Portsea Front Beach is located on the southern shore of Port Phillip Bay, approximately 57 km
south of Melbourne (Figure 1).
Figure 1 Location of Portsea Front Beach (PSFB) within Port Phillip Bay, Victoria (Image credit Google Earth)
In recent years some 600 m of the Portsea Front Beach and foreshore has been eroded severely by
waves, resulting in an estimated 25 to 30 m of foreshore recession near the Portsea Pier (Figure 2).
Figure 2 Portsea Front Beach circa April 2010, taken from just east of Portsea Pier (Photo credit Dept. of Environment, Land, Water and Planning)

Department of Environment, Land, Water & Planning, Victoria
Portsea Front Beach
Wave Modelling and Monitoring Investigation
Advisian Portsea Front Beach Wave Modelling and Monitoring Investigation
Page 2
301015-03540-Report-Rev 0 160115.docm
The Victorian Department of Environment and Primary and Industries (“the Department”) has
responded to this erosion to protect the foreshore and assets by reconditioning existing shoreline
protection structures, constructing rock revetments and a 160 m long geotextile sandbag seawall.
These works are depicted in Figure 3.
Figure 3 Portsea Front Beach shoreline 5 June 2014 (photos credit WorleyParsons)
The Department has commissioned WorleyParsons (now branded Advisian) to undertake a wave
monitoring and modelling investigation in consultation with the Portsea community and
stakeholders with the objective to inform future management options. The brief is in Appendix G.
This report synthesises and summarises the results and conclusions from that work and previous
studies. The report comprises the following appendices documenting the field monitoring and
modelling studies:
Appendix A – Field and Laboratory Data
Appendix B – Tidal Hydrodynamics
Appendix C – Wave Transformation
Appendix D – Sediment Transport
Appendix E – Glossary
Appendix G – Project Brief.

Department of Environment, Land, Water & Planning, Victoria
Portsea Front Beach
Wave Modelling and Monitoring Investigation
Advisian Portsea Front Beach Wave Modelling and Monitoring Investigation
Page 3
301015-03540-Report-Rev 0 160115.docm
2 Geographic Features
Portsea Front Beach is located on the southern shores of Port Phillip Bay and is fronted by a large
region of sand shoals that are intersected by deep channels (Figure 4). As pertains to Portsea, the
Great Sands region comprises the following key geographic features:
The Entrance is a relatively narrow opening through Port Phillip Heads and is dredged
periodically to maintain a minimum declared depth of 17 m for commercial shipping. Most of The
Entrance has a natural depth greater than 14 m. A horseshoe shaped canyon (“The Deep”), which
wraps around Nepean Bank (a submarine extension of Point Nepean), has maximum reported
depths in the region of 75 m (AUS Chart 00143) and is reported anecdotally to have maximum
depths extending to 100 m. The seaward end of The Entrance is bounded by Rip Bank, which
extends to less than 20 m below the surface. Due to the constricted entrance, tidal flow through
the entrance is rapid with strong turbulence due to the rapidly changing water depths. Interaction
of these tidal currents with waves propagating from Bass Strait occasionally can cause very rough
conditions.
The Great Sands region is further subdivided into regions, extending west to east, called ‘West
Sand’, ‘William Sand’, ‘West Middle Sand’, ‘Great Sand’ (which includes Mud Islands), ‘Middle
Ground’ and ‘South Sand’. The major features of the channels and shallow banks in the Great
Sands have been relatively stable over time.
South Channel occupies the naturally deeper water through the Great Sands and is dredged
periodically to maintain a minimum navigable depth for commercial shipping. Within South
Channel the relatively strong tidal currents increase in strength toward the Entrance Deep, with
large, mobile sand waves occurring a short distance north of Nicholson Knoll. The South Channel
in the region of Portsea, Nicholson Knoll and Popes Eye Bank is known to experience mobile bed
features in the form of migrating subaqueous sand waves, which can migrate some tens of meters
per year
Sorrento Channel is an ebb-tidal channel running approximately parallel to the shore,
immediately seaward of Portsea and Sorrento. It is located to the south of South Channel and is
separated from South Channel by a system of shallow sand banks. The general depth of the
channel is in the region of 15 to 20 m and peak tidal current speeds within the channel are in the
order of 1 m/s.
Nicholson Knoll and Quarantine Bank is a system of large sandbanks located approximately
1.5 km northwest of Portsea Front Beach. Nicholson Knoll and Quarantine Bank have extensive
sand wave fields that migrate, indicating active sediment transport.
Portsea Hole lies offshore of Portsea Front Beach and is a depression within the bed of the old
Yarra River, which flowed through this area during periods of glaciation and lower sea levels. The
Hole is located about 500 m from the Portsea Pier over an area of around 10 ha. The Hole reaches
depths of up to 30 m and acts as a shelter for a variety of fish and other reef species. The
stratification of marine life on the wall provides special qualities and it is one of the most popular
deeper recreational dive sites in the Bay.
Locations along the Nepean Peninsula and bathymetric features of the South Channel region are
presented in greater detail in Figure 5.

Department of Environment, Land, Water & Planning, Victoria
Portsea Front Beach
Wave Modelling and Monitoring Investigation
Advisian Portsea Front Beach Wave Modelling and Monitoring Investigation
Page 4
301015-03540-Report-Rev 0 160115.docm
Figure 4 Major morphological features of The Great Sands and the Entrance of Port Phillip Bay (modified from Cardno, 2011)
Figure 5 Locations along the Nepean Peninsula (modified from Cardno, 2011)
Nicholson Knoll
Portsea Hole
Quarantine Bank
Quarantine Bank

Department of Environment, Land, Water & Planning, Victoria
Portsea Front Beach
Wave Modelling and Monitoring Investigation
Advisian Portsea Front Beach Wave Modelling and Monitoring Investigation
Page 5
301015-03540-Report-Rev 0 160115.docm
3 Coastal Processes
3.1 Tidal Hydraulics
3.1.1 Introduction
Tidal flows have the potential to impact the coastal processes pertaining to Portsea Front Beach
significantly in two ways:
1) Swell wave transformation to Portsea Front Beach varies with the stage of the tide, with flood
tides enhancing wave energy propagation to the beach but with ebb tides reducing wave
energy (Water Technology 2013; Appendix C)
2) Strong tidal streams have the potential to change the morphology of the offshore sand banks
(Quarantine Bank), which can change swell wave refraction.
3.1.2 Modelling
Field measurements of tidal streams (Appendix A) and tidal hydraulic modelling (Appendix B)
have been undertaken to quantify the tidal streams in the vicinity of Portsea Front Beach for the
development of a tidal current climate and to inform wave transformation and sediment transport
processes.
Models were set up and calibrated initially on water level data obtained previously by others.
Excellent agreement was made between modelled and measured data (Appendix B). These results
were examined and used to design a field work campaign targeted at acquiring data pertinent to
the coastal processes at Portsea Front Beach.
Final calibration and verification was made using flood and ebb tidal velocity data measured in
the field for this project. Field data for this purpose were obtained at four sites by WorleyParsons
as shown in Figure 6. Sites ‘AWAC-1’ and ‘AWAC-2’ correspond to nearshore AWAC deployments
between June 2014 and February 2015. Sites ‘ADCP Station Day 2’ and “ADCP Station Day 3’
correspond to ADCP offshore observation sites over tidal cycles established during sediment
transport field work undertaken in April 2015.
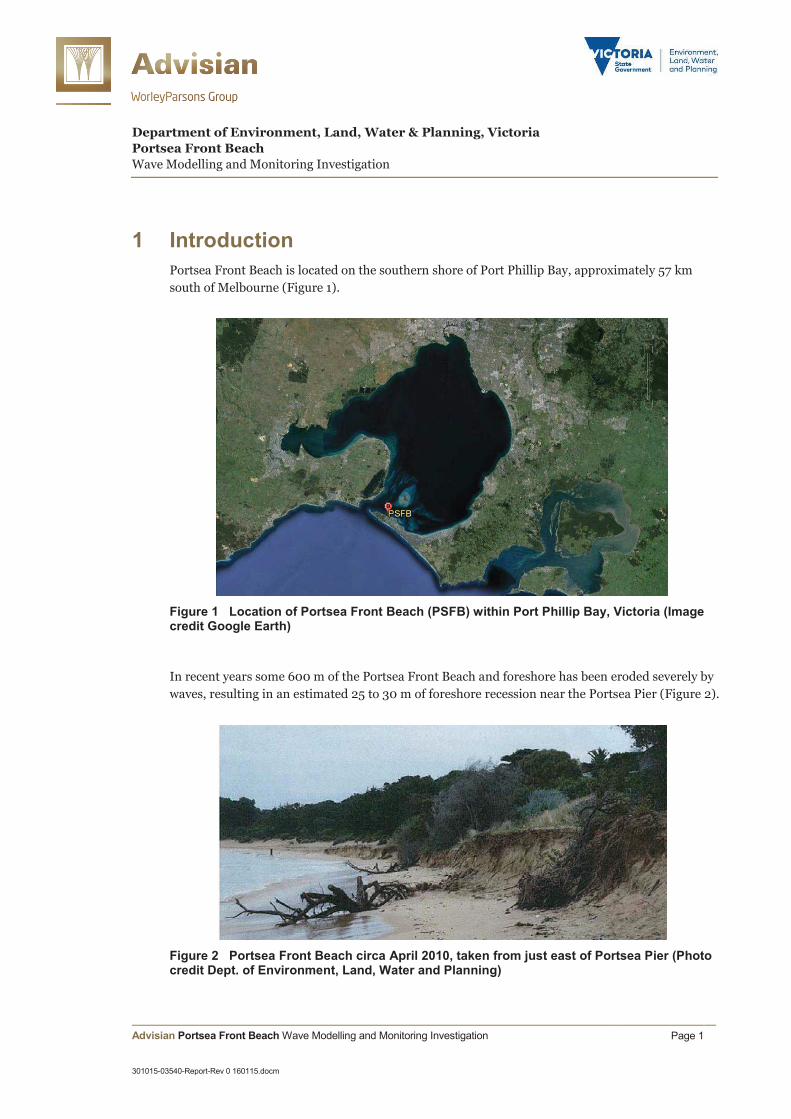
The results are shown in Figure 7 and Figure 8. Figure 7 indicated that the peak nearshore tidal
current speeds were underestimated by around 25%, although the correlation overall was deemed
reasonable. However, it was noted that the peak speeds measured were relatively low at around
0.4 m/s, which were below the critical speeds for initiation of sediment transport. On the
Quarantine Bank, Figure 8 indicated that peak flood tide current speeds were over-estimated by
around 20% or less and peak ebb tide current speeds were simulated accurately; overall the
correlation was very good.

Department of Environment, Land, Water & Planning, Victoria
Portsea Front Beach
Wave Modelling and Monitoring Investigation
Advisian Portsea Front Beach Wave Modelling and Monitoring Investigation
Page 6
301015-03540-Report-Rev 0 160115.docm
Figure 6 Locations of tidal flow observations for validation of modelled tidal current hindcasts. Underlying sea floor bathymetry shown also.
Figure 7 Detail of measured and modelled hindcasts of depth-averaged current speeds derived from AWAC observations at Portsea. Upper Panel: AWAC deployment 1 (~6m water depth). Lower Panel: AWAC deployment 2 (~6m water depth).
Department of Environment, Land, Water & Planning, Victoria
Portsea Front Beach
Wave Modelling and Monitoring Investigation
Advisian Portsea Front Beach Wave Modelling and Monitoring Investigation
Page 7
301015-03540-Report-Rev 0 160115.docm
Figure 8 Measured and modelled tidal current speeds at two locations on the offshore sand bank (Quarantine Bank)

Department of Environment, Land, Water & Planning, Victoria
Portsea Front Beach
Wave Modelling and Monitoring Investigation
Advisian Portsea Front Beach Wave Modelling and Monitoring Investigation
Page 8
301015-03540-Report-Rev 0 160115.docm
3.1.3 Distribution of Tidal Streams
The distributions of the flood and ebb tidal streams over the southern portion of Port Phillip Bay
are shown in Figure 9. Strong tidal flows are concentrated in the South Channel. Peak tidal
velocities over the sand banks offshore of Portsea Front Beach exceed 1.5 m/s, which were
measured in the fieldwork campaign, and attest to significant sand transport potential on
Quarantine Bank.
Figure 9 Modelled tidal streams at peak flood tide (top) and peak ebb tide (bottom)

Department of Environment, Land, Water & Planning, Victoria
Portsea Front Beach
Wave Modelling and Monitoring Investigation
Advisian Portsea Front Beach Wave Modelling and Monitoring Investigation
Page 9
301015-03540-Report-Rev 0 160115.docm
3.2 Wave Transformation
3.2.1 Wave Transformation Processes
The deep channel running through Port Phillip Heads is responsible for refracting wave energy
around Point Nepean. Wave energy directed towards South Channel tends to be ‘captured’
through the process of total internal wave reflection off deep channels and focused along a system
of shallow sand banks separating the deeper water areas of South Channel and Sorrento Channel
(Figure 10). Part of this wave energy is then refracted towards Portsea Front Beach by a shallow,
linear sand bank located approximately 1.5 km north-west of Portsea Pier (Figure 11). Additional
focusing on the beach immediately east of Portsea Pier appears to occur through wave interaction
with Portsea Hole and a shallow submarine bank extending a short distance seaward into
Sorrento Chanel immediately seaward of Portsea Pier (Figure 11). The severity of the wave
focusing creates gradients in swell wave energy for the area a short distance alongshore to the east
of Portsea Pier.
Wave-current simulations have reproduced the phenomena of wave ‘blocking’ by strong ebb
currents and wave ‘pushing’ by strong flood currents flowing through Port Phillip Heads. The
simulations also illustrated the impact of the tidal stage in focusing wave energy along different
sections of the coastline. Spring flood tidal conditions increased the effective wavelength of swell
wave energy propagating through The Entrance and Nepean Bank, increasing the efficacy of the
channel in refracting wave energy around Point Nepean onto the shore between Point Nepean and
Observatory Point. Although wave energy is directed towards South Channel under these
conditions, this mechanism increases the ability of the sand banks to capture wave energy and
focus it eastward towards Portsea Front Beach.
Figure 10: Refraction of T=20 s swell waves within Port Phillip Bay as indicated by the instantaneous water surface elevation, which traces the wave crests.

Department of Environment, Land, Water & Planning, Victoria
Portsea Front Beach
Wave Modelling and Monitoring Investigation
Advisian Portsea Front Beach Wave Modelling and Monitoring Investigation
Page 10
301015-03540-Report-Rev 0 160115.docm
Figure 11 The distribution of swell wave height coefficients in the vicinity of Portsea for a peak wave period of 12 seconds, illustrating the refraction and diffraction of a portion of the wave energy onto Portsea Front Beach
Ebb-tidal currents are more effective at dissipating larger wave heights via wave spilling through
overly steep waves and enhanced depth-limited wave breaking over the shallow sand banks. An
additional effect of the opposing tide is reducing the effective wavelength of the incident waves,
reducing the ability of the channel running through the entrance of Port Phillip to refract wave
energy eastward towards the adjacent shallow banks. Paradoxically, this may lead to more energy
being directed towards South Channel, although waves propagating against the opposing ebb tidal
current will act to increase wave heights locally, differentially enhancing wave dissipation for the
higher offshore waves.
Strong ebb tide currents flowing through Sorrento Channel act to block incident wave energy from
Portsea Front Beach. This is evidenced by analysis of wave height coefficients along Portsea Front
Beach at the -5 m AHD isobath. Little difference was observed between simulation results during
slack-water and flood spring tide, while wave height coefficients derived from simulations with
higher waves incident at the offshore boundary were disproportionately reduced on ebb tides. The
effect is more apparent for waves with shorter periods (shorter wavelengths).
Modelling on the 2012 bathymetry illustrated how the sand bank to the north-west of Portsea,
Quarantine Bank, traps and focusses wave energy onto Portsea Front Beach (Appendix C, Figures
4-3 to 4-10). In particular, the direction of wave energy transformation is shown to change
markedly at several locations on the bank, where the direction (from) has been turned from an
average of 290° (travelling eastward from west-northwest) on the bank to 320° (travelling south-
eastward towards Portsea Front Beach - Points M, Q, R, W).
3.2.2 Changes to Nearshore Wave Conditions
Water Technology (2013) documented a review of wave transformation processes through Port
Phillip heads using a spectral wave model and examined changes to the nearshore wave climate at
Portsea Front Beach by comparing modelled nearshore wave directions and heights under various

Department of Environment, Land, Water & Planning, Victoria
Portsea Front Beach
Wave Modelling and Monitoring Investigation
Advisian Portsea Front Beach Wave Modelling and Monitoring Investigation
Page 11
301015-03540-Report-Rev 0 160115.docm
nearshore bathymetric conditions as surveyed. The modelling data presented in Water
Technology (2013) comparing changes to wave direction and height along Portsea Front Beach
between 2010-2007 and 2012-2007 indicated that changes in nearshore wave direction (Figure
12) and height (Figure 13) along the Portsea Front Beach foreshore could be attributed to natural
changes in seabed bathymetry.
Scale (degree)
Figure 12 Modelled changes in nearshore wave direction along Portsea Front Beach for 2012 – 2007 (top) and for 2010 – 2007 (bottom). Note that the changes in wave direction from 2007 to 2012 are greater than those from 2007 to 2010, which are attributed to natural changes in bathymetry after 2010. (source: Water Technology 2013)

Department of Environment, Land, Water & Planning, Victoria
Portsea Front Beach
Wave Modelling and Monitoring Investigation
Advisian Portsea Front Beach Wave Modelling and Monitoring Investigation
Page 12
301015-03540-Report-Rev 0 160115.docm
% Change
Figure 13 Modelled percentage changes in nearshore wave height along Portsea Front Beach (top) for 2012 – 2007 and (bottom) for 2010 – 2007 (source: Water Technology 2013). Note that in the Weeroona Bay west embayment, changes between 2007 and 2012 appear greater than those between 2007 and 2010, which are attributed to natural changes in bathymetry after 2010. (source: Water Technology 2013)
3.2.3 Nearshore Wave Climates
The nearshore wave climates at some 29 locations along the -5 m isobath at 100 m centres
eastward from Police Point are presented in Appendix C. These model data are based on the
Boussinesq wave height transformation results derived on the 2012 bathymetry and from 10 years
of wave data measured offshore of Point Lonsdale/Point Nepean.
Figure 14 presents a 10 year time series of calculated wave heights at Portsea Front Beach pier
based on the 2012 bathymetry and illustrates that the wave climate at Portsea Front Beach can
vary considerable from year to year. For example, for the year 2007 the calculated average

Department of Environment, Land, Water & Planning, Victoria
Portsea Front Beach
Wave Modelling and Monitoring Investigation
Advisian Portsea Front Beach Wave Modelling and Monitoring Investigation
Page 13
301015-03540-Report-Rev 0 160115.docm
significant wave height was 0.24 m with a maximum significant wave height calculated being
0.71 m, whereas for 2008 the average significant wave height was 0.26 m with a maximum
significant wave height calculated being 1.13 m; that is, the calculated average significant wave
height varied by 8% whereas the calculated maximum significant wave height varied by 45%.
Accordingly, the maximum incident wave energy would have varied by a factor of 2.0.
Figure 14 A 10 year time series of calculated wave heights at Portsea Front Beach pier based on Boussinesq wave height coefficients applied to a 10 year time series measured offshore of Point Lonsdale/Point Nepean.
Moreover, the significant wave height measured offshore of Portsea Front Beach for this project
varied significantly over just a three month period of field measurement from a minimum of
around 0.2 m to a maximum over 1.0 m (Figure 15).
Figure 15 Variation in the significant wave height measured offshore of Portsea Front Beach and offshore of Point Nepean from late July to late October 2014
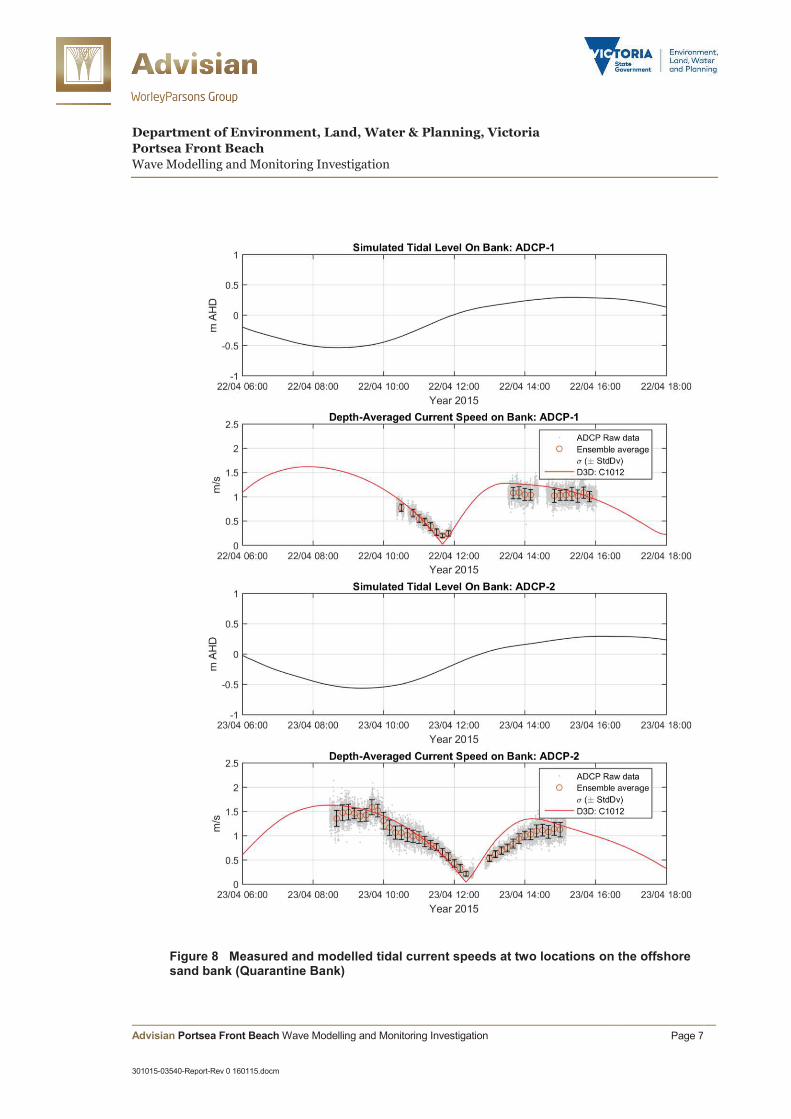
The measured wave height coefficients from the data in Figure 15 are plotted in Figure 16. The
field data showed a variation in the average wave height coefficient on the flood tide from 0.20 to
the ebb tide of 0.15. However, the range of the measured wave height coefficients for all of the
data varied from around 0.06 to 0.40 (see dashed lines in Figure 16,top left box) a variation of
almost 200%. Over this period, the nearshore wave direction was modelled at 345.8°TN with a
variation of 3.5°.
Department of Environment, Land, Water & Planning, Victoria
Portsea Front Beach
Wave Modelling and Monitoring Investigation
Advisian Portsea Front Beach Wave Modelling and Monitoring Investigation
Page 14
301015-03540-Report-Rev 0 160115.docm
Figure 16 Wave height coefficients derived from measured data from Figure 15
3.3 Sediment Transport
3.3.1 Methodology
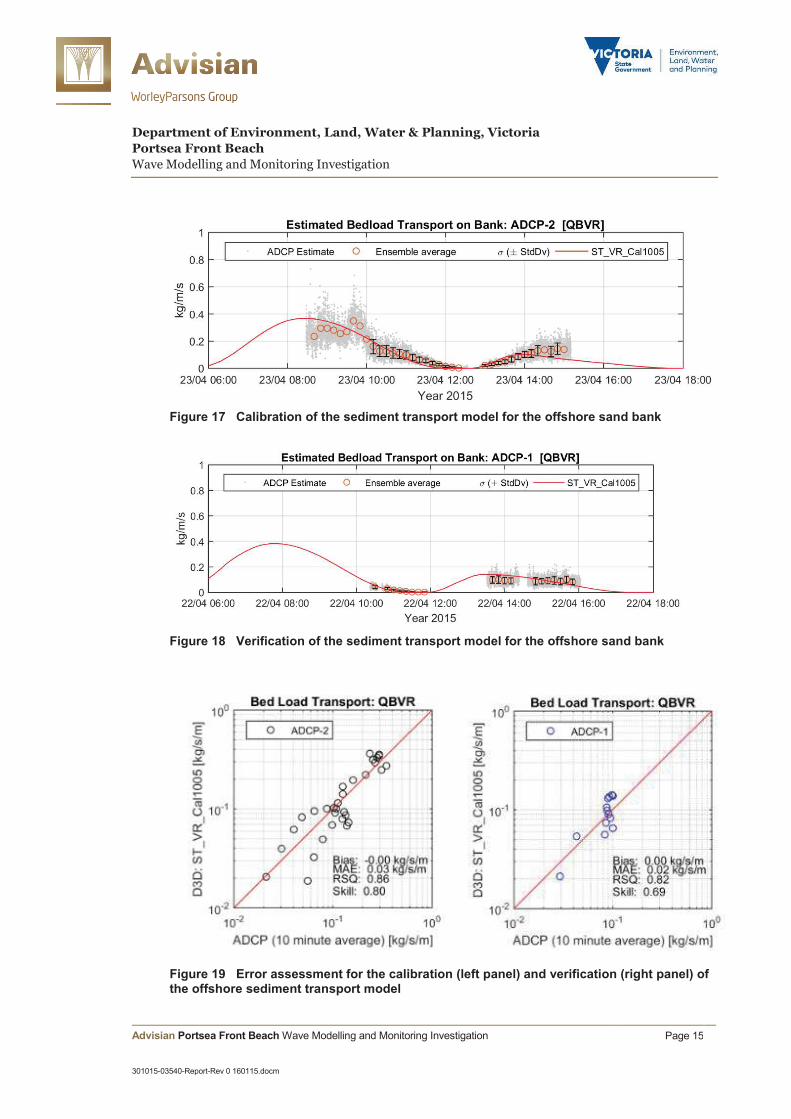
Sediment transport rates on the Quarantine Bank were assessed based on the van Rijn (2004)
sediment transport algorithms applied to the tidal hydrodynamic model results. The van Rijn
sediment transport algorithms were calibrated against the field data obtained over an ebb/flood
tidal cycle at one site (ADCP2) and validated against data obtained over another tidal cycle at a
different site (ADCP1). The sediment grain size parameters used for the field data reduction and
in the transport rate algorithms (D16, D50, D84) were taken from the measured fall velocity results
(Appendix A) using the van Rijn (1989) algorithm relating sediment grain size to fall velocity.
3.3.2 Validation
The results of the sediment transport model calibration are presented in Figure 17, the verification
data are presented in Figure 18 and error assessments are presented in Figure 19, all of which
present exceptional agreement between the modelling and field data.
Department of Environment, Land, Water & Planning, Victoria
Portsea Front Beach
Wave Modelling and Monitoring Investigation
Advisian Portsea Front Beach Wave Modelling and Monitoring Investigation
Page 15
301015-03540-Report-Rev 0 160115.docm
Figure 17 Calibration of the sediment transport model for the offshore sand bank
Figure 18 Verification of the sediment transport model for the offshore sand bank
Figure 19 Error assessment for the calibration (left panel) and verification (right panel) of the offshore sediment transport model

Department of Environment, Land, Water & Planning, Victoria
Portsea Front Beach
Wave Modelling and Monitoring Investigation
Advisian Portsea Front Beach Wave Modelling and Monitoring Investigation
Page 16
301015-03540-Report-Rev 0 160115.docm
3.3.3 Observed Changes on Quarantine Bank
Cardno (2011b) presented results of sediment transport modelling on the sand banks offshore of
Portsea Front Beach that showed sediment transport on Quarantine Bank was dominated by ebb
tide flows with the movement of large sand waves directed westerly towards the ocean entrance to
Port Phillip Bay (Figure 20). The comparison of LADS data from 2010 and 2007 showed
variations in seabed elevations in excess of ±3 m (Figure 20).
Figure 20 Net sediment transport vectors and the difference between LADS surveys (2010 minus 2007) on Quarantine Bank offshore of Portsea Front Beach. Note that a scale for the net sediment transport rates was not given. (Source Cardno 2011b)
Modelling, field measurements and calculations undertaken for this study have attested to
relatively high rates of sediment transport under tidal action on the Quarantine Bank. More
recent survey transects across the bank, 2010 and 2012, have indicated that the top 3 m is highly
mobile and changes in bed elevation of up to 5 m have been surveyed (Figure 21).
The survey data portrayed sand waves up to some 150 m long and up to 5 m high. As indicated in
Transect B (Figure 21), the western face of the sandbank appeared to have shifted laterally
westward some 100 m. Figure 22, portraying the change in seabed level over the entire sand bank
area between 2010 and 2012, indicated surface level changes in the order of ±4 m.
The natural variations as surveyed on the Quarantine Bank have the potential to alter the incident
wave conditions on Portsea Front Beach. In 10 m water depth, a wave with period 15 s has a
length of around 150 m, which is in the order of the length scale of the sand waves. The changes in
the seabed resulting from the mobility of the sandwaves have the potential to change wave
refraction. Nielsen et al. (2011) showed that, for a wave with period around 15 s, depth changes in
the order of 3 m in around 10 m water depth could change the refracted wave height coefficient by
around 10%, which, according to Snell’s Law, could be accompanied by directional changes of up
to 30°.

Department of Environment, Land, Water & Planning, Victoria
Portsea Front Beach
Wave Modelling and Monitoring Investigation
Advisian Portsea Front Beach Wave Modelling and Monitoring Investigation
Page 17
301015-03540-Report-Rev 0 160115.docm
Figure 21 Changes on the Quarantine Bank derived from LADS 2010 and 2012 surveys (data courtesy Port of Melbourne)
3 m
5 m
5 m

Department of Environment, Land, Water & Planning, Victoria
Portsea Front Beach
Wave Modelling and Monitoring Investigation
Advisian Portsea Front Beach Wave Modelling and Monitoring Investigation
Page 18
301015-03540-Report-Rev 0 160115.docm
Figure 22 Bed level changes on the Quarantine Bank between 2010 and 2012
3.3.4 Sediment Transport Rates on Quarantine Bank
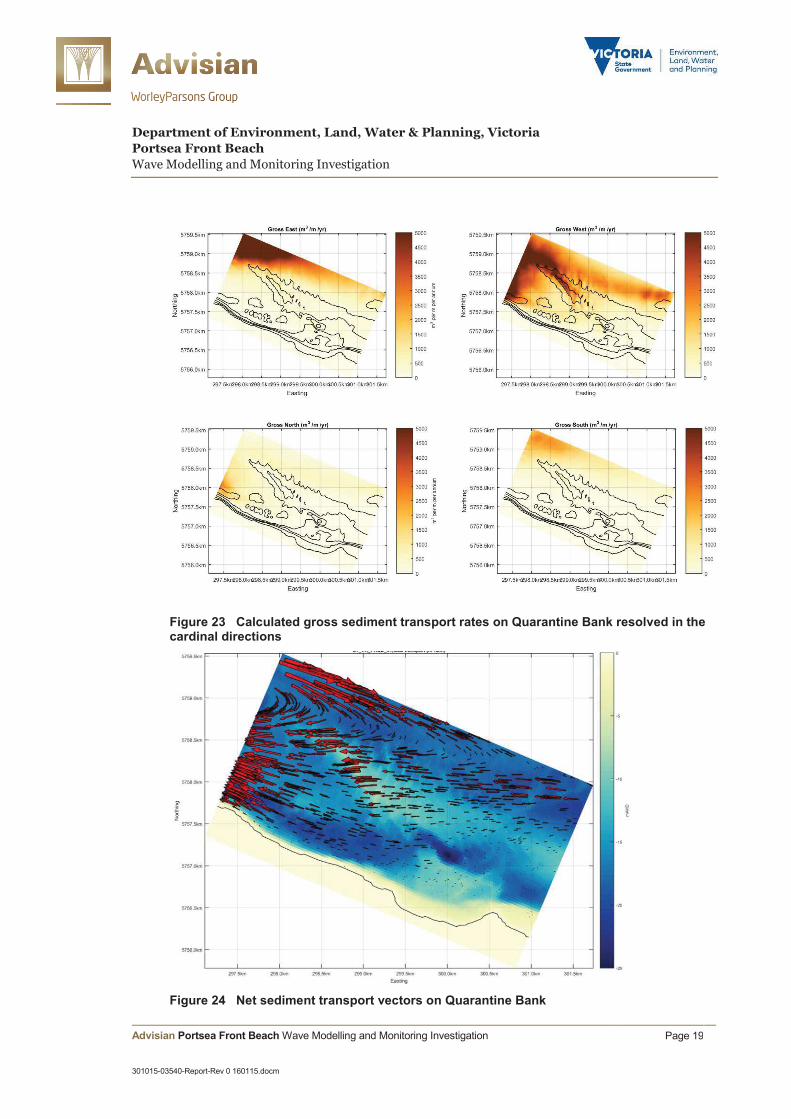
The tidal hydrodynamic and sediment transport models were synthesised to run for a complete
lunar cycle and factored to provide annual sediment transport rates over the Quarantine Bank.
Gross rates of sediment transport in the cardinal directions were up to 5,000 m3/m/a (Figure 23).
Maxima were directly westerly where bed form heights were maxima.
Net sediment transport rate vectors are presented in Figure 24 and net sediment transport rates
are presented in Figure 25. Net transport on the shoals was directed westerly with maxima
reaching 5,000 m3/m/a on the crest of the bank.
Department of Environment, Land, Water & Planning, Victoria
Portsea Front Beach
Wave Modelling and Monitoring Investigation
Advisian Portsea Front Beach Wave Modelling and Monitoring Investigation
Page 19
301015-03540-Report-Rev 0 160115.docm
Figure 23 Calculated gross sediment transport rates on Quarantine Bank resolved in the cardinal directions
Figure 24 Net sediment transport vectors on Quarantine Bank

Department of Environment, Land, Water & Planning, Victoria
Portsea Front Beach
Wave Modelling and Monitoring Investigation
Advisian Portsea Front Beach Wave Modelling and Monitoring Investigation
Page 20
301015-03540-Report-Rev 0 160115.docm
Figure 25 Net sediment transport rates on Quarantine Bank

Department of Environment, Land, Water & Planning, Victoria
Portsea Front Beach
Wave Modelling and Monitoring Investigation
Advisian Portsea Front Beach Wave Modelling and Monitoring Investigation
Page 21
301015-03540-Report-Rev 0 160115.docm
4 Beach Processes
4.1 Introduction
Beaches comprising unconsolidated sands will change continuously, endeavouring to become
aligned to the prevailing wave climate. Under steep seas as experienced during storms, sand may
be taken rapidly from the beach face and dune and transported across shore into deeper water
causing rapid beach face and dune erosion. Under long low swell conditions, nearshore sands will
be pushed ashore under wave action and beach face building will take place, albeit over much
longer periods. Changes to the nearshore approach angle of waves may induce a realignment of
the shoreline. Similarly, alongshore gradients in wave energy, which may be caused by wave
focussing onto parts of the shoreline, may induce alongshore currents that may cause alongshore
transport of littoral drift causing beach realignment. Changes to incident wave heights will affect
the rates at which shoreline changes will occur.
Wave conditions at Portsea Front Beach control the alongshore and cross-shore transport of
littoral drift. Changes to the nearshore wave conditions may induce changes to these beach
processes. Increases in wave height may impact the rates of littoral drift transport, specifically the
rate of cross-shore transport directed offshore, whereas changes to incident wave angles may
affect both the rate of littoral drift transport alongshore and, in the longer term, the beach
alignment. Such changes may cause foreshore recession.
Figure 26 Swells rolling in on Portsea Front Beach 25 June 2014 (photo courtesy Dept. Env., Land, Water & Planning, Vic.)
Variations in nearshore wave climate may be caused by long term meteorological cycles or
changes in the nearshore bathymetry. The el ninõ/la ninã cycle or the Pacific Decadal Oscillation

Department of Environment, Land, Water & Planning, Victoria
Portsea Front Beach
Wave Modelling and Monitoring Investigation
Advisian Portsea Front Beach Wave Modelling and Monitoring Investigation
Page 22
301015-03540-Report-Rev 0 160115.docm
can change offshore wave climates in respect of wave height and direction. Changes in the
nearshore bathymetry can affect both nearshore wave height and direction through changes to the
wave transformation processes of shallow water wave refraction and diffraction. Changes in
nearshore bathymetry can be effected naturally by changes to the morphology of sand banks
through sand transport under tidal action, or they can be induced by dredging.
4.2 Morphology Study
Bird (2011) presented historical photographs showing large variations in the width of the beach at
Portsea pier, which was wide in 1914 but much narrower in the 1950s, indicating previous erosion.
Portsea Front Beach has experienced a significant re-alignment over the past 10 years.
Measurements taken from Google earth, shown in Figure 27, have indicated that the beach has
swung anticlockwise with some 30 m of shoreline recession at the western end of the beach near
the Pier and some 14 m of accretion at the eastern end of the beach. The recession at the western
end could have been greater if not for the rock and sandbag revetments constructed since 2012.
21/11/2005: 120.2 m
21/11/2005: 16.7 m
10/2/2015: 150.4 m
Net Change: 30 m recession
10/2/2015: 30.5 m
Net Change: 14 m accretion
Figure 27 Changes in foreshore alignment at Portsea Front Beach 2005 to 2015 (Courtesy Google earth)
Department of Environment, Land, Water & Planning, Victoria
Portsea Front Beach
Wave Modelling and Monitoring Investigation
Advisian Portsea Front Beach Wave Modelling and Monitoring Investigation
Page 23
301015-03540-Report-Rev 0 160115.docm
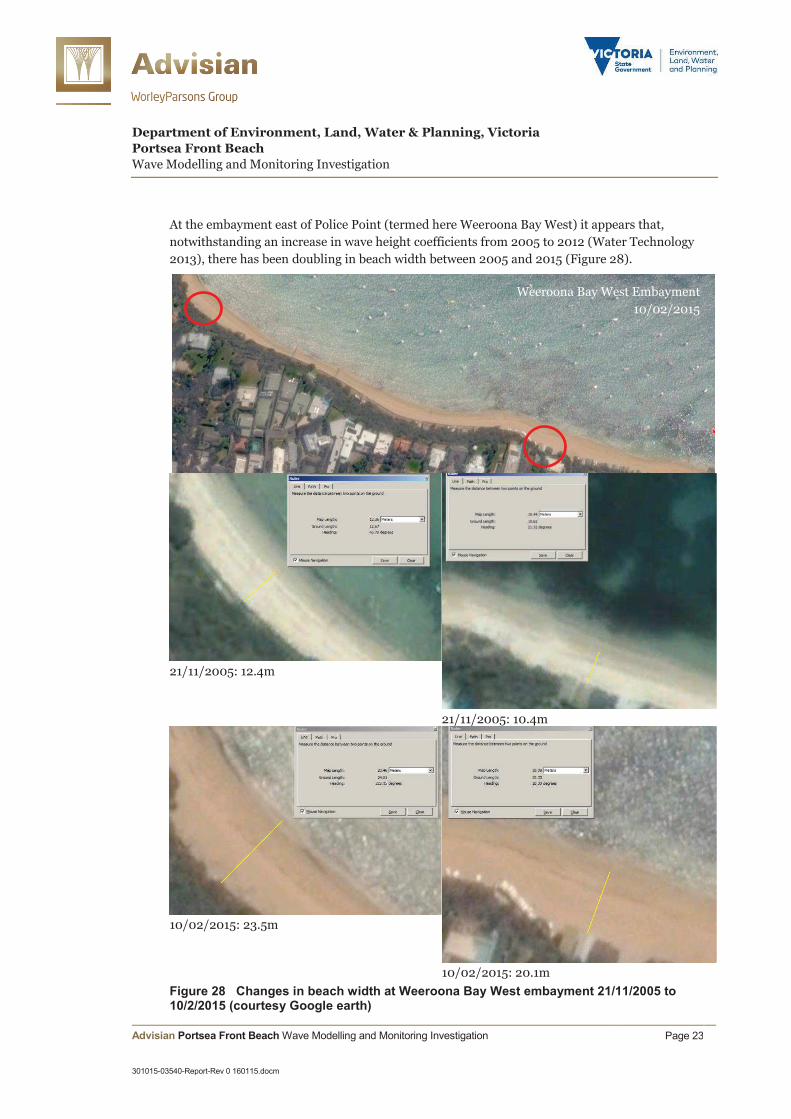
At the embayment east of Police Point (termed here Weeroona Bay West) it appears that,
notwithstanding an increase in wave height coefficients from 2005 to 2012 (Water Technology
2013), there has been doubling in beach width between 2005 and 2015 (Figure 28).
21/11/2005: 12.4m
21/11/2005: 10.4m
10/02/2015: 23.5m
10/02/2015: 20.1m
Figure 28 Changes in beach width at Weeroona Bay West embayment 21/11/2005 to 10/2/2015 (courtesy Google earth)
Weeroona Bay West Embayment
10/02/2015

Department of Environment, Land, Water & Planning, Victoria
Portsea Front Beach
Wave Modelling and Monitoring Investigation
Advisian Portsea Front Beach Wave Modelling and Monitoring Investigation
Page 24
301015-03540-Report-Rev 0 160115.docm
However, these beaches can fluctuate seasonally (Aurecon, 2012) and comparing two snapshot
images may not reflect a long term trend.
4.3 Sediment Budget
Estimates of the sediment budget for Portsea Front Beach have been made based on
computations of the rates of littoral drift transport calibrated on measured changes to the beach
alignment.
The assessment of littoral drift transport indicated that the active beach profile was some 3.5 m
high. The accretion of the Weeroona Bay (West) foreshore of 10 m (average) over 9 years gave an
average annual rate of accretion for the 660 m long embayment of 2,500 m3/a. For the 300 m
long segment of Portsea Front Beach that has been eroded so severely, the average annual rate of
erosion was 1,800 m3/a. For the eastern 150 m segment of Portsea Front Beach that has accreted,
the average annual rate of accretion was 400 m3/a.
Alongshore potential rates of littoral drift transport (Appendix D) were calibrated with the results
of a morphology study and varied from 6,000 m3/a around Police Point, 3,500 m3/a directed
easterly along Weeroona Bay West to a maximum rate of littoral drift transport of around
5,300 m3/a at the Pier. Farther to the east the transport rate around Pont Franklin was calculated
to be 4,900 m3/a.
A sediment budget for the Weeroona Bay beaches has been derived as presented in Figure 29.
Figure 29 Sediment Budget for Weeroona Bay (November 2005 to February 2015)
4.4 Littoral Drift Transport Rates
Littoral drift transport rates were computed and calibrated with quantified shoreline changes
gleaned from the morphology study to estimate the annual rates of littoral drift transport along
the Weeroona Bay foreshore and are presented in Figure 30. It is noted that these results are
preliminary as there are no data available to verify the modelling.
2,500 m3/a accretion
400 m3/a accretion 1,800 m3/a
erosion

Department of Environment, Land, Water & Planning, Victoria
Portsea Front Beach
Wave Modelling and Monitoring Investigation
Advisian Portsea Front Beach Wave Modelling and Monitoring Investigation
Page 25
301015-03540-Report-Rev 0 160115.docm
Figure 30 Historic (November 2005 to February 2015) annual rates of littoral drift transport (photo courtesy Google earth)

Department of Environment, Land, Water & Planning, Victoria
Portsea Front Beach
Wave Modelling and Monitoring Investigation
Advisian Portsea Front Beach Wave Modelling and Monitoring Investigation
Page 26
301015-03540-Report-Rev 0 160115.docm
5 Summary and Conclusions
This investigation has considered and incorporated previous reports and data on erosion and
wave climate and has described and quantified the coastal processes relevant to the erosion of
Portsea Front Beach to inform the Department, the community and stakeholders for future
coastal management directions.
Detailed numerical models have been developed to examine tidal hydrodynamics, wave
transformation and sediment transport processes. Wave transformation modelling has
incorporated the tidal hydrodynamics to investigate the impact of tidal streams on wave
propagation. The combined impacts of wave refraction and diffraction have been simulated using
a Boussinesq-type wave modelling program. Boussinesq-type equations present the most
complete solution to wave transformation that is available and have been used to predict
accurately wave evolution across large basins, wave breaking over irregular topography, wave–
structure interaction and wave-induced current patterns, among other advances.
Environmental monitoring instruments were deployed at four locations to provide data on waves,
currents, water levels and sediment transport to calibrate the numerical models, validating that
the models represented the physical processes in the investigation area to best practice standards.
In conjunction with recognised experts from the Australian Institute of Marine Science,
Townsville and the University of New South Wales Water Research Laboratory, advanced
scientific methods have been used to monitor sand transport in the field and the data have been
applied to calibrate and verify successfully, and to a level of resolution rarely attainable, the sand
transport modelling undertaken on Quarantine Bank.
Based on 2012 bathymetry, the modelling has provided estimates of annual nearshore wave
climates and littoral drift transport potentials along the Weeroona Bay foreshore along with gross
and net annual sediment transport rates on Quarantine Bank.
The modelling has shown that swell wave energy entering Port Phillip Bay is directed towards the
Mornington Peninsula along sand banks lying between South Channel and Sorrento Channel
through the process of wave refraction causing total internal wave reflection off the channels
adjacent to Quarantine Bank. In recent times part of this wave energy has been refracted off the
sandbanks onto Portsea Front Beach, causing erosion there.
Field monitoring and modelling has indicated that sediment transport rates on Quarantine Bank
are relatively high. Large sand wave features attest to high rates of sediment transport with
comparative surveys indicating changes in seabed levels of up to five metres over periods of as
little as two years. In these relatively shallow depths the sand wave lengths are of a similar scale to
the incident swell wavelengths and such depth changes have the potential to change significantly
the direction and energy of wave transformation.
Comparative wave transformation modelling based on seabed bathymetry surveyed in the years
2007, 2010 and 2012 has indicated that the direction and energy of wave incidence onto the
Weeroona Bay foreshore, which includes Portsea Front Beach, could have varied significantly
between each of those years as a result of changes in the morphology of Quarantine Bank.
However, changes to the levels of incident wave energy could be attributed also to changes in
meteorological conditions. Nevertheless, as the rate and direction of littoral drift transport and,

Department of Environment, Land, Water & Planning, Victoria
Portsea Front Beach
Wave Modelling and Monitoring Investigation
Advisian Portsea Front Beach Wave Modelling and Monitoring Investigation
Page 27
301015-03540-Report-Rev 0 160115.docm
hence, beach alignment are related directly to nearshore wave height and direction, future
changes in beach alignment at Portsea Front Beach can be expected.
The increased wave energy incident at Portsea Front Beach, near the pier, has resulted in an
increase in the potential rate of littoral drift transport eastward, which is greater than that being
supplied from the western part of Weeroona Bay. Also, the increased wave energy levels,
particularly during storms, has resulted in dune erosion and increased net offshore sand
transport. The deficits in the rates of littoral drift transport have resulted in foreshore recession
near the pier at Portsea Front Beach. Farther eastward the incident wave energy reduces,
resulting in accretion at the eastern end of Weeroona Bay. This is causing the shoreline to rotate.
The design of works to manage future changes to Portsea Front Beach resulting from changes in
the nearshore wave climate can be informed by the field and modelling data delivered with this
project. The Department has advised that it will investigate coastal zone management options
following the completion of this investigation.
To improve further the understanding of the changes to Portsea Front Beach, a range of
monitoring could be conducted, including:
§ regular 2-yearly LADS surveys of the Quarantine Bank, which could be compared with
historical surveys and tested for any changes in wave transformation processes with the
numerical wave models developed for this project
§ beach profiling of Weeroona Bay at six-monthly intervals and at 50 m spacing from 5 m
behind the dune crest to a water depth of -1 m LAT. Profiling using photogrammetry could be
used also to investigate further historical changes.

Department of Environment, Land, Water & Planning, Victoria
Portsea Front Beach
Wave Modelling and Monitoring Investigation
Advisian Portsea Front Beach Wave Modelling and Monitoring Investigation
Page 28
301015-03540-Report-Rev 0 160115.docm
6 References
Aurecon (2012). Portsea Beach Pre-Feasibility Assessment of Erosion Response Options, Options
Assessment, Aurecon report Reference 227093 prepared for Department of Sustainability and
Environment, May, 2012.
Bird, E. (2011). Changes on the Coastline of Port Phillip Bay, Office of the Environmental Monitor,
Victorian Government Department of Sustainability and Environment, Melbourne, March 2011.
Cardno (2011a). The Great Sands and Adjacent Coasts and Beaches, Cardno Report
RM2289_LJ5518, 137pp, report prepared for Port of Melbourne Corporation, 16 March 2011.
Cardno (2011b). Sediment Transport Modelling Great Sands, Port Phillip, Cardn0 report
RM2271/LJ5518 Ver. 1.0, 78pp, prepared for Port of Melbourne Corporation, 16 March 2011
Nielsen, A.F., R.I. Bonner & A. Berthot (2011). Wave energy reflection off dredged channels, IAHR,
Brisbane, June, 2011.
Van Rijn, L.C. (1989). Handbook Sediment Transport by Currents and Waves, Delft Hydraulics
Report H461.
Water Technology (2013). Review of Wave Transformation Processes through Port Phillip Heads,
Water Technology Report No. 2668-01R02v04 prepared for the Department of Sustainability and
Environment, March.