Embed Size (px)
Citation preview
1
Portfolio Risk and Investment Horizon of Institutional Investors
Ping-Wen Sun
International Institute for Financial Studies
Jiangxi University of Finance and Economics
Nanchang, Jiangxi, China
Chien-Ting Lin*
Department of Finance
Deakin University
Burwood, Victoria, Australia
and
Jiun-Lin Chen
School of Accounting and Finance
University of Adelaide
Adelaide, SA Australia
*Corresponding author

2
Portfolio Risk and Investment Horizon of Institutional Investors
Abstract
We examine the relationship between portfolio risk and investment horizon of
institutional investors and its effect on equity returns. We find that short-term institutions
outperform long-term institutions partly due to higher systematic risks. In particular, the
former experience higher factor loadings in Carhart's (1997) four-factor model and the
liquidity risk factor of Pastor and Stambaugh (2003). While stocks increased by short-term
institutions outperform those by long-term institutions by 0.14% per month, they exhibit
higher factor loadings on market, firm size, and momentum. Our findings offer an
additional explanation for the higher returns of short-term institutions.
JEL classification: G11, G12, G14, G20
Keywords: Institutional investors; investment horizons; portfolio risk; portfolio
characteristics
3
1. Introduction
Since Nofsinger and Sias (1999) and Gompers and Metrick (2001) report that
institutional trading varies positively with future stock returns, there have been on-going
investigations into the source(s) of the relationship. One possible source is the information
role of institutional investors. Puckett and Yan (2013) show that interim trading
performance of institutional investors is positive and persistence due to their superior
trading skills. In particular, Yan and Zhang (2009) find that short-term institutions’ trading
is positive related to higher future returns and earnings surprises without price reversal for
up to 3 years. Brockman et al. (forthcoming) show that short-term institutions tend to
underweight financial firms relative to non-financial firms around the recent great
recession. The findings suggest that informed institutional investors tend to trade more
frequently to exploit their superior information and skills for higher returns.
However, Chen et al. (2007) and Attig et al. (2013) find that firms invested by long-
term institutions tend to have better performance or lower cost of equity due to improved
monitoring and information quality. In mergers and acquisitions, Gaspar et al. (2005)
show that target firms with short-term shareholders are more likely to receive an
acquisition bid with lower premiums. They suggest that the weaker monitoring role by
short-term institutions may allow managers to proceed with value-reducing acquisitions at
the expense of shareholders. Therefore, the stability of long-term institutional holdings is
viewed as an advantage in collecting information and monitoring firms more effectively.
In this paper, we explore another potential source of the relationship between the
heterogeneity of institution investment horizons and equity returns. We examine whether
the observed relationship can be explained from the neoclassical risk-return tradeoff
paradigm. In other words, can higher returns of short-term institutions be in part driven by
higher systematic risks in their portfolios? Although our question appears to be quite
4
elementary, it is surprising that few studies, to our knowledge, have directly examined the
risks of institutional portfolios in relation to their investment horizons. One such study is
Cao and Petrasek (2014) who find that stocks held by hedge funds which are often
considered as short-term institutions exhibit higher liquidity risk than those held by other
types of institutions. Much of the extant literature however remains largely focused on
institutions’ information advantage, stock picking skills or trading impacts on security
prices and market movements (e.g. Wermers (1999 and 2000), Sias (2004), Dasgupta et al.
(2011a, 2011b), and Cella et al. (2013)).
Our investigation is also motivated by a strand in the literature that examines
institutional ownership and stock return volatility. Sias (1996) shows that institutional
ownership varies positively with security return volatility and contends that it is itself the
cause of increased volatility. Falkenstein (1996) also finds that mutual fund managers are
averse to stocks with lower volatility. In more in-depth studies, Gabaix et al. (2005) and
Greenwood and Thesmar (2011) find that increased volatility is driven by concentrated
ownership and correlated liquidity shocks - characteristics related to institutional
ownership. As institutional portfolios tend to tilt towards stocks that form part of their
benchmark index, Basak and Pavlova (2013) report that trades by institutions induce
excessive correlations among index stocks and hence amplifying stock volatilities.
While these studies find that institutional ownership is related to higher risk, they treat
institutions as a homogenous group of investors. However, Cella et al. (2013) suggest that
trading horizons are related to investors’ organizational structures. They show that hedge
funds and investment companies exhibit the highest turnover rates while insurance
companies, pension funds, and endowments have the lowest turnover rates. These
variations in investment horizons of institutions are likely to be driven by different
investment objectives, mandates, and clienteles. By separating institutions into short-term
5
and long-term investors, our study should provide more insights into the relationship
between portfolio risk and investment horizons.
Finally, Yan and Zhang (2009) highlight that there are differences between short-term
and long-term institutional preferences. Eventhough both types of institutions tend to
choose large stocks, stocks with higher book-to-market equity, share price, and volatility,
short-term institutions prefer younger firms, and firms with higher turnover and lower
dividend yields. They also tend to be momentum traders. Furthermore, Lewellen (2011)
and Hotchkiss and Strickland (2003) find that high turnover institutions tend to tilt toward
small firms and firms with high momentum. Similarly, Bushee (2001) shows that transient
investors with high turnover and more diversification are associated with an over- (under-)
weighting of near-term (long-term) expected earnings. These systematic differences in
preferences that lead to variations in subsequent returns may reflect differences in
systematic risks inherent in their portfolios.
Our empirical results confirm that short-term institutions tend to enjoy higher returns
than long-term institutions. However, their stock portfolios also appear to be related to
higher systematic risks. In particular, short-term institutions prefer stocks with higher beta
according to CAPM. They also exhibit higher factor loadings on the return differences
between small and big size portfolios (SMB) and between past winner and loser portfolios
(UMD) in Carhart’s (1997) four-factor model. Furthermore, short-term institutions prefer
high liquidity stocks as they tend to choose stocks with lower factor loading on the return
difference between high and low liquidity risk portfolios (LIQ) of Pastor and Stambaugh
(2003). Our results suggest that part of the higher returns of short-term institutions is likely
to be driven by holding stocks with higher systematic risks in their portfolios even if they
are more informed.
6
Consistent with previous studies, we find that short-term institutions prefer smaller and
younger firms, firms with lower dividend yields, and firms with higher volatility and
turnover rate. They also prefer past winners. It is also important to note that short-term
institutions have less concentrated stock holdings and lower percentage holdings in
individual stocks. Taken together, short-term institutions prefer riskier stocks but are more
diversified to help reducing unsystematic risk.
In analyzing trading patterns (i.e. changes in share holdings) of institutional investors,
we find that stocks that are increased relative to those that are decreased by short-term
institutions contain higher factor loadings on market risk premium, SMB, and UMD, but
lower loadings on HML (return differences between high and low book-to-market equity
portfolios), and LIQ. The results are consistent with Lewellen (2011) who report that high
turnover institutions tend to invest in small and low book-to-market. While long-term
institutions also prefer stocks with higher factor loading on market beta, they tend to
increase stocks with lower factor loadings on SMB and HML. It appears that trading
behaviors of long-term institutions tend to associate with lower systematic risks on size
and book-to-market factors.
When we cross compare stocks increased by short-term institutions with those by
long-term institutions, the former tends to increase stocks with higher factor loadings on
market risk, SMB, and UMD, but lower factor loading on LIQ. Since short-term
institutions have higher turnover, it is not surprising that they prefer more liquid stocks
than long-term institutions. Over the same corresponding sample period from 1980 to
2012, stocks increased by short-term institutions outperform those by long-term
institutions by 0.14% per month. This equates to $5.10 million per month in an average
portfolio of $3.64 billion (the average holding size of short-term institutions), a monthly
return difference that is economically significant. Consistent with the evidence that short-

7
term institutions select stocks with higher systematic risk for better performance, they tend
to unload stocks with lower factor loadings on HML and UMD, and higher factor loading
on LIQ relative to their long-term counterparts.
Overall, our findings contribute to the literature by providing further insights into
different investment and trading behaviors between short-term and long-term institutions
in relation to risk in the following ways. First, our investigations reveal that institutional
investors tend to vary their investment horizons inversely with portfolio risks. Short-term
institutional portfolios on average exhibit higher systematic risks than long-term
institutional portfolios. Institutions who pursue strategies with shorter (longer) duration are
more likely to trade stocks with higher (lower) systematic risks. It appears that the risk and
return trade-off paradigm are applicable to institutional portfolios even when some
institutions possess superior information set and skills.
Second, short-term institutions which are more diversified (e.g. lower Herfindahl index)
may attempt to reduce unsystematic risk of their portfolios to offset stocks of higher
systematic risks. Alternatively, short-term institutions may include more stocks in their
portfolios to take advantage of their private information. By contrast, long-term
institutions which choose fewer stocks in their portfolios are consistent with Chen et al.
(2007) and Attig et al. (2013) who suggest that long-term institutions play an important
monitoring role. With fewer stocks in their portfolios, long-term institutions are more
likely to monitor firms closely and effectively than short-term institutions.
Third, both short-term and long-term institutions hold stocks with higher market risk in
their portfolios, suggesting that institutional investors are less risk-averse than individual
investors. Therefore, while previous studies show that institutional investors, especially
short-term institutions, may achieve higher returns, it could partly come at the expense of

8
higher systematic risks. It follows that individual investors should take into account their
own risk profiles when investing in institutional funds.
The rest of the paper is organized as follows. Section 2 describes our data and
measurements of short-term and long-term institutions. Section 3 reports our empirical
results and the last section concludes the paper.
2. Data and measurements
2.1 Data
Securities and Exchange Commission (SEC) requires all institutions with greater than
$100 million of equity securities to report their quarterly holdings in SEC Form 13F.
Accordingly, we access quarterly institutional ownership data from Thomson-Reuters
institutional holdings (13F), formerly known as CDA/Spectrum, from the first quarter of
1980 to the fourth quarter of 2012. Information such as price, trading volume, and stock
returns (share code 10 or 11) and financial statement items such as book value, total assets,
and cash dividends are collected from Center for Research in Security Prices (CRSP) and
Compustat respectively. Carhart's (1997) four factors and Pastor and Stambaugh (2003)
liquidity risk factor are obtained from Wharton Research Data Services (WRDS).
2.2 Classification of short-term and long-term institutions
Following Yan and Zhang (2009), we classify institutional investors into short-term
and long-term institutions based on their portfolio turnovers over the past four quarters.
We first summarize each institution’s stock i holding cash inflow/outflow in quarter t and
calculate its aggregate purchase and sale at the end of quarter t as follows,

9
, , , , , 1 , , , , , 1 , 1 , , 1 ,
1
_kN
k t k i t k i t k i t i t k i t i t k i t i t
i
CR buy S S S P S P S P
(1)
, , , , , 1 , , , , , 1 , 1 , , 1 ,
1
_kN
k t k i t k i t k i t i t k i t i t k i t i t
i
CR sell S S S P S P S P
(2)
where tkbuyCR ,_ and tksellCR ,_ are institution k’s aggregate purchase and sale for
quarter t respectively, Sk,i,t-1 and Sk,i,t are number of shares of stock i held by institution k at
the end of quarter t-1 and t respectively, Pi,t-1 and Pi,t are listed share prices of stock i at the
end of quarter t-1 and t respectively. We use CRSP price adjustment factor to adjust stock
splits and stock dividends for stock i’s price change ∆Pi,t at the end of quarter t.
Next, we calculate institution k's churn rate, tkCR , , at the end of quarter t as the
minimum of aggregate purchase and sale divided by its average portfolio holding value
during quarter t,
, ,
,
, , , , , 1 , 1
1
min _ , _
2
k
k t k t
k t Nk i t i t k i t i t
i
CRCR buy CR sell
S P S P
(3)
To measure changes in institutional ownership according to the equations above, our
sample period starts from 1981, a year after our sample begins for a total of 128 quarterly
observations.
Finally, we calculate each institution's average churn rate over the past four quarters.
3
, ,
0
_1
4k t k t j
j
AVG CR CR
(4)

10
At the end of each quarter, we sort each institution's AVG_CRk,t into three groups. Those
that are in the highest tercile are classified as short-term institutions while those in the
lowest tercile are considered as long-term institutions.
2.3 Measurements for market timing, stock picking, and skill index
To measure institutions’ abilities on market timing and stock picking, we follow
Kacperczyk et al. (2014) who develop measures to assess fund managers’ skills. For fund j
at time t, j
tTiming measures how fund j’s holdings of each asset, relative to the market,
comove with the systematic component of the stock return. Before the market return
increases, a fund with a high timing ability ( j
tTiming ) should overweight assets that have
high betas.
jNj j m m
t i,t i,t i,t t+1
i=1
Timing = (w -w )( R ) (5)
where the portfolio weight j
i,tw is the fraction of fund j's total assets held in risky asset i at
the start of time t and the market weight m
i,tw is the fraction of total market capitalization in
asset i. i,t measures the covariance of stock i's return with the market return m
tR divided
by the variance of the market return. The return m
t+1R is the realized market return between
the beginnings of period t and t+1, and j
tPicking measures how fund j's holdings of each
stock, relative to the market, comove with the idiosyncratic component of the stock return:
jNj j m i m
t i,t i,t t+1 i,t t+1
i=1
Picking = (w -w )(R R ) (6)

11
According to Eq. (6), a fund with a high picking ability will overweight assets with
subsequently high idiosyncratic returns and underweight assets with low idiosyncratic
returns. j
tTiming and j
tPicking are expressed in units of return per quarter. Kacperczyk et al.
(2014) further develop a skill index for fund j in month t + 1 as a weighted average of
j
tTiming and j
tPicking , where the weights (w) of each measure depend on the state of the
business cycle.
t
j
t wSkill 1 Timing j
tt
j
t Pickingw )1( (7)
Timing and Picking are normalized with a mean of zero and a standard deviation of one in
the cross section for each period. w which varies between 0 and 1 is the recession
probability from survey of professional forecasters.1
2.4 Factor loadings in asset pricing models
To estimate factor loadings of a portfolio, we first use market beta based on CAPM.
We then follow Hou and Moskowitz (2005), Fang and Peress (2009), and Huang et al.
(2011) and use Carhart (1997) 4-factor model with aggregate liquidity risk factor of Pastor
and Stambaugh (2003). We regress monthly portfolio returns on monthly market excess
return for beta in CAPM or on monthly return difference on each factor for the factor
loading in the following 5-factor model over 60 months with a minimum of 36 monthly
observations.
1 The recession probability can be obtained from http://www.phil.frb.org/research-and-data/real-time-
center/survey-of-professional-forecasters/historical-data/probability-variables.cfm
12
tpttttttp eLIQUMDHMLSMBMKTR ,543210, (8)
where Rp,t is portfolio excess return at time t, MKTt is the market risk premium, SMBt is
the return difference between small and big portfolios, HMLt is the return difference
between high and low book-to-market equity portfolios, UMDt is the return difference
between winner and loser portfolios, and LIQt is the return difference between high and
low liquidity risk portfolios.
3. Empirical results
3.1 Summary statistics of institutional portfolios
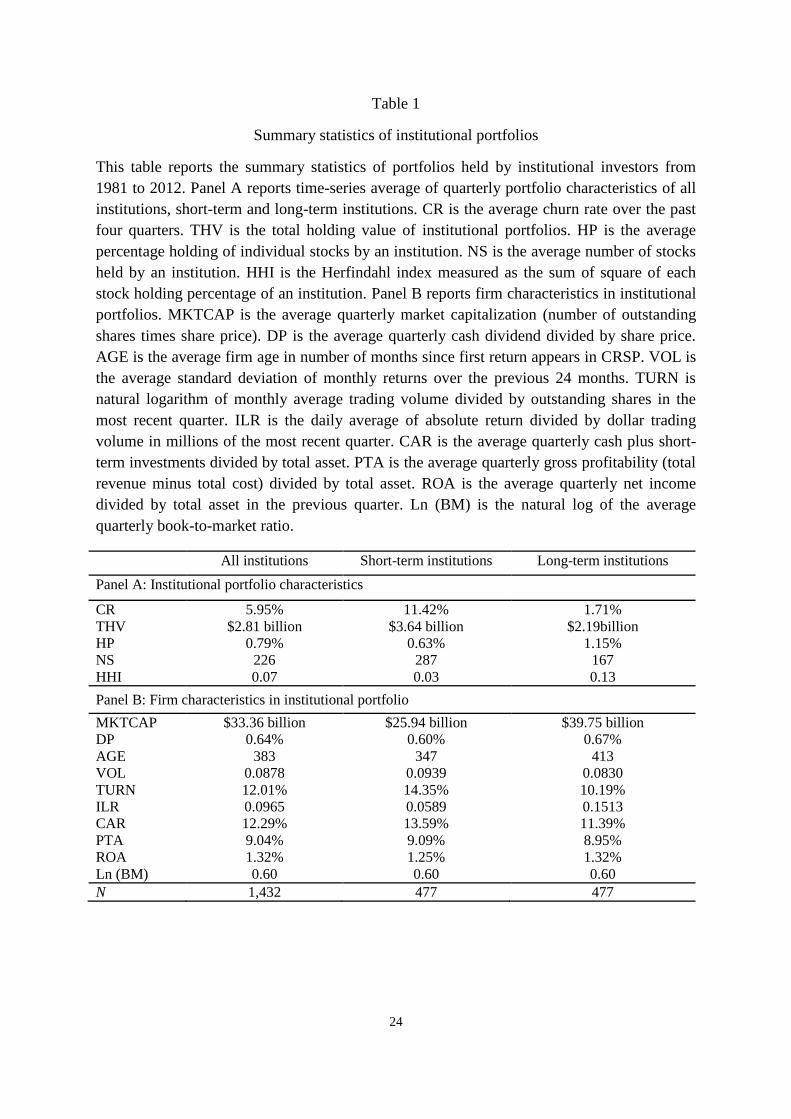
We first report the summary statistics of institutional portfolios. Panel A of Table 1
shows that there is a large difference in the average churn rate (CR) between short-term
(11.42%) and long-term institutions (1.71%). The extent of active investment can vary
substantially among institutional investors. Short-term institutions with higher turnover
hold an average of $3.64 billion in their portfolio (THV) compared to long-term
institutions of $2.19 billion. Furthermore, the former own an average of 0.63% (HP) of a
stock in their portfolios relative to the latter of 1.15%. While short-term institutions have
less percentage holding of individual stocks, their portfolios consist of more stocks. Based
on our sample, short-term and long-term institutions hold an average of 287 and 167
stocks respectively. The Herfindahl index (HHI), the sum of square of each stock holding
percentage of an institution, for measuring stock concentration confirms that short-term
institutions are more diversified than long-term institutions with an average HHI of 0.03
compared to that of 0.13.
13
Panel B of Table 1 reports firm characteristics in portfolios held by both types of
institutions. Given that they are more diversified, short-term institutions tend to choose
firms that are smaller (MKTCAP), younger (AGE) and with lower dividend yields (DP),
Amihud's (2002) price impact measure (ILR), and return on asset (ROA). They are also
more likely to exhibit higher volatility (VOL), turnover rate (TURN), cash ratio (CA), and
gross profitability ratio (PTA). Interestingly, several of these firm characteristics that
differ between short-term and long-term institutions are closely related to various
dimensions of systematic risks.
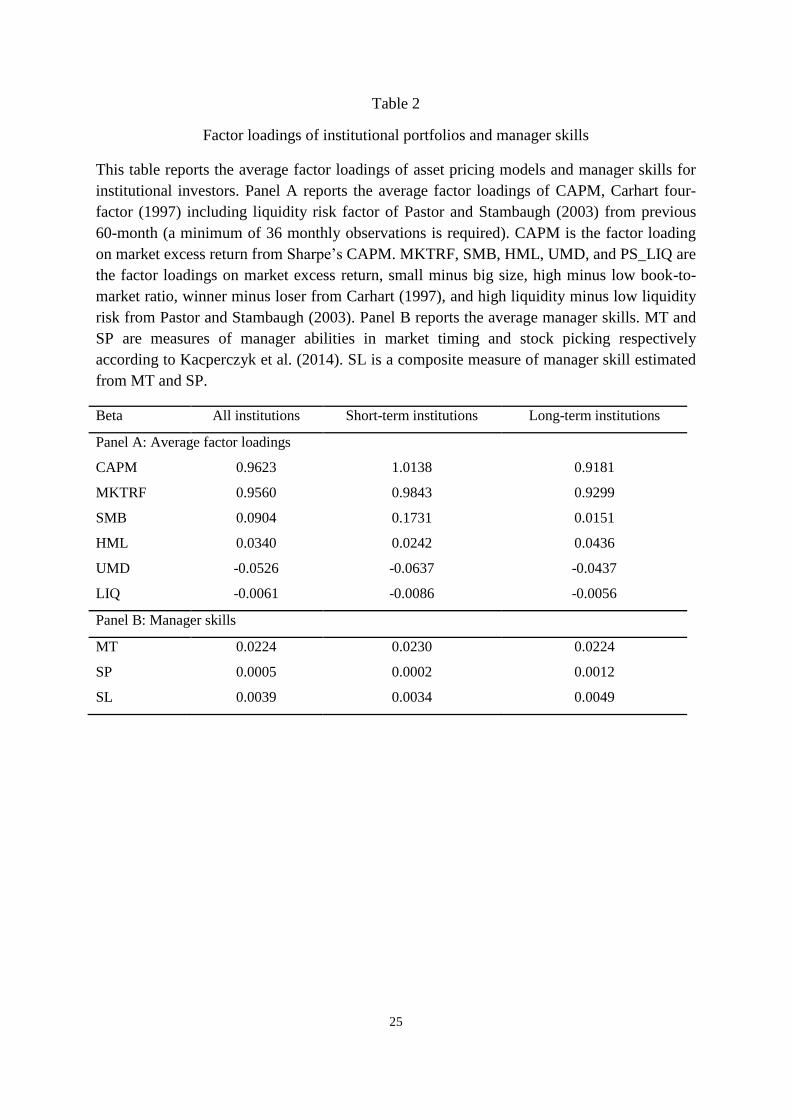
As Table 1 shows that portfolio characteristics differ between institutions, Table 2
highlights that factor loadings related to the systematic factors also vary between them.
For example, short-term institutions have higher market beta according to CAPM. They
also experience higher factor loading on firm size (SMB) but lower factor loadings on
value (HML) and momentum (UMD) in Carhart (1997) four-factor model. In addition,
they show lower factor loadings related to liquidity risk (LIQ) in Pastor and Stambaugh
(2003) model. Differences between factor loadings raise the question of whether different
portfolio returns between short-term and long-term institutions documented in the
literature can, in part, be explained by differences in their systematic risks.
To demonstrate that different portfolio returns among institutional investors can be
driven by differences in factor loadings, we first calculate the average monthly risk
premium of each factor according to the asset pricing models. We then multiply the
monthly risk premium with the differences in factor loadings related to each factor. Based
on CAPM where the monthly market risk premium is 0.58%, short-term institutions are
expected to earn 0.0957*0.58% = 0.0555% more than long-term institutions per month.
According to Carhart (1997) four-factor model where the monthly risk premiums related
to SMB, HML, and UMD are 0.12%, 0.37%, and 0.60% respectively, the monthly
14
expected return for short-term institutions should be 0.0544*0.58% + 0.158*0.12% + (-
0.0194)*0.37% + (-0.02)*0.60% = 0.0298% higher than that of long-term institutions. In a
five-factor model that includes Pastor and Stambaugh (2003) liquidity risk factor with a
monthly risk premium of 0.52%, the monthly expected return is 0.0298% + (-0.003)*0.52
= 0.0282% higher than long-term institutions. These illustrations show that differences in
betas of systematic factors may account for different returns between short-term and long-
term institutions.
An alternative explanation for different portfolio returns is that institutional managers
may possess different information set and stock picking abilities. Using Kacperczyk et al.
(2014) measures of market timing (MT), stock picking (SP), and skill level (SL), Panel B
shows that short-term institutions have more ability in market timing but lower ability in
stock picking. Combining these two measures, long-term institutions seem to exhibit
higher skill level than short-term institutions. Our preliminary results are therefore not
consistent with Yan and Zhang (2009) who find that short-term institutions are better
informed with superior skills.
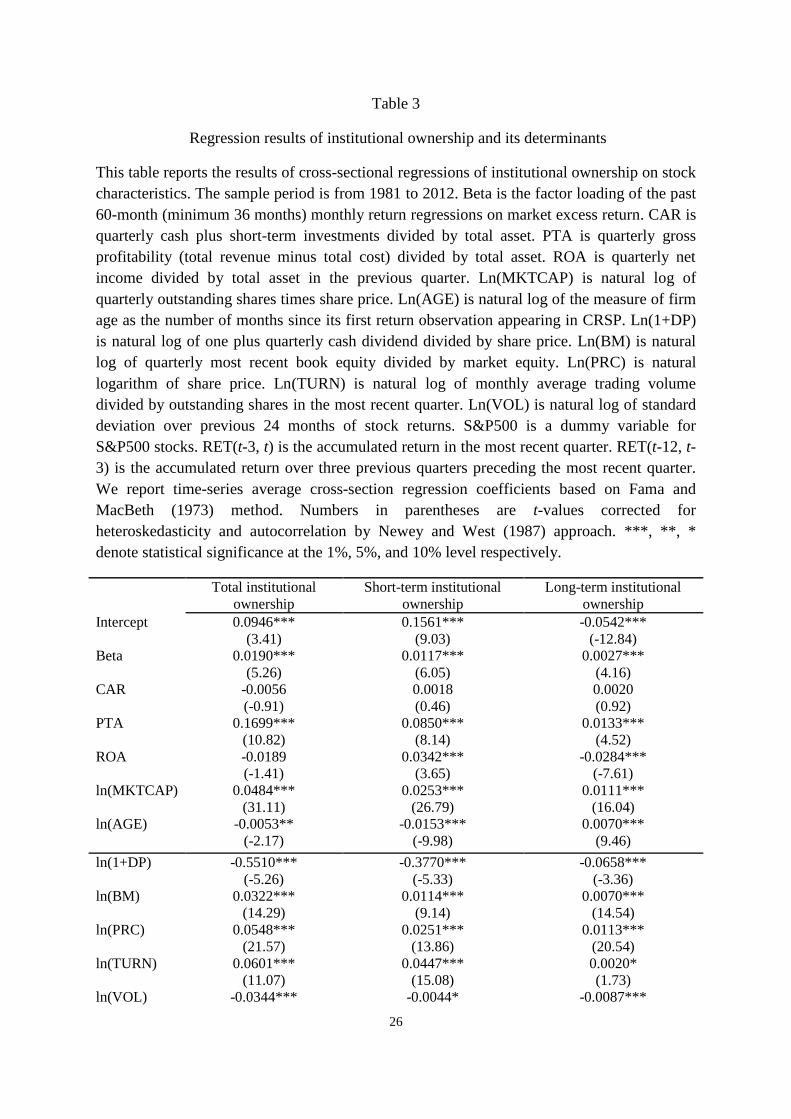
3.2 Institutional ownership and firm characteristics
Sequel to the preliminary results, we run Fama and Macbeth (1973) regressions to
examine the relationship between institutional ownership and firm characteristics. We
follow Gompers and Metrick (2001) and Yan and Zhang (2009) for the following firm
characteristics.
titititi
tititititi
titititititi
ettRETbttRETbPSb
VOLLnbTURNLnbPRCLnbBMLnbDPb
AgeLnbMKTCAPbROAbPTAbCARbbetabaIO
,,14,13,12
,11,10,9,8,7
,6,5,4,3,210,
)3,12(),3(500&
)()()()()1ln(
)()ln(
(9)
15
where IOi,t is total institutional ownership, short-term institutional ownership, or long-term
institutional ownership. beta is the market risk according to CAPM. CAR is quarterly cash
plus short-term investments divided by total asset (see Palazzo (2012)). PTA is quarterly
gross profitability (total revenue minus total cost) divided by total asset (see Novy-Marx
(2013)). ROA is quarterly net income divided by total asset in the previous quarter.
Ln(MKTCAP) is natural log of quarterly outstanding shares times share price. Ln(AGE) is
natural log of firm age in months since first return observation appears in CRSP. Ln(1+DP)
is natural log of one plus quarterly cash dividend divided by share price. Ln(BM) is natural
log of quarterly most recent book equity divided by market equity. Ln(PRC) is natural log
of share price. Ln(TURN) is natural log of monthly average trading volume divided by
outstanding shares in the most recent quarter. Ln(VOL) is natural log of standard
deviations of previous 24 monthly stock returns. S&P500 is a dummy variable for S&P
500 stocks. RET(t-3, t) is accumulated return in most recent quarter. RET(t-12, t-3) is the
accumulated return over the previous 3 quarters preceding the most recent quarter.
Table 3 shows that consistent with Gompers and Metrick (2001) and Yan and Zhang
(2009), beta varies positively with institutional ownership for both short-term and long-
term institutions after controlling for other firm characteristics. It suggests that
institutional investors tend to engage in higher market risk with their portfolios.
Institutional investors also prefer firms that are larger (MKTCAP) and more profitable
(PTA), with lower dividend yields (DP) and volatility (VOL), but higher book-to-market
(BM), share prices (PRC), and turnovers (TURN). Between institutions however, short-
term institutions are more likely to choose stocks with higher return on assets (ROA). It is
also interesting to note that short-term institutions prefer younger firms (AGE) and firms
16
that are not included in the S&P 500 index. It confirms earlier results that size effect
appears to be an important factor in driving differences in institutional returns.
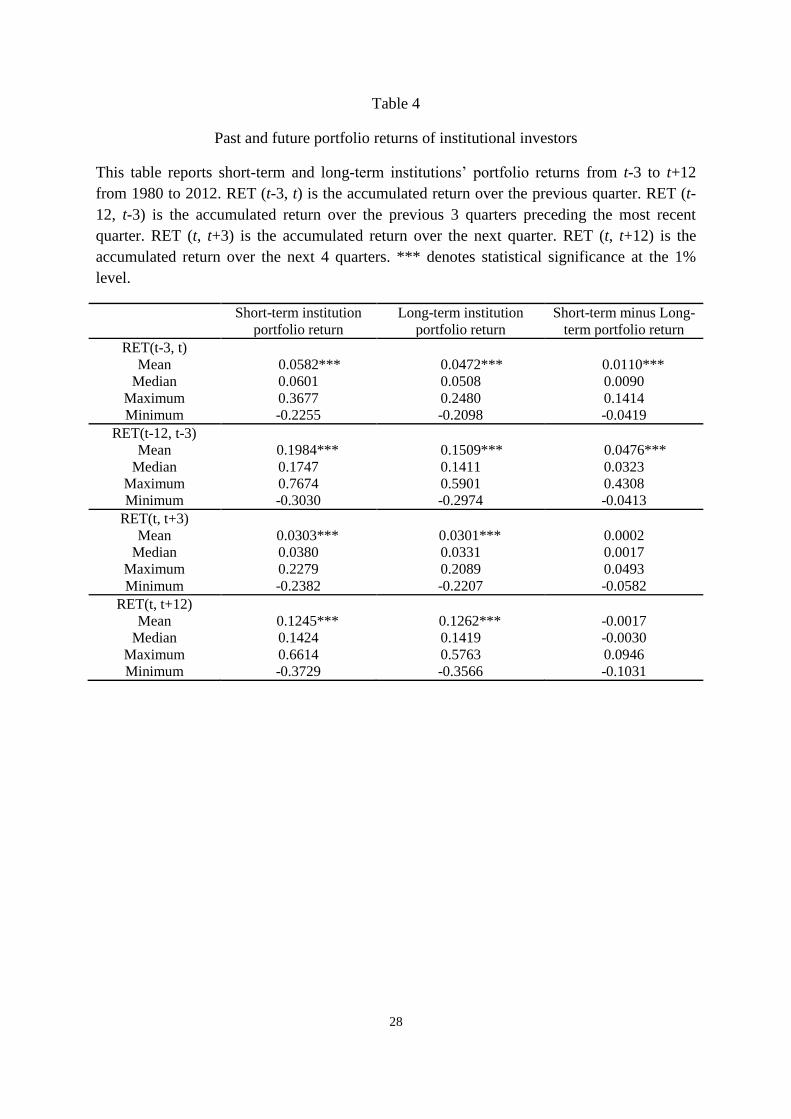
3.3 Holding returns of institutional investors
After examining differences in portfolio characteristics and factor loadings between
short-term and long-term institutions, we turn our attention to their holding returns. Table
4 reports portfolio returns from 4 previous to 4 subsequent quarters (t-12 to t+12). In the
previous quarter (RET (t-3, t)), short-term institutions exhibit higher returns than long-
term institutions by an average of 1.1%. Over the 3 quarters prior to the previous quarter
(RET (t-12, t-3)), the average difference in their returns is 4.76%. In dollar terms, short-
term institutions with an average portfolio size of $3.64 billion enjoy an excess of $213.30
million over the previous 12 months (t-12 to t). Our results are consistent with Yan and
Zhang (2009) who report that short-term institutions have better past performance. Taken
together with earlier results, short-term institutions which prefer past winners may also
bear higher systematic risk according to the risk-return tradeoff paradigm.
Interestingly, the superior performance of short-term institutions does not persist into
the future. Table 4 shows that there is little difference in average portfolio returns between
short-term and long-term institutions over the next quarter (RET (t, t+3)) and the next 4
quarters (RET (t, t+12)). Their holding returns tend to converge over time. To shed more
lights into institutions’ subsequent returns and risk characteristics, we examine future
returns in their trading portfolios. In particular, we investigate whether stocks that are
being traded in subsequent quarters differ in both returns and factor loadings between
short-term and long-term institutions. Results of their trading patterns may reveal whether
short-term institutions are engaging in riskier behavior than long-term institutions.
17
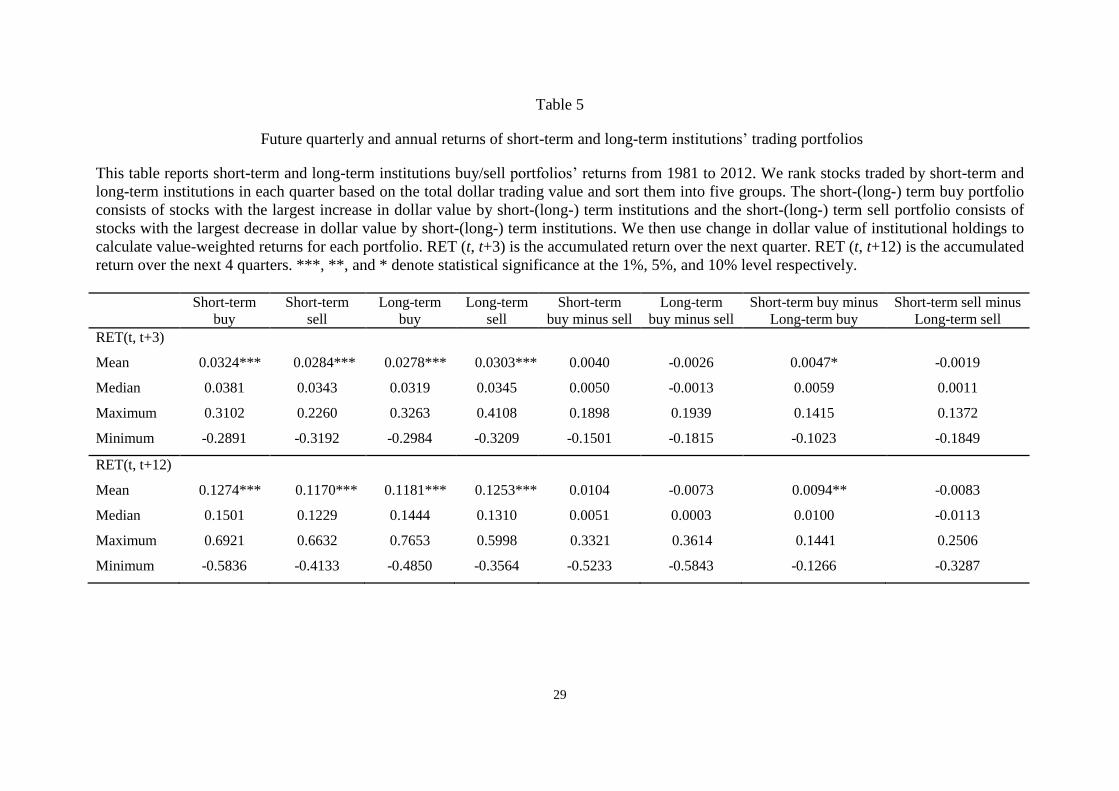
3.4 Trading performance and portfolio risk
For each quarter, we rank stocks traded by short-term and long-term institutions based
on the total dollar trading value and sort them into five groups. We then form value-
weighted (i.e. total dollar trading value) portfolios of short-term buy, short-term sell, long-
term buy, and long-term sell. The short-(long-) term buy portfolio consists of stocks with
the largest increase by short-(long-) term institutions and the short-(long-) term sell
portfolio consists of stocks with the largest decrease by short-(long-) term institutions.
Table 5 presents the results of next quarter (RET (t, t+3)) and annual (RET (t, t+12))
returns of institutions’ trading portfolios. The short-term buy portfolio has an average
quarterly return of 3.24% compared to the short-term sell portfolio of 2.84%. In contrast,
the long-term buy portfolio has an average quarterly return of 2.78% relative to the long-
term sell portfolio of 3.03%. Therefore, the short-term buy outperforms the long-term buy
portfolios by 0.47% per quarter while short-term sell portfolio underperforms long-term
sell portfolios by 0.19% per quarter. These trading return patterns persist over the
following 4 quarters. Our findings suggest that short-term institutions tend to pick up
“winners” and reduce “losers” more than long-term institutions.
To examine whether these stocks traded by short-term institutions differ in systematic
risk from those by long-term institutions, we again estimate their factor loadings based on
CAPM and Carhart’s (1997) four-factor model with Pastor and Stambaugh (2003)
liquidity risk factor in Eq. (7). Specifically, we first use the quarterly change in dollar
value of institutional holdings to obtain value weights for each buy and sell portfolios of
short-term and long-term institutions. We then estimate factor loadings from monthly
regressions over the sample period.
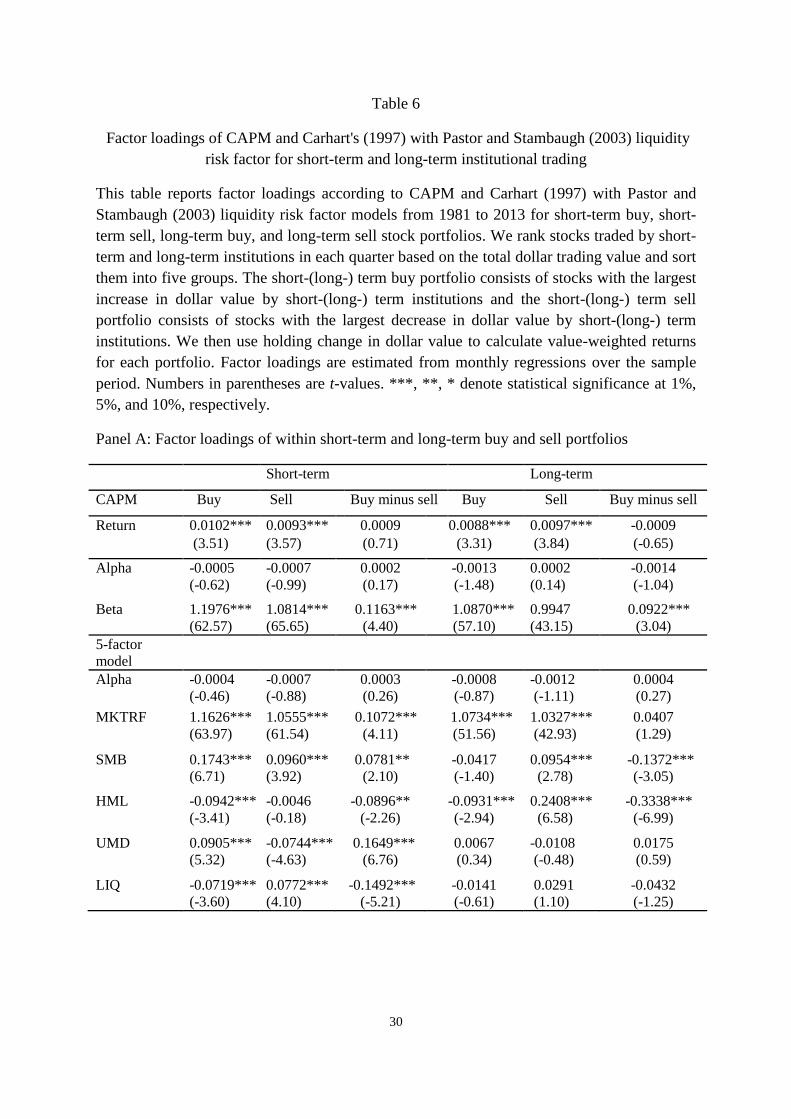
Panel A of Table 6 shows stocks increased (buy) by short-term institutions tend to
exhibit higher factor loadings on market, SMB, and UMD than stocks decreased (sell). It
18
suggests that short-term institutions prefer to trade stocks that smaller with higher beta and
momentum. Meanwhile, the negative differences on HML and LIQ factor loadings
between buy and sell portfolios indicate that short-term institutions prefer growth and
liquid stocks. Our results on trading performance are consistent with earlier findings on
holding returns where short-term institutions tend to prefer stocks with higher systematic
risk. By contrast, stocks increased (buy) by long-term institutions tend to show lower
factor loadings on SMB and HML than stocks decreased (sell). Furthermore, factor
loadings on market, UMD, and LIQ do not vary significantly between buy and sell
portfolios. Overall, long-term institutions experience lower systematic risk related to firm
size and value in their trading.
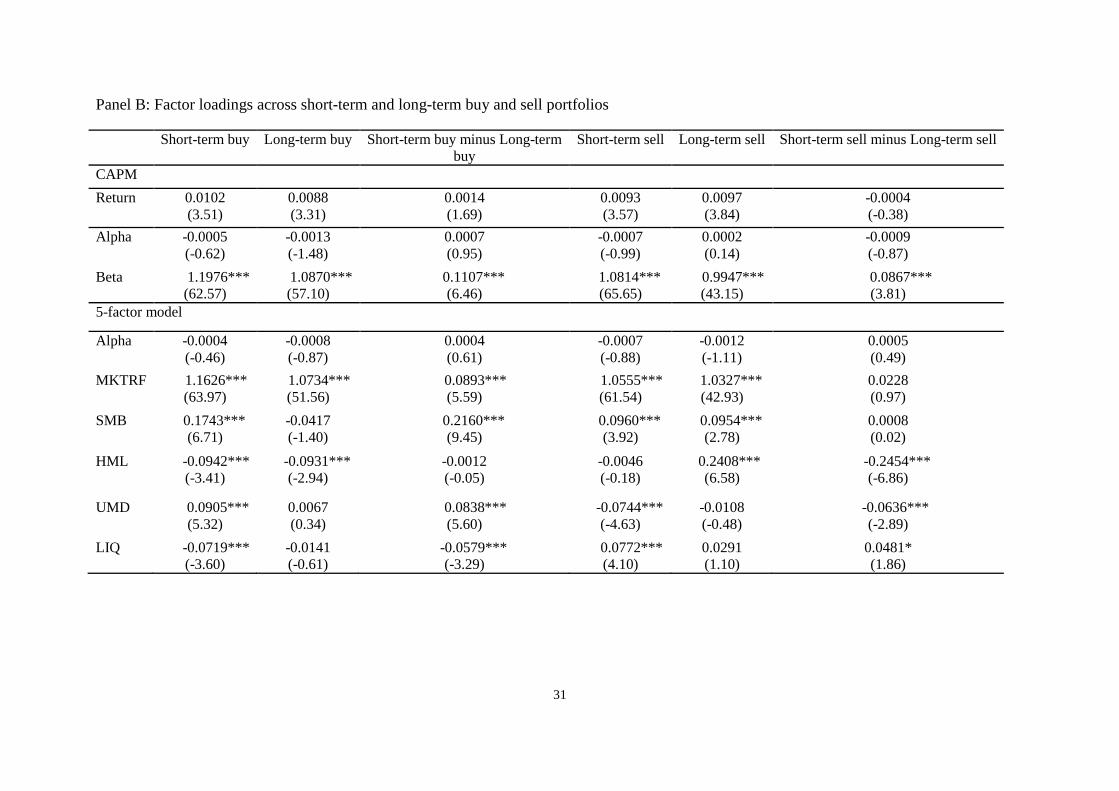
Finally, we cross compare trading returns and factor loadings between short-term and
long-term institutions. Panel B of Table 6 shows that stocks increased by short-term
institutions outperform those by long-term institutions by 0.14% per month.
Correspondingly, the former have higher factor loadings on market, SMB, and UMD but
lower factor loading on LIQ. Therefore, similar to the results reported earlier, short-term
institutions tend to experience higher systematic risk related to market, firm size and
momentum but lower liquidity risk when they trade. Since the alpha in the five-factor
model is not significant, the average higher returns of stocks increased by short-term
institutions are likely to be driven by their systematic risks.
Comparing stocks decreased by both groups of institutions, short-term institutions tend
to sell stocks with a negative UMD factor loading. It implies that their trading strategy is
to reduce past losers in their portfolios. Short-term institutions are also more likely to sell
stocks with higher factor loading on LIQ or reducing stocks with higher liquidity risk. This
does not come as a surprise since short-term institutions have higher turnovers and may
experience higher liquidity risk. On the contrary, their long-term counterparts tend to
19
unload stocks with a positive HML factor loading or reduce value stocks in their portfolios.
In sum, these contrasts in trading behaviors suggest that short-term institutions have
preferences for riskier stocks.
4. Conclusion
In light of the negative relationship between investment horizons and performance of
institutional investors documented in the extant literature, this study sets out to explore an
alternative hypothesis on the source of such relationship from the neoclassical risk-return
perspective. We find that portfolios of short-term institutions when compared to those of
long-term institutions exhibit higher risks related to market and firm size. Consistent with
the difference in portfolio risk, short-term institutions tend to increase stocks with higher
risks related to market, firm size, and momentum. As expected, short-term institutions
with higher turnovers prefer more liquid stocks or stocks with lower liquidity risk.
Nevertheless, short-term institutions appear to bear higher overall systematic risk than
long-term institutions. This difference in risk behavior may partly explain why short-term
institutions outperform long-term institutions.
It is important to point out that our findings are not necessarily inconsistent with the
hypothesis that short-term institutions possess superior information and trading skills.
Short-term institutions may enjoy higher returns because they have private information
and higher portfolio risks. For example, they may exploit their information advantage on
smaller firms which are more opaque and difficult to value. However, these smaller firms
also exhibit higher systematic risk as indicated by higher factor loading on firm size.
Similarly, short-term institutions may choose firms with higher market beta for higher
returns to take advantage of their private information.

20
In sum, our paper adds to another angle on the relationships among investment
horizons, information role, and portfolio risk of institutional investors. Although short-
term institutions such as hedge funds or investment companies may have private
information which tend to facilitate price discovery process and improve capital market
efficiency, their trading behaviors and thereby portfolios are also inherently riskier. Long-
term institutions such as insurance companies and pension funds with different objectives
are more likely to play an important role in monitoring firms that in turn lower information
asymmetry and the cost of capital. Therefore, short-term and long-term institutions with
different informational roles and thus trading behaviors may differ in portfolio risks.
21
References
Amihud, Y., 2002. Illiquidity and stock returns: Cross-section and time-series effects.
Journal of Financial Markets 5(1), 31-56.
Attig, N., S. Cleary, S. Ghoul and O. Guedhami, 2013. Institutional investment horizons
and the cost of equity capital. Financial Management 42(2), 441-477.
Basak, S. and A. Pavlova, 2013. Asset prices and institutional investors. American
Economic Review 103(5), 1728-1758.
Brockman, P., B. Nikolic, and X. Yan, forthcoming. Anticipating the 2007-2008 financial
crisis: Who knew what and when did they know it? Journal of Financial and
Quantitative Analysis.
Bushee, B., 2001. Do institutional investors prefer near-term earnings over long-run value?
Contemporary Accounting Research 18 (2), 207–246.
Cao, C. and L. Petrasek, 2014. Liquidity risk and institutional ownership. Journal of
Financial Markets 21, 76-97.
Carhart, M., 1997. On persistence in mutual fund performance. Journal of Finance 52(1),
57-82.
Cella, C., A. Ellul and M. Giannetti, 2013. Investors’ horizons and the amplification of
market shocks. Review of Financial Studies 26(7), 1607-1648.
Chauvet, M. and J. Piger, 2008, A comparison of the real-time performance of business
cycle dating methods. Journal of Business and Economic Statistics 26 (1), 42–49.
Chen, X., J. Harford and K. Li, 2007. Monitoring: Which institutions matter? Journal of
Financial Economics 86(2), 279-305.
Dasgupta, A., A Prat and M Verardo, 2011a. The price impact of institutional herding.
Review of Financial Studies 24(3), 892-925.
Dasgupta, A., A. Prat and M. Verardo, 2011b, Institutional trade persistence and long-term
equity returns, Journal of Finance 66(2), 635-653.
Falkenstein, E., 1996. Preferences for stock characteristics as revealed by mutual fund
portfolio holdings. Journal of Finance 51(1), 111-135.
Fama, E. and J. Macbeth, 1973. Risk, return, and equilibrium: empirical tests. Journal of
Political Economy 81(3), 607-636.
Fang, L. and J. Peress, 2009. Media coverage and the cross-section of stock returns.
Journal of Finance 64(5), 2023-2052.
22
Gabaix, X., P. Gopikrishnan, V. Plerou, and H.E. Stanley, 2006. Institutional investors and
stock market volatility. Quarterly Journal of Economics 121(2), 461-504.
Gaspar, J., M. Massa and P. Matos, 2005. Shareholder investment horizons and the market
for corporate control. Journal of Financial Economics 76(1), 135-165.
Gompers, P. and A. Metrick, 2001. Institutional investors and equity prices. Quarterly
Journal of Economics 116(1), 229-259.
Greenwood, R. and D. Thesmar, 2011. Stock price fragility. Journal of Financial
Economics 102(3), 471–90.
Hotchkiss, E. and D. Strickland, 2003. Does shareholder composition matter? Evidence
from the market reaction to corporate earnings announcements. Journal of Finance
58(4), 1469-1498.
Hou, K. and T. Moskowitz, 2005. Market frictions, price delay, and the cross-section of
expected returns, Review of Financial Studies 18(3), 981-1020.
Huang, J., C. Sialm and H.J. Zhang, 2011, Risk shifting and mutual fund performance.
Review of Financial Studies 24(8), 2575-2616.
Kacperczyk, M., S. Van Nieuwerburgh and L. Veldkamp, 2014. Time-varying fund
manager skill. Journal of Finance 69(4), 1455-1484.
Lewellen, J., 2011. Institutional investors and the limits of arbitrage. Journal of Financial
Economics 102(1), 62-80.
Newey, W. and K. West, 1987. A simple, positive semi-definite, heteroskedasticity and
autocorrelation consistent covariance matrix. Econometrica 55(3), 703-708.
Nofsinger, J. and R. Sias, 1999. Herding and feedback trading by institutional and
individual investors, Journal of Finance 54(6), 2263-2295.
Novy-Marx, R., 2013. The other side of value: The gross profitability premium. Journal of
Financial Economics 108(1), 1-28.
Palazzo, B., 2012. Cash holdings, risk, and expected returns. Journal of Financial
Economics 104(1), 162-185.
Pastor, L. and R. Stambaugh, 2003. Liquidity risk and expected stock returns. Journal of
Political Economy 111(3), 642-685.
Puckett, A. and X. Yan (2013). The interim trading skills of institutional investors.
Journal of Finance, 66(2), 601-633.
Sias, R., 1996. Volatility and the institutional investor. Financial Analysts Journal 52(2),
13-20.

23
Sias, R., 2004. Institutional herding, Review of Financial Studies 17(1), 165-206.
Wermers, R., 1999. Mutual fund herding and the impact on stock prices, Journal of
Finance 54(2), 581-622.
Wermers, R., 2000. Mutual fund performance: An empirical decomposition into stock-
picking talent, style, transaction costs, and expenses. Journal of Finance 55(4),
1655-1695.
Yan, X. and Z. Zhang, 2009. Institutional investors and equity returns: Are short-term
institutions better informed? Review of Financial Studies 22(2), 893-924.
24
Table 1
Summary statistics of institutional portfolios
This table reports the summary statistics of portfolios held by institutional investors from
1981 to 2012. Panel A reports time-series average of quarterly portfolio characteristics of all
institutions, short-term and long-term institutions. CR is the average churn rate over the past
four quarters. THV is the total holding value of institutional portfolios. HP is the average
percentage holding of individual stocks by an institution. NS is the average number of stocks
held by an institution. HHI is the Herfindahl index measured as the sum of square of each
stock holding percentage of an institution. Panel B reports firm characteristics in institutional
portfolios. MKTCAP is the average quarterly market capitalization (number of outstanding
shares times share price). DP is the average quarterly cash dividend divided by share price.
AGE is the average firm age in number of months since first return appears in CRSP. VOL is
the average standard deviation of monthly returns over the previous 24 months. TURN is
natural logarithm of monthly average trading volume divided by outstanding shares in the
most recent quarter. ILR is the daily average of absolute return divided by dollar trading
volume in millions of the most recent quarter. CAR is the average quarterly cash plus short-
term investments divided by total asset. PTA is the average quarterly gross profitability (total
revenue minus total cost) divided by total asset. ROA is the average quarterly net income
divided by total asset in the previous quarter. Ln (BM) is the natural log of the average
quarterly book-to-market ratio.
All institutions Short-term institutions Long-term institutions
Panel A: Institutional portfolio characteristics
CR 5.95% 11.42% 1.71%
THV $2.81 billion $3.64 billion $2.19billion
HP 0.79% 0.63% 1.15%
NS 226 287 167
HHI 0.07 0.03 0.13
Panel B: Firm characteristics in institutional portfolio
MKTCAP $33.36 billion $25.94 billion $39.75 billion
DP 0.64% 0.60% 0.67%
AGE 383 347 413
VOL 0.0878 0.0939 0.0830
TURN 12.01% 14.35% 10.19%
ILR 0.0965 0.0589 0.1513
CAR 12.29% 13.59% 11.39%
PTA 9.04% 9.09% 8.95%
ROA 1.32% 1.25% 1.32%
Ln (BM) 0.60 0.60 0.60
N 1,432 477 477
25
Table 2
Factor loadings of institutional portfolios and manager skills
This table reports the average factor loadings of asset pricing models and manager skills for
institutional investors. Panel A reports the average factor loadings of CAPM, Carhart four-
factor (1997) including liquidity risk factor of Pastor and Stambaugh (2003) from previous
60-month (a minimum of 36 monthly observations is required). CAPM is the factor loading
on market excess return from Sharpe’s CAPM. MKTRF, SMB, HML, UMD, and PS_LIQ are
the factor loadings on market excess return, small minus big size, high minus low book-to-
market ratio, winner minus loser from Carhart (1997), and high liquidity minus low liquidity
risk from Pastor and Stambaugh (2003). Panel B reports the average manager skills. MT and
SP are measures of manager abilities in market timing and stock picking respectively
according to Kacperczyk et al. (2014). SL is a composite measure of manager skill estimated
from MT and SP.
Beta All institutions Short-term institutions Long-term institutions
Panel A: Average factor loadings
CAPM 0.9623 1.0138 0.9181
MKTRF 0.9560 0.9843 0.9299
SMB 0.0904 0.1731 0.0151
HML 0.0340 0.0242 0.0436
UMD -0.0526 -0.0637 -0.0437
LIQ -0.0061 -0.0086 -0.0056
Panel B: Manager skills
MT 0.0224 0.0230 0.0224
SP 0.0005 0.0002 0.0012
SL 0.0039 0.0034 0.0049
26
Table 3
Regression results of institutional ownership and its determinants
This table reports the results of cross-sectional regressions of institutional ownership on stock
characteristics. The sample period is from 1981 to 2012. Beta is the factor loading of the past
60-month (minimum 36 months) monthly return regressions on market excess return. CAR is
quarterly cash plus short-term investments divided by total asset. PTA is quarterly gross
profitability (total revenue minus total cost) divided by total asset. ROA is quarterly net
income divided by total asset in the previous quarter. Ln(MKTCAP) is natural log of
quarterly outstanding shares times share price. Ln(AGE) is natural log of the measure of firm
age as the number of months since its first return observation appearing in CRSP. Ln(1+DP)
is natural log of one plus quarterly cash dividend divided by share price. Ln(BM) is natural
log of quarterly most recent book equity divided by market equity. Ln(PRC) is natural
logarithm of share price. Ln(TURN) is natural log of monthly average trading volume
divided by outstanding shares in the most recent quarter. Ln(VOL) is natural log of standard
deviation over previous 24 months of stock returns. S&P500 is a dummy variable for
S&P500 stocks. RET(t-3, t) is the accumulated return in the most recent quarter. RET(t-12, t-
3) is the accumulated return over three previous quarters preceding the most recent quarter.
We report time-series average cross-section regression coefficients based on Fama and
MacBeth (1973) method. Numbers in parentheses are t-values corrected for
heteroskedasticity and autocorrelation by Newey and West (1987) approach. ***, **, *
denote statistical significance at the 1%, 5%, and 10% level respectively.
Total institutional
ownership
Short-term institutional
ownership
Long-term institutional
ownership
Intercept 0.0946***
(3.41)
0.1561***
(9.03)
-0.0542***
(-12.84)
Beta 0.0190***
(5.26)
0.0117***
(6.05)
0.0027***
(4.16)
CAR -0.0056
(-0.91)
0.0018
(0.46)
0.0020
(0.92)
PTA 0.1699***
(10.82)
0.0850***
(8.14)
0.0133***
(4.52)
ROA -0.0189
(-1.41)
0.0342***
(3.65)
-0.0284***
(-7.61)
ln(MKTCAP) 0.0484***
(31.11)
0.0253***
(26.79)
0.0111***
(16.04)
ln(AGE) -0.0053**
(-2.17)
-0.0153***
(-9.98)
0.0070***
(9.46)
ln(1+DP) -0.5510***
(-5.26)
-0.3770***
(-5.33)
-0.0658***
(-3.36)
ln(BM) 0.0322***
(14.29)
0.0114***
(9.14)
0.0070***
(14.54)
ln(PRC) 0.0548***
(21.57)
0.0251***
(13.86)
0.0113***
(20.54)
ln(TURN) 0.0601***
(11.07)
0.0447***
(15.08)
0.0020*
(1.73)
ln(VOL) -0.0344*** -0.0044* -0.0087***

27
(-6.24) (-1.67) (-6.34)
S&P500 -0.0397***
(-2.95)
-0.0365***
(-5.45)
0.0120***
(4.50)
RET(t-3, t) -0.0664***
(-13.39)
-0.0308***
(-12.04)
-0.0137***
(-10.44)
RET(t-12, t-
3)
-0.0348***
(-9.47)
-0.0052***
(-3.31)
-0.0112***
(-11.61)
N 296,984 296,984 296,984
Adjusted R-
Squared 0.58 0.48 0.30
28
Table 4
Past and future portfolio returns of institutional investors
This table reports short-term and long-term institutions’ portfolio returns from t-3 to t+12
from 1980 to 2012. RET (t-3, t) is the accumulated return over the previous quarter. RET (t-
12, t-3) is the accumulated return over the previous 3 quarters preceding the most recent
quarter. RET (t, t+3) is the accumulated return over the next quarter. RET (t, t+12) is the
accumulated return over the next 4 quarters. *** denotes statistical significance at the 1%
level.
Short-term institution
portfolio return
Long-term institution
portfolio return
Short-term minus Long-
term portfolio return
RET(t-3, t)
Mean 0.0582*** 0.0472*** 0.0110***
Median 0.0601 0.0508 0.0090
Maximum 0.3677 0.2480 0.1414
Minimum -0.2255 -0.2098 -0.0419
RET(t-12, t-3)
Mean 0.1984*** 0.1509*** 0.0476***
Median 0.1747 0.1411 0.0323
Maximum 0.7674 0.5901 0.4308
Minimum -0.3030 -0.2974 -0.0413
RET(t, t+3)
Mean 0.0303*** 0.0301*** 0.0002
Median 0.0380 0.0331 0.0017
Maximum 0.2279 0.2089 0.0493
Minimum -0.2382 -0.2207 -0.0582
RET(t, t+12)
Mean 0.1245*** 0.1262*** -0.0017
Median 0.1424 0.1419 -0.0030
Maximum 0.6614 0.5763 0.0946
Minimum -0.3729 -0.3566 -0.1031
29
Table 5
Future quarterly and annual returns of short-term and long-term institutions’ trading portfolios
This table reports short-term and long-term institutions buy/sell portfolios’ returns from 1981 to 2012. We rank stocks traded by short-term and
long-term institutions in each quarter based on the total dollar trading value and sort them into five groups. The short-(long-) term buy portfolio
consists of stocks with the largest increase in dollar value by short-(long-) term institutions and the short-(long-) term sell portfolio consists of
stocks with the largest decrease in dollar value by short-(long-) term institutions. We then use change in dollar value of institutional holdings to
calculate value-weighted returns for each portfolio. RET (t, t+3) is the accumulated return over the next quarter. RET (t, t+12) is the accumulated
return over the next 4 quarters. ***, **, and * denote statistical significance at the 1%, 5%, and 10% level respectively.
Short-term
buy
Short-term
sell
Long-term
buy
Long-term
sell
Short-term
buy minus sell
Long-term
buy minus sell
Short-term buy minus
Long-term buy
Short-term sell minus
Long-term sell
RET(t, t+3)
Mean 0.0324*** 0.0284*** 0.0278*** 0.0303*** 0.0040 -0.0026 0.0047* -0.0019
Median 0.0381 0.0343 0.0319 0.0345 0.0050 -0.0013 0.0059 0.0011
Maximum 0.3102 0.2260 0.3263 0.4108 0.1898 0.1939 0.1415 0.1372
Minimum -0.2891 -0.3192 -0.2984 -0.3209 -0.1501 -0.1815 -0.1023 -0.1849
RET(t, t+12)
Mean 0.1274*** 0.1170*** 0.1181*** 0.1253*** 0.0104 -0.0073 0.0094** -0.0083
Median 0.1501 0.1229 0.1444 0.1310 0.0051 0.0003 0.0100 -0.0113
Maximum 0.6921 0.6632 0.7653 0.5998 0.3321 0.3614 0.1441 0.2506
Minimum -0.5836 -0.4133 -0.4850 -0.3564 -0.5233 -0.5843 -0.1266 -0.3287
30
Table 6
Factor loadings of CAPM and Carhart's (1997) with Pastor and Stambaugh (2003) liquidity
risk factor for short-term and long-term institutional trading
This table reports factor loadings according to CAPM and Carhart (1997) with Pastor and
Stambaugh (2003) liquidity risk factor models from 1981 to 2013 for short-term buy, short-
term sell, long-term buy, and long-term sell stock portfolios. We rank stocks traded by short-
term and long-term institutions in each quarter based on the total dollar trading value and sort
them into five groups. The short-(long-) term buy portfolio consists of stocks with the largest
increase in dollar value by short-(long-) term institutions and the short-(long-) term sell
portfolio consists of stocks with the largest decrease in dollar value by short-(long-) term
institutions. We then use holding change in dollar value to calculate value-weighted returns
for each portfolio. Factor loadings are estimated from monthly regressions over the sample
period. Numbers in parentheses are t-values. ***, **, * denote statistical significance at 1%,
5%, and 10%, respectively.
Panel A: Factor loadings of within short-term and long-term buy and sell portfolios
Short-term Long-term
CAPM Buy Sell Buy minus sell Buy Sell Buy minus sell
Return 0.0102*** 0.0093*** 0.0009 0.0088*** 0.0097*** -0.0009
(3.51) (3.57) (0.71) (3.31) (3.84) (-0.65)
Alpha -0.0005 -0.0007 0.0002 -0.0013 0.0002 -0.0014
(-0.62) (-0.99) (0.17) (-1.48) (0.14) (-1.04)
Beta 1.1976*** 1.0814*** 0.1163*** 1.0870*** 0.9947 0.0922***
(62.57) (65.65) (4.40) (57.10) (43.15) (3.04)
5-factor
model
Alpha -0.0004 -0.0007 0.0003 -0.0008 -0.0012 0.0004
(-0.46) (-0.88) (0.26) (-0.87) (-1.11) (0.27)
MKTRF 1.1626*** 1.0555*** 0.1072*** 1.0734*** 1.0327*** 0.0407
(63.97) (61.54) (4.11) (51.56) (42.93) (1.29)
SMB 0.1743*** 0.0960*** 0.0781** -0.0417 0.0954*** -0.1372***
(6.71) (3.92) (2.10) (-1.40) (2.78) (-3.05)
HML -0.0942*** -0.0046 -0.0896** -0.0931*** 0.2408*** -0.3338***
(-3.41) (-0.18) (-2.26) (-2.94) (6.58) (-6.99)
UMD 0.0905*** -0.0744*** 0.1649*** 0.0067 -0.0108 0.0175
(5.32) (-4.63) (6.76) (0.34) (-0.48) (0.59)
LIQ -0.0719*** 0.0772*** -0.1492*** -0.0141 0.0291 -0.0432
(-3.60) (4.10) (-5.21) (-0.61) (1.10) (-1.25)
31
Panel B: Factor loadings across short-term and long-term buy and sell portfolios
Short-term buy Long-term buy Short-term buy minus Long-term
buy
Short-term sell Long-term sell Short-term sell minus Long-term sell
CAPM
Return 0.0102 0.0088 0.0014 0.0093 0.0097 -0.0004
(3.51) (3.31) (1.69) (3.57) (3.84) (-0.38)
Alpha -0.0005 -0.0013 0.0007 -0.0007 0.0002 -0.0009
(-0.62) (-1.48) (0.95) (-0.99) (0.14) (-0.87)
Beta 1.1976*** 1.0870*** 0.1107*** 1.0814*** 0.9947*** 0.0867***
(62.57) (57.10) (6.46) (65.65) (43.15) (3.81)
5-factor model
Alpha -0.0004 -0.0008 0.0004 -0.0007 -0.0012 0.0005
(-0.46) (-0.87) (0.61) (-0.88) (-1.11) (0.49)
MKTRF 1.1626*** 1.0734*** 0.0893*** 1.0555*** 1.0327*** 0.0228
(63.97) (51.56) (5.59) (61.54) (42.93) (0.97)
SMB 0.1743*** -0.0417 0.2160*** 0.0960*** 0.0954*** 0.0008
(6.71) (-1.40) (9.45) (3.92) (2.78) (0.02)
HML -0.0942*** -0.0931*** -0.0012 -0.0046 0.2408*** -0.2454***
(-3.41) (-2.94) (-0.05) (-0.18) (6.58) (-6.86)
UMD 0.0905*** 0.0067 0.0838*** -0.0744*** -0.0108 -0.0636***
(5.32) (0.34) (5.60) (-4.63) (-0.48) (-2.89)
LIQ -0.0719*** -0.0141 -0.0579*** 0.0772*** 0.0291 0.0481*
(-3.60) (-0.61) (-3.29) (4.10) (1.10) (1.86)