Embed Size (px)
Citation preview

! !
Portfolio Diversification: Dairy Farm Real Estate in a Globally
Diversified Asset Portfolio
A Dissertation submitted in partial fulfillment of the requirements for the degree of
Bachelor of Commerce with Honours
at
Lincoln University
by
Charles Pearce
Lincoln University
2013

! !
Dedication
For my wonderful family who without their
support, this journey would not have been possible.
Thank you for your assistance during my studies.

! i!!!!
Acknowledgement I extend my appreciation to Dr. Gilbert Nartea for his supervision, guidance and
support. Your encouragement throughout my university career has brought me to this
point and I am very grateful for the assistance along the way. Special mention must be
given to Jack Radford, who kindly offered to assist me with my dissertation, both with
data collection and drafting. Thanks also to Muhammad Ahmad Cheema for providing
me with financial data from datastream. Overall, your assistance made my honours
experience a memorable one.

! ii!!!
Abstract
This dissertation examines the benefits of further diversifying a global portfolio of
financial assets with Australasian dairy farm real estate. The basis of my methodology
is by comparing generated efficient sets with and without dairy farm real estate, to
determine the incremental benefits of diversification. My findings suggest that dairy
farm real estate in Australia and New Zealand can be used to reduce portfolio risk.
This is evident due to dairy farm real estates predominantly negative correlation with
financial assets. The benefits of diversification into dairy farm real estate were also
examined by comparing portfolios with equal rates of return, with and without dairy
farm real estate. We found that portfolios with dairy farm real estate had lower
standard deviations than portfolios without dairy farm real estate. Risk reduction
benefits were most significant for portfolio returns ranging from 11 to 13 per cent.
Testing the portfolios with and without dairy farm real estate using the Sharpe ratio
confirms the premise that diversification into dairy farm real estate is most effective at
portfolio returns of 11 to 13 per cent. My results suggest that Australasian dairy farm
real estate is an effective risk reducer in a globally diversified asset portfolio. Dairy
farm real estate in New Zealand and Australia should be given greater consideration
by investment managers than it may have previously been given.
Keywords- Diversification, Dairy Farm Real Estate, New Zealand, Australia, Portfolio Theory
Paper Type- Honours Dissertation

! iii!!
Table of Contents
Acknowledgement i
Abstract ii
Table of Contents iii
List of Figures and Tables iv
1. Introduction 1
2. Research Design and Data 5
2.1 The Model 4
2.2 Ordinary Shares, 90 Day Bank Bills and 10 Year T-bills 6
2.3 Australasian Dairy Farm Real Estate 6
3.0 Empirical Results 7
3.1 Comparative Risk and Return Measures 7
3.2 Correlation Matrix 10
3.3 Benefits of Diversification 9
3.4 Risk Reduction 12
3.5 The Role of Dairy Farm Real Estate in Mixed Asset Portfolios 16
3.6 Increase in the Sharpe Ratio 17
3.7 Breakdown of Dairy Farm Real Estate Returns 21
4. Limitations 27
5. Conclusion 27
6. References 30

! iv!!!
List of Figures and Tables
Figure 1: Annual returns for national dairy farm real estate and Australian financial assets 11
Figure 2: Annual returns for Australasian dairy farm real estate, 1979-2012 11
Figure 3: Efficient sets, Australian financial portfolio and the global financial portfolio, 1979-2012 13
Figure 4: Efficient sets, with and without dairy farm real estate, 1979-2012 13
Figure 5: Breakdown of Tasmanian dairy farm real estate returns, 1979-2012 22
Figure 6: Breakdown of Western Australian dairy farm real estate returns, 1979-2012 23
Figure 7: Breakdown of New Zealand dairy farm real estate returns, 1979-2012 23
Figure 8: Breakdown of Australian dairy farm real estate returns, 1979-2012 24
Table I: Risk and return measures for dairy farm real estate and financial assets 8
Table II: Correlation of dairy and financial asset returns 10
Table III: Risk efficient portfolios 15
Table IV: Sharpe ratios for efficient sets with and without dairy farm real estate. 17
Table V: Composition of risk efficient portfolios 20
Table VI: Composition of dairy farm real estate returns 24
Table VII: Correlation of dairy farm capital gains and global financial returns 26
Table VIII: Correlation of dairy farm production returns and global financial returns 27

! 1!!
1. Introduction
!
Investors have always been interested in securities that reduce their exposure to risk
and improve their rate of return on investment. Contemporary understanding has
focused on modern portfolio theory, which involves identifying the relationship
between market performance of a portfolio and the number of stock held (Markowitz,
1952). The efficient frontier is defined as the set of portfolios that achieve the greatest
level of return for a given level of risk, known as the efficient set. Studies found that
adding different stocks can greatly improve the diversification benefits to a portfolio,
reducing risk and enhancing return (Fisher and Lorie 1970).
International equity diversification was an obvious avenue for investors to reduce
diversifiable risk and expand the efficient frontier of their portfolio. Studies have
found that international equity diversification can offer significant risk reduction
benefits and enhance portfolio return in the long run (Santis and Gerard, 1997). This is
possible when international equity markets have low correlation between each other
and low covariance with the global market portfolio (Harvey, 1991). Indeed, during
the 20th century when international equity markets where less integrated, benefits from
international equity diversification were significant (Levy and Sarnat 1970).
With increased globalization in the 21st century, international equity markets have
become more integrated. This has lead to increased positive correlations among
international equity markets, resulting in the consequent decline of the benefits from
international equity diversification. The Global Financial Crisis of 2008 caused
widespread panic across the financial system. In response, European and American
governments choose to borrow and spend with aggressive expansionary policy to try
and revive the economy. By 2012 debt levels in many industrialized countries had
reached unsustainable levels and many EU countries such as Greece, Spain, Portugal
and Ireland were at risk of defaulting on their debt. The United States had similarly

! 2!!
spent far more than its annual revenues, running budget deficits for decades. In the
summer of 2011 US debt levels reached critical levels and Standard and Poor’s, a
globally respected bond rating agency, downgraded the US debt rating from AAA, the
top rating, which the US held for over 100 years, to AA+ (Painter, 2013).
Subsequently, global panic spread throughout the financial system and global stock
markets lost 10 per cent of their value within one week. Debt levels in industrialized
countries remain perilously high and with tough austerity measures implemented in
Europe to reduce deficits, growth forecasts for industrialized countries remain weak.
With the Federal Reserve indicating that it intends to wind down its bond-buying
program in early 2014 and as governments move towards balanced budgets, poor
growth prospects have led investors to seek alternative investments to stocks and
bonds that have been the traditional investment choice for so many years. (Lee and
Stevenson, 2006). While alternative investments have attracted criticism for their poor
liquidity or significant exit costs, superior returns and reduced correlation with global
markets have seen them become popular investment strategies in recent years
(McCormick, 2013). With increased globalization in the 21st century, international
equity markets have become more integrated. This has lead to increased positive
correlations among international equity markets, resulting in the consequent decline of
the benefits from international equity diversification. The global financial crisis which
began in 2008 has demonstrated how interconnected and integrated many international
equity markets are.
The increased correlation among international equity markets has resulted in the
reduced effectiveness of international equity diversification (Kearney and Lucey,
2004). Indeed, the effectiveness of international equity diversification has become a
contentious issue in recent times. Studies suggest the benefits are over exaggerated in
academia and in practice, especially once proper consideration is given to transaction
costs and taxes (Kalra, Miroslav and Sundaram, 2004).

! 3!!
While international equity diversification remains an effective channel of risk
reduction, its exposure to global contagion has lead many investors to think twice
about the safety of international equity diversification. Due to the effect the U.S
market can have on the global economy, a severe U.S market decline would be
contagious at the international level, resulting in a significant reduction in the expected
gains from international diversification (Santis and Gerard, 1997).
Focus has since been on identifying assets that have a low correlation with financial
assets, since this will maximize the potential diversification benefit to the portfolio.
Real estate has been identified as a potentially worthwhile investment vehicle due to
its low correlation with financial assets and relatively predictable returns. Several
studies have found that farm real estate in particular has been identified to have
consistently low correlation with returns from financial assets. By applying the CAPM
model to farmland in eleven different states in the US, Barry (1980) found that
farmland added vey little risk to a diversified portfolio of stocks and bonds because
most risk associated with farmland is diversifiable, unsystematic risk. Kaplan (1985)
found that farm real estate had two favorable attributes: high total return and low
correlation with other assets, which meant that including farmland in a portfolio added
a high return asset with less exposure to risk. Newell and Eves (2007) found that
farmland in Australia and the United States provided significant portfolio
diversification benefits. In a study where it was tested whether Canadian farmland
could improve a portfolios performance that contained financial assets, made up of
equity indices from G7 countries, Canadian bonds and Treasury bills, Painter (2000)
found that farmland improved overall portfolio performance, particularly at medium
levels of risk. Using EV analysis Painter (2008), showed that including farmland in a
portfolio significantly improved portfolio performance, especially the inclusion of
Australian and New Zealand farmland. Painter (2008), also found that Australian and
New Zealand farmland dominates the efficient portfolios. The paper found that to

! 4!!
achieve a 15 per cent return, if farmland is included, the risk is 13.2 per cent, if
farmland is excluded; the risk is substantially greater at 34.3 per cent.
Studies have also found that NZ dairy farm returns are negatively correlated with NZ
bond yields and weakly positively correlated with NZ share returns, indicating that
dairy farm assets in New Zealand could be excellent vehicles for diversification.
Nartea and Webster (2008) found that adding farm real estate to a portfolio of NZ
financial assets provided significant return enhancement and risk reduction benefits
that are consistent even when the real estate return variance is increased six-fold or
when the return is reduced by 20 per cent, indicating that real estate should be a
consistent part of a risk efficient portfolios.
This dissertation aims to expand on existing literature by quantifying the benefits of
diversifying an international financial portfolio with Australasian Dairy farms, using
portfolio theory. Historical data on the returns for different asset classes is used to
generate risk efficient sets. These risk efficient sets are then compared with and
without the inclusion of Australasian Dairy assets to determine the incremental
changes of risk reduction. The Sharpe ratio generated on the portfolios to determine
the excess return per unit of risk, Sharpe (1966) for the efficient sets will also be
compared with and without dairy farm real estate.
!
2. Research Design and Data
2.1 The Model
Developing from the model used in Nartea and Eves (2010) we start with a portfolio
of Australian T-bills, 90-day bank bills and shares and we demonstrate the benefit of
diversifying internationally with eight international equity markets. Australasian dairy
assets are then added to the portfolio to investigate the benefits of risk reduction and
return enhancement. The addition of Australasian dairy assets to the mix is expected to

! 5!!
expand the risk efficient frontier by shifting it northwest. The intention is to measure
the incremental effects from adding Australasian dairy assets by examining the
magnitude to which portfolio risk is reduced without diminishing returns and return is
enhanced while keeping risk constant. The excess return per unit of risk ratio, as
developed by Sharpe (1966) will also be examined to compare the performance of
various asset classes.
An Expected Value-Variance (EV) is used to assess whether Australasian dairy farm
assets would enhance the performance of an international portfolio of financial assets.
EV analysis was developed from the capital asset pricing model in Sharpe (1966) and
provides the method for deriving the efficient set of portfolio investments. A risk
efficient portfolio is defined as a combination of assets that maximizes the expected
returns for a given level of risk, or alternatively, that reduces the level of risk for a
desired rate of return (Nartea and Eves, 2010). Risk-efficient portfolios can be
generated, by solving the following quadratic formulation:
Min !!!= (ΣΣ!!!!"!!)!.! (1)
Subject to:
Σ!!!(!!) ≥ ! (2)
Σ!! = 1 (3)
!! ≥ 0 (4)

! 6!!
Where !! is the portfolio standard deviation, !! is the proportion of asset ! in the
portfolio, !(!!) is the expected return of asset !, !!" is the covariance between assets !
and ! and ! is the expected return of the portfolio, which is varied numerically to
obtain the risk-efficient set (Nartea and Eves, 2010). The efficient frontier is made up
of risk efficient sets and represents all those investments that dominate on a risk return
basis (Painter, 2008).
2.2 Ordinary Shares, 90-Day Bank Bills and 10 year T-bills
Ordinary shares are represented by national indices as reported in Datastream and by
the trading exchanges. This study has considered national indices that represent the
greatest geopolitical importance to the global economy, that being North America
(USA), Europe (France and the United Kingdom) and Austral-Asia (New Zealand,
Australia, Hong Kong, Japan and Singapore). The ASX 10 year T-bill Index and the
ASX 90-Day Bank Bill Index, obtained from the Australian Exchange (ASX),
represent Australian government securities.
2.3 Australasian dairy farm real estate
Dairy farm real estate is represented by dairy operations on grazing farmland. The
total return on dairy farm real estate is the sum of the production rate of return and the
capital gain. The production rate of return is the average return on milk production.
Returns on dairy farm real estate were reported in the Dairy NZ economic survey
(2005-2012), older data was obtained from the Dairy NZ archives. The national return
is weighted, taking regional heard numbers and sizes into consideration. An owner
operator either owns or leases both the herd and the land. The survey involves roughly
250 owner operator farms each year, with farms excluded if herd sizes are less than
100, less than 70 per cent of revenue is derived from dairying or due to extreme outlier
data. Australian dairy returns were obtained from the ministry of agriculture. Surveys

! 7!!
were structured so that generally, larger farms have smaller weights and smaller farms
have larger weights, reflecting both the strategy of sampling a higher fraction of the
large farms than small farms (the former having a wider range of variability of key
characteristics and accounting for a much larger proportion of total output) and the
relatively lower numbers of large farms.
Rates of return are therefore calculated from group averages. Consequently, the results
are likely to underestimate the degree of variability for an individual farm. The
implications of this issue will be examined in greater detail in the robustness tests to
follow.
3. Empirical results
3.1 Comparative risk and return measures
Table I shows the mean, standard deviation and coefficient of variation of the annual
returns of New Zealand farmland, Australian national and state dairy farm returns, T-
bills, Australian 90 day bank bills and eight equity markets from 1979 to 2012. The
data revels that, with the exception of Hong Kong and New Zealand equity markets,
New Zealand dairy farm real estate outperformed all other equity markets considered,
earning a higher mean annual rate of return at a lower standard deviation or risk.
Interestingly however, the Australian average for dairy farm returns outperformed the
New Zealand dairy average on a risk-adjusted basis. While Australian 10 year
Treasury bonds outperformed all other asset classes on a risk-adjusted basis, South
Australian, Tasmanian and New South Wales dairy farm real estate outperformed New
Zealand dairy farm real estate. All dairy assets considered outperformed the equity
markets considered on a risk-adjusted basis. This is clearly illustrated in Table I with
the reward-to-risk ratio, defined as the expected return per unit of risk (Nartea and
Eves, 2010). Using the coefficient of variation as a measure of uncertainty and risk,
Australian 10 year treasury-bills were the least risky among the assets considered. All

! 8!!
classes of dairy farm real estate appeared to have less variability of returns than the
share markets considered in this study. Of the share markets considered in this study,
Japan appeared to have the highest variability, whilst England had the lowest
variability of returns. Figure 1 illustrates the relationship among Australian financial
assets, New Zealand dairy farm real estate and the average for Australian dairy farm
real estate. New Zealand and Australian dairy farm real estate are clearly more volatile
than Australian Treasury-bills but more stable than the Australian 90 day bank bill rate
and the ALL Ords index. Figure 2 compares the returns between dairy farm real estate
in New Zealand, Western Australia and Tasmania. It is evident that New Zealand
dairy farm real estate returns are more volatile than Western Australia and Tasmania.
Table I.
Risk and return measures for dairy farm real estate and financial assets, 1979-2012
Mean Annual rate
of return (%) Rank
Standard Deviation
Coefficient of
Variation
Reward- to-risk ratio Rank
New Zealand Dairy 11.56 3 12.40 1.07 0.93 6 Australia Dairy 6.94 16 6.42 0.93 1.08 4 New South Wales Dairy 7.92 12 7.94 1.00 1.00 5 Victoria Dairy 7.00 15 7.74 1.11 0.90 7 Queensland Dairy 5.10 18 7.00 1.37 0.73 9 South Australia Dairy 7.24 14 6.38 0.88 1.13 2 Western Australia Dairy 7.27 13 9.2 1.27 0.79 8 Tasmania Dairy 7.98 11 7.12 0.89 1.12 3 United States 9.08 8 16.76 1.85 0.54 11 England 8.56 10 15.22 1.78 0.56 10 Australia 9.25 7 18.28 1.98 0.51 13 New Zealand -7.64 2 17.71 10.07 -0.43 17 Japan 3.71 19 21.43 5.78 0.17 19 Hong Kong 15.08 1 29.88 1.98 0.50 14 France 10.88 4 24.2 2.22 0.45 15 Singapore 9.34 5 29.32 3.14 0.32 18 Australian 90 Day Bank Bill % 9.30 6 17.89 1.92 0.52 12 Australian 10 year T-bills % 8.91 9 3.52 0.40 2.53 1

! 9!!
3.2 Correlation matrix
Table II illustrates the pair wise correlation coefficients of the various asset classes and
reveals that dairy farm real estate in Australia and New Zealand was negatively
correlated with most stock markets. Interestingly, state and national averages for dairy
farm real estate in Australia was most correlated with Japan and Singapore. New
Zealand dairy farm real estate was most correlated with Australian dairy farm real
estate, indicating possible economic integration with world dairy commodity prices.
Australian dairy farm real estate was weakly correlated with the 90-day bank bill rate,
while positively correlated with Australian 10 year treasury bills. Western Australian
dairy farm real estate appeared to have the greatest correlation with financial assets of
the dairy assets considered, with positive correlations between financial markets in
England, Australia, Japan, Hong Kong and Singapore.
Of particular note, the correlation between share markets ranged from a high of 0.76
between the US and England to a low of -0.03 between New Zealand and Singapore.
Table II shows that the New Zealand share market is weakly positively correlated with
almost all stock markets except Singapore. Australia was strongly positively correlated
with all stock markets, with the weakest correlation of 0.32 between New Zealand. In
contrast with (Nartea and Eves, 2010) using a 1989-2005 dataset, many international
equity markets appear more correlated. This most likely reflects the trend of greater
economic integration between the periods 2005-2012. The Global Financial Crisis of
2008 and the economic contagion that spread across international boarders, illustrate
the interconnectedness of financial markets.

! 10!!
Table II. Correlation of dairy and financial asset returns, 1979-2012
New Zealand
Dairy Australia
Dairy New South
Wales Dairy Victoria Dairy
Queensland Dairy
South Australia
Dairy
Western Australia
Dairy Tasmania
Dairy United States England Australia New Zealand Japan Hong Kong France Singapore
AUS 90 Day Bank
Bill AUS T-
bills
New Zealand Dairy 1.00 0.39 0.38 0.28 0.48 0.37 0.23 0.26 -0.25 -0.13 -0.22 0.28 -0.16 0.09 -0.25 0.16 -0.20 0.18
Australia Dairy
1.00 0.84 0.93 0.70 0.78 0.62 0.70 -0.10 0.10 0.14 0.05 0.32 0.03 -0.04 0.29 0.16 0.36
New South Wales Dairy
1.00 0.62 0.80 0.73 0.62 0.51 -0.09 0.11 0.19 0.12 0.24 0.18 -0.12 0.33 0.18 0.45
Victoria Dairy
1.00 0.42 0.61 0.45 0.68 0.00 0.10 0.09 0.02 0.34 -0.10 0.00 0.25 0.12 0.30
Queensland Dairy
1.00 0.75 0.59 0.46 -0.23 0.10 0.11 0.02 0.15 0.20 -0.02 0.14 0.11 0.37
South Australia Dairy
1.00 0.43 0.56 -0.21 0.08 0.18 0.05 0.27 0.14 0.09 0.22 0.19 0.41
Western Australia Dairy
1.00 0.23 -0.09 0.13 0.31 -0.01 0.29 0.28 -0.06 0.46 0.35 0.11
Tasmania Dairy
1.00 -0.16 0.06 -0.03 -0.03 0.22 -0.17 -0.01 0.06 0.00 0.23
United States
1.00 0.76 0.63 0.06 0.44 0.27 0.52 0.31 0.61 0.17
England
1.00 0.60 -0.08 0.54 0.40 0.65 0.43 -0.20 0.39
Australia
1.00 0.17 0.61 0.60 0.48 0.51 0.96 0.19
New Zealand
1.00 -0.19 0.08 0.00 -0.01 0.15 0.09
Japan
1.00 0.37 0.48 0.49 0.63 0.38
Hong Kong
1.00 0.16 0.58 0.58 0.25
France
1.00 0.07 0.49 0.34
Singapore
1.00 0.58 0.13
Australian 90 Day Bank Bill %
1.00 0.20
Australian 10 year Treasury Bonds %
1.00

11"
3.3 Benefits of diversification
Risk-efficient investment portfolios were obtained by solving equation (1) subject to
equations (2), (3) and (4) for alternative values of Z. Based on the risk efficient sets,
the benefits of diversification are measured by the magnitude of:
• risk reduction
• return enhancement
• improvement in excess return per unit of risk as measured by the Sharpe ratio.
Figure 1.
Annual returns for national dairy farm real estate averages and Australian financial
assets, 1979-2012
Figure 2.
Annual returns for Australasian dairy farm real estate, 1979-2012
#40.0"#30.0"#20.0"#10.0"0.0"10.0"20.0"30.0"40.0"50.0"60.0"
2012"
2010"
2008"
2006"
2004"
2002"
2000"
1998"
1996"
1994"
1992"
1990"
1988"
1986"
1984"
1982"
1980"
Expected(return((%
)( Australian"Financials"
Australian"10"year"Treasury"Bonds"%"
Australian"farmland"
New"Zealand"farmland"
#20.0"
#10.0"
0.0"
10.0"
20.0"
30.0"
40.0"
50.0"
2012"
2010"
2008"
2006"
2004"
2002"
2000"
1998"
1996"
1994"
1992"
1990"
1988"
1986"
1984"
1982"
1980"
Expected(return((%
)(
Western"Australia"
Tasmanina"
New"Zealand"

" 12""
Figure 3 illustrates the efficient frontier for investments involving:
• Only Australian financial assets
• Australian financial assets and international equities.
The efficient frontier made up of Australian financial assets is clearly outperformed by
the frontier comprised of international equities. Figure 4 shows that further utility can
be achieved with the addition of Australasian dairy farm real estate.
3.4 Risk reduction
Table III illustrates the risk reduction benefits with diversifying an international stock
portfolio with dairy farm real estate. These risk reduction benefits are quantified by
comparing the risk for portfolios with identical return in the efficient sets, with and
without dairy farm real estate. Efficient portfolios without dairy farm real estate are
displayed in panel A, while those with dairy farm real estate are displayed in panel B. It
can be seen in panel B that the risk reduction benefits of adding dairy farm real estate
are significant. The magnitude of risk reduction benefits are most pronounced at
portfolio returns in the range of 11 to 13 per cent. Interestingly, Nartea and Eves (2010)
found that the risk reduction benefits from the addition of farm real estate were most
significant between portfolio returns of 12 to 15 per cent, indicating that farm real estate
is effective at reducing risk for portfolios with returns between 11 to 15 per cent. Within
this range of returns, annual risk levels can be significantly reduced in a mixed asset
portfolio, varying in magnitude from 33.8 per cent to 25 per cent of the total mix. The
risk reduction benefits of dairy farm real estate decline sharply at both ends of the
efficient frontier, but even with small allocations of dairy farm real estate seen at the
lower end of the efficient frontier ranging from 18 per cent to 25 per cent of the total
portfolio, reduction in risk still ranges from 4.4 per cent to 16.8 per cent or 25.9 to 99.5
basis points.

" 13""
Figure 3. Efficient sets, Australian financial portfolio and the global financial portfolio, 1979-2012
Figure 4. Efficient sets, with and without dairy farm real estate, 1979-2012
It can be seen in figure 4 that the addition of dairy farm real estate to an already well
diversified international stock portfolio provides significant diversification benefits and
that these benefits are most pronounced between portfolio returns of 11 to 13 per cent.
New Zealand dairy farm real estate appears to offer significantly higher returns than its
Australian counterparts and is reiterated in Table I. With the exception of Queensland,
Australian dairy farm real estate appears to have very similar returns and risk levels,
New"Zealand"Dairy"
Queensland"
Western"Australia"Tasmania"
US"England"
Australia"
New"Zealand"
Japan"
Hong"Kong"
France"
Singapore"AUS"10"yr"T#bills"
0.0"1.0"2.0"3.0"4.0"5.0"6.0"7.0"8.0"9.0"10.0"11.0"12.0"13.0"14.0"15.0"16.0"
0" 2" 4" 6" 8" 10" 12" 14" 16" 18" 20" 22" 24" 26" 28" 30" 32" 34" 36" 38" 40"
Expected(return(%)(
Standard(deviation(
Global"Financials"
Australian"Financials"
New"Zealand"Dairy"
Queensland"
Western"Australia"Tasmania"
US"England"
Australia"
New"Zealand"
Japan"
Hong"Kong"
France"
Singapore"AUS"10"yr"T#bills"
0.0"1.0"2.0"3.0"4.0"5.0"6.0"7.0"8.0"9.0"10.0"11.0"12.0"13.0"14.0"15.0"16.0"
0" 2" 4" 6" 8" 10" 12" 14" 16" 18" 20" 22" 24" 26" 28" 30" 32" 34" 36" 38" 40"
Expected(return(%)(
Standard(deviation(
Global"Financials"
Dairy"Farms"
Global"Financials"with"Farm"

" 14""
which can also be seen in Table I. Figures 3 and 4 reveal that risk efficient portfolios
situated in the lower left hand corner, i.e. more conservative portfolios with less
expected return are more likely to be comprised of Australian 10 yr Treasury bills and
Tasmanian and Western Australian dairy farm real estate. New Zealand dairy farm real
estate is positioned in the mid point on the efficient frontier, indicating it would make
up a significant portion of the efficient portfolio when expected returns are within a mid
range of 11 to 13 per cent. Figure 4 illustrates the expansion of the efficient set with the
addition of dairy farm real estate, it can be seen that the largest ‘gap’ between the
efficient portfolios with and without dairy farm real estate occur between portfolio
returns of 11 and 13 per cent, indicating the range where diversification is most
effective. The characteristics of the assets shown above ultimately affects their
weighting within the efficient set and this will be illustrated in greater detail in Table V.

" 15""
Table III Risk efficient portfolios (risk reduction)
!!
Portfolio
Assets Global MVP 2 3 4 5 6 7 8 9 10
Panel A. Efficient set without dairy farm real estate
United States 0.00 2.09 7.21 34.80 34.33 29.91 33.02 19.29 28.52 23.68
England 0.00 0.00 -8.35 16.55 14.20 0.00 0.83 0.00 0.00 0.00
Australia 0.00 0.00 0.00 0.00 0.00 0.00 -5.55 0.00 -20.24 -35.40
New Zealand 0.00 0.33 3.37 10.81 11.33 14.79 15.22 16.26 18.80 22.35
Japan 0.00 0.00 0.00 0.00 0.00 0.00 0.00 0.00 0.00 0.00
Hong Kong 1.96 6.59 12.70 18.31 20.01 32.03 32.03 42.58 45.97 60.05
France 0.00 2.77 7.26 19.54 20.13 23.26 24.45 21.87 26.95 29.31
Singapore 0.00 0.00 0.00 0.00 0.00 0.00 0.00 0.00 0.00 0.00
Australian 90 Day Bank Bill % 0.00 0.00 0.00 0.00 0.00 0.00 0.00 0.00 0.00 0.00
Australian 10 year Treasury bills % 98.04 88.22 77.81 0.00 0.00 0.00 0.00 0.00 0.00 0.00
Expected return (%) 9.02 9.38 10.00 10.86 11.00 11.97 12.00 12.63 13.00 14.00
Portfolio Standard deviation (%) 3.54 4.11 5.93 10.79 11.16 14.15 14.75 16.34 19.42 24.48
Panel B. Efficient portfolios with dairy farm real estate
New Zealand Dairy 0.92 7.06 25.45 41.28 44.39 63.92 54.67 54.31 31.43 2.86
New South Wales Dairy 0.00 0.00 0.00 0.00 0.00 0.00 0.00 0.00 0.00 0.00
Victoria Dairy 0.00 0.00 0.00 0.00 0.00 0.00 0.00 0.00 0.00 0.00
Queensland Dairy 0.00 0.00 0.00 0.00 0.00 0.00 0.00 0.00 0.00 0.00
South Australia Dairy 0.00 0.00 0.00 0.00 0.00 0.00 0.00 0.00 0.00 0.00
Western Australia Dairy 7.67 2.65 0.00 0.00 0.00 0.00 0.00 0.00 0.00 0.00
Tasmania Dairy 10.69 6.05 0.00 0.00 0.00 0.00 0.00 0.00 0.00 0.00
United States 2.32 3.12 1.98 0.05 0.00 0.00 0.00 0.00 0.00 0.00
England 0.00 0.00 0.00 0.00 0.00 0.00 0.00 0.00 0.00 0.00
Australia 0.00 0.00 0.00 0.00 0.00 0.00 0.00 0.00 0.00 0.00
New Zealand 0.00 0.00 0.00 0.00 0.00 0.00 0.00 0.00 0.00 0.00
Japan 0.00 0.00 0.00 0.00 0.00 0.00 0.00 0.00 0.00 0.00
Hong Kong 0.00 0.00 5.23 10.13 11.04 16.69 40.18 40.95 68.57 97.14
France 0.00 0.00 4.23 9.86 10.85 16.96 5.15 4.74 0.00 0.00
Singapore 0.00 0.00 0.00 0.00 0.00 0.00 0.00 0.00 0.00 0.00
Australian 90 Day Bank Bill % 0.00 0.00 0.00 0.00 0.00 0.00 0.00 0.00 0.00 0.00
Australian 10 year Treasury bills % 78.41 81.12 63.12 38.67 33.72 2.43 0.00 0.00 0.00 0.00
Expected return (%) 8.71 9.00 10.00 10.84 11.00 12.00 12.97 13.00 14.00 15.00
Portfolio Standard deviation (%) 3.28 3.39 4.94 6.98 7.40 10.13 14.39 14.56 21.21 29.08
Reduction in risk (%) !
4.4%! 16.8%!!
33.8%! 31.3%!!
25.0%! 13.3%!!
Reduction in risk (basis points) !
25.9! 99.5!!
376.8 461.9 !
486.0! 326.3 !
Notes: Reduction in risk measures the percentage increase in risk relative to the corresponding portfolio with the same expected return in the efficient set without dairy farm real estate, basis point increase in risk relative to the corresponding portfolio with the same expected return in the efficient set without dairy farm real estate.

" 16""
3.5 The role of dairy farm real estate in mixed asset portfolios
It is evident from the results that the inclusion of dairy farm real estate in mixed asset
portfolios can have significant risk reduction benefits. The magnitude of these benefits
is quantified in Table III, which finds benefits are most significant with portfolio returns
between 11 and 13 per cent. This result is consistent with those of (Nartea and Eves,
2010) and is not surprising given that dairy farm real estate returns are negatively
correlated with many equity markets. It is also apparent from Table III that New
Zealand dairy farm real estate appears to be a more effective risk reduction vehicle than
its Australian counterparts. The reduction in risk appears to peak when New Zealand
dairy farm real estate makes up almost half the portfolio and is less when New Zealand
dairy farm real estate makes up only a small composition of the portfolio.

" 17""
Table IV.
Sharpe ratios for efficient sets with and without dairy farm real estate.
Return Level (%)
Without Dairy farm real estate
With Dairy farm real estate
Per cent increase in Sharpe ratio
9.50
0.05 0.05 0.08
9.75
0.09 0.10 0.14
10.00
0.12 0.14 0.20
10.25
0.14 0.17 0.25
10.50
0.15 0.20 0.28
10.75
0.14 0.22 0.56
11.00
0.15 0.23 0.51
11.25
0.16 0.24 0.47
11.50
0.17 0.25 0.46
11.75
0.18 0.26 0.45
12.00
0.18 0.27 0.46
12.25
0.19 0.27 0.45
12.50
0.19 0.27 0.42
12.75
0.19 0.26 0.38
13.00
0.19 0.25 0.33
13.25
0.19 0.25 0.29
13.50
0.19 0.24 0.24
13.75
0.19 0.23 0.20
14.00
0.19 0.22 0.15
14.25
0.21 0.21 0.03
14.50
0.21 0.21 0.00
14.75
0.21 0.20 -0.02
Mean Sharpe ratio 0.17 0.22 Std dev. of Sharpe ratio 0.04 0.06 t-stat
4.32
3.6 Increase in the Sharpe ratio
For each efficient set with and without dairy farm real estate, Sharpe ratios are
calculated for 22 portfolios determined by their return levels ranging from 9.50 to 14.75
per cent in 0.25 increments. Table V displays the Sharpe ratios of the efficient portfolios
with and without dairy farm real estate and it shows that the addition of dairy farm real

" 18""
estate to a mixed asset portfolio will enhance the ‘excess return per unit of risk’.
Consistent with the results on risk reduction in Table III, benefits from the addition of
dairy farm real estate appear to be maximized for portfolios with returns ranging from
11 to 13 per cent. These portfolios registered an increase in the Sharpe ratio of almost
50 per cent relative to the corresponding portfolios without dairy farm real estate.
Within this range, the Sharpe ratio without dairy farm real estate is almost half the value
of the portfolio with dairy farm real estate.
Testing the statistical significance of differences in the mean Sharpe ratios assist in
providing robust evidence of the potential diversification benefits. The mean Sharpe
ratios are a useful indicator of the average excess return per unit of risk for a mixed
asset portfolio. The T-test was used to determine statistical significance. My results
produced a t stat value of -4.32, with a critical value of 2.02, indicating the differences
in mean Sharpe ratios are highly significant.
Greater insight into the role of Australasian dairy farm real estate in mixed asset
portfolios can be explained from an analysis of the assets that it replaces. Table IV
illustrates the composition of the risk efficient portfolios. Panels A and B show the risk
efficient portfolios without dairy farm real estate and with dairy farm real estate
respectively, while panel C displays the changes in the composition of the portfolios as
a result of the introduction of dairy farm real estate to the mix. Panel A shows that low
return portfolios within the efficient set without the inclusion of dairy farm real estate
are dominated by Australian 10 year Treasury bills. At expected returns of 9 per cent,
Australian Treasury bills make up almost 100 per cent of the portfolio. At higher levels
of expected return, the composition of Australian Treasury bills diminishes, as shown in
panel C. Of the equity markets shown in panel A, New Zealand, Hong Kong and France
make up the efficient frontier. While New Zealand’s reward to risk ratio was then other
markets such as Australia, It was less correlated to other international markets. The US

" 19""
had a competitive reward to risk ratio of 0.54 but is highly correlated with Australian
and European markets. England, while competitive, is highly correlated with European,
US and Asian markets. Singapore and Japan do not enter the efficient set which is
unsurprising as these markets have among the lowest reward to risk ratios, as shown in
Table I.
With the addition of dairy farm real estate, the composition of global financials is
reduced. New Zealand stocks are no longer competitive and do not form part of the
efficient set for any levels of risk. France is included but only for portfolios with returns
ranging from 10 to 13 per cent. Hong Kong only enters the efficient set at return levels
higher than 10 per cent, although forms 68 per cent of the portfolio at the 14 per cent
level, possibly due to the superior risk reduction benefits of the inclusion of 31 per cent
of New Zealand dairy farm real estate. Interestingly, Australian dairy farm real estate
only forms part of the efficient frontier at rates of return of 9 per cent or less. At return
levels of less than 9 per cent, Tasmanian dairy farm real estate is the most represented
Australian state, making up 10.7 per cent of the efficient frontier, with Western
Australia the only other state to enter the mix at 7.67 per cent of the efficient portfolio.
At the 9 per cent return level, Tasmania represents 6.0 per cent of the efficient portfolio
with Western Australia making up 2.6 per cent of the efficient set. Of the Australian
states, Tasmania had the highest reward to risk ratio, see Table I. While Western
Australia’s reward to risk ratio was not competitive, its correlations to dairying
activities in other states and to global financials was particularly low, so it’s likely the
asset has unique diversification benefits when portfolio return levels are less than 9 per
cent. While Australian dairy real estate is uncompetitive with its New Zealand
counterparts at levels of return higher than 9 per cent, it is more competitive at return
levels of 9 per cent and less, potentially indicating a place for Australian dairy farm real
estate among more conservative mixed asset portfolios. International equity markets are

" 20""
included in the efficient set for return levels of 10 per cent and higher, with only the US
entering at the 9 per cent return level.
With the addition of dairy farm real estate, New Zealand dairy farm real estate is the
only asset class that is represented in every efficient set for all levels of portfolio return
measured. While New Zealand dairy farm real estate makes up only small portions of
the efficient set, less then 1 per cent at less then 9 per cent return and less then 3 per
cent at 15 per cent return, it makes up more than half the portfolio at return levels
between 11 and 13 per cent. This finding supports my initial discovery, that the
magnitude of diversification benefits from dairy farm real estate are most pronounced at
return levels between 11 and 13 per cent, as shown in Table III. It is clear from Table III
and Table IV that at return levels of 10 per cent and greater, New Zealand dairy farm
real estate offers superior return and risk reduction benefits than its Australian
counterparts.
Table V.
Composition of risk efficient portfolios
!!
Portfolio
Assets Global MVP 2 3 4 5 6 7 8 9 10
Panel A. Efficient set without dairy farm real estate
United States 0.00 2.09 7.21 34.80 34.33 29.91 33.02 19.29 28.52 23.68
England 0.00 0.00 -8.35 16.55 14.20 0.00 0.83 0.00 0.00 0.00
Australia 0.00 0.00 0.00 0.00 0.00 0.00 -5.55 0.00 -20.24 -35.40
New Zealand 0.00 0.33 3.37 10.81 11.33 14.79 15.22 16.26 18.80 22.35
Japan 0.00 0.00 0.00 0.00 0.00 0.00 0.00 0.00 0.00 0.00
Hong Kong 1.96 6.59 12.70 18.31 20.01 32.03 32.03 42.58 45.97 60.05
France 0.00 2.77 7.26 19.54 20.13 23.26 24.45 21.87 26.95 29.31
Singapore 0.00 0.00 0.00 0.00 0.00 0.00 0.00 0.00 0.00 0.00
Australian 90 Day Bank Bill % 0.00 0.00 0.00 0.00 0.00 0.00 0.00 0.00 0.00 0.00
Australian 10 year Treasury bills % 98.04 88.22 77.81 0.00 0.00 0.00 0.00 0.00 0.00 0.00
Expected return (%) 9.02 9.38 10.00 10.86 11.00 11.97 12.00 12.63 13.00 14.00
Portfolio Standard deviation (%) 3.54 4.11 5.93 10.79 11.16 14.15 14.75 16.34 19.42 24.48
Panel B. Efficient portfolios with dairy farm real estate

" 21""
New Zealand Dairy 0.92 7.06 25.45 41.28 44.39 63.92 54.67 54.31 31.43 2.86
New South Wales Dairy 0.00 0.00 0.00 0.00 0.00 0.00 0.00 0.00 0.00 0.00
Victoria Dairy 0.00 0.00 0.00 0.00 0.00 0.00 0.00 0.00 0.00 0.00
Queensland Dairy 0.00 0.00 0.00 0.00 0.00 0.00 0.00 0.00 0.00 0.00
South Australia Dairy 0.00 0.00 0.00 0.00 0.00 0.00 0.00 0.00 0.00 0.00
Western Australia Dairy 7.67 2.65 0.00 0.00 0.00 0.00 0.00 0.00 0.00 0.00
Tasmania Dairy 10.69 6.05 0.00 0.00 0.00 0.00 0.00 0.00 0.00 0.00
United States 2.32 3.12 1.98 0.05 0.00 0.00 0.00 0.00 0.00 0.00
England 0.00 0.00 0.00 0.00 0.00 0.00 0.00 0.00 0.00 0.00
Australia 0.00 0.00 0.00 0.00 0.00 0.00 0.00 0.00 0.00 0.00
New Zealand 0.00 0.00 0.00 0.00 0.00 0.00 0.00 0.00 0.00 0.00
Japan 0.00 0.00 0.00 0.00 0.00 0.00 0.00 0.00 0.00 0.00
Hong Kong 0.00 0.00 5.23 10.13 11.04 16.69 40.18 40.95 68.57 97.14
France 0.00 0.00 4.23 9.86 10.85 16.96 5.15 4.74 0.00 0.00
Singapore 0.00 0.00 0.00 0.00 0.00 0.00 0.00 0.00 0.00 0.00
Australian 90 Day Bank Bill % 0.00 0.00 0.00 0.00 0.00 0.00 0.00 0.00 0.00 0.00
Australian 10 year Treasury bills % 78.41 81.12 63.12 38.67 33.72 2.43 0.00 0.00 0.00 0.00
Expected return (%) 8.71 9.00 10.00 10.84 11.00 12.00 12.97 13.00 14.00 15.00
Portfolio Standard deviation (%) 3.28 3.39 4.94 6.98 7.40 10.13 14.39 14.56 21.21 29.08
Reduction in risk (%) !
4.4%! 16.8%!!
33.8%! 31.3%!!
25.0%! 13.3%!!
Reduction in risk (basis points) !
25.9! 99.5!!
376.8 461.9 !
486.0! 326.3 !
! ! ! ! ! ! ! ! ! ! !Panel C. Change in the composition of risk efficient portfolios with the introduction of dairy farm real estate
Return!level!!
9.00! 10.00!!
11.00! 12.00!!
13.00! 14.00!!
%!Change!in!composition!! ! ! ! ! ! ! ! ! !
Asset!class!! ! ! ! ! ! ! ! ! !
New Zealand Dairy !
6.14! 18.39!!
18.94! 19.53!!
@9.60! @22.89!!
New South Wales Dairy !
0.00! 0.00!!
0.00! 0.00!!
0.00! 0.00!!
Victoria Dairy !
0.00! 0.00!!
0.00! 0.00!!
0.00! 0.00!!
Queensland Dairy !
0.00! 0.00!!
0.00! 0.00!!
0.00! 0.00!!
South Australia Dairy !
0.00! 0.00!!
0.00! 0.00!!
0.00! 0.00!!
Western Australia Dairy !
@5.02! 0.00!!
0.00! 0.00!!
0.00! 0.00!!
Tasmania Dairy !
@4.64! 0.00!!
0.00! 0.00!!
0.00! 0.00!!
United States !
0.80! @1.14!!
0.00! 0.00!!
0.00! 0.00!!
England !
0.00! 0.00!!
0.00! 0.00!!
0.00! 0.00!!
Australia !
0.00! 0.00!!
0.00! 0.00!!
0.00! 0.00!!
New Zealand !
0.00! 0.00!!
0.00! 0.00!!
0.00! 0.00!!
Japan !
0.00! 0.00!!
0.00! 0.00!!
0.00! 0.00!!
Hong Kong !
0.00! 5.23!!
5.81! 5.65!!
24.25! 27.62!!
France !
0.00! 4.23!!
6.62! 6.11!!
@12.22! 0.00!!
Singapore !
0.00! 0.00!!
0.00! 0.00!!
0.00! 0.00!!
Australian 90 Day Bank Bill % !
0.00! 0.00!!
0.00! 0.00!!
0.00! 0.00!!
Australian 10 year Treasury bills % !
81.12! @18.01!!
@29.39! @31.29!!
0.00! 0.00!!
!! !! !! !! !! !! !! !! !! !!!
! ! ! ! ! ! ! ! ! ! !
" 22""
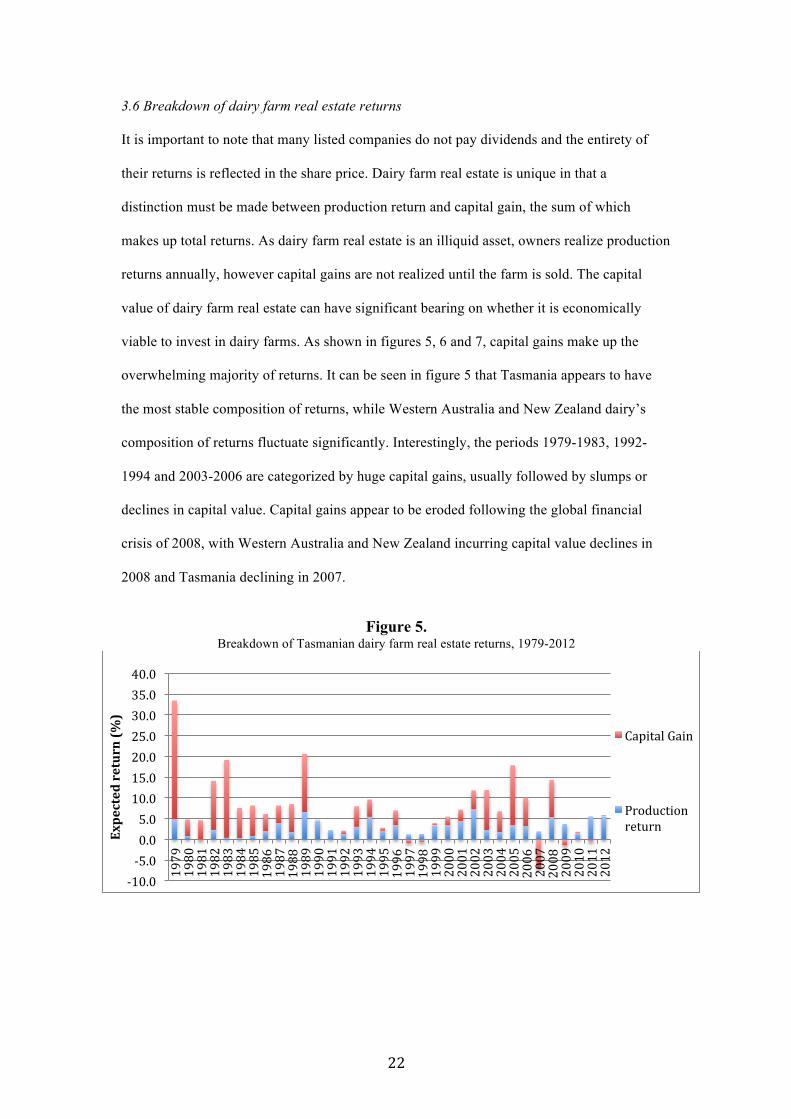
3.6 Breakdown of dairy farm real estate returns
It is important to note that many listed companies do not pay dividends and the entirety of
their returns is reflected in the share price. Dairy farm real estate is unique in that a
distinction must be made between production return and capital gain, the sum of which
makes up total returns. As dairy farm real estate is an illiquid asset, owners realize production
returns annually, however capital gains are not realized until the farm is sold. The capital
value of dairy farm real estate can have significant bearing on whether it is economically
viable to invest in dairy farms. As shown in figures 5, 6 and 7, capital gains make up the
overwhelming majority of returns. It can be seen in figure 5 that Tasmania appears to have
the most stable composition of returns, while Western Australia and New Zealand dairy’s
composition of returns fluctuate significantly. Interestingly, the periods 1979-1983, 1992-
1994 and 2003-2006 are categorized by huge capital gains, usually followed by slumps or
declines in capital value. Capital gains appear to be eroded following the global financial
crisis of 2008, with Western Australia and New Zealand incurring capital value declines in
2008 and Tasmania declining in 2007.
Figure 5.
Breakdown of Tasmanian dairy farm real estate returns, 1979-2012
#10.0"#5.0"0.0"5.0"10.0"15.0"20.0"25.0"30.0"35.0"40.0"
1979"
1980"
1981"
1982"
1983"
1984"
1985"
1986"
1987"
1988"
1989"
1990"
1991"
1992"
1993"
1994"
1995"
1996"
1997"
1998"
1999"
2000"
2001"
2002"
2003"
2004"
2005"
2006"
2007"
2008"
2009"
2010"
2011"
2012"Ex
pected(return((%
)(
Capital"Gain"
Production"return"

" 23""
Figure 6. Breakdown of Western Australian dairy farm real estate returns, 1979-2012
Figure 7. Breakdown of New Zealand dairy farm real estate returns, 1979-2012
#15.0"#10.0"#5.0"0.0"5.0"10.0"15.0"20.0"25.0"30.0"35.0"
1979"
1980"
1981"
1982"
1983"
1984"
1985"
1986"
1987"
1988"
1989"
1990"
1991"
1992"
1993"
1994"
1995"
1996"
1997"
1998"
1999"
2000"
2001"
2002"
2003"
2004"
2005"
2006"
2007"
2008"
2009"
2010"
2011"
2012"
Expected(return((%
)( Capital"gain"
Production"return"
#20.0"
#10.0"
0.0"
10.0"
20.0"
30.0"
40.0"
50.0"
60.0"
1979"
1980"
1981"
1982"
1983"
1984"
1985"
1986"
1987"
1988"
1989"
1990"
1991"
1992"
1993"
1994"
1995"
1996"
1997"
1998"
1999"
2000"
2001"
2002"
2003"
2004"
2005"
2006"
2007"
2008"
2009"
2010"
2011"
2012"Expected(return((%
)(
Capital"gain"
Production"return"

" 24""
Figure 8. Breakdown of Australian dairy farm real estate returns, 1979-2012
Table VI
Composition of dairy farm real estate returns, 1979-2012.
Mean return (%) Rank
Standard Deviation
Coefficient of Variation
Reward-to-risk ratio Rank
Composition of returns
New Zealand Dairy 11.56 1 12.40 1.07 0.93 7 1.00
Capital Gain 7.80 2 11.52 1.48 0.68 11 0.67
Production return 3.80 9 2.09 0.55 1.82 2 0.33
Australia Dairy 6.94 5 6.42 0.93 1.08 6 1.00
Capital Gain 4.90 7 6.51 1.33 0.75 10 0.71
Production return 2.10 12 1.30 0.62 1.62 3 0.30
Western Australia Dairy 7.27 4 9.20 1.27 0.79 8 1.00
Capital Gain 4.80 8 8.77 1.83 0.55 12 0.66
Production return 2.50 11 1.29 0.52 1.94 1 0.34
Tasmania Dairy 7.98 3 7.12 0.89 1.12 5 1.00
Capital Gain 5.00 6 6.69 1.34 0.75 9 0.63
Production return 2.90 10 1.90 0.65 1.53 4 0.36
#10.0"
#5.0"
0.0"
5.0"
10.0"
15.0"
20.0"
25.0"
30.0"
1979"
1980"
1981"
1982"
1983"
1984"
1985"
1986"
1987"
1988"
1989"
1990"
1991"
1992"
1993"
1994"
1995"
1996"
1997"
1998"
1999"
2000"
2001"
2002"
2003"
2004"
2005"
2006"
2007"
2008"
2009"
2010"
2011"
2012"Expected(return((%
)( Production"return"
Capital"Gain"

" 25""
Table VI displays the risk and return measures for the composition of dairy farm real
estate returns for the period 1979-2012. The results show that New Zealand dairy farm
real estate has the highest average expected returns, with an expected return of 11.56 per
cent. Sixty seven per cent of New Zealand dairy farm returns were made up of capital
gains, in line with selected Australian dairy farms. Of the Australian dairy farms that
make up the efficient set, Tasmania’s production return made up the highest proportion
of total return. Interestingly, on a reward to risk basis, production returns outperformed
both total returns and capital gains. Western Australia’s production return had the
highest reward to risk ratio, at 1.94. Table VI reveals that production returns are less
volatile than capital gains and consequently offer higher reward to risk ratios. This is
possibly due to the fact that uncontrollable external forces can affect land prices,
whereas farmers can mitigate seasonal risks using effective pasture management such as
storing excess grass as silage for the winter.
Tables VII and VIII illustrate the magnitude to which capital gains affect the total return
of dairy farm real estate. It can be seen that the correlations shown in Table VII are
reasonably similar to those correlations for total return calculated in Table II. The
Correlations in Table VIII however, are significantly varied from those reported in
Table II, indicating total returns are more aligned with capital gains. This inference is
quantified in Table VI, which shows that capital gains make up the largest composition
of total return.

! 26!!
Table VII
Correlation of dairy farm capital gains and global financial returns, 1979-2012.
New Zealand
Dairy Australia
Dairy Western Australia
Dairy Tasmania
Dairy United States England Australia
New Zealand Japan Hong Kong France Singapore
AUS 90 Day Bank Bill
AUS 10 yr T-bills
New Zealand Dairy 1.00 0.36 0.28 0.23 -0.25 -0.10 -0.21 0.21 -0.14 0.11 -0.24 0.21 -0.18 0.21
Australia Dairy
1.00 0.58 0.75 -0.05 0.15 0.17 -0.01 0.33 0.03 0.01 0.27 0.18 0.39
Western Australia Dairy
1.00 0.22 -0.07 0.14 0.30 0.04 0.29 0.27 -0.06 0.47 0.35 0.07
Tasmania Dairy
1.00 -0.10 0.15 0.06 -0.10 0.27 -0.12 0.06 0.05 0.20 0.34
United States
1.00 0.76 0.63 0.28 0.44 0.27 0.52 0.31 0.61 0.17
England
1.00 0.60 0.24 0.54 0.40 0.65 0.43 -0.20 0.39
Australia
1.00 0.32 0.61 0.60 0.48 0.51 0.96 0.19
New Zealand
1.00 -0.01 0.38 0.25 -0.03 0.32 0.14
Japan
1.00 0.37 0.48 0.49 0.63 0.38
Hong Kong
1.00 0.16 0.58 0.58 0.25
France
1.00 0.07 0.49 0.34
Singapore
1.00 0.58 0.13
AUS 90 Day Bank Bill
1.00 0.20
AUS 10 yr T-Bill
1.00

! 27!!
Table VIII
Correlation of dairy farm production returns and global financial returns, 1979-2012
New Zealand
Dairy Australia
Dairy Western Australia
Dairy Tasmania
Dairy United States England Australia
New Zealand Japan Hong Kong France Singapore
AUS 90 Day Bank Bill
AUS 10 yr Treasury Bonds
New Zealand Dairy 1.00 0.53 -0.04 0.52 -0.09 -0.17 -0.12 0.16 -0.15 -0.02 -0.25 0.06 -0.13 -0.06
Australia Dairy
1.00 0.03 0.69 -0.23 -0.25 -0.17 0.02 -0.05 -0.02 -0.25 0.06 -0.11 -0.17
Western Australia Dairy
1.00 0.02 -0.22 0.00 0.12 -0.02 0.05 0.17 -0.04 0.13 0.10 0.31
Tasmania Dairy
1.00 -0.25 -0.30 -0.30 -0.34 -0.10 -0.22 -0.24 0.07 -0.26 -0.31
United States
1.00 0.76 0.63 0.28 0.44 0.27 0.52 0.31 0.61 0.17
England
1.00 0.60 0.24 0.54 0.40 0.65 0.43 -0.20 0.39
Australia
1.00 0.32 0.61 0.60 0.48 0.51 0.96 0.19
New Zealand
1.00 -0.01 0.38 0.25 -0.03 0.32 0.14
Japan
1.00 0.37 0.48 0.49 0.63 0.38
Hong Kong
1.00 0.16 0.58 0.58 0.25
France
1.00 0.07 0.49 0.34
Singapore
1.00 0.58 0.13
AUS 90 Day Bank Bill
1.00 0.20
AUS 10 yr T-Bills
1.00

! 28!!
4. Limitations Significant limitations exist with the calculation of dairy farm real estate returns. The
returns used in this study represent averages and do not consider the intensity of the
farming operation or its stocking rate. Within the Australasian states, some with
landmass more than most countries, significant regional differences are likely and may
not be properly reflected in the state average. New Zealand dairy farm real estate returns
could only be calculated using a national average, as regional data is unavailable. This
average would likely not necessary reflect the actual returns of a dairy farm in the South
Waikato or perhaps in Southland. This study recommends greater reporting and
emphasis be placed on monitoring the financial performance of dairy farm operations,
in particular Dairy NZ should expand their survey to include both regional variations
and dairy farm intensity distinctions.
5. Conclusion
This dissertation investigated the benefits of further diversifying a mixed portfolio of
international financial assets with Australasian dairy farm real estate. Given a
predominantly negative correlation between Australasian dairy farm real estate and
financial assets, the addition of the latter to a global financial asset portfolio has
significant risk reduction benefits. My analysis suggests that both Australian and New
Zealand dairy farm real estate has a role in a globally diversified asset portfolio. My
results show that dairy farm real estate in Tasmania and Western Australia could help
reduce risk and variability of returns for conservative asset portfolios with expected
returns of 9 per cent or less. New Zealand dairy farm real estate is an effective risk
reduction vehicle for asset portfolios with expected returns greater than 9 per cent.
Dairy farm real estate in Tasmania, Western Australia and New Zealand should be
given more serious attention by investment practitioners as vehicles for effective

! 29!!
diversification. It is important for greater public transparency regarding financial
performance of dairy farms, particularly in New Zealand. Ways of making it easier to
invest in dairy farm real estate, possibly through the wider application of unit trusts
investing in direct dairy farm real estate may promote the feasibility of dairy farm real
estate. Hedge fund managers in emerging markets should look to New Zealand dairy
farm real estate as an instrument for effective portfolio diversification. Conservative
fund managers, such as the New Zealand superannuation fund, should consider holdings
of dairy farm real estate in Western Australia and Tasmania to effectively diversify their
portfolio, reducing risk and enhancing return.

! 30!!
6. References
Barry, P. (1980). “Capital asset pricing and farm real estate”, American Journal of
Agricultural Economics, Vol. 62, pp. 549-553. Retrieved from
http://www.jstor.org/discover/10.2307/1240213?uid=2129&uid=2&uid=70&uid=
4&sid=21102884972443
Fisher, L., Lorie, J. (1970). “Some studies of variability of returns on investments in
common stocks: Introduction”, Journal of Business, Vol. 43, pp. 1-21. Retrieved
from
http://search.proquest.com.ezproxy.lincoln.ac.nz/abicomplete/docview/22257932
1/1418CFAC16D63715380/1?accountid=27890
Fisher, A. (2013). Dairy industry rates of return. Personal Communication.
Harvey, C. (1991). “ The world price of covariance risk”, Journal of Finance, Vol. 46,
pp. 111-158. Retrieved from
http://search.proquest.com.ezproxy.lincoln.ac.nz/abicomplete/docview/19470673
7/1418D09AE9050B1EA3E/6?accountid=27890
Kalra, R., Miroslav, S. and Sundaram, S. (2004). “ Diminishing gains from international
diversification”. Financial Services Review, Vol 13, pp. 119-213. Retrieved from
http://search.proquest.com.ezproxy.lincoln.ac.nz/abicomplete/docview/21204880
3/1418D27035B2C025FC6/1?accountid=27890

! 31!!
Kaplan, H. (1985). “Farmland as a portfolio investment”. The Journal of Portfolio
Management, Vol. 11, pp. 73-79. Retrieved from
http://search.proquest.com.ezproxy.lincoln.ac.nz/abicomplete/docview/19558000
8/141900AEC15175F4AC2/3?accountid=27890
Kerney, C., Lucey, B. (2004). “International equity market integration: theory, evidence
and implications”. International Review of Financial Analysis, Vol. 13, pp. 571-
583. Retrieved from
http://search.proquest.com.ezproxy.lincoln.ac.nz/abicomplete/docview/20007883
4/1418D2451EF2CFD5061/4?accountid=27890
Lee, S., Stevenson, S. (2006). “ Real estate in the mixed-asset portfolio: the question of
consistency”, Journal of Property Investment and Finance, Vol. 24, pp. 123-135.
Retrieved from
http://search.proquest.com.ezproxy.lincoln.ac.nz/abicomplete/docview/21297199
9/1418D173F9A6A3A885C/1?accountid=27890
Levy, H., Sarnat, M. (1970). “International diversification of investment portfolios”,
American Economic Review, Vol. 60, pp. 668-675. Retrieved from
http://search.proquest.com.ezproxy.lincoln.ac.nz/abicomplete/docview/87031670
8/1418D1061542A470ACE/3?accountid=27890
Markowitz, H. (1952), “Portfolio Selection”, Journal of Finance, Vol. 12, pp. 77-91.
Retrieved from
http://www.math.ust.hk/~maykwok/courses/ma362/07F/markowitz_JF.pdf

! 32!!
McCormick, D. (2013). “Alternative investments, post GFC opportunities arise”, Money
Management. Retrieved from
http://search.proquest.com.ezproxy.lincoln.ac.nz/abicomplete/docview/14364635
53/1411B99574B23DFFEF1/1?accountid=27890
Nartea, G., Eves, C. (2010). “Role of farm real estate in a globally diversified asset
portfolio”. Journal of Property Investment and Finance, Vol. 28, pp. 198-220.
Nartea, G., Webster, P. (2008). “Should farmers invest in financial assets as a risk
management strategy? Some evidence from New Zealand”, Australian Journal of
Agricultural and Resource Economics, Vol. 52, pp. 183-202. Retrieved from
http://search.proquest.com.ezproxy.lincoln.ac.nz/abicomplete/docview/23666982
3/141901EF26916B13215/1?accountid=27890
Newell, G., Eves, C. (2007). “The role of US farmland in real estate portfolios”. Journal
of Real Estate Portfolio Management, Vol. 13, pp. 317-327. Retrieved from
http://search.proquest.com.ezproxy.lincoln.ac.nz/abicomplete/docview/19795955
8/141900DA5C52324144E/2?accountid=27890
Painter, M. (2013). “Gold, black gold and farmland: should they all be part of your
investment portfolio?”, International Journal of Agricultural Management, Vol.
2, pp 100-112.
Painter, M. (2008). “The financial gains from adding farmland to an international
investment portfolio”. Journal of Real Estate Portfolio Management, Vol. 14, pp.
63-73. Retrieved from

! 33!!
http://search.proquest.com.ezproxy.lincoln.ac.nz/abicomplete/docview/19783837
2/1419018D0D9293590/1?accountid=27890
Painter, M. (2000). “Should Saskatchewan farmland be part of your investment
portfolio?” , Canadian Journal of Agricultural Economics, Vol. 48, pp. 39-50.
Retrieved from http://onlinelibrary.wiley.com/doi/10.1111/j.1744-
7976.2000.tb00264.x/abstract
Santis, G., Gerald, B. (1997). “International asset pricing and portfolio diversification
with time varying risk”, The Journal of Finance, Vol. 52 No. 5, pp. 1881-1912.
Retrieved from
http://www.jstor.org/discover/10.2307/2329468?uid=2129&uid=2&uid=70&uid=
4&sid=21102884851233
Sharpe, W. (1966). “Mutual fund performance”, Journal of Business, Vol. 39, pp. 119-
238. Retrieved from
http://www.jstor.org/discover/10.2307/2351741?uid=2129&uid=2&uid=70&uid=
4&sid=21102888510123
.