Embed Size (px)
Citation preview
Population & Development Revision
National Geography
What you need to know…
1. Factors Affecting Population Distribution2. Social, Economic & Combined Development
Indicators3. Factors Affecting Birth Rates & Death Rates4. Describing Population Pyramids & Graphs5. Problems & Solutions of Rapid Population
Growth6. Problems & Solutions of Slow Population Growth7. Migration
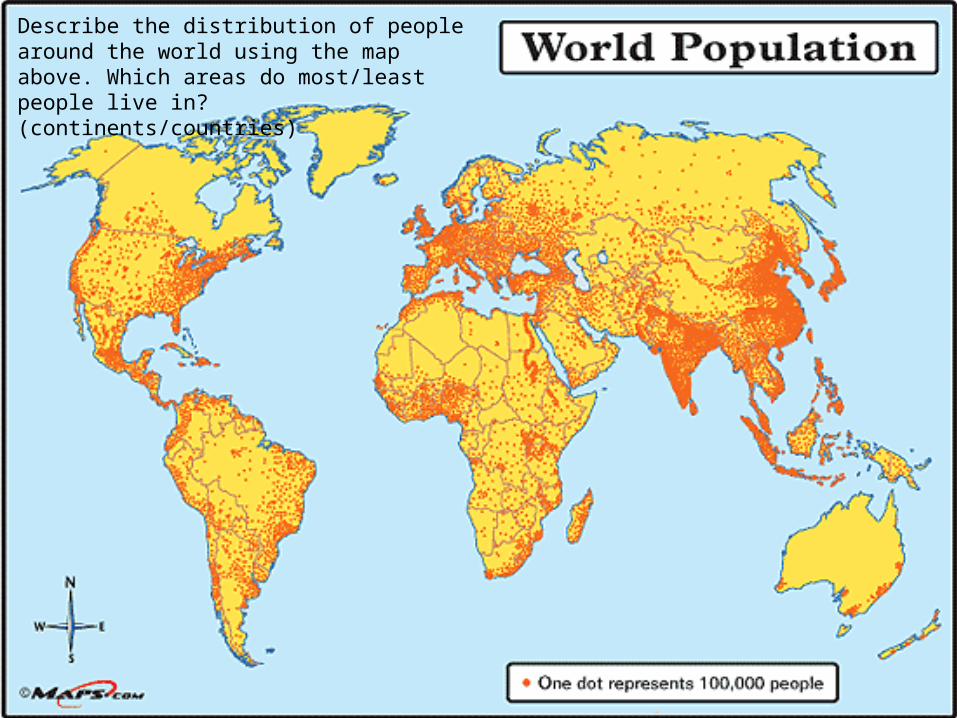
Describe the distribution of people around the world using the map above. Which areas do most/least people live in? (continents/countries)
1. Factors Affecting World Population Distribution
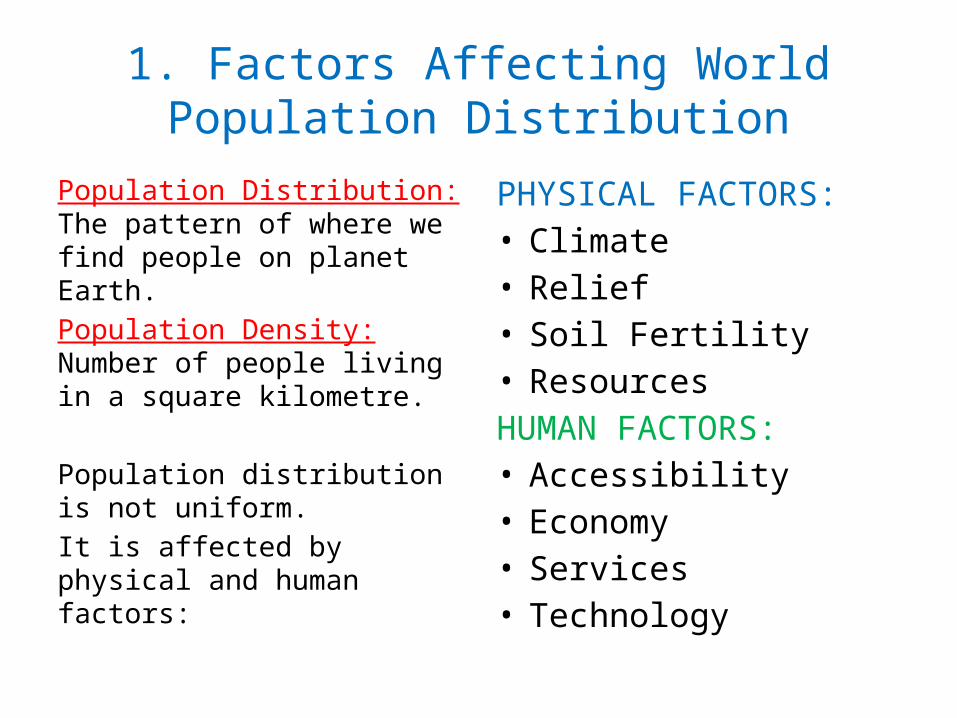
Population Distribution: The pattern of where we find people on planet Earth.Population Density: Number of people living in a square kilometre.
Population distribution is not uniform.It is affected by physical and human factors:
PHYSICAL FACTORS:• Climate• Relief• Soil Fertility• ResourcesHUMAN FACTORS:• Accessibility• Economy• Services• Technology
2. Development
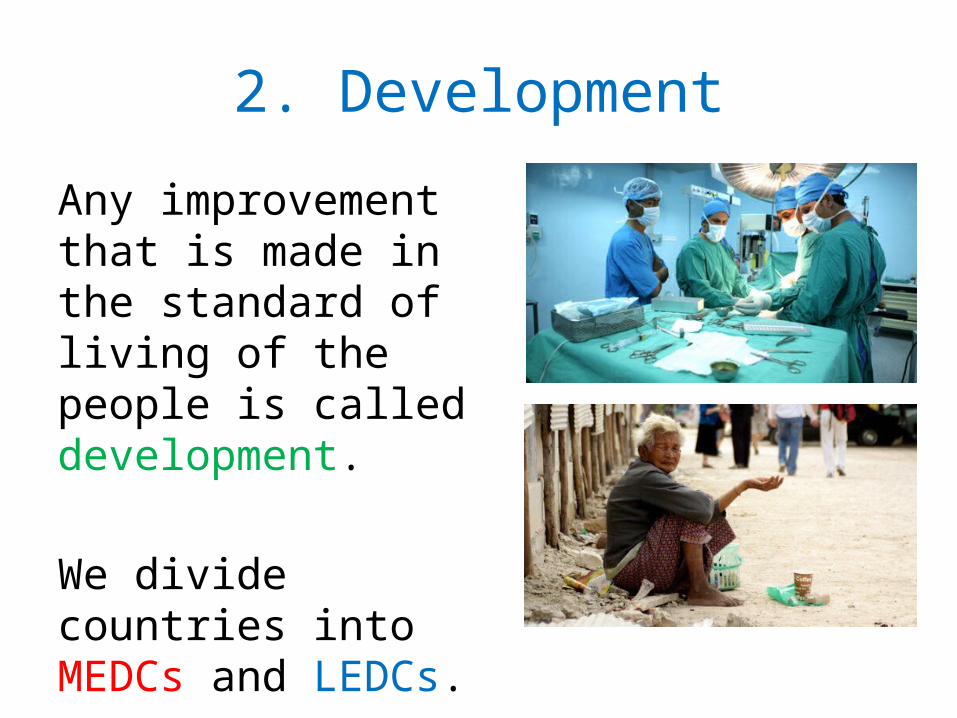
Any improvement that is made in the standard of living of the people is called development.
We divide countries into MEDCs and LEDCs.
Economic Indicators of Development
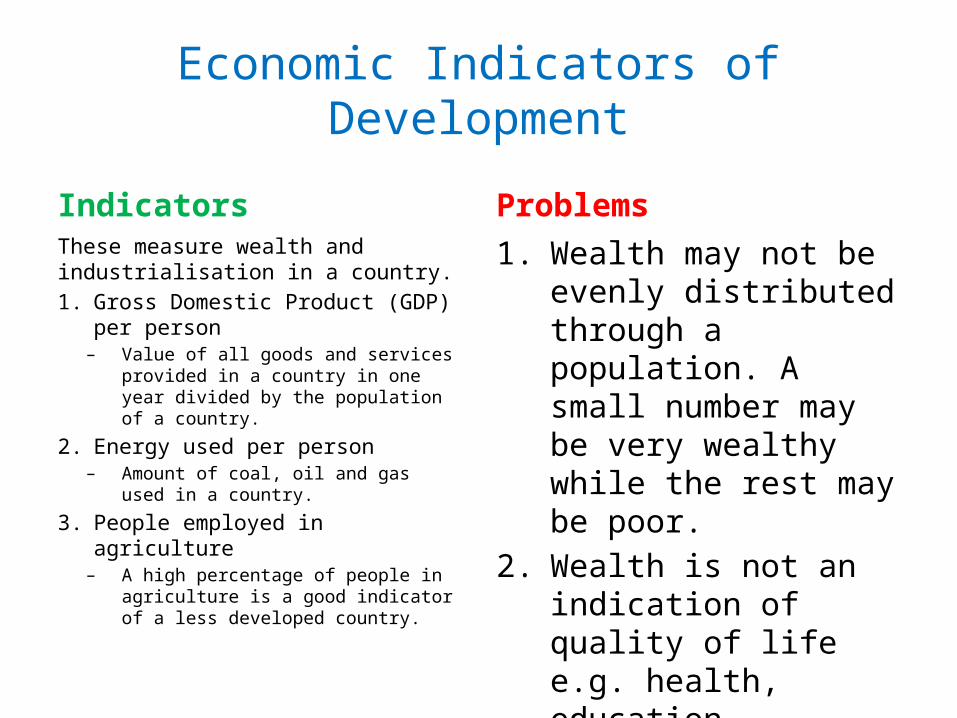
IndicatorsThese measure wealth and industrialisation in a country.1. Gross Domestic Product (GDP) per
person– Value of all goods and services
provided in a country in one year divided by the population of a country.
2. Energy used per person– Amount of coal, oil and gas used in a
country.
3. People employed in agriculture– A high percentage of people in
agriculture is a good indicator of a less developed country.
Problems1. Wealth may not be evenly
distributed through a population. A small number may be very wealthy while the rest may be poor.
2. Wealth is not an indication of quality of life e.g. health, education.
Social Indicators of Development
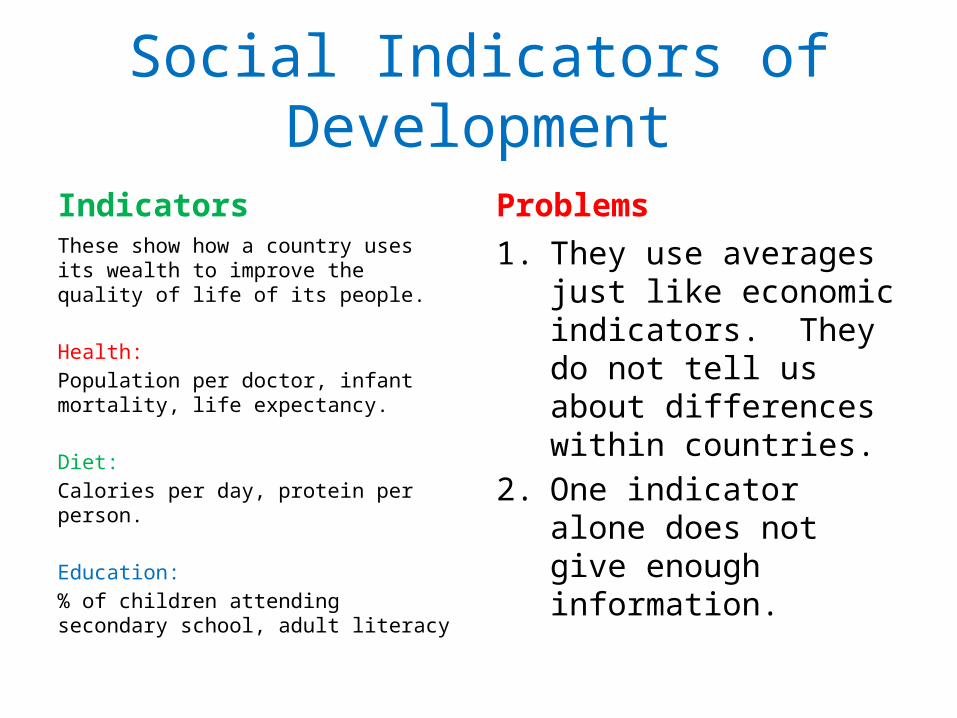
IndicatorsThese show how a country uses its wealth to improve the quality of life of its people.
Health: Population per doctor, infant mortality, life expectancy.
Diet:Calories per day, protein per person.
Education:% of children attending secondary school, adult literacy
Problems1. They use averages just like
economic indicators. They do not tell us about differences within countries.
2. One indicator alone does not give enough information.
Combined Development Indicators
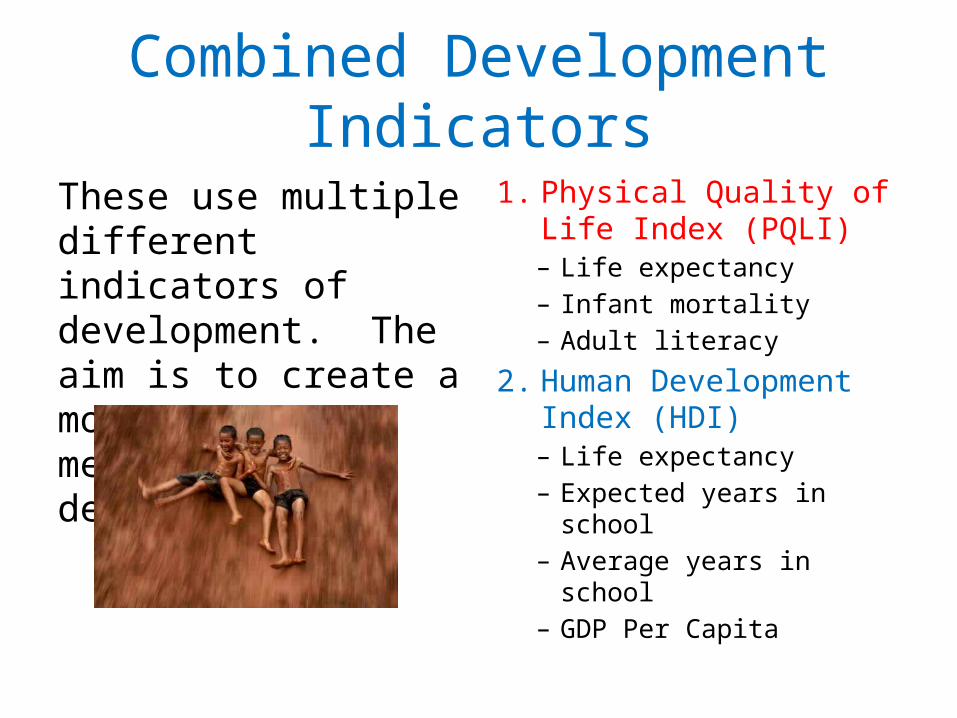
These use multiple different indicators of development. The aim is to create a more accurate measure of development.
1. Physical Quality of Life Index (PQLI)– Life expectancy– Infant mortality– Adult literacy
2. Human Development Index (HDI)– Life expectancy– Expected years in school– Average years in school– GDP Per Capita
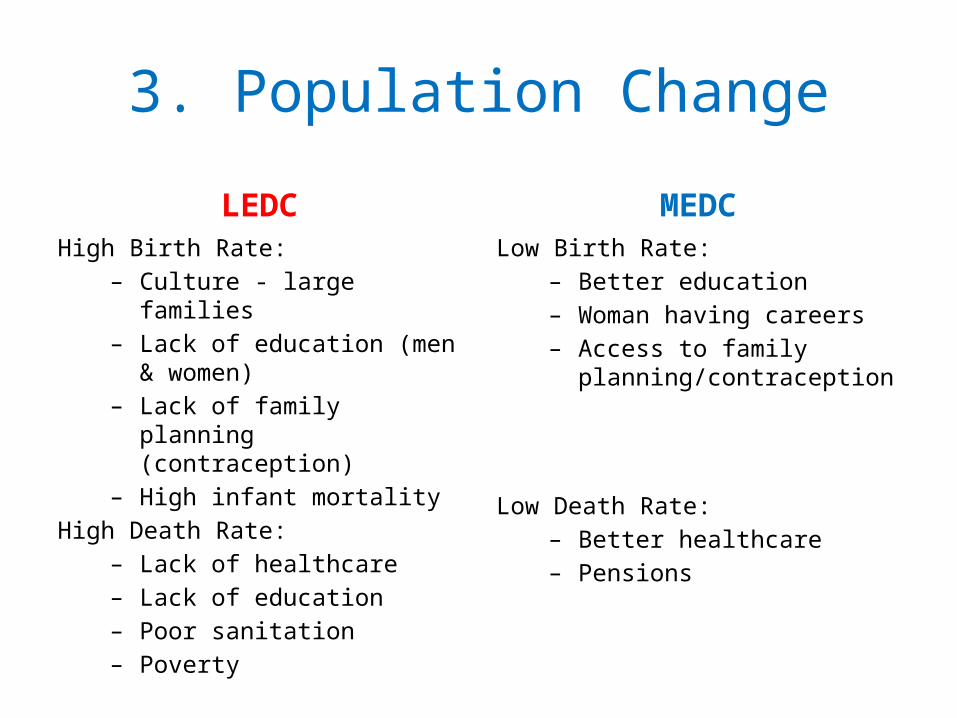
3. Population Change
LEDCHigh Birth Rate:
– Culture - large families– Lack of education (men &
women)– Lack of family planning
(contraception)– High infant mortality
High Death Rate:– Lack of healthcare– Lack of education– Poor sanitation– Poverty
MEDCLow Birth Rate:
– Better education– Woman having careers– Access to family
planning/contraception
Low Death Rate:– Better healthcare– Pensions
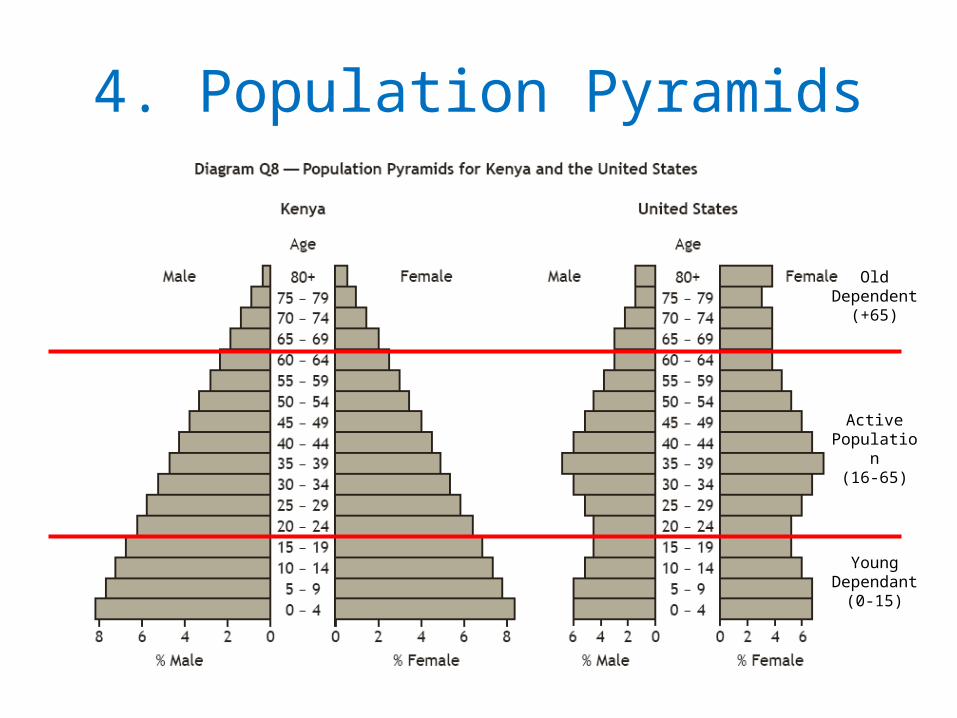
4. Population Pyramids
Old Dependent
(+65)
Active Population
(16-65)
Young Dependant
(0-15)
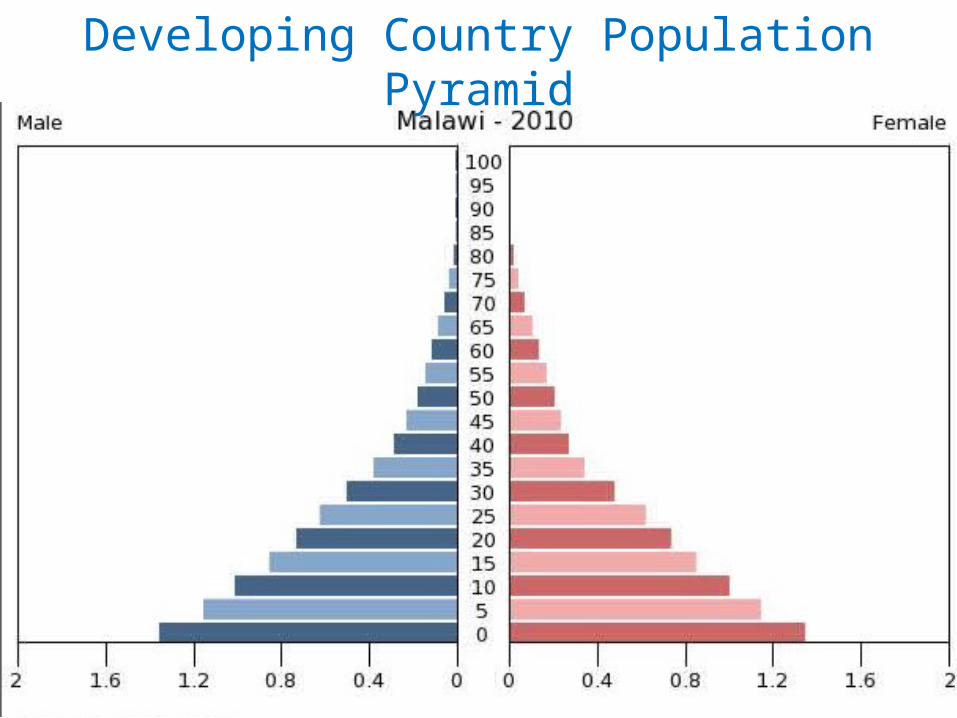
Developing Country Population Pyramid
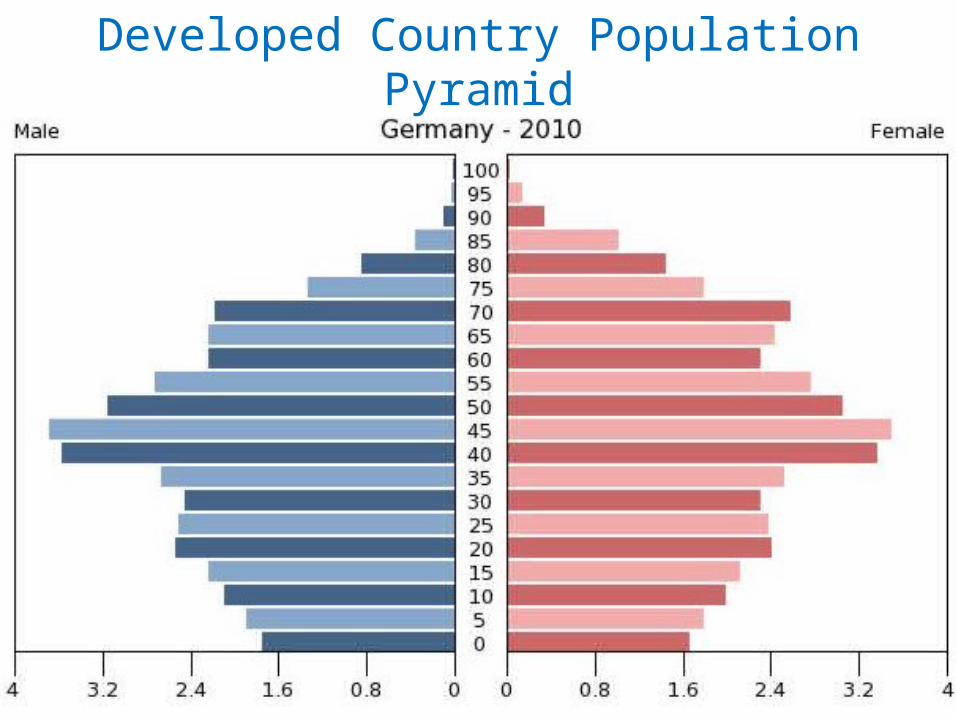
Developed Country Population Pyramid

What is predicted to happen to the structure of the population in Scotland?
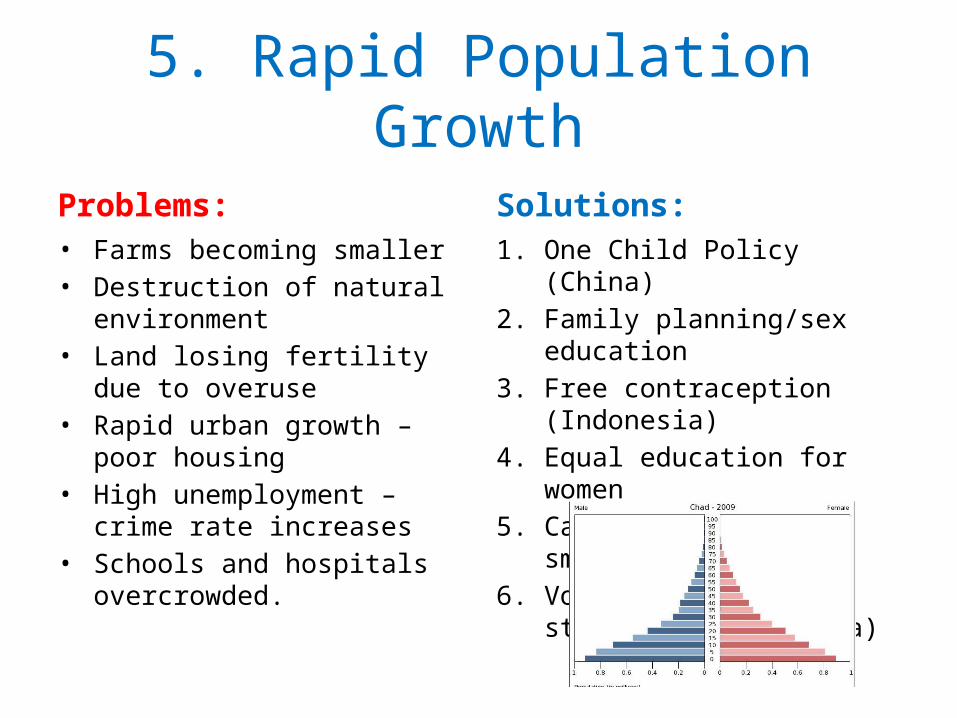
5. Rapid Population Growth
Problems:• Farms becoming smaller• Destruction of natural
environment• Land losing fertility due to
overuse• Rapid urban growth – poor
housing• High unemployment – crime rate
increases• Schools and hospitals
overcrowded.
Solutions:1. One Child Policy (China)2. Family planning/sex education3. Free contraception (Indonesia)4. Equal education for women5. Cash incentives for small families6. Voluntary sterilisation (India)
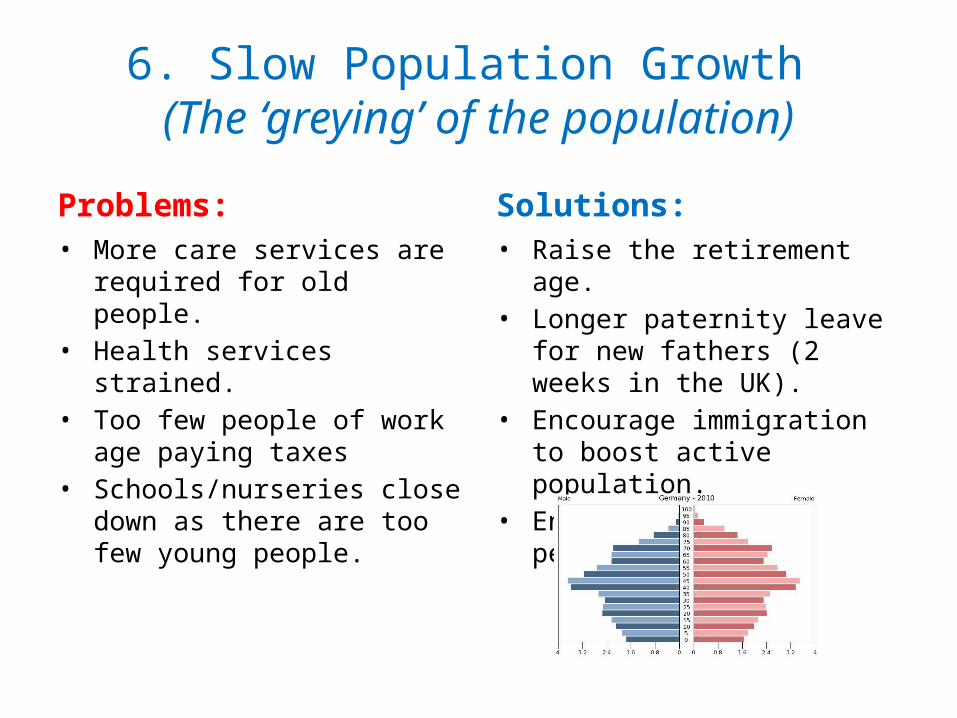
6. Slow Population Growth (The ‘greying’ of the population)
Problems:• More care services are required
for old people.• Health services strained.• Too few people of work age
paying taxes• Schools/nurseries close down as
there are too few young people.
Solutions:• Raise the retirement age.• Longer paternity leave for new
fathers (2 weeks in the UK).• Encourage immigration to boost
active population.• Encourage private pension
schemes.
7. Migration
Push Factors• Political Fears• Not enough jobs
(unemployment)• Natural Disasters e.g.
drought• Shortage of food• Few opportunities• War• Unhappy life
Pull Factors• Improved living conditions• Warmer climate• Medical Care• Better way of life• Better Education• Better Housing• Family links
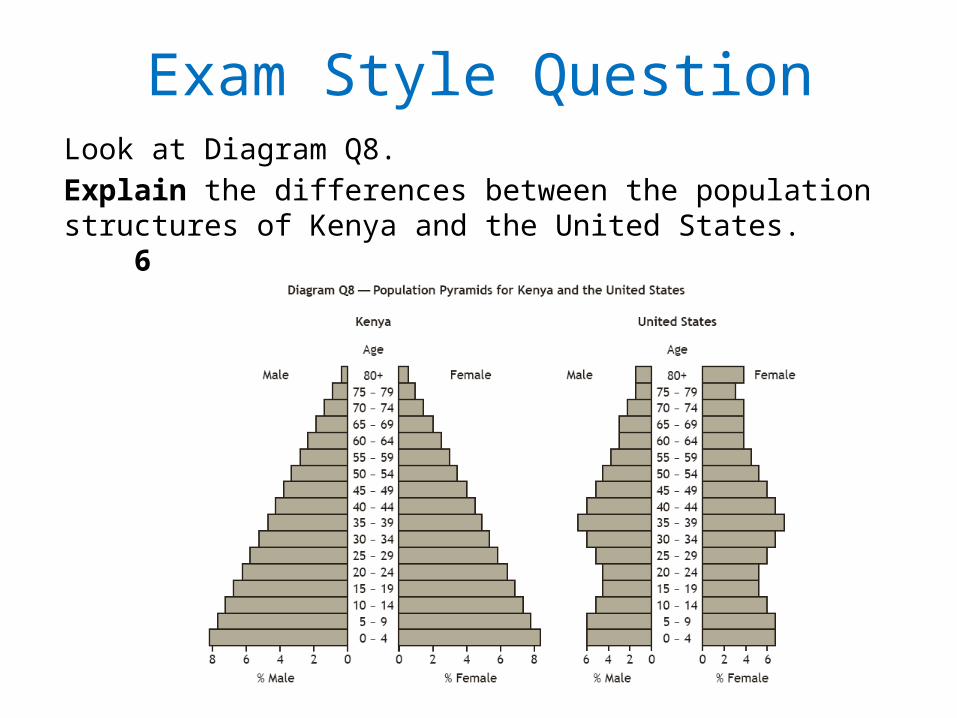
Exam Style QuestionLook at Diagram Q8.Explain the differences between the population structures of Kenya and the United States. 6
ANSWERThere is a higher proportion of the population of Kenya under the age of 15 because birth rates are higher in developing countries (1) where fewer women get the chance of an education (1) and there is less use of contraception (1) and information on birth control is less easily accessed (1). There is a larger number of over 60s in the USA because more people have the chance of medical treatment than in Kenya where there is less money to set up health centres and hospitals (2). The high living standards in the USA mean that there are plenty of opportunities for women to have careers and this reduces birth rates (1). Child mortality rates are higher in Kenya so people have many children in order to ensure that some survive (1). Many families in Kenya have lots of children so they can contribute to the family income when old enough and look after them in old age (2).