Embed Size (px)
Citation preview
P O P U L A T I O N R E F E R E N C E B U R E A U
REPORTS ONAMERICAMarch 2004 Vol. 4 No. 1
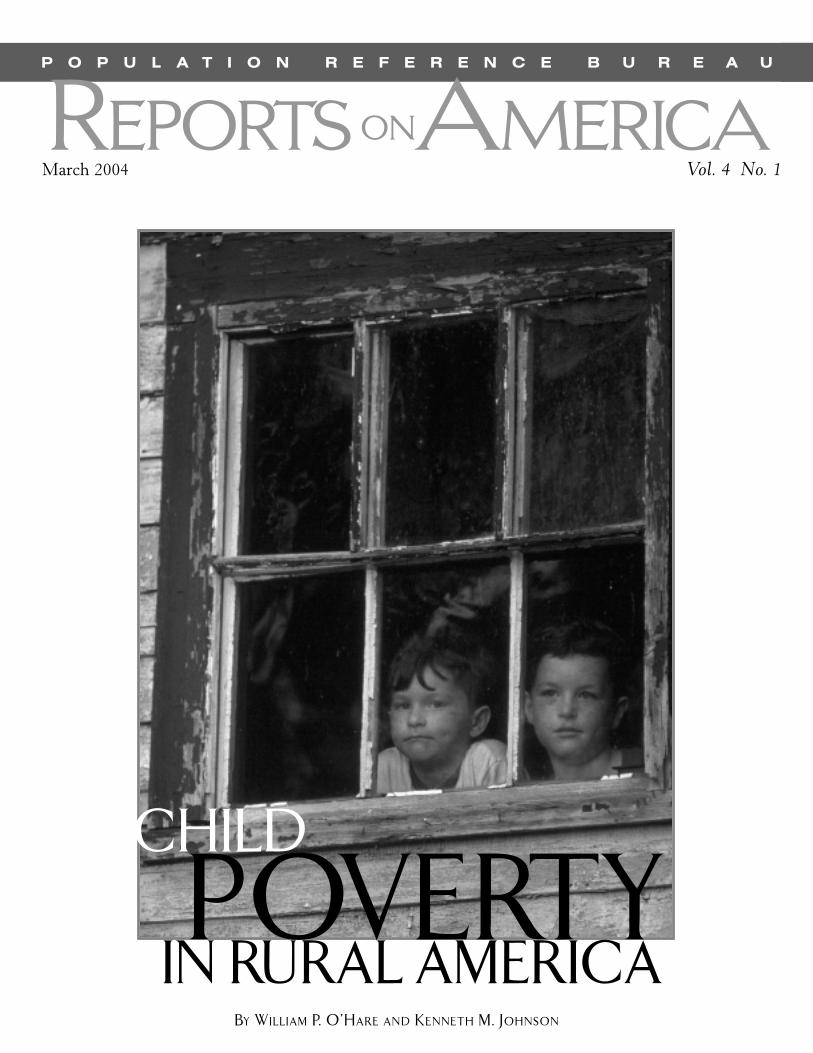
CHILD
POVERTYIN RURAL AMERICA
BY WILLIAM P. O’HARE AND KENNETH M. JOHNSON

1
PRB REPORTS ON AMERICA
is published by the PopulationReference Bureau, in Washington,D.C. PRB is the leader in providingtimely and objective information onU.S. and international populationtrends and their implications.
© Copyright 2004 Population Reference BureauWashington, DC. ISSN 1522-8304
William P. ButzPresident
Ellen CarnevaleDirector of Communications
John HaagaDirector of Domestic Programs
Sharon Hershey Fay Design/production
Cover photo by Frank Siteman, IndexStock
EDITORIAL ANDCIRCULATION OFFICES
Population Reference Bureau1875 Connecticut Ave., NW, Suite 520Washington, DC 20009Phone: 202-483-1100Fax: 202-328-3937E-mail: [email protected] Website: www.prb.org
Reprint PermissionFor permission to photocopy or reprintportions of this report, please contactPRB.
Address ChangesContact PRB to change address or to beadded to the mailing list.
FRIENDS OF PRBThis year, during our 75th Anniversary,we have created a special group ofsupporters called Friends of PRB. Friendsreceive a wide range of specialized infor-mation not available elsewhere. Friendshelp support the analysis and dissemina-tion of much-needed information tojournalists, policy audiences, and decision-makers around the world.
Categories: Individual, $49; Educator,$39; Student/people 65+, $34;Library/Nonprofit: $64; and Friend ofPRB for Life, $5,000.
To become a Friend of PRB, call PRB(800-877-9881) or visit our website,www.prb.org.
TABLE OF CONTENTS
INTRODUCTION .................................................................................1
THE CHANGING DISTRIBUTION OF AMERICAN CHILDREN.................2What Do We Mean by Rural?.....................................................2Figure 1: In nearly half of the rural counties, the
number of children under 18 actually decreased between 1990 and 2000 ........................................................3
Immigration, Race, and Hispanic Origin .....................................4Figure 2: For the last five decades, many young adults
have left rural areas for education, employment, and social opportunities in urban areas........................................5
CHILD POVERTY IN RURAL AREAS.....................................................6Figure 3: The child poverty rate in rural America remains
significantly higher than in urban areas ................................6Figure 4: Since 1972, child poverty rates have exceeded
those for older Americans.....................................................7Figure 5: Rural child poverty rates in 1999 were highest
in Appalachia, the Great Plains, the Rio Grande Valley, and the Southern Black Belt .................................................8
State Patterns ..............................................................................9Table 1: Child poverty rates are higher in rural areas
for every racial and ethnic group except for Asian Americans ..................................................................9
Table 2: More than 25 percent of children living in rural Alabama, Arizona, Kentucky, Louisiana, Mississippi, New Mexico, and West Virginia are poor ...........................10
Family Structure .......................................................................11
RURAL COUNTIES WITH HIGH POVERTY RATES ..............................12
LINKING WORK, EDUCATION, AND WELFARE .................................14The Rural Roots of Antipoverty Efforts ....................................14Table 3: In rural America, 27 percent of children live in
low-income working families, compared with only 21 percent in metropolitan areas .........................................15
Underemployment ....................................................................15Welfare Benefits ........................................................................16Programs for Low-Income Families With Children ...................17
POLICY CONSIDERATIONS ................................................................18The Future of Rural America....................................................19
Additional Reading .........................................................................20

This report explores the well-being of the 14million children who live in rural America.Rural families represent a significant share
of our total population and they are disproportion-ately poor, less educated, and underemployed. Yetpoor children and the unique challenges they faceare often overlooked by policymakers. Poor childrenliving in rural America face significant educational,social, and economic challenges just as their urbancounterparts do, but many of these problems areexacerbated by the isolation and limited access tosupport services common in rural areas.
Historically rural America was linked to familyfarming, but today less than 5 percent of the rurallabor force works on farms, whether family- orcorporate-owned, and consolidation continues todiminish this percentage. The farm economyremains extremely important in some regions, butoverall there are more rural workers in manufac-turing jobs (19 percent), retail trade (14 percent),and professional services (24 percent) than infarming (4 percent).
Just as the rural economy has changed, so toohas the rural family. Urban families are now largerthan their rural counterparts. Data from the 2000Census show the average family size inside metro-politan areas was 3.2 persons compared with 3.0outside metropolitan areas. Two importantdemographic forces account for this transformation.First, fertility rates in rural areas have declined, andrural women now have about the same number ofchildren as urban women. Second, the rural popula-tion is now considerably older on average than theurban population. The median age in 2000 was 37.2in nonmetropolitan America, compared with 34.9 in
the nation’s metropolitan areas. Rural areas alsohave a higher proportion of people ages 65 andolder (15 percent), compared with urban areas (12percent). Family size in rural areas has decreasedbecause a growing share of rural households areheaded by older Americans, who are less likely tohave children in the household.
We hope that this PRB Reports on America willrevise many outdated yet still popular images ofrural family life. Because our understanding of thenation’s children is primarily informed by nationaldata, our assumptions are heavily influenced by the58 million children residing in urban areas. Thisreport provides a fresh perspective by offering acomprehensive profile of rural children. We useseveral widely accepted measures of child well-being to examine the similarities and differencesbetween rural and urban children.
1
P R B R E P O R T S O N A M E R I C A
BY WILLIAM P. O’HAREANNIE E. CASEY FOUNDATION
AND KENNETH M. JOHNSONLOYOLA UNIVERSITY-CHICAGO
CHILDPOVERTYIN RURAL AMERICA
William P. O’Hare is a social demographer whodirects the KIDS COUNT project at the Annie E.Casey Foundation in Baltimore. His research andwriting focus on disadvantaged children and theirfamilies. He is the author of “The Rise of Poverty inRural America” and many other working papers onrural poverty and rural youth, and of PopulationBulletins including “A New Look at Poverty inAmerica.” Kenneth M. Johnson is a demographerand professor of sociology at Loyola University-Chicago. He has written extensively on populationredistribution, nonmetropolitan demographic trends,and migration. He is the author of the PRB Reports onAmerica “The Rural Rebound.” His research issupported by grants from the U.S. Forest Service andthe U.S. Department of Agriculture.

The last half of the 20thcentury saw a majordecline in the proportion
of kids living in rural America. In1950, nearly a third (32 percent)of all children in the United Stateslived in counties that are currentlydefined as nonmetropolitan. By2000, however, only 19 percent ofthe nation’s children resided inrural areas. In fact, while the totalnumber of children in the UnitedStates grew from 48 million in1950 to 72 million in 2000, thenumber of children residing inrural areas actually diminishedfrom 15.3 million in 1950 to 14million today. (In this report, we
use standardized categories ofurban and rural areas so thattrends are not affected by defini-tional changes.)
For most of the last century,many more people moved fromrural areas to cities than fromurban to rural. This migrationwas spurred, in part, by themechanization of agriculture thatreduced the need for farm labor(including the many children whoused to work on farms). At thesame time, people were being“pulled” to urban areas by theemergence of economic andemployment opportunities in theexpanding cities. As a result,
millions of young adults migratedfrom rural to urban areas, takingwith them much of the potentialto produce the next generation ofrural children. In addition, fewimmigrants to the United Stateshave settled in rural areas. Thecontinuing loss of so many youngadults of childbearing age,coupled with low levels offertility among rural women,eventually reduced the number ofrural births relative to births inurban areas.
Census figures show thatthese shifts in the child popula-tion from rural to urban areas arecontinuing. Between 1990 and2000, the number of children inthe United States increased by 14percent, but almost all the gainoccurred in urban areas. Thenumber of children living insidemetropolitan areas increased by16 percent, while the number ofkids in nonmetro areas increasedby only 4 percent.
State figures tell the samestory. Forty-five states experi-enced increases in the number ofchildren between 1990 and 2000,but little of this statewide growthin the child population occurredin rural places. The rural childpopulation increased in only 14states. Sixteen states experienced adecline of more than 10 percent inthe number of rural children.Rural children outnumberedurban children in only 12 states in2000 (down from 15 in 1990).
THE CHANGING
DISTRIBUTION OF AMERICAN CHILDREN
P R B R E P O R T S O N A M E R I C A
2
The terms “rural” and “nonmetropolitan” and the terms “urban”and “metropolitan” are used interchangeably in this report. Thepopulation living inside metropolitan areas includes people whoreside in large cities and their suburbs, while the nonmetropolitanpopulation resides in small cities and the open countryside. Somerural areas are located just beyond the urban fringe while othersare many miles from the closest city.
We used 1999 metropolitan/nonmetropolitan distinctions inthis study, not the new Core Based Statistical Area classificationsystem announced by the Office of Management and Budget inJune 2003. The Current Population Survey, which was used toproduce many of the estimates in this report, will continue toreport data using the 1999 classification system for the next fewyears.
For more information about metropolitan area definitions,visit the Census Bureau’s website at: www.census.gov/population/www/estimates/metroarea.html.
WHAT DO WE MEAN BY RURAL?

A detailed picture of changesin rural America can be gleanedby examining the nation’s 3,100counties (see Figure 1). In nearlyhalf of the rural counties (1,123out of 2,294), the number ofchildren under age 18 actuallydecreased between 1990 and2000. This map highlights thecumulative impact of this ruralbirth dearth in nearly every ruralcounty in a band from NorthDakota to western Texas.
Even among rural countiesthat gained adults during the1990s, many lost children. Of the1,692 rural counties that gained intotal population between 1990and 2000, there were 533 countieswhere the number of childrenunder age 18 decreased. Many ofthe rural counties that did gain
children during the 1990s areadjacent to metro areas and werereclassified as metropolitan whenmetropolitan definitions wereupdated in 2003. In two-thirds ofthe most rural counties (those notadjacent to metropolitan areas),the number of children fell.
Despite the population lossesin many rural counties, especiallyin the number of children, ruralAmerica as a whole enjoyed asignificant demographic reboundduring the 1990s. Nonmetropoli-tan America grew by nearly 5.3million people between 1990 and2000. Most of this growth (3.5million) came from a net migra-tion gain. This gain was fueled byan influx of people from thenation’s metropolitan areas, andby fewer people leaving rural
areas for cities. A modest numberof immigrants also settled in ruralareas during the 1990s.
Historically such an influx torural areas is unusual. It hashappened only twice in the last 75years. The reasons for this ruralrebound are complex but includeimproved transportation andcommunications systems, urbansprawl, and the rising appeal ofrecreational and retirement areas.Data show that most people whoreside in rural areas would like tostay there, and a significantnumber of urban residents wouldactually prefer to live in smallerplaces. (see Kenneth Johnson,“The Rural Rebound”).
Because fertility levels arerelatively low and do not varymuch across the country, migra-
P R B R E P O R T S O N A M E R I C A
3
IN NEARLY HALF OF THE RURAL COUNTIES, THE NUMBER OF CHILDREN UNDER 18 ACTUALLY DECREASED BETWEEN 1990 AND 2000.
Figure 1
Source: Population Reference Bureau analysis of 1990 and 2000 Census data.

tion now plays a critical role infuture demographic trends inrural America. As a result of therural rebound, nonmetropolitanareas actually gained childrenbetween 1990 and 2000 throughmigration. Had it not been for thisinflux, the number of children inrural America would have dimin-ished between 1990 and 2000.
Offsetting the flow ofchildren and their 30-somethingparents into rural areas were thecontinued significant losses ofyounger adults (ages 20 to 30)between 1990 and 2000 (seeFigure 2). As they have for the lastfive decades, many young adultsleft rural areas for educational,employment, and social opportu-nities in metropolitan areas. Theloss of young adults from ruralAmerica during the 1990s wasmodest by historical standards,but there were still many feweryoung adults in rural areas in 2000than there would have been hadno net outmigration of youngadults occurred. Some youngadults will eventually return toraise their families, but most willnot. The continued outflow ofyoung adults from rural areasmeans the number of rural birthswill likely diminish. In addition,the loss of so many young adultsrepresents a significant loss ofhuman capital. For decades, ruralAmerica has invested heavily inthe care, upbringing and educa-tion of its children, only to seemany depart as they make thetransition to adulthood.
IMMIGRATION,RACE, ANDHISPANICORIGIN
While international migra-tion was a major source of
population growth for the countryas a whole during the 1990s, suchimmigration accounted for little ofthe increase in rural population.The 14.2 million children whohave at least one foreign-born par-ent accounted for 20 percent of allchildren in 2002 and represent a78 percent increase in this popula-tion since 1990. Yet very little ofthis increase occurred in ruralareas. In 2002, only about 7 per-cent of immigrant children (thosewho are foreign-born or have atleast one foreign-born parent)resided in rural areas.
Since migrants from LatinAmerica account for a large shareof international immigrants to theUnited States, the flow of interna-tional migrants has dramaticallyincreased the U.S. Latino popula-tion. Hispanics still represent asmall proportion of the non-metropolitan population (5.5percent), but they accounted fornearly 25 percent of the non-metropolitan population growthduring the 1990s. Among all themajor racial and ethnic groups,only Hispanics experienced asubstantial influx of young adultsto nonmetropolitan areas duringthe 1990s.
Some Hispanics move to takeadvantage of job openings in meatand poultry plants that haveopened in rural communities;others work in agriculture; stillothers are employed in ruralmanufacturing plants, in thebuilding trades, or in the growingservice industry. A continuation
of this trend will have significantimplications for the ethnic mix ofrural children in the future.
Some Hispanics moved torural America directly fromforeign countries, while manyothers moved there from otherareas of the United States. TheHispanic population is not evenlydistributed across rural America.Hispanics have traditionally beenclustered in the Southwest, butthe 2000 Census reveals thatsignificant Hispanic populationgains occurred in rural areas ofthe Midwest and Southeast duringthe 1990s.
The influx of Hispanicfamilies and children to histori-cally all-white rural communitiescreates a number of challenges.Rural schools with limitedbudgets must implement English-as-a-Second-Language programsand hire bilingual teachers; police,fire, and medical staffs mustcommunicate with clients withlimited English in tense emer-gency situations; and churches,retailers, and government agenciesmust adjust to people withdifferent tastes, lifestyles, andneeds.
An influx of young Hispanicfamilies offers a number of oppor-tunities as well, particularly forcommunities that have seengeneration after generation ofyoung people leave. Thenewcomers contribute to the localeconomy and bring new energyand vitality to communities andlocal institutions that have knownonly population loss and outmi-gration for decades.
While the number ofHispanics in nonmetropolitanAmerica increased substantiallyduring the last decade, AfricanAmericans remain the largestracial minority group in ruralAmerica. The 4.9 million AfricanAmericans there represent 9percent of the total rural popula-
P R B R E P O R T S O N A M E R I C A
4

tion. Almost 1.5 million blackchildren account for 11 percent ofall rural kids. The AfricanAmerican population residing inrural America is heavily concen-trated in the South. Blacks makeup 22 percent of the child popula-tion in the rural South and areheavily represented in the DeepSouth (including Alabama,Georgia, Louisiana, Mississippi,and South Carolina,) where thereis a concentration of persistentlypoor rural counties. The growthof the rural black population wasmodest (12 percent) during the1990s and depended more on
natural increase (the excess ofbirths over deaths) than on migra-tion. However, even a modest netinflow of blacks to rural areasreflects changing U.S. populationtrends. For most of the lastcentury, a substantial number ofblacks—especially young adults—left rural areas (mostly in theSouth) for greater economic,social, and political opportunitiesin metropolitan areas.
The American Indian popu-lation represents between 2percent and 3 percent of thenonmetropolitan total dependingon how the racial group is defined
(alone or in combination with oneor more other racial groups).Although American Indiansrepresent a modest share of therural population, they arespatially concentrated in a limitednumber of areas. In such areas,they are often the majority ornear-majority of the population.The Asian population accountsfor an additional 1 percent of therural total.
Minority population dyna-mics have particular relevance toour study of rural populationchange. Although the minoritypopulation represents only about17 percent of the nonmetropolitantotal, minorities accounted for 23percent of the births but for lessthan 12 percent of the ruraldeaths in the 1990s. This isbecause the minority population isconsiderably younger than thenon-Hispanic white rural major-ity. Thus, a much larger propor-tion of the minority population isin their prime childbearing agesand a much smaller proportion ofthe minority population is olderand at high risk of dying. Ruralminorities also tend to have higherbirth rates than the rural, non-Hispanic white population. Thenet result is that a rising propor-tion of all rural children will comefrom minority families. The 2000Census shows that racial andHispanic minorities accounted for24 percent of children in ruralAmerica, compared with 16percent of adults.
P R B R E P O R T S O N A M E R I C A
5
FOR THE LAST FIVE DECADES, MANY YOUNG ADULTSHAVE LEFT RURAL AREAS FOR EDUCATION, EMPLOYMENT,
AND SOCIAL OPPORTUNITIES IN URBAN AREAS.
Figure 2
-50
-40
-30
-20
-10
0
10
20
30
0-4
5-9
10-1
4
20-2
4
Age
Long term loss of young adults
Influx of children and parents in 1990s
Migration rate
15-1
9
25-2
930
-34
35-3
9
60-6
465
-69
70-7
475
+
40-4
445
-49
50-5
455
-59
1950s 1960s 1970s 1980s 1990s
Source: Kenneth M. Johnson et al., “Recent Age-Specific Net Migration Patternsin the United States” (2003).

P R B R E P O R T S O N A M E R I C A
6
The child poverty rate—the percentage ofchildren living in families
with incomes below the officialpoverty line (about $18,000 peryear for a family of four)—isprobably the most widely usedindicator of child well-being.
At the end of the 1990s, oneof the most prosperous decades inour country’s history, one of everyfive rural children was living in afamily with income below theofficial poverty line. In raw
numbers, that amounts to morethan 2.6 million rural children.Millions more live just above thepoverty line in families strugglingto make ends meet. For example,in rural America 6.1 millionchildren are living in low-incomefamilies defined as having incomebelow 200 percent of poverty.
In recent decades, ruralpoverty has been overshadowed bythe plight of impoverished familiesliving in disadvantaged urbanneighborhoods. For example, there
has been little attention paid to thespecial circumstances of the ruralpoor during the recent nationaldiscussions about the reauthoriza-tion of the federal welfare reformlegislation. A review of more than1,400 newspaper articles on federalwelfare reform in major papersduring the early part of 2002 foundthat not a single story dealt withwelfare issues in rural areas. Thislack of attention is particularlyvexing since many of the barriersto moving from welfare to work,such as lack of transportation andchild care services, are biggerproblems in rural areas than urbanareas.
Though little public attentionhas focused on the plight of therural poor, statistics indicate thatrural poverty is very serious. The2000 Census provides a starkpicture of child poverty in ruralAmerica, showing that of the 50counties with the highest childpoverty rates, 48 are located inrural America.
Rural areas have historicallyhad higher child poverty ratesthan metropolitan areas, but therural-urban gap grew significantlyduring the late 1990s. As illus-trated in Figure 3, in 1994 the gapbetween child poverty in urbanand rural areas was only 1percentage point (22 percent inurban areas versus 23 percent inrural areas), but by 2001 the gaphad widened to 5 percentagepoints (15 percent in urban areas
CHILD POVERTYIN RURAL AREAS
1985 200019951990
Year
Metropolitan
Nonmetropolitan
Percent
15
20
25
30
THE CHILD POVERTY RATE IN RURAL AMERICA REMAINSSIGNIFICANTLY HIGHER THAN IN URBAN AMERICA.
Figure 3
Note: Child poverty rates are based on related children under 18.Sources: Economic Research Service, U.S. Department of Agriculture, analysis ofdata from the U.S. Census Bureau, Current Population Survey (March supple-ment), 1986 through 2001 (www.ers.usda.gov/Briefing/IncomePovertyWelfare/ChildPoverty/); and Population Reference Bureau analysis of data fromthe U.S. Census Bureau, Current Population Survey (March supplement), 2002through 2003.

compared with 20 percent in ruralareas). Figures for 2002 (the latestavailable) show the child povertyrate in rural America (20 percent)remains significantly higher thanin urban America (16 percent).Because of their isolation, poorrural kids may actually be moredisadvantaged in some ways thanpoor kids in urban areas. In fact,poverty rates in rural areas arehighest in counties most remotefrom, and lowest in countiesadjacent to, metropolitan areas.
Clearly, the economic boom ofthe late 1990s benefited urbanfamilies more than rural familiesbecause economic gains weregreatest in sectors of the economythat were concentrated in metro-politan areas (finance, real estate,and high technology) and thepoverty gap between rural andurban children widened duringthis period.
Metropolitan areas includeboth central cities and suburbs.In 1999, the child poverty rate incentral cities (24 percent) wasmuch higher than in suburbs(11 percent).
Child poverty rates in centralcities (24 percent) are higher thanin rural areas (20 percent), butthis is largely a compositionaleffect. African Americans andHispanics, two groups with veryhigh poverty rates, are morehighly concentrated in centralcities than in rural areas. For everyracial and ethnic group, childpoverty rates are actually higher innonmetro areas than in centralcities. If central cities had thesame racial and ethnic composi-tion as the nonmetro population,the child poverty rate would be 16percent rather than 24 percent.
In both urban and ruralAmerica, the risk of poverty isgreater for children than for anyother age group. In 2002, the ruralchild poverty rate was 20 percent,compared with 13 percent for the
working-age population (18 to 64)and 12 percent for the elderlypopulation (ages 65 and older). Inurban America, the child povertyrate was 15 percent, comparedwith 10 percent for working-ageadults and 9 percent for urbanelderly.
Yet historically, children wereless likely to live in poverty thanthe elderly. As recently as 1973,elderly poverty rates exceededthose of children (see Figure 4).Since then, child poverty rateshave exceeded those for olderAmericans. Why has the nationbeen so successful at diminishingthe risk of poverty for its elderlyand failed at doing so for children?
The sharp reduction inpoverty for people 65 and older isone of the great American socialpolicy triumphs of the 20thcentury. Social Security, Medicare,and federal initiatives toencourage retirement savings andregulate the pension system,together with an expansion of
private pensions, dramaticallyimproved the financial security ofolder Americans. Dependence onwages makes rural children morevulnerable than the rural elderly,who get by on pensions, SocialSecurity, and Medicare. Whilechild poverty fell by 12 percentbetween 1990 and 2001, thepoverty rate among older people(ages 65 and over) in rural areasfell by 24 percent. The remark-able success of these policiesoffers hope that Americans willfind the public will to tackle theplight of America’s children withthe same resolve they apply toissues affecting older Americans.
In many ways the rural poorare more diverse than the poor inbig cities. This fact is reflected inthe imagery often associated withthe urban and rural poor. Formost people the term “urbanpoverty” conjures a mental imageof minority families living indisadvantaged inner city neigh-borhoods. In contrast, rural
P R B R E P O R T S O N A M E R I C A
7
Percent
18 to 64 years
65 years and over
Under 18 years
Year
1965 1970 1975 1980 1985 1990 1995 200219590
5
10
15
20
25
30
35
40
SINCE 1974, CHILD POVERTY RATES HAVE EXCEEDEDTHOSE FOR OLDER AMERICANS.
Figure 4
Notes: The data points represent the midpoints of the respective years. Data forpeople 18 to 64 and 65 and older are not available from 1960 to 1965.Source: U.S. Census Bureau, Current Population Survey, 1960-2003 AnnualSocial and Economic Supplements.
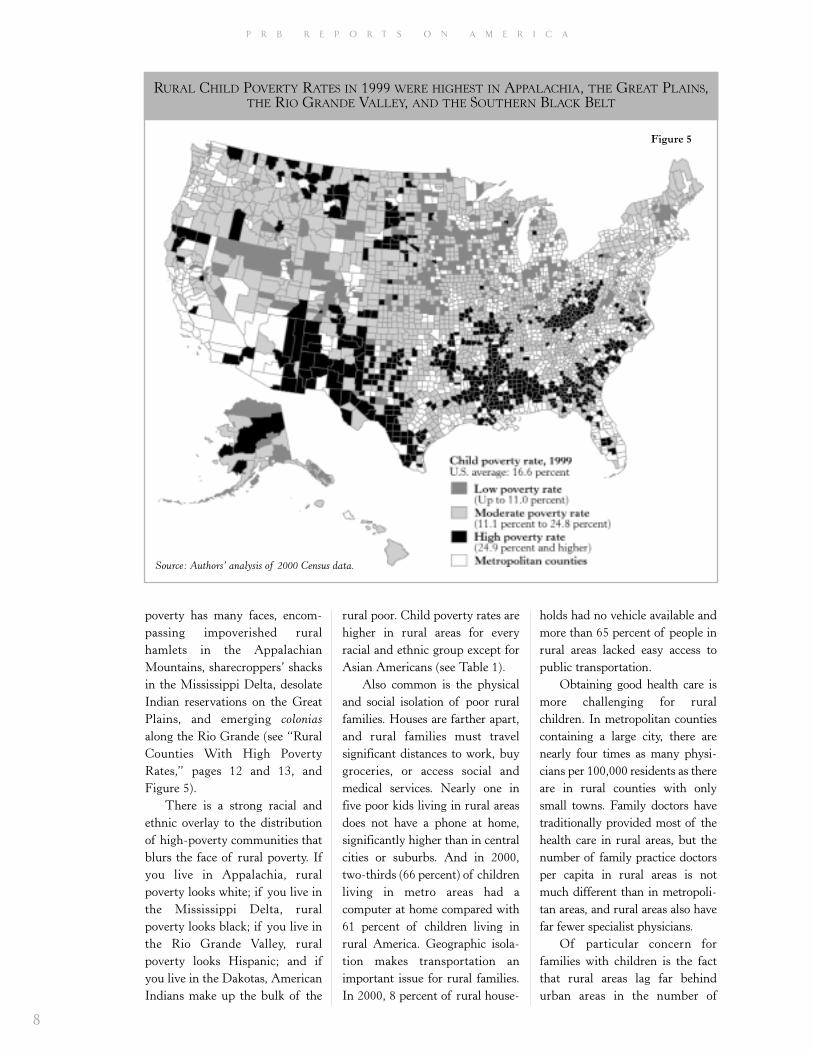
poverty has many faces, encom-passing impoverished ruralhamlets in the AppalachianMountains, sharecroppers’ shacksin the Mississippi Delta, desolateIndian reservations on the GreatPlains, and emerging coloniasalong the Rio Grande (see “RuralCounties With High PovertyRates,” pages 12 and 13, andFigure 5).
There is a strong racial andethnic overlay to the distributionof high-poverty communities thatblurs the face of rural poverty. Ifyou live in Appalachia, ruralpoverty looks white; if you live inthe Mississippi Delta, ruralpoverty looks black; if you live inthe Rio Grande Valley, ruralpoverty looks Hispanic; and ifyou live in the Dakotas, AmericanIndians make up the bulk of the
rural poor. Child poverty rates arehigher in rural areas for everyracial and ethnic group except forAsian Americans (see Table 1).
Also common is the physicaland social isolation of poor ruralfamilies. Houses are farther apart,and rural families must travelsignificant distances to work, buygroceries, or access social andmedical services. Nearly one infive poor kids living in rural areasdoes not have a phone at home,significantly higher than in centralcities or suburbs. And in 2000,two-thirds (66 percent) of childrenliving in metro areas had acomputer at home compared with61 percent of children living inrural America. Geographic isola-tion makes transportation animportant issue for rural families.In 2000, 8 percent of rural house-
holds had no vehicle available andmore than 65 percent of people inrural areas lacked easy access topublic transportation.
Obtaining good health care ismore challenging for ruralchildren. In metropolitan countiescontaining a large city, there arenearly four times as many physi-cians per 100,000 residents as thereare in rural counties with onlysmall towns. Family doctors havetraditionally provided most of thehealth care in rural areas, but thenumber of family practice doctorsper capita in rural areas is notmuch different than in metropoli-tan areas, and rural areas also havefar fewer specialist physicians.
Of particular concern forfamilies with children is the factthat rural areas lag far behindurban areas in the number of
P R B R E P O R T S O N A M E R I C A
8
RURAL CHILD POVERTY RATES IN 1999 WERE HIGHEST IN APPALACHIA, THE GREAT PLAINS,THE RIO GRANDE VALLEY, AND THE SOUTHERN BLACK BELT
Figure 5
Source: Authors’ analysis of 2000 Census data.

obstetricians and pediatriciansavailable to care for children in thefirst critical years of life. Forexample, there are six times asmany pediatricians per 100,000people in large cities as there arein small rural counties. Ruralareas also have far fewer specialistphysicians—only 32 specialistsper 100,000 people comparedwith 189 per 100,000 in metrocounties with large cities. Therelative dearth of health careprofessionals in rural areas isexacerbated by the long distancesrural residents often have to travelto get to a health facility.
Differences in the level ofhealth care insurance coverage donot explain the uneven distribu-tion of physicians. Nonmetrochildren are as likely to havehealth care insurance as theirmetropolitan counterparts. Ap-proximately 88 percent of eachgroup of children has somecoverage. However, urban kids aremore likely to be covered byprivate insurance (77 percentcompared with 72 percent), whilerural children are more likely to becovered through public programssuch as Medicaid. Health insur-ance through employers is gener-ally better than that in the publicsector because it is accepted morewidely and provides morebenefits.
STATEPATTERNS
The 2000 Census provides thebest state-by-state data on
rural child poverty. Rural childpoverty rates range from a low of7 percent in Connecticut to a highof 31 percent in Louisiana(see Table 2, page 10). There areseven states—Alabama, Arizona,Kentucky, Louisiana, Mississippi,
New Mexico, and WestVirginia—where more than 25percent of children living in ruralareas are poor.
Rural poverty rates generallyreflect the overall economic situa-tion in a state, but it is worthnoting that several states withsimilar statewide economicresources have quite differentlevels of rural child poverty. Forexample, the 1999 per capitaincome in Iowa and Texas arealmost identical ($19,674 in Iowaand $19,617 in Texas), but thechild poverty rate in rural Texas(25 percent) is more than twice ashigh as in Iowa (11 percent). Thesituation is similar in Alabamaand Utah. They have virtuallyidentical per capita incomefigures, but the rural child povertyrate in Alabama is twice that inUtah.
While a rigorous analysis ofwhy the rural child poverty ratesdiffer in states like Texas and Iowais beyond the scope of this study,some factors that might helpexplain state differences areobvious. First, the per capita
income figure does not reflect howdispersed or different incomes arein a state. A state that has a highdegree of income inequality—a lotof rich families and a lot of poorfamilies—could have the same percapita income as a state wheremost families have incomes closeto the state average. Research hasshown that states with high levelsof income inequality tend to havehigher child poverty rates.Sociocultural differences acrossstates may also play a role in deter-mining child poverty levels. Forexample, the 2000 Census showsthat 26 percent of kids in Alabamalived in single-parent families,compared with only 14 percent inUtah. Demographic trends such asthe influx of immigrants into ruralTexas and the large concentrationof minority children in some statesalso make a difference. Some statesmay have policies more favorableto rural areas.
Between 1989 and 1999, 38states saw rural child poverty ratesfall, only 11 saw an increase, andone was unchanged. In fivestates—Colorado, Michigan, Min-
Table 1
Race/Ethnicity U.S. Metro Nonmetro
All children 17 16 19
Black Alone 33 32 42
American Indian Alone 32 27 36
Asian Alone 14 14 14
Native Hawaiian and Other Pacific Islander Alone 23 22 26
Some other race Alone 30 30 33
Two or more races 20 19 24
Hispanic 28 27 32
Non-Hispanic white 9 8 14
Note: Data for specific racial groups include people who selected only one race.People of Hispanic origin can be of any race.Source: Population Reference Bureau analysis of data from the 2000 Census.
P R B R E P O R T S O N A M E R I C A
9
CHILD POVERTY RATES ARE HIGHER IN RURAL AREASFOR EVERY RACIAL AND ETHNIC GROUP
EXCEPT FOR ASIAN AMERICANS.

P R B R E P O R T S O N A M E R I C A
10
MORE THAN 25 PERCENT OF CHILDREN LIVING IN RURAL ALABAMA, ARIZONA, KENTUCKY,LOUISIANA, MISSISSIPPI, NEW MEXICO, AND WEST VIRGINIA ARE POOR.
Table 2 Rank by nonmetro child poverty rate, 1999
Metro Nonmetro Below Percent Below Percent
State poverty below poverty poverty below poverty
U.S. 9,102,806 15.9 2,644,052 19.21 Connecticut 83,572 10.5 2,336 6.72 New Hampshire 13,509 7.2 10,126 8.83 Wisconsin 106,928 11.6 43,238 10.24 Massachusetts 171,729 12.1 5,654 10.35 Iowa 35,474 10.8 43,773 11.26 Minnesota 80,425 8.9 41,266 11.37 Indiana 138,166 12.4 49,635 11.68 Rhode Island 39,494 17.2 1,668 12.09 Nevada 61,676 14.2 8,101 12.310 Vermont 3,351 8.4 13,244 12.611 Ohio 335,451 14.6 73,234 13.411 Utah 48,874 9.1 22,891 13.413 Alaska 6,861 9.3 15,180 13.513 Michigan 295,408 13.9 57,527 13.513 Nebraska 26,185 11.3 28,292 13.516 Kansas 41,714 10.3 42,243 14.217 Colorado 97,508 10.7 24,106 14.418 Wyoming 5,342 14.4 12,873 14.519 Illinois 392,811 14.3 64,090 14.720 Maryland 128,241 10.3 13,636 14.921 Pennsylvania 356,642 14.6 65,103 15.022 Maine 11,850 11.2 28,321 15.123 Delaware 18,132 11.6 5,273 15.324 Idaho 17,174 12.1 34,694 15.725 North Dakota 6,935 10.2 15,228 16.826 Hawaii 26,155 12.9 14,387 16.927 Virginia 152,639 11.1 56,893 17.028 New York 855,023 20.2 60,687 17.329 Oregon 81,927 13.6 39,533 17.830 Tennessee 163,527 17.2 83,870 19.730 Washington 153,559 12.5 49,332 19.732 Missouri 131,708 13.7 88,848 20.332 South Dakota 7,633 11.2 26,332 20.334 Montana 12,106 16.2 30,806 20.435 North Carolina 183,050 13.9 128,003 20.636 California 1,694,579 19.4 62,521 22.137 Florida 572,995 17.2 55,002 22.738 Oklahoma 94,768 17.6 77,161 22.939 Georgia 215,139 14.5 150,267 23.140 South Carolina 114,786 16.6 72,489 23.841 Arkansas 64,613 19.1 81,708 24.642 Texas 984,169 19.8 205,766 24.943 Kentucky 75,764 15.8 127,783 25.644 Alabama 150,771 19.4 87,110 26.245 West Virginia 33,119 19.7 62,977 27.746 Arizona 208,367 17.8 49,343 29.547 New Mexico 56,609 20.9 68,609 29.948 Mississippi 56,074 20.6 150,376 30.649 Louisiana 227,153 25.1 92,517 31.2NA District of Columbia 35,367 31.7 N/A N/ANA New Jersey 227,754 11.1 N/A N/A
N/A = Not applicable.Source: Population Reference Bureau analysis of data from the 2000 Census.

nesota, Ohio, and Wisconsin—therural child poverty rate fell bymore than 25 percent during thedecade. The economic rebound ofthe Great Lakes region may havecontributed to the decline ofpoverty among children in ruralareas of Michigan, Minnesota,Ohio, and Wisconsin. Continuedsprawl of midwestern metros,bringing relatively well-to-dofamilies into previously ruralareas, may also be responsible forlowering child poverty rates there.
FAMILYSTRUCTURE
The structure of rural familiesis another factor that has sig-
nificant implications for childpoverty. In both rural and urbanareas, the poverty rate for childrengrowing up in a married-couplefamily is one-fourth the rate ofthose growing up in single-parentfamilies. However, in both types offamilies child poverty is higher inrural America. In 2002, 43 percentof rural kids in female-headedfamilies were poor, compared with34 percent of those in female-headed families in metro areas.
The structure of Americanfamilies has been changing overthe past several decades in bothrural and urban areas, and these
family changes have importantimplications for the incidence ofchild poverty. Research bydemographer Daniel Lichter andcolleagues provides importantnew information about how thechanging structure of ruralfamilies has affected the incidenceof rural child poverty. Inattempting to account for dimin-ishing levels of rural child povertyin the 1990s, Lichter noted thatthe growth in the number ofsingle-parent households (those atthe greatest risk of having poorchildren) slowed during the1990s. He also found that morerural single mothers wereworking, and at higher averageincomes than in prior years. Thesetrends have contributed todeclining levels of child povertyrates in rural areas. However,there has also been a significantdrop in the proportion of ruralchildren residing in two-parenthouseholds (the type least likely tobe poor) over the past severaldecades. This temporal decline inthe proportion of rural childrenresiding in two-parent householdsclosely mirrors the nationaldecline and, as a result, theproportion of rural kids in two-parent households is now onlyslightly above the nationalaverage.
A particular concern ofLichter and his colleagues is theimpact of unwed childbearing on
young rural women. Although theproportion of rural and urbanwomen who have nonmaritalbirths is quite similar, ruralwomen have unwed births at anearlier age than their urbancounterparts. Such early births area major concern because they havea significant impact on the futureof both the mother and herchildren. Early premarital child-bearing cuts short the educationof the mother, reduces the likeli-hood that the mother will experi-ence an enduring marriage, andincreases the likelihood ofmaternal and child poverty. Earlyunwed births are an importantfactor in the intergenerationalpersistence of poverty common insome areas of rural America.
Fortunately, unwed teenagebirths declined precipitously inthe 1990s, but the continuingdisparity between the incidence ofteenage births in rural and urbanareas remains a serious concern.The importance of family forma-tion can be illustrated by thefollowing stark comparison.i Thepoverty rate for children born to ateenage mother who has nevermarried and who did not graduatefrom high school is 78 percent.On the other hand, the povertyrate for children born to womenover age 20 who are currentlymarried and did graduate fromhigh school is only 6 percent.
P R B R E P O R T S O N A M E R I C A
11
i These figures are computed from the 2000 Census 1-Percent Public Use Microdata Sample file and include the own children of thehouseholder by birth, marriage (a stepchild), or adoption.

The six counties profiled here, located in differ-ent regions of the United States, illustrate the
diversity of rural poverty.
OWSLEY COUNTY, KENTUCKY2000 Population: 4,858Population Change 1990 to 2000: -3.5 percentOwsley is a core county of the eastern Kentucky hillcountry, but it was historically a small-scale farmingarea, not a coal-mining county. The population today
is only half as large as it was in 1940. Withoutadequate sources of work, it hasevolved into the poorest non-Hispanic white county in thecountry, with a child poverty rate of
56 percent and a total poverty rate of 45percent. The median household income of $15,800in 1999 was less than half of the U.S. nonmetromedian of $33,700. There is very low labor forceparticipation—just 39 percent compared with 60percent for all nonmetro counties nationally. Morethan a third (36 percent) of children in OwsleyCounty have no working parent in the household;this is the fourth-highest rate of all the counties inthe country. There is a very high incidence ofdisability among people ages 21 to 64—42 percentcompared with 21 percent nationally), and educa-tional attainment is low, with 34 percent of adultshaving completed less than one year of high school,compared with 9 percent nationally. In OwsleyCounty, 44 percent of births occur to women withouta high school education, twice the statewide rate.
EAST CARROLL PARISH, LOUISIANA2000 Population: 9,421Population Change 1990 to 2000: -3.0 percent East Carroll Parish, in the northeastern corner ofLouisiana, is in the heart of Mississippi River Deltaplantation country. The county is still highly depen-dent on the production of soybeans, cotton, and rice.
Blacks make up 70 percent of thepopulation. Forty-four percent ofhouseholds with children under age 18are headed by women with no husbandspresent, compared with 20 percentnationally. The lack of two potentialbreadwinners in many households is onereason East Carroll Parish has the sixth-highest child poverty rate in the country. The laborforce participation rate for males (42 percent) is notjust very low, but lower than that for women, a veryunusual circumstance. The child poverty rate was 59percent, compared with an overall poverty rate of 40percent, an exceptionally high disparity between thetwo rates. Median household income was just$20,700. The incidence of overall poverty in theblack population is nearly four times that of thewhite population—54 percent compared with 14percent.
STARR COUNTY, TEXAS2000 Population: 53,597Population Change 1990 to 2000: 32 percentStarr County is in the Lower Rio Grande Valley,bordering Mexico. The county contains manycolonias where homes are often builtfrom used or dilapidated materialsand typically do not meet buildingcodes. The population is veryyoung, with a median age of26 years, compared with aU.S. nonmetro average of 37years. This age structure stemsboth from large families (withmany children) and continuedimmigration. Ninety-eight percent ofthe population is Hispanic, with Spanish thecommon household language. Half the residentsreport that they do not speak English very well.Formal education is low, with 46 percent of adultshaving finished no more than the 8th grade. The
TEXAS
Starr County
P R B R E P O R T S O N A M E R I C A
12
RURAL COUNTIESWITH HIGH POVERTY RATES
KENTUCKY
Owsley County
LOUISIANA
East CarrollParish
P R B R E P O R T S O N A M E R I C A
proportion of children in two-parent families ishigher than average, a condition conducive to lowpoverty. However, earnings are very low. Even menwith full-time, year-round jobs earned an average ofonly $17,500 in 1999 in the county’s low-wage,agriculturally dominated economy, compared withthe national average of $30,900. Housing space isoften cramped, with 26 percent of households havingmore than one person per room, compared with theU.S. average of just 3.5 percent. Among children, 59percent were living in households with poverty-levelincome. The overall poverty rate is 51 percent.Seventeen percent of the children receive publicassistance (TANF), giving the county a rate fourtimes higher than the state’s.
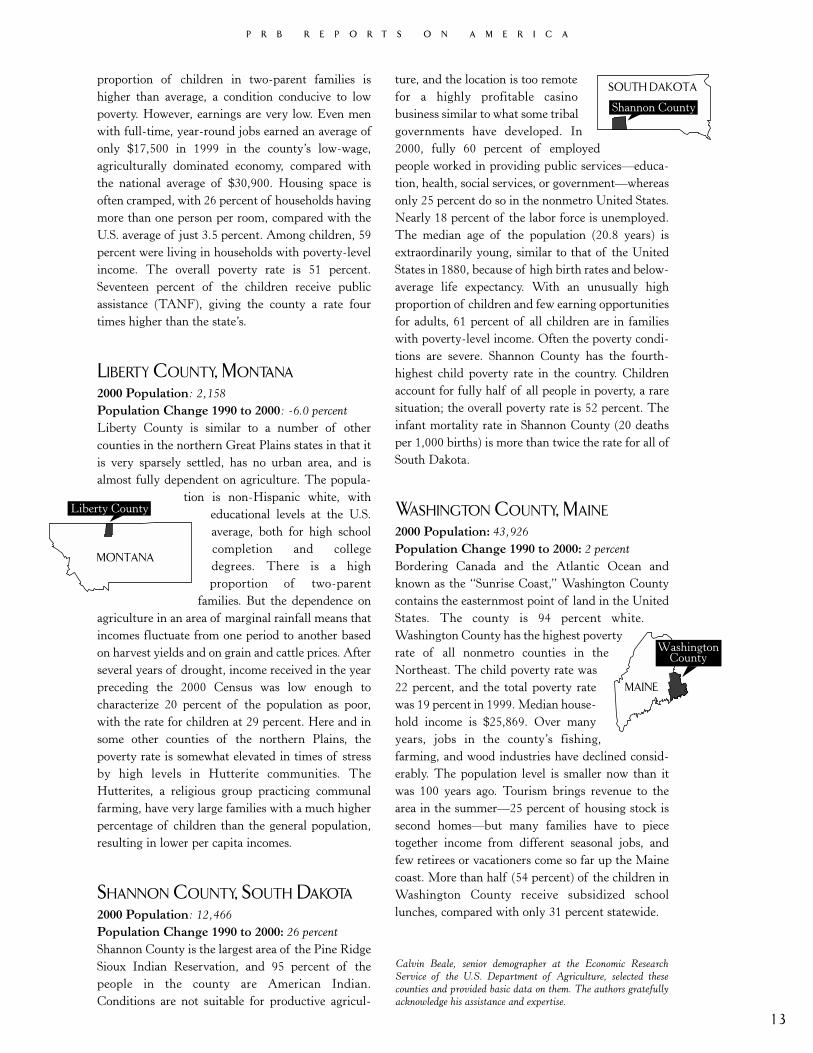
LIBERTY COUNTY, MONTANA2000 Population: 2,158Population Change 1990 to 2000: -6.0 percentLiberty County is similar to a number of othercounties in the northern Great Plains states in that itis very sparsely settled, has no urban area, and isalmost fully dependent on agriculture. The popula-
tion is non-Hispanic white, witheducational levels at the U.S.average, both for high schoolcompletion and collegedegrees. There is a highproportion of two-parent
families. But the dependence onagriculture in an area of marginal rainfall means thatincomes fluctuate from one period to another basedon harvest yields and on grain and cattle prices. Afterseveral years of drought, income received in the yearpreceding the 2000 Census was low enough tocharacterize 20 percent of the population as poor,with the rate for children at 29 percent. Here and insome other counties of the northern Plains, thepoverty rate is somewhat elevated in times of stressby high levels in Hutterite communities. TheHutterites, a religious group practicing communalfarming, have very large families with a much higherpercentage of children than the general population,resulting in lower per capita incomes.
SHANNON COUNTY, SOUTH DAKOTA2000 Population: 12,466Population Change 1990 to 2000: 26 percentShannon County is the largest area of the Pine RidgeSioux Indian Reservation, and 95 percent of thepeople in the county are American Indian.Conditions are not suitable for productive agricul-
ture, and the location is too remotefor a highly profitable casinobusiness similar to what some tribalgovernments have developed. In2000, fully 60 percent of employedpeople worked in providing public services—educa-tion, health, social services, or government—whereasonly 25 percent do so in the nonmetro United States.Nearly 18 percent of the labor force is unemployed.The median age of the population (20.8 years) isextraordinarily young, similar to that of the UnitedStates in 1880, because of high birth rates and below-average life expectancy. With an unusually highproportion of children and few earning opportunitiesfor adults, 61 percent of all children are in familieswith poverty-level income. Often the poverty condi-tions are severe. Shannon County has the fourth-highest child poverty rate in the country. Childrenaccount for fully half of all people in poverty, a raresituation; the overall poverty rate is 52 percent. Theinfant mortality rate in Shannon County (20 deathsper 1,000 births) is more than twice the rate for all ofSouth Dakota.
WASHINGTON COUNTY, MAINE2000 Population: 43,926Population Change 1990 to 2000: 2 percentBordering Canada and the Atlantic Ocean andknown as the “Sunrise Coast,” Washington Countycontains the easternmost point of land in the UnitedStates. The county is 94 percent white.Washington County has the highest povertyrate of all nonmetro counties in theNortheast. The child poverty rate was22 percent, and the total poverty ratewas 19 percent in 1999. Median house-hold income is $25,869. Over manyyears, jobs in the county’s fishing,farming, and wood industries have declined consid-erably. The population level is smaller now than itwas 100 years ago. Tourism brings revenue to thearea in the summer—25 percent of housing stock issecond homes—but many families have to piecetogether income from different seasonal jobs, andfew retirees or vacationers come so far up the Mainecoast. More than half (54 percent) of the children inWashington County receive subsidized schoollunches, compared with only 31 percent statewide.
P R B R E P O R T S O N A M E R I C A
13
SOUTH DAKOTA
Shannon County
Liberty County
MONTANA
MAINE
WashingtonCounty
Calvin Beale, senior demographer at the Economic ResearchService of the U.S. Department of Agriculture, selected thesecounties and provided basic data on them. The authors gratefullyacknowledge his assistance and expertise.

Reasons for the higher childpoverty rates among ruralchildren are not difficult to
find. Education and work are twoprominent paths out of poverty,but neither of these mechanismsworks as well in rural America as inurban America. Poor families inrural America are more likely to beworking, but the rural poor are alsomore likely to be poorly educatedand underemployed.
Parental-age adults in ruralareas are more likely to be highschool dropouts, while youngadults in urban areas are muchmore likely to be college graduates.Almost one-third (32 percent) of25-to-44-year-olds in metro areashave at least a college degree,compared with only 18 percent ofthose outside metro areas.
This gap is created partlybecause children growing up inurban areas are more likely tofinish high school and more likelyto go on to college. However, theselective outmigration of better-educated adults from rural tourban areas is also a contributingfactor.
Recent research by theEconomic Research Service sug-gests that even if the parents ofrural children do graduate fromhigh school or attend college, thechances that their children will bepoor are higher. Some 20 percentof nonmetropolitan childrenwhose parents are high schoolgraduates are poor, compared with
18 percent of their metropolitancounterparts. Among those child-ren whose parents have one ormore years of college, 10 percentof the rural children are poor,compared with 6 percent of theurban children. Only amongchildren whose parents did notgraduate from high school is thenonmetropolitan poverty rate (38percent) lower than the metropoli-tan poverty rate (41 percent).
Looking at the link betweenwork and poverty also providesevidence of the similaritiesbetween rural and central-cityfamilies. Families living in themost remote and isolated ruralareas experience many of thesame barriers to work—includingunfavorable labor market condi-tions, lack of child care, and trans-portation barriers—as families
living in socially isolateddistressed urban neighborhoods,according to research by MonicaFisher and Bruce Weber.
The relatively high povertyrate for kids in rural America isclosely related to the fact thatparents in rural America makeless money than those working inurban areas. In urban areas, themean income during 2002 forfamilies with children was$66,900, compared with $48,200for families with children livingoutside of urban areas.
Lower earnings for ruralworkers are not due to a lack of astrong work ethic; rather, manyfull-time jobs in rural areas do nottranslate into a family-sustainingincome. Many rural children livein families where parents workhard—often holding more than
P R B R E P O R T S O N A M E R I C A
14
LINKINGWORK, EDUCATION, AND WELFARE
Given the heavy focus on urban poverty today, some people arenot aware of the important role that rural poverty played in
stimulating social programs to aid the needy. Starting in the 1930swith the establishment of the Tennessee Valley Authority and theRural Electrification Administration, the needs of rural Americaspurred government action. The presidential campaign of John F.Kennedy in 1960 illuminated the dismal prospects of people livingin the rural South and played a role in the initiation of the GreatSociety and antipoverty programs of the 1960s. The plight of therural poor was further highlighted by President Lyndon Johnson’sNational Advisory Commission on Rural Poverty in 1967 andbooks like Michael Harrington’s The Other America.
THE RURAL ROOTS OF ANTIPOVERTY EFFORTS

one job at the same time— but donot earn enough to sustain theirfamilies.
About 3.5 million children inrural America live in low-incomeworking families where at leastone parent works all year, yetfamily income is less than 200percent of the federal povertylevel (about $36,000 for a familyof four in 2002). A larger share ofrural kids than urban kids areliving in low-income workingfamilies (see Table 3). In ruralAmerica, 27 percent of childrenlive in low-income workingfamilies, compared with only 21percent in metropolitan areas.
Another reflection of thelower quality of jobs in rural areasis the lack of benefits for ruralworkers. Among children whohave health insurance, ruralchildren are more heavily depen-dent on health insurance frompublic sources. More than one-quarter (28 percent) of children inrural America have insurancecoverage from public sources suchas Medicaid, Medicare, or theState Children’s Health InsuranceProgram (see “Programs for Low-Income Families With Children,”page 17), compared with 23percent of urban kids. Amongrural children in low-income
(below 200 percent of poverty)working families, more than two-fifths (41 percent) rely on publichealth insurance.
The kind of health insurancecoverage that rural kids receive isrelated to the types of firms thatemploy rural workers. A recentCensus Bureau report found thatonly 32 percent of employees insmall firms (under 25 employees)were covered by employer-basedhealth insurance, compared with70 percent of employees in largefirms (1,000 or more employees).Because rural workers are morelikely to work at small companies,they are less likely to obtainhealth insurance through theiremployers.
UNDER-EMPLOYMENT
In 2002, the unemployment ratefor workers living in rural areas
was 5.4 percent, compared with5.6 percent for those living inurban areas. However, the morefavorable position of rural work-ers is a new phenomenon. Theunemployment rate in rural areaswas slightly higher than in urban
areas every year during the lasthalf of the 1990s.
But the unemployment ratedoes not tell the whole story.Evidence suggests that “underem-ployment” among rural workers isan even bigger problem. Under-employment takes into accountthe unemployed, the number ofdiscouraged workers (those whohave given up looking for work),involuntary part-time workers,and low-income workers. Ruralworkers are more likely thanurban workers to be underem-ployed. A study by Tim Slack andLeif Jensen found that 19 percentof rural workers were underem-ployed, compared with only 15percent of urban workers.
This same analysis found that,over the past 30 years, ruralworkers have consistently beenunderemployed at higher ratesthan workers living in urban areas,and that blacks and Hispanicsliving in rural America are par-ticularly vulnerable to underem-ployment. Even in the robusteconomy of the late 1990s, morethan a quarter of black andHispanic workers in ruralAmerica were underemployed.The high rate of underemploy-ment for rural workers reflects thedifficulty many workers have
P R B R E P O R T S O N A M E R I C A
15
IN RURAL AMERICA, 27 PERCENT OF CHILDREN LIVE IN LOW-INCOME WORKING FAMILIES,COMPARED WITH ONLY 21 PERCENT IN METROPOLITAN AREAS.
Table 3
Number of Percent ofNumber of kids in all kids inkids under low-income low-income
Population 200% of working workingunder age 18 poverty families* families*
U.S. 72.7 million 27.8 million 16.1 million 22.1
Metro 59.5 million 21.7 million 12.6 million 21.2
Nonmetro 12.9 million 6.1 million 3.5 million 27.1
*Under 200 percent of poverty and at least one parent worked 50+ weeks.Note: For CPS, not identifiable not included in metro, nonmetro.Source: Population Reference Bureau analysis of data from the 2003 Current Population Survey (March Supplement).

finding a steady full-time job thatpays a family-supporting wage.
WELFAREBENEFITS
Poor families in rural areas areless likely than their urban
counterparts to receive cash pub-lic assistance (primarily fromTANF or SSI). During calendaryear 2001, 20 percent of poor kidsin urban areas resided in house-holds receiving cash public assis-tance, compared with 16 percentof similar kids in rural areas.
In 2002, poor rural familiesreceiving public assistancereceived an annual average of$2,377, compared with $3,432among poor families in metropoli-tan areas.
Part of the reason poor ruralfamilies receive fewer cashbenefits is linked to the stateswhere they live. There are system-atic differences among states inthe availability and generosity ofwelfare benefits, and the differ-ences are associated with whetherthe state is largely urban or largelyrural. Among states where thepercent of the population living inrural areas is above the nationalaverage (over 20 percent), the
average welfare payment during2002 was only $123 per recipient,compared with $150 per recipientin more urban states.
Some evidence suggests thatthe recent economic slump maybe increasing the need for assis-tance among rural people.Examination of TANF caseloadchanges between June 2002 andJune 2003 indicates that, in the 10most rural states, caseloadsincreased by an average of 4.5percent, but in the 10 most urbanstates, caseloads fell by an averageof 1.2 percent.
P R B R E P O R T S O N A M E R I C A
16

P R B R E P O R T S O N A M E R I C A
17
Many federal and state programs to aidchildren in low-income families havebeen transformed during the past
decade. The 1996 Personal Responsibility andWork Opportunity Reconciliation Act ended theentitlement program enacted in the 1930s to helppoor children (Aid to Families with DependentChildren), and replaced it with a system of blockgrants to states for family assistance, calledTemporary Assistance to Needy Families(TANF). TANF provisions include:■ Federal block grants to states were capped at$16.4 billion.■ States are required to impose work require-ments for most beneficiaries.■ Lifetime limits of no more than 60 monthswere imposed, but 22 states have opted to imposeshorter time limits (states can choose to supportbeneficiaries for longer periods if no federal fundsare used).■ States have more choice about passingearnings or child support payments along towelfare recipients.
Nationwide, welfare reform has been accom-panied by dramatically declining caseloads (untilthe 2001 recession) and increased labor forceparticipation by single mothers. In rural areas,especially those where potential employers arefew and far between, child care and transportationcosts are serious impediments to single mothersentering or re-entering the labor force. States havethe option of using some portion of their familyassistance block grants for child care. In addition,there is a separate child care grant from thefederal government. Despite the increase in fundsfor child care, there is still not enough money forall the families who qualify.
Many proponents of welfare reform alsosupport increased efforts to “make work pay.”The key program in this effort has been theEarned Income Tax Credit (EITC—sometimescalled EIC). EITC is largely targeted to familieswith children and is available to low-incomefamilies with earnings from wages or self-employ-ment but little other income. For the 2002 taxyear, a single head of a family with two or morechildren who had a family income between$10,350 and $14,450 could receive the maximumcredit of $4,140. Below $10,350 the credit wassmaller, and above $14,450 the benefit tapered offgradually before ending at $34,178. Since EITC isa credit rather than a deduction, the tax filer
receives the full amount as a refund, even if thetaxpayer owes nothing in taxes. In 2001, 15 statesalso had state EITC programs. Maryland’s istypical, providing a credit of 16 percent of thefederal EITC for tax year 2002.
The EITC was enacted in 1975 to offset theregressive nature of the payroll tax for SocialSecurity and Medicare for low-income workers,and it has been expanded several times since.EITC has enjoyed strong bipartisan supportbecause it rewards work (only those with earnedincome are eligible), because it does notdiscourage marriage, and because the paymentsare widely perceived as a refund, not as stigma-tizing “welfare.” About twice as much federalmoney ($31 billion) is transferred to low-incomefamilies through EITC than through TANF($16.4 billion).
One problem with EITC is that many peopledo not realize they are eligible, and there is someevidence that poor families in rural areas are lesslikely to participate than similar families in urbanareas. Also, many families receiving EITC end uppaying excessive fees to have their tax returnsprepared, and this greatly diminishes the value ofthis benefit.
Under the old welfare system, health insur-ance was closely linked to cash assistance, sinceAFDC recipients were all eligible for Medicaid,which is the joint federal-state program thatprovides health insurance for low-income anddisabled Americans. Congress, concerned thatfamilies leaving welfare for low-wage jobs wouldlose Medicaid eligibility but not get health insur-ance as a benefit of employment, created the StateChildren’s Health Insurance Program (SCHIP) aspart of the balanced Budget Act of 1997. SCHIPprovides federal money for states depending onthe number of uninsured low-income children ina state and the state’s recent success in improvingcoverage. States have some flexibility in setting theincome levels for SCHIP eligibility; a commonincome level for eligibility is 150 percent of thefederal poverty line. States can either expandexisting Medicaid programs to cover children orcreate new programs, or both. Limits are set onthe premiums and copayments that state programscan charge, and on the maximum percentage offamily income to be spent on medical care in ayear. As with EITC, many families do not enrollchildren in the SCHIP program because they donot think they are eligible.
PROGRAMS FOR LOW-INCOME FAMILIES WITH CHILDREN

P R B R E P O R T S O N A M E R I C A
18
Many of the biggestsocial policy changesover the past decade
have had special implications forrural children. Because of theunique aspects of social andeconomic life in rural America,welfare reform, expansion ofgovernment health insurance, andeducation reform affect rural andurban children differently.
The changing face of feder-alism also has important implica-tions for rural America.Devolution of policymakingresponsibility from the federal tothe state and county level, whichcharacterized much of the 1990s,may further jeopardize thebenefits available to poor ruralfamilies. Giving more responsi-bility to states is troubling giventhe evidence presented hereshowing that predominantly ruralstates provided significantly lowerwelfare payments.
Moreover, average income inpredominantly rural states islower than in other states. Theaverage per capita income in the10 most-rural states is $18,461,compared with $24,562 for the 10most-urban states. Giving statesmore of the responsibility fortaking care of the poor is likely tosqueeze the rural poor (who aremore likely to live in low-incomestates) more than the urban poor.
The fact that there was adecrease in the number ofchildren in nearly half the rural
counties between 1990 and 2000has fueled a crisis in many ruralschools. As the student popula-tion declines, pressures mount forrural county school systems toconsolidate with neighboringdistricts. For many rural commu-nities the local school is part ofthe bedrock of their socialidentity, so state-enacted policiesto encourage or require schoolconsolidation usually meet withstiff local resistance. The debateabout the wisdom of consolida-tion has become more heated asnew research underscores theeffectiveness of small schools andquestions the savings achieved byconsolidation. This issue is all themore complex because ruraleducation is also caught up inefforts to achieve more equitableeducation funding within states.Many states are in litigation overstate funding formulas, whichoften penalize smaller and poorerrural districts.
The overwhelming urbanfocus of welfare programs meanspolicymakers often overlookneedy families in rural areas. Inaddition to the scarcity of jobs,the physical and social isolationassociated with rural povertycreates problems different fromthose in densely settled urbanareas. Moreover, in many ruralareas there is a stronger socialstigma attached to participating insocial and welfare programsbecause the culture places a high
value on self-reliance. The socio-economic environment faced bypoor rural families needs to beconsidered before implementingpolicies and programs designedprimarily with the urban poor inmind.
Because a large share of therural poor are employed, low-income rural families will benefitfrom policies that increase therewards for low-income workers.For example, increasing bothaccess to and provision of healthcare or child care services to low-income working families is likelyto help struggling rural families.
One of the most importantprograms designed to help low-income working families is theEarned Income Tax Credit(EITC). The EITC is a federalprogram that works through thetax code to allow low-incomeworkers to enhance their income.Enacted in 1975, it targets low-income families with childrenwhere one or both parents work.Nationally, the federal EITCprogram lifted 2.5 millionchildren out of poverty, andyearly transfers an estimated $31billion to low-income families.
Since the EITC was expandedin 1993, the number of familiesreceiving the benefit increased by25 percent while the averageamount received per recipientfamily grew by over 50 percent.Research shows that, among low-income families, even small incre-
POLICYCONSIDERATIONS
P R B R E P O R T S O N A M E R I C A
19
ments of income can lead to betterchild outcomes.
As of 2002, 15 states haveimplemented a state EITCprogram to provide additionalhelp to low-income workers. Butthere is a heavy urban flavor tostates with such programs. In the10 most-urban states, five havestarted EITC programs, butamong the 10 most-rural states,only two (Vermont and Maine)have a state EITC program.
While the minimum wage isnot as targeted as the EITC inhelping families with children,several states have passed legisla-tion increasing the minimumwage above the national standard($5.15 an hour). But once again,states with higher minimumwages tend to be highly urban. Ofthe 12 states that have raised theminimum wage above the nationalstandard, only two have higher-than-average rural populations.
Because employment in manyrural settings is cyclical and jobsare widely dispersed, problems ofaccess to unemployment insur-ance benefits take on specialsignificance for low-wage workersin rural America. In addition tofacing dismal job markets in manyrural areas, workers living in ruralareas often lack access to thegovernment services that wouldhelp them navigate the unemploy-ment system or get the help theyneed to become re-employed.Most states now allow workers to
apply for unemployment benefitsby phone, but workers who wantor need additional help to accessunemployment benefits or em-ployment services often find thatlocal unemployment offices havebeen closed as part of cost-cuttingefforts.
THE FUTUREOF RURALAMERICA
With many rural countiesexperiencing declines in
the number of children, and with80 percent of the U.S. populationnow residing in metropolitanareas, it is easy to see why ruralchildren are often left out of poli-cy considerations. However, thehigh poverty rates and the grow-ing number of low-income work-ing families in rural communitiesput a significant number ofAmerican children at risk.
A number of policy changescan benefit low-income families inrural areas. Assisting families inbuilding credit to secure loans forvehicle ownership, enacting“lifeline” programs to providetelephone service to low-incomefamilies at discounted rates, andreducing the “digital divide” incomputer and Internet accesscould help reduce levels of social,
economic, and physical isolation.Programs to increase intellectualcapital by reducing the urban-rural education gap and byproviding job training to ruralworkers will help attract morebusinesses and entrepreneurs torural communities. Providingaffordable, high-quality child careservices and affordable rentalhousing in rural areas can helpreduce the “costs” of going towork. More broadly, low-incomefamilies need better resources tohelp them make the transitionfrom welfare to work. With thetransfer of many federal programsto states and localities, programflexibility is needed in order toallow decisionmakers to imple-ment and adapt policies for ruralcommunities.
Policymakers need to makesure than eligible families in ruralareas are participating in theprograms available to them. Manyfamilies who could receivesupport through the EarnedIncome Tax Credit, TemporaryAssistance to Needy Families, andthe State Children’s HealthInsurance Program do not receivebenefits because they do not knowthey are eligible.
Improving the opportunitiesand outlook for children in ruralareas is critical for creating asustainable future for ruralAmerica.
ACKNOWLEDGMENTS
The authors would like to thank Jean D’Amico at the Population ReferenceBureau and Tim Weddle at Loyola University for their research assistance.Kenneth Johnson’s work on this research was supported by a grant from theNorth Central Research Station of the USDA Forest Service.
Funding for this report was provided by the Annie E. Casey Foundation.
P R B R E P O R T S O N A M E R I C A
20
Monica G. Fisher and Bruce Weber, “TheImportance of Place in Welfare Reform: CommonChallenges for Central Cities and Remote RuralAreas” (Washington, DC: Brookings Institution,Research Brief, Center on Urban andNonmetropolitan Policy, June 2002).
Kenneth M. Johnson, “The Rural Rebound,” PRBReports on America 1, no. 3 (1999).
Kenneth M. Johnson, Paul R. Voss, Glenn V.Fuguitt, Roger Hammer, and Scott McNiven,“Recent Age-Specific Net Migration Patterns in theUnited States” (paper presented at the AnnualMeetings of the Population Association of America,Minneapolis, May 2003).
Daniel T. Lichter, Vincent J. Roscigno, and Dennis J.Condron, “Rural Children and Youth at Risk,” inChallenges to Rural America in the Twenty-FirstCentury, ed. David L. Brown and Louis E. Swanson(University Park, PA: The Pennsylvania StateUniversity Press, 2003): 97-108.
National Center for Health Statistics (NCHS),Health, United States, 2001 With Urban andRural Health Chartbook (Hyattsville, MD: NCHS,2001).
Save the Children, America’s Forgotten Children:Child Poverty in Rural America (Westport, CT:Save the Children, June 2002).
Tim Slack and Leif Jensen, “Race, Ethnicity, andUnderemployment in Nonmetropolitan America: A30-Year Profile,” Rural Sociology 67, no. 2 (2002):208-33.
Additional Reading
Rural Families Data Center
Population Reference Bureau ■ 1875 Connecticut Ave., NW, Suite 520 ■ Washington, DC 20009Phone: 800-877-9881 ■ Fax: 202-328-3937 ■ E-mail: [email protected]; Web site: www.prb.org
To read excerpts or full text of PRB publications, go to: www.prb.org.
TO ORDER PRB PUBLICATIONS (DISCOUNTS AVAILABLE)
The Population Reference Bureau’s RuralFamilies Data Center is a source of data on
families and communities in rural America,designed to serve community leaders, policy-makers, educators, journalists, grant makers, andthe general public. Our goal is to raise awareness
of trends in the well-being of families in ruralareas and to contribute to informed discussion ofpolicy at the national, state, and local levels.
For more information, visit the RFD Center websiteat www.rfdcenter.org.
PRB Reports on America
Begun in 1999, PRB Reports on Americaexpands the national conversation about
important demographic issues and their effects onAmerican society. Each issue, written by noteddemographic experts, addresses a significantnational issue in a comprehensive but easy-to-understand way. We spell out what the issue is,why it is important, and what its policyimplications are.
Past issues of PRB Reports on America havecovered:■ Government Spending in an Older America,
by Ronald Lee and John Haaga (May 2002)■ The Career Quandary, by Phyllis Moen
(February 2001)■ The Rural Rebound, by Kenneth M. Johnson
(September 1999)■ America’s Diversity: On the Edge of Two
Centuries, by Daphne Spain (May 1999)■ The 2000 Census Challenge, by Barry
Edmonston (February 1999)
To receive a complimentary subscription to PRBReports on America, please fill out the enclosedsubscription card, or contact PRB (see card forinformation).
All past issues of PRB Reports on America are alsoavailable at www.prb.org.


![V]eeting i eports M. Deansdownloads.hindawi.com/journals/jamc/1980/469012.pdfV]eetingi eports Microcomputersandchemistry The inaugural meeting of the Microcomputer and Micro- processor](https://img.dokumen.tips/doc/110x75/6119e725cedc0f06833bec21/veeting-i-eports-m-veetingi-eports-microcomputersandchemistry-the-inaugural-meeting.jpg)