Embed Size (px)
Citation preview

POLYMORPHISM AND VARIANT ANALYSIS
Saurabh Sinha, University of Illinois

Outline
Predicting when a coding SNP is “bad”
Genome-wide association studies

What is a SNP ?
Single nucleotide polymorphism
I1: AACGAGCTAGCGATCGATCGACTACGACTACGAGGTI2: AACGAGCTAGCGATCGATCGACTACGACTACGAGGTI3: AACGAGCTAGCGATCGATCGACTACGACTACGAGGTI4: AACGAGCTAGCGATCGATCGACTACGACTACGAGGTI5: AACGAGCTAGCGATCGATCGACAACGACTACGAGGTI6: AACGAGCTAGCGATCGATCGACTACGACTACGAGGTI7: AACGAGCTAGCGATCGATCGACTACGACTACGAGGTI8: AACGAGCTAGCGATCGATCGACTACGACTACGAGGT
Individual I5 has a variation (T -> A). This position is called a SNP.

Notes on SNPs
Often, some requirement on how frequent the specific variation has to be in the population, to be called a SNP
“Major” and “minor” alleles “Segregating” sites The 1000 Genomes project recorded
~41 Million SNPs by sequencing ~1000 individuals.
SNPs can have functional consequences

Predicting functional effects of SNPs
Predicting when a coding SNP is bad
Question:
I found a SNP inside the coding sequence. Knowing how to translate the gene sequence to a protein sequence, I discovered that this is a non-synonymous change, i.e., amino acid changes. This is an nsSNP.
Will that impact the protein’s function? (And I dont quite know how the protein
functions in the first place ...)

Two popular approaches
We will discuss one popular software/method for answering the question: PolyPhen 2.0.
Adzhubei IA, Schmidt S, Peshkin L, Ramensky VE, Gerasimova A, Bork P, Kondrashov AS, Sunyaev SR. Nat Methods 7(4):248-249 (2010).
Another popular alternative: SIFT.
Kumar P, Henikoff S, Ng PC. Predicting the effects of coding non-synonymous variants on protein function using the SIFT algorithm. Nat Protoc. 2009;4(7):1073-81.

PolyPhen 2.0

Data for training/evaluation
HumDiv
Damaging mutations from UniProvKB. Look for annotations such as “complete loss of function”, “abolishes”, “no detectable activity”, etc.
Non-damaging mutations: differences in homologous proteins in closely related mammalian species

“Features”

The MSA part of the pipeline

PSIC Score
Reflects the amino acid’s frequency at the specific position in sequence, given an MSA.
PMID 10360979

PSIC Score
For each column, calculate frequency of each amino acid:
PMID 10360979

PSIC Score
For each column, calculate frequency of each amino acid:
The clever idea: n(a,i)eff is not the raw count of amino acid ‘a’ at position i.
The raw count n(a,i) is adjusted to account for the many closely related sequences present in the MSA.
PSIC score of a SNP a b at position i is given by:
PMID 10360979

PSIC Score histogram from HumDiv

Classification
Naive Bayes method A type of classifier. Other classification
algorithms include “Support Vector Machine”, “Decision Tree”, etc.
What is a classification algorithm? What is a Naive Bayes method/classifier?

Classifiers
x11, x12, x13, ..., x1n, + x21, x22, x23, ..., x2n, + ... xi+1,1, xi+1,2, xi+1,3, ..., xi+1n, − xi+2,1, xi+2,2, xi+2,3, ..., xi+2n, − ...
i Positive examples
j Negative examples
MODEL
“Training Data”

Classifiers
x1, x2, x3, ..., xn
MODEL + or −“Supervised learning”

Naive Bayes Classifier
“Training Data”
+ or −

Evaluating a classifier: Cross-validation
FOLD 1
TRAIN ON THESEPREDICT ANDEVALUATE ON THESE
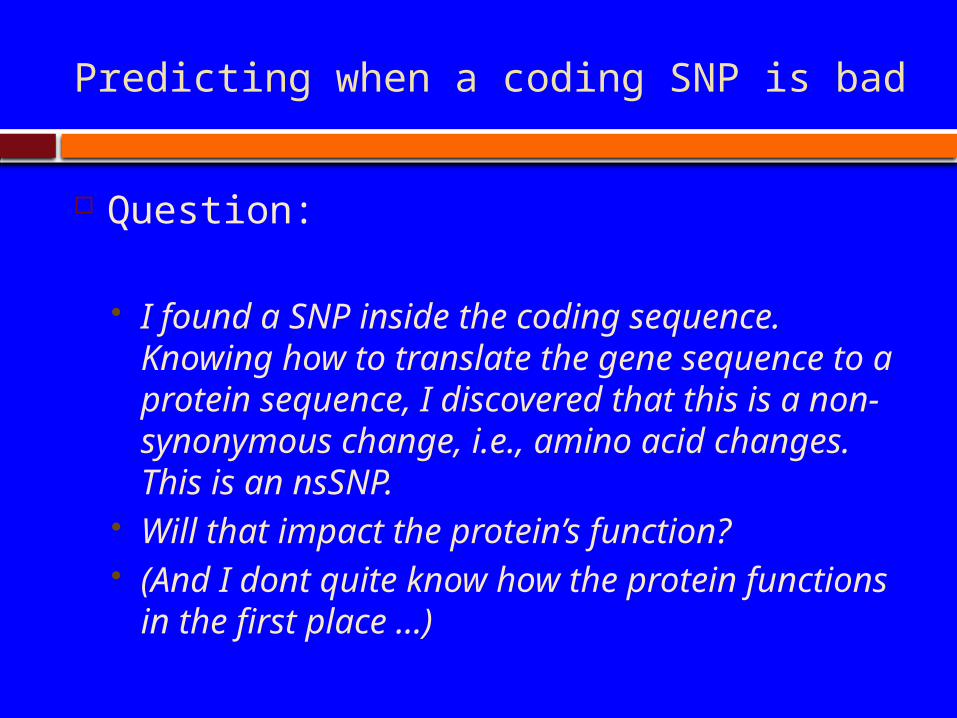
Evaluating a classifier: Cross-validation
FOLD 2
PREDICT ANDEVALUATE ON THESE
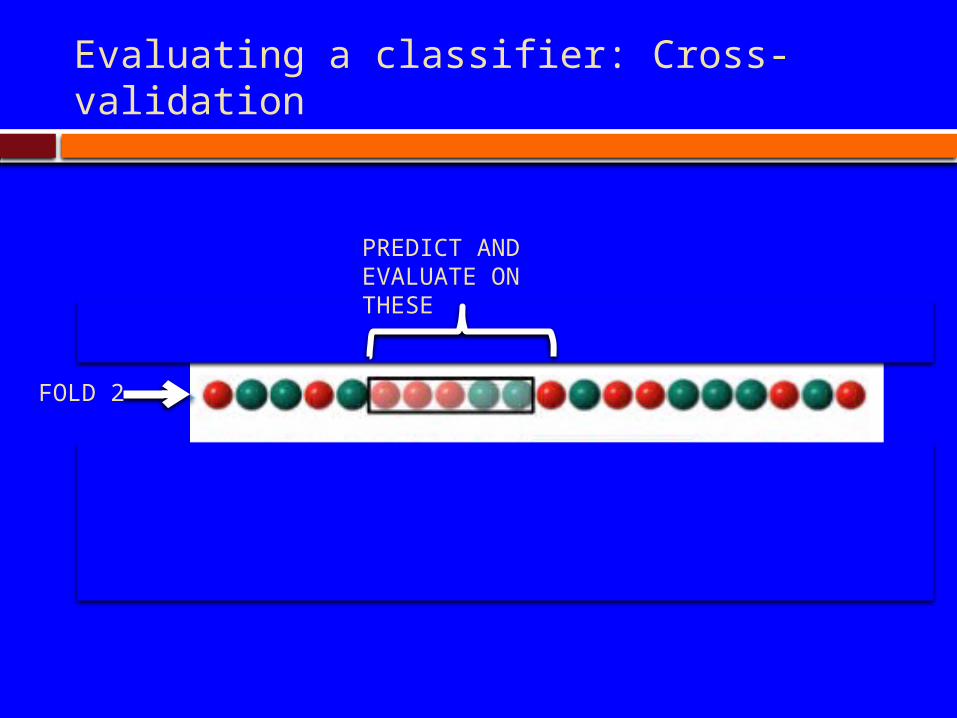
Evaluating a classifier: Cross-validation
FOLD 3
PREDICT ANDEVALUATE ON THESE

Evaluating a classifier: Cross-validation
FOLD k
PREDICT ANDEVALUATE ON THESE

Evaluating a classifier: Cross-validation
Collect all evaluation results (from k “FOLD”s)

Evaluating classification performance
Wikipedia

ROC of PolyPhen 2.0 on HumDiv

Genome-wide Association Studies (GWAS)
http://www.ploscompbiol.org/article/info%3Adoi%2F10.1371%2Fjournal.pcbi.1002822
http://www.ploscollections.org/article/info%3Adoi%2F10.1371%2Fjournal.pcbi.1002828

Genetic linkage analysis
Cystic Fibrosis and the CFTR gene mutations.
“Linkage analysis” Genotype members of a family (with some
individuals carrying the disease) Find a genetic marker that correlates with
disease Disease gene lies close to this marker.
Linkage analysis less successful with common diseases, e.g., heart disease or cancers.

Common disease common variant Hypothesis that common diseases are
influenced by genetic variation that is “common” in the population
Implications: Any individual variation (SNP) will have
relatively small correlation with disease Multiple common alleles together influence
the disease phenotype Argument for population-based studies
versus family based studies. (Think about it!)

Figure 1. Spectrum of Disease Allele Effects.
Bush WS, Moore JH (2012) Chapter 11: Genome-Wide Association Studies. PLoS Comput Biol 8(12): e1002822. doi:10.1371/journal.pcbi.1002822http://www.ploscompbiol.org/article/info:doi/10.1371/journal.pcbi.1002822

GWAS: Genotyping methodology Microarray technology to assay 0.5 - 1
million or more SNPs
Affymetrix and Illumina
One population may need more SNPs to be put on the chip than another population

GWAS: Phenotyping methodology Case/control vs. quantitative
Quantitative (LDL levels) Multiple sclerosis: case/control
Electronic medical records (EMR) for phenotyping?

GWAS statistics: the basic idea Case/control:
I1: AACGAGCTAGCGATCGATCGACTACGACTACGAGGT -I2: AACGAGCTAGCGATCGATCGACTACGACTACGAGGT -I3: AACGAGCTAGCGATCGATCGACTACGACTACGAGGT -I4: AACGAGCTAGCGATCGATCGACTACGACTACGAGGT -I5: AACGAGCTAGCGATCGATCGACAACGACTACGAGGT+I6: AACGAGCTAGCGATCGATCGACTACGACTACGAGGT -I7: AACGAGCTAGCGATCGATCGACTACGACTACGAGGT -I8: AACGAGCTAGCGATCGATCGACAACGACTACGAGGT+
Disease?

GWAS statistics: case vs control The Fisher Exact testI1: AACGAGCTAGCGATCGATCGACTACGACTACGAGGT -I2: AACGAGCTAGCGATCGATCGACTACGACTACGAGGT -I3: AACGAGCTAGCGATCGATCGACTACGACTACGAGGT -I4: AACGAGCTAGCGATCGATCGACTACGACTACGAGGT -I5: AACGAGCTAGCGATCGATCGACAACGACTACGAGGT +I6: AACGAGCTAGCGATCGATCGACTACGACTACGAGGT -I7: AACGAGCTAGCGATCGATCGACTACGACTACGAGGT -I8: AACGAGCTAGCGATCGATCGACAACGACTACGAGGT +I9: AACGAGCTAGCGATCGATCGACTACGACTACGAGGT -I10: AACGAGCTAGCGATCGATCGACTACGACTACGAGGT +I11: AACGAGCTAGCGATCGATCGACTACGACTACGAGGT -I12: AACGAGCTAGCGATCGATCGACTACGACTACGAGGT -I13: AACGAGCTAGCGATCGATCGACAACGACTACGAGGT -I14: AACGAGCTAGCGATCGATCGACAACGACTACGAGGT +
Has ‘A’ Has ‘T’
Case 3 1
Control 1 9

GWAS statistics: case vs control The Fisher Exact test
Has ‘A’ Has ‘T’
Case 3 1
Control 1 9
All individuals (14)
Has ‘A’(4)
Case(4)
(3)
p-value < 0.05

GWAS statistics: case vs control Instead of the Fisher Exact test, can use
the “Chi Squared test”.
Do this test with EACH SNP separately. Get a p-value for each SNP.
The smallest p-values point to the SNPs most associated with the disease

Association tests: Allelic vs Genotypic
What we saw was an “allelic association test”. Test if ‘A’ instead of ‘T’ at the position correlates with disease
Genotypic association test: Each position is not one allele, it is two alleles (e.g, A & A, T & T, A & T).
Correlate genotype at that position with phenotype of individual

Genotypic association tests
Various options Dominant model
AA or AT TT
Case ? ?
Control ? ?

Genotypic association tests
Various options Recessive model
AA AT or TT
Case ? ?
Control ? ?

Genotypic association tests
Various options 2 x 3 table
AA AT TT
Case O11 O12 O13
Control
O21 O22 O23
Chi-squared test

Quantitative phenotypes
Yi = Phenotype value of Individual i Xi = Genotype value of Individual i
Y = a + bX
If no association, b ≈ 0
The more b differs from 0, the stronger the association
This is called “linear regression”

Quantitative phenotypes
Another statistical test is “ANOVA” (Analysis of Variance)

Multiple hypothesis correction What does the “p-value of an association test =
0.01” mean ?
It means that the observed correlation between genotype and phenotype has only 1% probability of happening just by chance. Pretty good?
But if you repeat the test for 1 million SNPs, 1% of those tests, i.e., 10,000 SNPs will show such high correlation, just by chance. So p-value 0.01 was not so good after all.
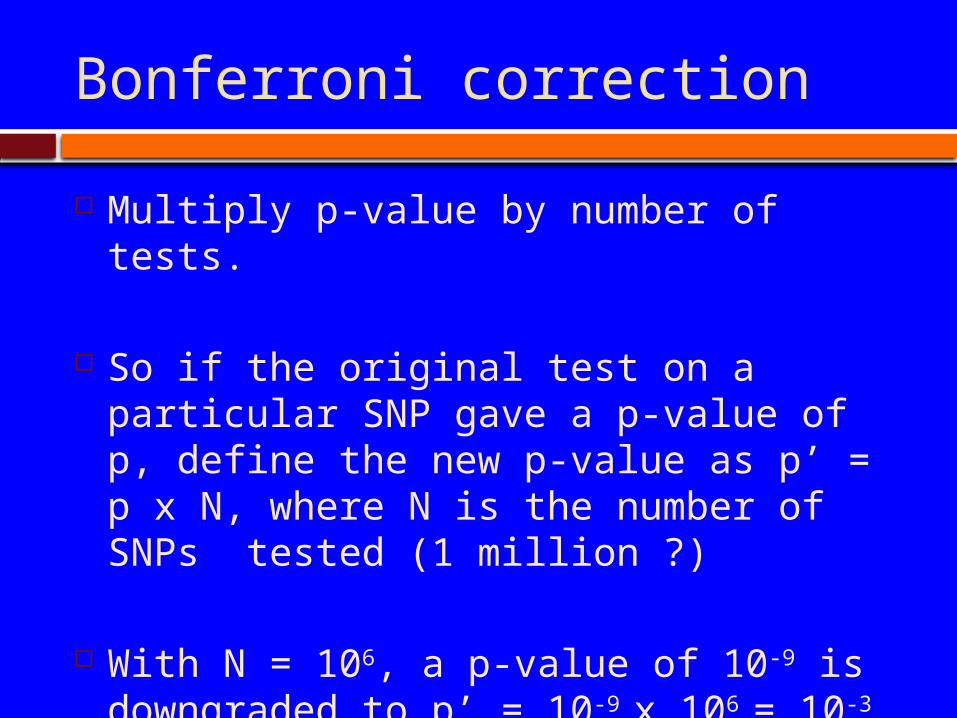
Bonferroni correction
Multiply p-value by number of tests.
So if the original test on a particular SNP gave a p-value of p, define the new p-value as p’ = p x N, where N is the number of SNPs tested (1 million ?)
With N = 106, a p-value of 10-9 is downgraded to p’ = 10-9 x 106 = 10-3. This is quite good.

False Discovery Rate
Bonferroni correction will “kill” most reported associations. Too stringent ?!
False Discovery Rate (FDR) is an alternative procedure to correct for multiple hypothesis testing, which is less stringent.

False Discovery Rate
Given a threshold α (e.g., 0.1): Sort all p-values (N of them) in
ascending order: p1 ≤ p2 ≤ ... ≤ pN
Define
Require p’ < α This ensures that the expected
proportion of false positives in the reported associations is < α

Beyond single locus associations? We tested each SNP separately Recall that our “common disease,
common variant” hypothesis meant each individual SNP carries only a small effect.
Maybe two SNPs together will correlate better with phenotype.
So, methods for 2-locus association study.
Main problem: Number of pairs ~ N2

Beyond the probed SNPs?
The SNP-chip has a large number of probes (e.g., 0.5 – 1 Million)
But there are many more sites in the human genome where variation may exist. Are we going to miss any causal variant outside the panel of ~1 Million?
Not necessarily.

Linkage disequilibirum
Two sites close to each other may vary in a highly correlated manner. This is linkage disequlibrium (LD).
Not enough recombination events have happened to make the inheritance of those two sites independent.
If two sites are in a segment of high LD, then one site may serve as a “proxy” for the other.

LD and its impact on GWAS
If sites X & Y are in high LD, and X is on the SNP-chip, knowing the allelic form at X is highly informative of the allelic form at Y.
So, a panel of 0.5 – 1 Million SNPs may represent a larger number, perhaps all of the common SNPs.
But this also means: if X is found to have a high correlation with disease, the causal variant may be Y, and not X

LD and its impact on GWAS

Discussions
In many cases, able to find SNPs that have significant association with disease. Risk factors, some mechanistic insights.
GWAS Catalog : http://www.genome.gov/26525384
Yet, final predictive power (ability to predict disease from genotype) is limited for complex diseases.
“Finding the Missing Heritability of Complex Diseases” http://www.genome.gov/27534229
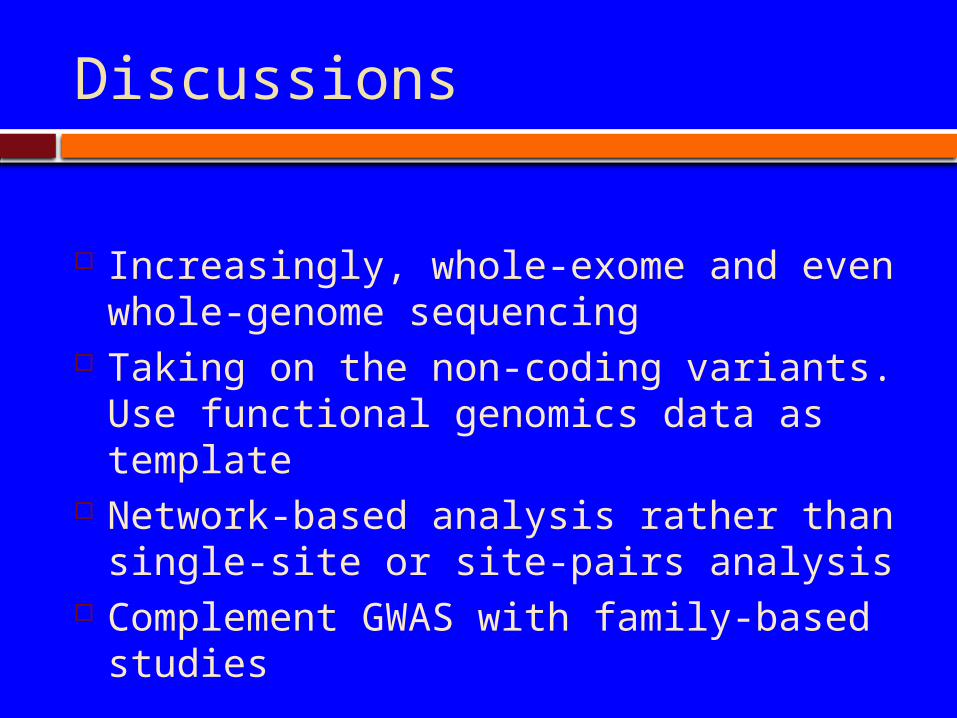
Discussions
Increasingly, whole-exome and even whole-genome sequencing
Taking on the non-coding variants. Use functional genomics data as template
Network-based analysis rather than single-site or site-pairs analysis
Complement GWAS with family-based studies