Embed Size (px)
Citation preview

Polarimetric Interferometric Experiment Trials for years 2001 and 2002:
Experiment Design, Ground Truthing, Data Quality and Analysis
Maureen Yeremy, Chuck Livingstone, Karim Mattar, Lloyd Gallop, Janice Lang and André Beaudoin
Defence R&D Canada √ Ottawa TECHNICAL MEMORANDUM
DRDC Ottawa TM 2003-142 September 2003


Polarimetric Interferometry Experiment Trials for years 2001 and 2002: Experiment Design, Ground Truthing, Data Quality and Analysis
Maureen Yeremy, Chuck Livingstone, Karim Mattar, Lloyd Gallop, Janice Lang Defence R&D Canada – Ottawa
André Beaudoin Defence R&D Canada – Valcartier
Defence R&D Canada – Ottawa Technical Memorandum DRDC Ottawa TM 2003-142 September 2003

© Her Majesty the Queen as represented by the Minister of National Defence, 2003
© Sa majesté la reine, représentée par le ministre de la Défense nationale, 2003

DRDC Ottawa TM 2003-142 i
Abstract
Synthetic Aperture Radar (SAR) theory has several disciplines which includes Polarimetric SAR (PolSAR) and Interferometric SAR (InSAR). Recent research in the past decade has introduced a new method which utilizes both of these disciplines and is called Polarimetric Interferometric SAR (Pol InSAR). Research to date has been focussed on determining forest heights from interferograms constructed from PolSAR data which has been decomposed so that the data can be preferentially weighted with respect to dominant environmental scattering mechanisms associated with a forest. In this way, phase difference interferograms can be constructed utilizing forest foliage scattering and ground interaction near the forest floor information, in order to estimate forest heights.
While these applications are of some interest to Department of National Defence (DND) Canada (i.e. Mapping and Charting), the Experimental Trials, documented here, were designed for utilizing both conventional Pol InSAR methods and developing new Pol InSAR methods specifically for military applications. Three Trials collected repeat pass Pol InSAR data for several experiments. The data were collected by Environmental Canada’s SAR C/X system which has similar properties to the future RADARSAT 2.
Key areas of Pol InSAR research associated with this study include : (i) motion effects and motion detection with PolSAR and Pol InSAR data, and (ii) the utilization of propagation models for inversion of military targets such as tall obstructions, maritime vessels, internal and external building attributes.
The experiment design and ground truthing are documented here in reference to the objectives. Some preliminary results and comments regarding lessons learned are also documented. This technical memorandum is a companion to another DRDC report which documents a Pol InSAR literature review and DND objectives for the Pol InSAR project experiments, and simulation results.

ii DRDC Ottawa TM 2003-142
Résumé
La théorie du radar à antenne synthétique (RAS) comprend plusieurs sous-domaines, dont le RAS polarimétrique (PolSAR) et le RAS interférométrique (InSAR). Au cours de la dernière décennie, de récents travaux de recherche ont ouvert la voie à une nouvelle méthode qui exploite ces deux sous-domaines : le RAS polarimétrique interférométrique (Pol InSAR). À ce jour, la majeure partie de la recherche a porté sur la détermination de la hauteur de forêts à partir d’interférogrammes construits à l’aide de données PolSAR. Ces données ont été décomposées de manière à permettre une pondération préférentielle en fonction des mécanismes environnementaux dominants de diffusion propres à une forêt. Ainsi, des interférogrammes à différence de phase peuvent être construits d’après l’information sur l’interaction entre la diffusion par le feuillage et le sol, près du tapis forestier, pour estimer la hauteur d’une forêt.
Bien que ces applications présentent un certain intérêt pour le ministère de la Défense nationale (MDN), plus précisément pour le Service de cartographie, les essais décrits dans ce document ont été conçus pour tester les méthodes traditionnelles Pol InSAR et pour développer de nouvelles méthodes Pol InSAR destinées spécifiquement à des applications militaires. Trois essais ont permis de recueillir des données Pol InSAR par passage répété pour permettre la réalisation de plusieurs expériences. Ces données ont été recueillies par le système RAS-C/X d’Environnement Canada, qui est doté de capacités semblables à celle du futur RADARSAT 2.
Les principaux domaines de recherche Pol InSAR liés à la présente étude comprennent : (i) l’établissement des effets du mouvement et sa détection au moyen des données PolSAR et Pol InSAR, et (ii) l’utilisation de modèles de propagation aux fins des méthodes d’inversion applicables aux cibles militaires telles les obstacles d’une hauteur élevée, les navires et les bâtiments (leurs attributs internes et externes).
Les étapes d’élaboration expérimentale et de vérification au sol sont décrites dans le présent document en fonction des objectifs. De plus, un certain nombre de résultats préliminaires et de commentaires au sujet des apprentissages réalisés sont également détaillés. Ce document technique accompagne un autre rapport de RDDC portant sur une analyse de documents qui traitent des méthodes Pol InSAR, sur les objectifs des expériences effectuées dans le cadre du projet Pol InSAR, tels qu’établis par le MDN, et sur les résultats des simulations.

DRDC Ottawa TM 2003-142 iii
Executive summary
In this technical memorandum, three Experimental Trials are described in relation to a DRDC-Ottawa Polarimetric Interferometric SAR (Pol InSAR) project that they are associated with. This project’s objective is to conduct Pol InSAR research emphasizing military applications rather than conventional Pol InSAR applications which determine forest heights.
The Pol InSAR project has taken an integrated approach so that in addition to new areas of Pol InSAR research, attention has also been focussed on SAR system changes and calibration equipment which can assist PolSAR, InSAR and Pol InSAR applications. The goals for these aspects includes improving and automating the calibration of Polarimetric data as well as proposing alterations to the Canadian PolSAR resource (Environment Canada’s SAR C/X) so that better quality image data are available for researching future spaceborne, airborne and UAV system designs relevant to the military.
Many experiments have been conducted in these three Pol InSAR Trials so that all these objectives are addressed. These three experiment trials are documented with respect to experiment design, objectives, ground truthing, data quality and available results.
New research areas include the analysis of moving targets with PolSAR and Pol InSAR data, and the utilization of propagation modelling techniques for inversion methods so that attributes of military targets can be perceived. The focus of military applications associated with propagation modelling includes : automatic detection applications of high obstructions, detection and recognition of military vehicles under foliage cover, recognition of the exterior and interior attributes of urban buildings. The moving target experiments are associated with three research aspects: determine if motion information is contained in the cross-channel pairs, determine what is the loss of scattering information in the SAR signature when a target moves, determine if the scattering information from a moving target can be tracked in sub aperture or signal data.
The objectives of many of the experiments described here are further documented in another technical report which documents a literature review and assesses the utility for DND.
This project is funded by a Technology Investment Fund for the period between April, 2001 and April, 2004.
Yeremy, M.L., Livingstone, C. E., Mattar, K., Gallop, L., Lang, J. 2003. Polarimetric Interferometry Experiment Trials for years 2001 and 2002: Experiment Design, Ground Truthing and Data Quality. DRDC-Ottawa TM 2003-142. Defence R&D Canada – Ottawa.

iv DRDC Ottawa TM 2003-142
Sommaire
Ce document technique porte sur la description de trois essais effectués par RDDC-Ottawa dans le cadre d’un projet sur le RAS polarimétrique interférométrique (Pol InSAR). L’objectif de ce projet est d’effectuer des travaux de recherche sur le Pol InSAR en mettant l’accent sur les applications militaires plutôt que sur les applications traditionnelles qui permettent de déterminer la hauteur de forêts.
Le projet Pol InSAR a adopté une approche intégrée pour non seulement examiner les nouveaux domaines de recherche Pol InSAR, mais aussi mettre au point des modifications du système RAS et évaluer l’équipement d’étalonnage utilisé par les applications PolSAR, InSAR et Pol InSAR. Ces volets visent l’amélioration et l’automatisation de l’étalonnage des données polarimétriques et proposent également des modifications de la source canadienne de PolSAR (le RAS-C/X d’Environnement Canada) afin d’obtenir de données d’image de meilleure qualité pour effectuer des travaux sur la conception de futurs véhicules spatiaux, aériens et aériens télépilotés (VAT), qui ont un intérêt particulier pour l’armée.
De nombreuses expériences ont été effectuées dans le cadre de ces trois essais Pol InSAR afin de travailler sur tous les objectifs. Pour les trois essais dont il est question, la documentation porte sur l’élaboration expérimentale, les objectifs, les vérifications au sol, la qualité des données et les résultats obtenus.
Les nouveaux domaines de recherche sont, entre autres, l’analyse de cibles mobiles à l’aide de données PolSAR et Pol InSAR, et l’utilisation de techniques d’élaboration de modèles de propagation pour les méthodes d’inversion afin d’être en mesure de percevoir les caractéristiques des cibles militaires. Les applications militaires liées à l’élaboration de modèles de propagation comprennent ce qui suit : détection automatique d’obstacles d’une hauteur élevée, détection et reconnaissance de véhicules militaires cachés par le feuillage et reconnaissance des caractéristiques internes et externes des bâtiments urbains. Les expériences sur les cibles mobiles portent sur les points suivants : la présence d’information relative au mouvement dans les paires inter-canaux, la perte d’information de diffusion dans la signature RAS quand une cible bouge et la possibilité de suivre l’information de diffusion d’une cible mobile au moyen de données de sous-ouverture ou de signal.
Les objectifs de plusieurs des expériences décrites dans ce document sont détaillés dans un autre rapport technique qui porte sur une analyse documentaire et sur l’utilité que ce domaine représente pour le MDN.
Ce projet est financé dans le cadre du Fonds d’investissement technologique pour la période débutant en avril 2001 et se terminant en avril 2004.
Yeremy, M.L., Livingstone, C. E., Mattar, K., Gallop, L., Lang, J. 2003. Polarimetric Interferometry Experiment Trials for years 2001 and 2002: Experiment Design, Ground Truthing and Data Quality. DRDC Ottawa TM 2003-142. R & D pour la défense Canada – Ottawa.

DRDC Ottawa TM 2003-142 v
Table of contents
Abstract........................................................................................................................................ i
Résumé ....................................................................................................................................... ii
Executive summary ................................................................................................................... iii
Sommaire................................................................................................................................... iv
Table of contents ........................................................................................................................ v
List of figures ........................................................................................................................... vii
List of tables .............................................................................................................................. ix
Acknowledgements ................................................................................................................... xi
1. Introduction ............................................................................................................................ 1 1.1 Experiment Objectives ............................................................................................ 2 1.2 Experiment Trials .................................................................................................... 3 1.3 PolSAR System : C/X SAR..................................................................................... 3 1.4 Experimental Equipment ......................................................................................... 4
2.0 CFB Valcartier Experiment .................................................................................................. 6 2.1 Experiment Overview and Introduction .................................................................. 7 2.2 Experiment Objectives, Considerations and Design ............................................... 7 2.3 Ground Truthing.................................................................................................... 11 2.4 Data Quality and Preliminary Results ................................................................... 15
3.0 Cameval Experiment .......................................................................................................... 17 3.1 CAMEVAL Overview and Introduction ............................................................... 17 3.2 CAMEVAL Objectives and Design for Pol InSAR .............................................. 19 3.3 Ground Truthing.................................................................................................... 21 3.4 Data Quality........................................................................................................... 25 3.5 Preliminary Data Analysis..................................................................................... 25

vi DRDC Ottawa TM 2003-142
4.0 Ottawa Valley Urban Environment Trial ........................................................................... 27 4.1 Experiment Design and Objectives ....................................................................... 29 4.2 Ground Truthed Data............................................................................................. 32 4.3 Data Quality and Analysis..................................................................................... 44
References ................................................................................................................................ 49
Annex A : CFB Valcartier Ground Truth ................................................................................ 51 POSITIONAL MEASUREMENTS............................................................................ 51 CALIBRATION INFORMATION ............................................................................ 54 ENVIRONMENTAL INFORMATION...................................................................... 56 LOGS and PHOTOGRAPH NOTES .......................................................................... 58
Annex B : Baselines for CFB Valcartier InSAR Pairs ............................................................. 70
Annex C : CAMEVAL (CFB Petawawa) Ground Truth.......................................................... 75 Ground truth logs – Moving Target............................................................................. 75
Annex D : CAMEVAL Baselines for June 5, 2002.................................................................. 81
Annex E : CAMEVAL Baselines for June 8, 2002 .................................................................. 85
Annex F : Ottawa Valley Urban Trial Ground Truth ............................................................. 100 CALIBRATION........................................................................................................ 100 GEOGRAPHIC POSITIONS.................................................................................... 101 MOVING TARGET GROUND TRUTHING .......................................................... 103 ARC EXPERIMENT................................................................................................. 106 ENVIRONMENTAL DATA .................................................................................... 108 PHOTOGRAPHER’S LOG ...................................................................................... 109
Annex G : BASELINES FOR OTTAWA TRIAL ................................................................. 115
List of Symbols/abbreviations/acronyms/initialisms.............................................................. 129

DRDC Ottawa TM 2003-142 vii
List of figures
Figure 1. CFB Valcartier Map................................................................................................... 6
Figure 2. Images of the Valcartier site....................................................................................... 9
Figure 3. Imaged Cougar vehicles at CFB Valcartier............................................................... 10
Figure 4. Map of CFB Valcartier............................................................................................. 11
Figure 5. PolSAR image of CFB Valcartier. ........................................................................... 13
Figure 6. LIDAR image of the Valcartier calibration site. The red circles indicate where LAVs were located. The shack is marked. Darker, textured regions are associated with forested areas..................................................................................................................... 14
Figure 7. Examples of ground Truthing photographs at CFB Valcartier. .............................. 15
Figure 8. Map of CFB Petawawa indicating study sites.......................................................... 18
Figure 9. Ground control points at CFB Petawawa. ................................................................ 22
Figure 10. Moving Target experiment set up. ......................................................................... 23
Figure 11. Interferogram (single channel) for June 8 InSAR pairs. ........................................ 26
Figure 12. Map of Connaught Ranges, Ottawa. Pink and green circled areas denote moving target experiment and calibration locations....................................................................... 28
Figure 13. PolSAR image which contains ARC signature. ..................................................... 33
Figure 14. Testing of DRDC-Ottawa ARC. ............................................................................ 34
Figure 15. Photographs documenting the moving target experiment. ..................................... 36
Figure 16. Examples of moving targets set up (dihedral and grate). ....................................... 37
Figure 17. Ground truthed photographs of scaffolded building for urban analysis................. 38
Figure 18. Ground truthed photograph of construction in Ottawa urban area......................... 39
Figure 19. Urban buildings in downtown Ottawa. .................................................................. 40
Figure 20. Ottawa urban areas of Westboro and Tunney's Pasture. ........................................ 40
Figure 21. Antennas at Shirley's Bay captured in PolSAR images. ........................................ 41

viii DRDC Ottawa TM 2003-142
Figure 22. An example of a moderate sized building at Tunney's Pasture. ............................. 41
Figure 23. Tunney's Pasture Health Canada Building. ............................................................ 42
Figure 24. Map of buildings at Tunney's Pasture. ................................................................... 43
Figure 25. PolSAR image (upper) and phase interferogram (lower) for pass 6, Sept 24. ..... 46
Figure 26. PolSAR and phase interferogram for pass 1, September 24. .................................. 47
Figure 27. Phase interferograms (left) and images for passes 1, 6, 7, and 4 (from top). ......... 48
Figure 28. Pictorial map of experiment layout at CFB Valcartier........................................... 51
Figure 29. Wind measurements at CFB Valcartier.................................................................. 56
Figure 30. Calculated baseline distances for all combinations of InSAR pairs (12a-g) . ........ 71
Figure 31. Positional information for moving target on pass 4, June 5. ................................... 78
Figure 32. Velocity information for moving target, for pass 4, June 5. ................................... 78
Figure 33. Altitude of moving target as a function of time for pass 4, June 5. ....................... 79
Figure 34. Moving target positions for pass 5, June 5............................................................. 79
Figure 35. Velocity for moving target on pass 5, June 5. ........................................................ 80
Figure 36. Elevation as a function of time for moving target on pass 5, June 5...................... 80
Figure 37. Baselines for all June 5 InSAR pair combinations (a-f)......................................... 81
Figure 38. The baselines for all InSAR pairs on June 8, 2002 (a-aa). ..................................... 85
Figure 39. Calibrator positions at Connaught Range............................................................. 103
Figure 40. Velocity and heading information for pass 1. ...................................................... 106
Figure 41. Baselines for the Ottawa valley Trial (a-bb). ....................................................... 115

DRDC Ottawa TM 2003-142 ix
List of tables
Table 1. Trihedral Corner Reflector Dimensions. ..................................................................... 5
Table 2. CFB Valcartier flight parameters. .............................................................................. 10
Table 3 . Flight line parameters for SAR images (CFB PETAWAWA AND TEST FLIGHT).20
Table 4. Moving Target time intervals RELATIVE to SAR image acquisition time ON JUNE 5, 2002............................................................................................................................... 24
Table 5. Moving target interval relative to SAR acquisition time on June 8, 2002.................. 24
Table 6. Flight parameters for Ottawa Valley PolSAR data acquisitions. .............................. 31
Table 7. Moving Target interval times relative to SAR image acquisition. ............................ 37
Table 8. Reference numbers for experiment set up map in Figure 28..................................... 52
Table 9. GEO-Positions of calibrators and targets at CFB Valcartier. ..................................... 53
Table 10. Calibration angles (measured and required) at CFB Petawawa. .............................. 54
Table 11. Calibration Angle changes with each scene at CFB Valcartier. .............................. 55
Table 12. Soil Moisture measurements for cougar in the open at CFB Valcartier. ................. 57
Table 13. Soil moisture measurements for cougar in brush at CFB Valcartier. ...................... 57
Table 14. Soil moisture measurements for cougar under forest CANOPY at CFB Valcartier.58
Table 15. Photographer's log and photograph notes. ............................................................... 59
Table 16. Calibration orientation angles for Sept 24 PolSAR acquisitions........................... 100
Table 17. Measured calibration angles on September 24. ..................................................... 100
Table 18. Positions of Targets and Calibrators on Sept 24.................................................... 101
Table 19. Connaught Range Calibrator Positions.................................................................. 102
Table 20. Positions of Cessna at Connaught Range. ............................................................. 103
Table 21. Moving target orientation angles. .......................................................................... 104

x DRDC Ottawa TM 2003-142
This page intentionally left blank.

DRDC Ottawa TM 2003-142 xi
Acknowledgements
This work could not be accomplished without the team effort and diligent contributions of many DRDC employees and support contractors. This support includes many unnamed people from several diverse parts of DRDC, including finance, management, technicians, scientists and analysts. An example of this commitment was demonstrated at the last trial where at least 15 people were recruited for this field trial exercise.
Many of the Trials were conducted on Canadian Forces Bases where the military support and expertise was always outstanding and always appreciated.
The acquisition of these data could not be possible without the support of Canada’s airborne PolSAR system (SAR C/X), which is operated by Environment Canada and jointly supported by several organizations including DRDC, CCRS and CSA. This system has been chronically underfunded for years. The fact that this system is still operating reflects the dedication of the scientists and technicians from these organizations who support it. This is largely due to their recognition that this system has potential for future Canadian SAR research provided modest funding updates this system.
Key people who did “more than their job”, assisting with these experiments included : Terry Potter, Ray Burrill, Mike Boyle, David Schlingmeier, Marielle Quinton, Shawn Gong, Robert Gervais and several members of the Canadian Forces.

xii DRDC Ottawa TM 2003-142
This page intentionally left blank.

DRDC Ottawa TM 2003-142 1
1. Introduction
This technical note provides information about experiments which were conducted between September, 2001 and September, 2002 for the purposes of researching Polarimetric Interferometric Synthetic Aperture Radar (Pol InSAR) applications. The focus of this Pol InSAR project was to develop new methods and applications that are more relevant to military concerns, and to also tailor conventional Pol InSAR methods for military applications. Here, after this introduction, follows a description of each experimental trial in relation to the objectives desired. The overall Pol InSAR objectives, theory and literature review in relation to these experiments are discussed in [1].
Pol InSAR is a relatively new area of research within the realm of geophysical image analysis. Currently, most of the research has been associated with determining vegetation heights so that a bald Earth’s surface can be estimated, in vegetated areas. This aspect has been researched quite thoroughly by a leading group of researchers [e.g. 2, 3, 4]. Most of their studies have been at frequencies different than the future RADARSAT 2, as documented in the literature review [1]. The DRDC-Ottawa goal has been twofold. The first objective is to determine how relevant the present day research applications are for data which is similar to RADARSAT 2 for military applications. The second objective is to develop and research applications which are more relevant to military goals and more relevant to the Canadian RADARSAT frequencies.
This research is funded through the Technology Investment Fund (TIF) which was awarded to DRDC-Ottawa from April, 2000 until April 2003. This note is a companion to the literature review and Pol InSAR objectives report [1] which outlines the global research to date and the goals and anticipated research for the TIF.
Synthetic Aperture Radar (SAR) image applications have been researched for the past 60 years, since the concept was first proposed. Two specializations of SAR research, that have been developed, are Polarimetric SAR (PolSAR) and Interferometric SAR (InSAR). Simplified descriptions of these data follow. More thorough documentation can be found in [6, 7, 8, 9]. PolSAR utilizes the information available from the polarimetric ellipse to determine the physical structure(s) that the backscattered signal interacted with [i.e. effectively a memory is retained of the structures that the propagating Electro-magnetic (EM) waves have backscattered from]. InSAR is a method that utilizes the phase information between at least two co-registered images so that either topographical or velocity information can be obtained from it. A limiting factor for InSAR applications is that the baseline distance between the two images is small.
This introduction provides an overview of the experimental objectives and the experiments are briefly introduced below. In addition, the SAR system used for acquiring these data is also briefly documented.
Following this introduction, there are three sections which document the three experiments. Each part, discusses separately each experiment in context of the design and objectives, the ground truthed information, data quality and results, if available.
2 DRDC Ottawa TM 2003-142
1.1 Experiment Objectives
Current Pol InSAR methods integrate both the polarimetric and interferometric information to determine more robustly both the target backscattered characteristics and topographic information. As described in [1], current emphasis has been on extracting vegetation heights, particularly for forests. The DRDC-Ottawa objective for this TIF project is to expand this analysis to enhance target recognition, topographic and motion information using current and new Pol InSAR techniques. The objectives for this study are described in [1], and listed as follows:
1. Determine if velocity information is obtainable from the polarimetric scattering matrix as suggested in [10] and Fitch [11] using a similar method.
2. Determine if a target in motion can still provide polarimetric information that can be used for recognition applications. A moving target often causes image effects such as azimuthal smearing (i.e. a blurring effect). However, with further processing of the signal data, it may be possible to track characteristic signatures which provide both structural and orientation (i.e. perpendicular to the propagation path) information [12, 13]. This may provide sufficient information to trace the motion. This process however, would require the calibration of signal data (see 4).
3. Research Pol InSAR methods which are more suitable for the detection and recognition of military targets. In particular, two areas which require further research are: a) adapting current methods to distinguish military targets amongst environmental features, such as a forest and b) the development of new applications for military targets of interest such as tall obstructions, large shipping vessels or building features. The latter area of concern will be addressed by developing and utilizing other methods more suitable for the recognition of military targets. Most SAR methods (and in particular, InSAR methods) today, pertain to distributed targets (e.g. a crop or ocean surface), and are not suitable for military target applications. For this project the use of propagation modeling techniques with SAR image and signal data is researched in order to better identify targets of concern to the military.
4. Provide the tools so that the calibration of polarimetric image and signal data is easier. PolSAR applications rely on well-calibrated polarimetric data. This calibration is often labor intensive, but could be improved by integrating automated system design features. For this project, Active Radar Calibrators (ARC) were built so that commercial satellites (i.e. RADARSAT-2, ENVISAT) could be calibrated independently, since it is uncertain whether sufficiently well calibrated data will be available commercially from these sensors. Other objectives for this investment (in time and money) include the following: a) acquire knowledge of these methods so that it could impact future PolSAR system designs for internal calibration capabilities. With smart SAR designs, the objective of more automatic calibration could be achieved, b) study characteristics of the satellites’ signal, beam-pattern and other effects, and c) complement the stationary ARC being developed also at DRDC-Ottawa. Using both ARCs for the same acquisition could be useful for monitoring range effects of a SAR system.

DRDC Ottawa TM 2003-142 3
1.2 Experiment Trials
Three experiments were conducted between September, 2001 and Ocotber, 2002. Each experiment is briefly introduced below after the experiment site and date. Further more detailed documentation follows in the following sections of this memorandum.
1. CFB ValCartier, September 7, 2001. The primary objective was to determine if the SAR platform, chosen for the study would provide sufficiently small baselines for the Pol InSAR applications. In addition, other data (RADARSAT and LIDAR) were acquired for data fusion purposes. Three Light Armoured Vehicles (LAVs) were supplied by CFB Valcartier.
2. CFB Petawawa, June 5 and 8, 2002. The primary objective was to acquire Pol InSAR data which contained signatures of many military targets (27) in a forested area. The opportunity was taken to image several staged military vehicles associated with another experiment, CAMEVAL [14]. Typically it is difficult to coordinate and stage these many targets. In addition, a moving target experiment with polarimetric data was also executed.
3. Ottawa valley urban and environment, September 24, 2002. Urban and tall obstruction targets were the main focus of this experiment. In addition, many TIF objectives were addressed at this Trial. Briefly, these included: testing of calibration equipment, and a more complete moving target experiment.
1.3 PolSAR System : C/X SAR For these experiments the decision was made to collect PolSAR data from Environment Canada’s system, the SAR C/X. This system was readily available and more affordable than other systems. Other systems have the advantage of better resolutions and they are more modern. However, the Canadian resource has several good attributes, such as excellent channel isolation, which is crucial for polarimetric analysis. In addition, its system parameters are similar to many of RADARSAT’s specifications. It has a mode which collects C band fully polarimetric data (i.e. 4 channels). In addition, DRDC-Ottawa has access to its processing software, which is beneficial for these types of studies. Ideally, a single pass Pol InSAR system would have been easier to analyse and assess. However, during the project time, there were no developed Pol InSAR systems available. Currently, there are two that are in some stage of development at Jet Propulsion Laboratory (JPL) and German Aerospace Center (DLR). This work was completed with multi-pass InSAR pairs. The collection of these data introduces more phase errors associated with paths and motion which are not consistent with each other. Effectively, a single pass system would have reduced the variables and would have been easier to analyse.

4 DRDC Ottawa TM 2003-142
The SAR C/X has a fully polarimetric mode which produces four channels; its system parameters are described in [15]. Calibration and processing of the system are discussed in [16, 17, 18]. Analysis with satellite data has also been achieved using SeaSAT data. These data may also be analyzed by DRDC-Ottawa for some applications.
1.4 Experimental Equipment The same equipment are used for each of the experiments. These equipment are listed and documented below.
1. Trimble Global Positioning System (GPS) Pathfinder has the capability of acquiring Differential GPS (dGPS) positions using Coast Guard beacons for reference base stations. Typical errors are between 1 and 3 m in ground estimates. Elevation estimates have larger errors and are dependent on the averaging time.
2. An Aanderaa weather station has the capability of recording the following meteorological parameters : mean wind speed and direction, maximum wind burst speed in sampling interval, temperature and precipitation. Components are as follows:
a. Data-logger 3660 has a minimum sampling interval of 30 seconds. b. Temperature Sensor 3455 has an error of +/-0.1°. c. Wind Direction, Wind Speed and Wind Maximum Speed Sensor 3590. Wind
direction errors are within +/-5°, wind speed and wind gust errors are the maximum of [+/-0.2m/s or +/-2%].
3. The ARCs used for the experiments were tailored for the C/X SAR system and are owned by Canada Centre for Remote Sensing (CCRS). A DRDC ARC was built at DRDC and tested in the final experiment documented here.
4. The same trihedral corner reflector calibrators were also used for many of the experiments. This included CCRS corner reflectors as well as corner reflectors made for DRDC-Ottawa. A list of the corners and their specifications are found in Annex Z.
5. Hand held Garmin GPS Map76 systems have horizontal errors < 15 m and velocity errors of 0.05 m/s. DGPS horizontal errors for USCE and WAAS are respectively 3-5 m and <3m.
6. Ashtek Z12 GPS Systems are of survey quality and are used for determining accurate SAR positions, using dGPS software methods (Waypoint GrafNAV software).
7. Ground Control Point (GCP) trihedral corner reflectors were also constructed for the first experiment and were very successful. It is often difficult to acquire corner reflectors which represent theoretical backscatter values, since typically these calibrators are bolted and have other attachments which slightly distorts the planar metal resulting in their shape departing slightly from the theoretical trihedral shape. In contrast, these GCPs’ design preserved smooth near perfect surfaces relative to the typical calibration corner reflectors used. They were designed for rapid deployment and were simply constructed with thick aluminum foil glued to a plywood frame in the shape of a trihedral corner reflector. Aspects of this design should be considered for future calibrators.
DRDC Ottawa TM 2003-142 5
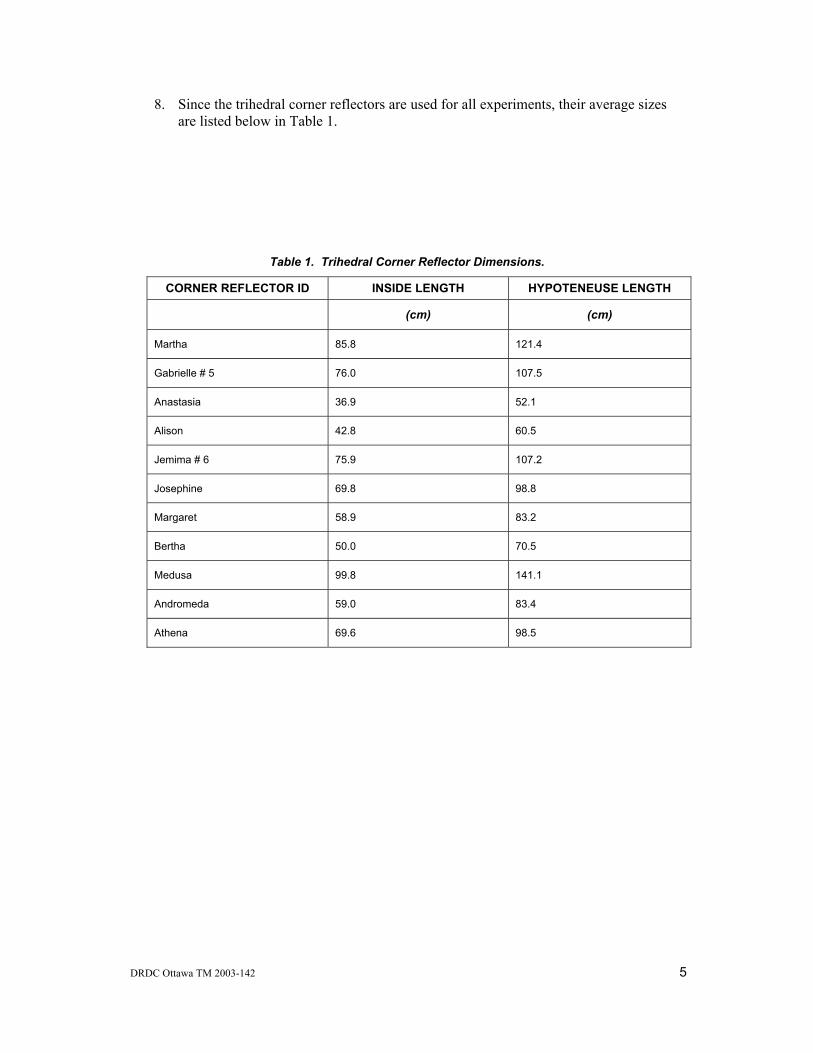
8. Since the trihedral corner reflectors are used for all experiments, their average sizes are listed below in Table 1.
Table 1. Trihedral Corner Reflector Dimensions.
CORNER REFLECTOR ID INSIDE LENGTH HYPOTENEUSE LENGTH
(cm) (cm)
Martha 85.8 121.4
Gabrielle # 5 76.0 107.5
Anastasia 36.9 52.1
Alison 42.8 60.5
Jemima # 6 75.9 107.2
Josephine 69.8 98.8
Margaret 58.9 83.2
Bertha 50.0 70.5
Medusa 99.8 141.1
Andromeda 59.0 83.4
Athena 69.6 98.5

6 DRDC Ottawa TM 2003-142
2.0 CFB Valcartier Experiment
An experiment was conducted on September 7, 2001 at CFB ValCartier, near Quebec City, QC. The intention of this experiment was two-fold: 1) determine if reasonable InSAR pairs can be collected from the Canadian Convair 580 SAR C/X, and 2) provide feedback for the design and analysis for future Pol InSAR experiments.
Figure 1. CFB Valcartier Map

DRDC Ottawa TM 2003-142 7
The ValCartier region has a varied topography which ranges from mountain slope to flat plain with vegetation land cover varying from grasslands to forested regions. Consequently, it was suitable for PolSAR and Pol InSAR analysis. CFB Valcartier is shown in Figure 1, where the grey outlined area demarcates the base (copy from MCE 124 Map Ed. 6, DND Canada). The base provided three armoured vehicles which were staged in a forested or open plain environment during the acquisition time.
Other image data (e.g. LIDAR, RADARSAT) were also collected for the purposes of data fusion analysis. Only the Pol InSAR experiments will be documented thoroughly here.
2.1 Experiment Overview and Introduction
This experiment involved two laboratories: Defence Research Establishment Ottawa, (DREO) and Defence Research Establishment ValCartier, (DREV), now referred as DRDC-Ottawa and DRDC-ValCartier. The Ottawa laboratory’s emphasis was Pol InSAR for which they organized the polarimetric and RADARSAT acquisitions. The ValCartier lab’s focus was data fusion and a LIDAR image acquisition and the staging of three military vehicles in the image area for data fusion applications.
This experiment was designed so that the signature of military vehicles, underneath various types of forest canopy, could be captured in SAR images. Three Light Armoured Vehicles (LAVs) were staged so that all were orientated in the same direction (True East). These LAVs were placed in three types of environment, 1) open field, 2) deciduous trees and brush, and 3) beneath a pine forest canopy. None of these forests were dense.
Airplane maintenance and schedule issues as well as work action caused delays in conducting the experiment and impacted the experiment in several ways. The incidence angle for the calibration site was smaller than previously planned or desired. In addition, the calibration site at the The Drop Zone in Sector 3 was not imaged for one of the lines. There was however sufficient information from other lines to enable calibration of that line.
2.2 Experiment Objectives, Considerations and Design
The primary objective of this experiment, was to determine if Environment Canada’s C/X SAR airborne platform could acquire InSAR pairs at the baselines required for this study. Provided that this was achievable, the Pol InSAR objectives included: 1) determining forest height from C band data for moderately dense boreal forests using methods [2, 3, 4] currently researched, 2) determining if military targets beneath moderately dense canopies can be detected in C band SAR using Pol InSAR and polarimetric techniques, and 3) develop new Pol InSAR methods which are appropriate for detecting military targets for these types of environmental conditions 4) develop and apply Pol InSAR methods (new and current) for the urban areas on the base.
Secondary experimental objectives, not necessarily related to Pol InSAR or polarimetry included: 1) collection of forest data (e.g. Duschesne forest) for recognition studies using

8 DRDC Ottawa TM 2003-142
PolSAR and data fusion analysis, 2) data fusion analysis for several different types of target (i.e. urban, military vehicles, forests) signatures, and 3) LIDAR analysis.
The LIDAR collected was by GPR Consultants of 85 Chemin Grand Cote, Boisbriand, QC. They also provided GPS data from the local airport for the experiment.
The local CFB ValCartier environment had several attributes which were appropriate for Pol InSAR analysis. In particular, there were considerable topographic variations (mountains to plains) and several forested areas as can be seen in Figure 1 and Figure 2. Three flight lines were chosen so that several of these aspects would be captured in the data. Flight line 1 was the predominate flight line which also captured some of the base infrastructures, while line 2 and line 3 images captured respectively mountainous terrain and the Duschesne Forest.
Three LAVs were made available by CFB ValCartier for this experiment. These vehicles were staged in three different types of environmental conditions: 1) in the open, 2) amongst moderately dense deciduous brush, and 3) under the canopy of a mature pine forest. The pine forest had little underbrush at the forest floor. None of these forests were dense forests as can be seen in the photographs in Figure 3. A person could easily walk through these forests.
In Figure 3, the vehicle in the pine forest is shown (upper right) as well as the view above this vehicle (upper left). The vehicles in the open (lower right) and in the brush (lower left) are also shown. This sortie was Environment Canada’s 01-11 flight [19]. The flight parameters are described in Table 2. Note that the column heading for the ‘site centre incidence angle’ refers to the incidence angle at the new site. The heading of the vehicles was True East. Centre for all lines was N 46° 59.9′and W 71° 31′ (NAD27 308200E and 5200400N) which was the original experiment site before the strike occurred. Intended order of scene acquisitions was 1,2,3,1,2,3, followed by as many line 1 repeats as possible. The Magnetic declination in the area was -17° 58′. Because of the change of plans, due to the strike conditions, the new centre site location was 46° 55′ 18″. The flight was flown as planned with the calibrators altered for the new site.

DRDC Ottawa TM 2003-142 9
Figure 2. Images of the Valcartier site.

10 DRDC Ottawa TM 2003-142
Figure 3. Imaged Cougar vehicles at CFB Valcartier.
Table 2. CFB Valcartier flight parameters.
LINE CENTRE INCIDENCE
ANGLE
SITE INCIDENCE
ANGLE
SAR HEADING
SAR LOOK DIRECTION
RECORDED LINE
LENGTH
(°) (°) (°T) (°T) (nm)
1 58 54 180 270 20
2 40 32 180 270 20
3 58 54 90 180 25
Several calibrators were used in the experiment for two purposes: 1) calibration and 2) Ground Control Points (GCP). The GCPs are required for coregistering the InSAR pairs or data fusion images. The targets and calibration field were in close proximity so that: 1) coregistration of the InSAR pairs could be more accurate, 2) all image data could be well calibrated, and 3) reduce the effort for the limited resources available. Because of the limitations of a small ground crew, the experiment was designed so that few calibrators required changing during the image acquisitions. Only one arc and corner reflector were changed between each flight line. Most of the calibrators were left in a stationary

DRDC Ottawa TM 2003-142 11
position throughout the flight, with at least two corners and one arc aligned for each line. The dominant line had more calibrators. Extra GCP corner reflectors were also constructed for this experiment as shown in Figure 2 (middle right).
2.3 Ground Truthing Ground truthing included the recording of the calibrator and target positions, environmental information (wind speed and direction, temperature, and soil moisture), several photographs documenting the configuration of the experimental site and logs of the events during the acquisition time. The calibration and prime target area of analysis at CFB ValCartier is denoted by the pink circle on Figure 4.
Figure 4. Map of CFB Valcartier.
The positions of the targets, calibrators and other local features are plotted and recorded in Annex A and were based on DGPS measurements from the Trimble Pathfinder system. A SAR image (Figure 5) and LIDAR image (Figure 6) below provides an overview of the area where targets are circled in red. The LIDAR data require further processing, but is shown here to emphasize the topography and target layout. Here, the forested (darker and rougher texture) and plain (lighter and smoother texture) regions are easily distinguished as

12 DRDC Ottawa TM 2003-142
well as the roads, trails, and targets of interest. The side road next to the main road (Route Bernatchez ) is where many of the calibrators were stationed. For calibration purposes, a total of 3 ARCs were deployed so that at least 2 would be visible in any single pass. Unfortunately because of loss of battery power in at least one of the ARCs as well as other problems, in only three of the passes was a single ARC visible. Since an ARC is required for polarimetric calibration, software was written so that the calibration parameters could be calculated for all the passes using only the three passes containing the ARC [20]. It should be noted that promptly at 15:00 Local Time the LAVs departed. The ground truthing also involved several photographs ( examples in Figure 7 ) which documented the environment and target configuration. The photographer notes are found in Annex A. Environmental data (wind and soil moisture) are found in Annex A.

DRDC Ottawa TM 2003-142 13
Figure 5. PolSAR image of CFB Valcartier.

14 DRDC Ottawa TM 2003-142
Figure 6. LIDAR image of the Valcartier calibration site. The red circles indicate where LAVs
were located. The shack is marked. Darker, textured regions are associated with forested areas.

DRDC Ottawa TM 2003-142 15
Figure 7. Examples of ground Truthing photographs at CFB Valcartier.
2.4 Data Quality and Preliminary Results Initial analysis of the PolSAR data indicated data quality problems. In particular, every alternate signal level was below the remaining signal levels. This appeared to be a sampling problem, but it was difficult to determine the source of the problem. In addition, preliminary InSAR analysis of the image data found no observable fringes. However, since this initial analysis, an error has been discovered by CCRS in their data stripper software, which results in channel co-registration errors. Also, there are indications that the observed attributes in the signal data were due to data extraction errors. These data have since been reprocessed and initial examination of the signal and image data quality indicates that the data quality is good. In particular, the images of the targets do not appear saturated, and checks for calibration indicate it is well calibrated. Also, the signal characteristics previously observed no longer are found. These data should be analyzed again, to determine how suitable the data are for Pol InSAR applications. Some of these data ae not well focussed. The targets and calibration field were within the same area, so that any calibration degradation with distance from the calibration site would not be a problem.

16 DRDC Ottawa TM 2003-142
The baseline is the distance between the phase centres of the two antennas that form an interferogram. The component of the baseline perpendicular to the line-of-site is of critical importance in interferometry. If it is too large the interferometric pair will be decorrelated and all phase information will be lost. With the Convair the perpendicular baseline should be around 30 meters or less.
The baselines for the Valcartier flight lines are shown in Annex B. As can be seen there are not many InSAR pairs where the baseline distance is small in the calibration region. However, there are other locations which potentially could be used, provided sufficient Ground Control Points to coregister the image pairs would be available. In particular, the scenes collected data over many forested areas which would be suitable for testing the methods of Cloude and Papathanassiou [3, 4].
The experiment was successful since it indicated that the airborne platform was capable of acquiring data with baselines sufficiently small for this analysis. The probability of acquiring suitable InSAR pairs increases with more passes of the same line. Based on this experiment, decisions were made to proceed with future experiments using this SAR.
In addition, the experiment was successful, since some Pol InSAR pairs are available for analysis, and data are available for PolSAR and data fusion analysis.

DRDC Ottawa TM 2003-142 17
3.0 Cameval Experiment
A CAMouflage EVALuation (CAMEVAL) Trial was designed, as described in [14], to assess image signatures of various camouflage nets over military vehicles. The Cameval experiments took place between June 5 and 8, 2002. Several military vehicles (27), considerable ground truthing and imaging resources were dedicated to this experiment. Several Pol InSAR experiment were included in order to take advantage of this level of coordination efforts.
For this Trial, all of the military targets were staged at the same heading with either no cover or under various combinations of cover (forest canopy and / or a camouflage net). Geo-positional data of these vehicles are documented in detail [14]. Here, aside from a brief introduction of CAMEVAL, the Pol InSAR experiments are presented for Pol InSAR details not documented in [14].
Two Pol InSAR experiments occurred on two dates, June 5 and 8, 2002. The second experiment date was necessitated by the fact that the first flight on June 5 had several airplane and SAR operational problems.
For this section, the following subsections will follow : an introduction and overview, the design and objectives for the Pol InSAR experiment, the ground truthed information not documented in [14], and preliminary data quality and analysis assessment.
3.1 CAMEVAL Overview and Introduction
A brief introduction of the experiment follows. The CAMEVAL Trial took place at CFB Petawawa, ON, (Figure 8). The primary objective of this Trial was to evaluate how well the effect of camouflage nets for different image types. Vehicles were staged at the three sites shown by the circled areas in Figure 8 where cyan, red and pink reference respecively sites 1, 2 and 3. Site 3 was an open field near the experiment coordination centre, where calibrators for the image types collected were also present. Site 1 was an open field adjacent and including a deciduous forest while site 2 was an open field environment adjacent to an evergreen forest. All vehicles were orientated at the same heading (~130 °) so that camouflage effects could be properly evaluated. In order to isolate signature variations between target types and environment conditions, the same vehicle type was staged at sites 1 and, with the exception of the vehicles under the forest canopy. At sites 1 and 2 the vehicles were parked as follows: three vehicles in an open field, three at the forest edge and three underneath a dense forest canopy. For each different environment types, one vehicle of the three had no camouflage net over it. The camouflage net type was not revealed during the experiment.

18 DRDC Ottawa TM 2003-142
In addition, for an Automatic Target Recognition (ATR) experiment, several vehicle types were staged in the open without any cover at site three. One of these vehicles was the same type as staged at sites one and two.
Figure 8. Map of CFB Petawawa indicating study sites.

DRDC Ottawa TM 2003-142 19
3.2 CAMEVAL Objectives and Design for Pol InSAR The CAMEVAL experiment provided ground truthed data opportunities which are rarely available. In particular, several military targets were staged for experimental purposes in various environments. The number of vehicles provided a better statistical sample than normally is available (e.g. the Valcartier experiment only had three vehicles). The primary objectives for the Pol InSAR experiments during the CAMEVAL Trial were :
1. Collect Pol InSAR pairs so that these data can be analyzed using conventional Pol InSAR methods for forest and military target discrimination. This would provide evidence of the Pol InSAR capabilities at frequencies similar to the RADARSAT systems, which so far has not been studied by other research teams. It will also provide evidence of whether these methods are relevant for military applications.
2. Determine if motion can be extracted from PolSAR data as indicated from image analysis results [10]. If this capability is verified then further studies would be required to determine the type of motion extracted and the benefits to the military. This development could lead to another form of Pol InSAR applications.
3. Determine the image recognition loss of polarimetric signatures due to target motion. This would have relevance for polarimetric decomposition methods which extract elemental structural information of the target.
4. Determine if the polarimetric information from a moving target can assist the focussing of an image due to tracking the detection of elemental structures and their orientation in the signal data.
Secondary objectives for the Pol InSAR experiment include:
1. Further development of polarimetric decomposition methods for target recognition applications.
2. The collection of PolSAR forest data and the development of forest recognition applications, for recognizing micro-environments (i.e. bog, wet, dry environments).
Although, the ValCartier and Petawawa experiments were similar, it is anticipated that there will be different results because of the different environment conditions. In particular, the forest densities (both evergreen and deciduous) at CFB Petawawa were denser than the forests at the ValCartier site, and hence provided better target cover. In addition, it is anticipated that results will differ due to the seasonal differences that these images were acquired. For instance, the data at CFB ValCartier was acquired during the autumn when the forest canopies are typically dry. For these conditions, the radar penetration through the canopy is considerably greater than during the spring, when the tree trunks, leaves and needles have higher fluid content. Higher water content in the canopy cover (leaves and tree limbs) are associated with larger dielectric constant effects which contributes to greater backscattering effects. During the image acquisitions at CAMEVAL in early June, 2002, the ground conditions were moist and the leaves and trees were turgid from the available water associated with spring conditions. In addition, the meteorological conditions for the two Trials were

20 DRDC Ottawa TM 2003-142
considerably different. The weather was hot and dry during the CFB ValCartier acquisition, while it was cool, with several rain showers during the Pol InSAR acquisitions at CFB Petawawa. All of these factors can result in dissimilar outcomes despite similar environments and experiments. One line only was designed for the Pol InSAR acquisition flights at Petawawa, in order to increase the chances of acquiring InSAR pairs with the required small baselines (<40m). This line was flown repeatedly, and is shown as line 2 in Table 3. It should be noted that on June 5, a pilot error was made and the heading for the test flight flown on May 24, 2002 was mistakenly switched with the Petawawa flight line heading. The test flight (line 1) and the incorrect flight line (line 3) are shown also on Table 3. This incorrect flight line was flown for pass numbers 1 and 2, on June 5.
Table 3 . Flight line parameters for SAR images (CFB PETAWAWA AND TEST FLIGHT).
LINE HEADING TARGET CENTER
INCIDENCE ANGLE AT TARGET CENTER
SAR LOOK ANGLE
(°) Latitude Longitude (°) Airplane (°)
1 279.6 N 45° 21.4′ W 75° 47.5′ 60.0 Right 9.6
2 220. N 45° 57.4′ W 77° 22.3′ 58.3 Right 310
3 279.6 N 45° 57.4′ W 77° 22.3′ 60.0 Right 9.6
On June 8, the Canada Space Agency (CSA) also had an extra scene flown after the Pol InSAR lines for Pacific Forestry Centre (PFC) studies. The Petawawa region has many planted forests and is therefore suitable for studying forest image signatures. For each Pol InSAR acquisition, a moving target experiment was coordinated in order to satisfy some of the aforementioned objectives. For this experiment, image data of a moving target with a known signature was coordinated. A moving target was staged for every acquisition, provided accurate communication with the airplane was available. For this motion detection experiment, a trihedral corner reflector was mounted with a harness on the back of a pick-up truck. This elemental structure has image characteristics that have a recognizable signature and the chosen target’s Radar Cross Section (RCS) is large so that it would be detectable in most natural environments. When the vehicle was cued, it proceeded at a near constant velocity while GPS information was collected, so that positional and velocity data were recorded as a function of time. Due to the small velocities, maintaining a constant velocity was difficult to obtain, as can be observed in in Annex C. There were several objectives related to velocity for this experiment (see Section 3.2, No. 2, 3, 4). The target used (i.e. trihedral) was appropriate for two of these objectives only. In particular, this target was suitable for studying the polarimetric information from a target while it is in motion, with particular emphasis on the detection of shapes. However this target

DRDC Ottawa TM 2003-142 21
was not appropriate for extracting motion information from PolSAR data as described in [1, 10], because trihedral signature effects are in the copolarized channels, while the anticipated velocity effects are detectable in the cross-polarized channels. However, at the time, it was the only target available for the experiment, and it was anticipated that some cross-polarized backscattering from the vehicle would be perceived while the trihedral signature would provide identification for the target. Subsequent to this experiment dihedral calibrators, which are more suitable for verifying velocity capabilities when orientated correctly, were built and used for the final experiment documented here.
3.3 Ground Truthing An extensive ground truthing effort recorded attributes, as well as spatial and temporal information regarding the staged vehicles, targets of opportunity and the environment. Most of this information is documented in [14]. A brief overview of the ground truthing will be introduced here and will be followed by the ground truthing information for the Pol InSAR experiments that were not covered extensively in [14]. Positional data were collected for the four corners of the staged vehicles, as well as calibrators and GCPs. The accuracy and collection of this data were dependent on the availability of the geopositioning satellites as well as environmental interference (e.g. positions were difficult to obtain when under a forest canopy or near a building). If conditions were optimal, positional accuracy was within about 1cm using Real Time Kinematic (RTK) GPS systems. Environmental information collected included : wind speed, wind direction, maximum wind speed, and soil moisture. An Azhtek Z12 GPS base station collected geopositional data for determining the DGPS of the SAR, which would later be implemented for the SAR motion compensation processor. Hand held GPS data also collected positional information. An extensive number of photographs were collected to document the surrounding environment and experiment set up. Calibrators were set up at site three so that polarimetric and radiometric calibration of the SAR image data could be possible. GCPs were positioned at all sites. Clusters of these GCPs were arranged together so that there would be a GCP orientated for each of the several SAR acquisition lines (Figure 9). The Pol INSAR ground truthed information follows and is mostly associated with the moving target experiment.

22 DRDC Ottawa TM 2003-142
Figure 9. Ground control points at CFB Petawawa.
For this experiment a calibration target (trihedral) was placed on the back of a pickup truck and orientated (as described in Annex C) towards the SAR look direction for the mean incidence angle of the road. As the SAR approached the site, the ground crew were cued and the vehicle proceeded along Clement Lake Road (mean heading of 332 degrees True North) in the northward direction at a near constant velocity until the road’s end was approached. A GPS receiver was attached to the truck and recorded positional and temporal data, so that verification of the vehicle velocity and position could be made. Figure 10 demonstrates the moving target set up. Compasses were not used for orientation since the vehicle distorted the magnetic signal. Instead, the corner was rotated an appropriate number of degrees in the harness so that it would be facing the SAR look direction. The elevation of the corner reflector was also adjusted for a mean incidence angle along the road. These orientation angles for the corner reflector as well as the harness set up are documented further in Annex C. Unfortunately, this procedure did not work well when other activity on the airplane conflicted with communication to the vehicle. This was a particular problem on June 5 when many airplane and SAR operational problems occurred.

DRDC Ottawa TM 2003-142 23
Figure 10. Moving Target experiment set up.
This motion detection experiment was conducted on June 5 and June 8, 2002. Because of the confusion associated with airplane and SAR problems on June 5, communication was poor and it was difficult to coordinate the target motion experiment with the data acquisition. On June 8, the experiment went smoother and more data were acquired. This experiment requires good coordination between the airborne platform and the ground crew operating the moving targets. One aspect which constrains the success of these experiments is that the scientists are unable to communicate with the ground. Communication is through the pilot only after being informed by a SAR technician. Yet, both of these personnel have other duties with higher priority. Consequently, if there are other flight related priorities on the airplane, the experiment gets inferior attention. It is recommended that scientists aboard the plane acquire communication capabilities for these experiments. Below, in Table 4 and Table 5, the moving target intervals and speeds are compared with SAR acquisition intervals for quick reference. Note that column headings L and P refer to Line and Pass numbers. Also note that UT refers to Universal Time, which was four hours greater than the local time. In Table 4, there are occasionally 2 estimates for the moving target intervals. The top estimate is related to the vehicle moving for the experiment, while the lower estimate is related to recorded GPS data since GPS reception was poor that day. Here, line 2 relates to Table 3, but in the flight logs the reference was to line 1 instead. The referenced lines here are different to avoid confusion, since the incorrectly flown line was also referenced as line 1.

24 DRDC Ottawa TM 2003-142
Table 4. Moving Target time intervals RELATIVE to SAR image acquisition time ON JUNE 5, 2002.
SCENE MOVING TARGET INTERVAL
(LOCAL TIME)
SAR SCENE RECORD TIMES
(UT) L P Start Time
(HH:MM:SS-DD) End Time
(HH:MM:SS-DD) Speed (Kph)
Start Time (HH:MM:SS-DD)
End Time (HH:MM:SS-DD)
1 1 18:45:16 18:48:30 10 22:41:20 – 05 22:48:47 – 05
1 2 19:10:13 19:19:48 10 23:14:05 – 05 23:22:23 – 05
2 3 20:05
20:05:57
20:09:07 10 00:02:25 – 06 00:09:36 – 06
2 4 20:21:30 20:33
20:33:42
10 00:30:25 – 06 00:36:35 – 06
2 5 20:51:30
20:51:37
20:55:41
20:55:39
5 00:52:23 – 06 00:59:01 – 06
2 6 21:13:30
21:13:23
21:20:55
21:19:43
10 01:13:51 – 06 01:21:10 – 06
2 7 21:36:30
21:39:28
21:41:55 15 01:37:09 – 06 01:43:47 – 06
Table 5. Moving target interval relative to SAR acquisition time on June 8, 2002.
SCENE MOVING TARGET INTERVAL
(LOCAL TIME)
SAR SCENE RECORD TIMES
(UT) L P Time Lead-in Time Line End Speed
(Kph) Begin Time End Time
2 1 09:28:25 09:41:00 10 13:35:19 13:40:25
2 2 09:57:30 10:03:35 5 13:57:37 14:03:15
2 3 10:14:15 10:28:45 15 14:22:34 14:28:15
2 4 10:43:00 10:54:40 10 14:48:24 14:54:10
2 5 11:10:00 11:20:05 5 15:13:36 15:19:20
2 6 11:31:25 11:41:00 15 15:35:28 15:41:03
2 7 11:54:50 12:05:30 10 15:59:36 16:05:01
2 8 12:19:20 12:29:20 5 16:23:43 16:28:55
2 9 12:40:30 12:50:30 15 16:44:46 16:50:00

DRDC Ottawa TM 2003-142 25
These GPS data are collected and available for analysis; one example is shown in Annex C. Several of these passes can likely be used for analysis as demonstrated in the above tables. Further notes from the SAR aircraft platform and the ground crew are provided in Annex C, where events during the experiment are documented. Other potential targets of opportunity associated with exercises on the base are also captured in these logged notes. For these Pol InSAR experiments the calibration corner reflector and ARC orientation angles are found in Annex C. During both Pol InSAR acquisition days (June 5 and 8), there was a significant amount of rain. On June 5, as the SAR acquisitions began, the weather became calm and the rain stopped. This was perfect for Pol InSAR acquisitions, but unfortunately, problems on the aircraft required another data collection. Weather data and soil moisture information for June 5 were collected and are documented in [14]. Since the SAR acquisition on June 8 was scheduled late, many of the resources were not available for the June 8 SAR acquisitions, reducing the collection of environmental data. On June 8, there was a constant drizzle. One artefact of this was that some of the calibrators’ signatures were likely affected by this. One ARC became dimmer in the real time image data monitored on the aircraft, which was attributed to the rain. This was confirmed after the experiment when it was found that some of the plastic covers for the ARC horns had come off letting water get inside the ARC horns. Also, some of the corner reflectors (which often have a hole at the apex) were not draining and had a thin layer of water at the bottom.
3.4 Data Quality Initial analysis of the data indicates that the data are of good quality. However, some of the scenes are poorly focused and it is apparent that the azimuthal sampling is not consistent. There is very little saturation and tests indicate that the calibrated values are good near the calibration field for most of the scenes. Because of poor focussing in some of the scenes, some of the calibrators interfere with each other, producing ambiguous calibration results. However, the calibration parameters were fairly constant throughout the experiment. Therefore, for scenes with this poor focussing attribute, the calibration parameters from the previous line could be used for calibration. Since the incidence angle does not vary excessively over the imaged area of interest, it is anticipated that the calibration for all analysis regions will be satisfactory.
3.5 Preliminary Data Analysis
The Cameval data has been processed and single channel interferograms (Figure 11) have been produced for these scenes. Some of the scenes are poorly focussed and currently the motion compensation processing is being examined. Future improvements to the SAR processor may be required.

26 DRDC Ottawa TM 2003-142
Figure 11. Interferogram (single channel) for June 8 InSAR pairs.
The calculated baselines are shown in Annex D. Here, it is found that there are several scenes where the baselines are suitable for Pol InSAR analysis.

DRDC Ottawa TM 2003-142 27
4.0 Ottawa Valley Urban Environment Trial
The Ottawa valley Trial took place on September 24, 2002. There were many experiments during this trial in order to consider the several objectives associated with the Pol InSAR Project. A primary incentive for this experiment was to capture image data containing urban signatures for testing polarimetric and Pol InSAR analysis techniques. In addition, a more complete motion detection experiment was planned with more suitable targets than were available for the CAMEVAL experiment.
The calibration and moving target experiment occurred near the Connaught Ranges and the Shirley’s Bay campus where DRDC-Ottawa is located (Figure 12).
Ground truthing included collecting environmental data and geographic positions of key calibrators, targets and sites. In addition, environmental features and unusual structural features found in the experimental areas of interest during the SAR data acquisitions were captured with photographs.
Following this introduction are subsections relating to the Experiment Design and Objectives, Ground Truthing, Data Evaluation and early results.

28 DRDC Ottawa TM 2003-142
Figure 12. Map of Connaught Ranges, Ottawa. Pink and green circled areas denote moving target experiment and calibration locations.

DRDC Ottawa TM 2003-142 29
4.1 Experiment Design and Objectives
Several experiments were associated with this Trial. Because of personnel availability the trial was restricted to the trial date which constrained what could be accomplished for the experiment.
Most of the experiments for this trial were the fruition of work and resources associated with the Pol InSAR TIF. Below are some of the key considerations which are documented further in [1] :
1. In order to study and exploit Pol InSAR capabilities, good polarimetric calibration practises and methods are required. It is for this reason, that funds and resources were devoted towards the acquisition of DRDC’s own calibrators. In particular, ARCs were produced at DRDC in order to acquire internal expertise with the equipment at the laboratory so that better calibration validation could be possible, and have sufficient independence to calibrate other sensors, such as RADARSAT 2. This is necessitated by the fact that the calibration method proposed for RADARSAT 2 may not be sufficient for the applications of interest to the client. Although this system was not fully completed for this experiment, key functions were tested.
2. Testing current Pol InSAR methods with these C-band data. There are several forests, including single species forests within the Ottawa valley greenbelt area, which would be suitable for this analysis. DRDC’s previous studies [21] indicate that classification of some vegetation types (such as evergreen forests), is possible using polarimetric data and analysis methods.
3. Determine if velocity information can be extracted from PolSAR data. A type of analysis, similar to Along Track InSAR [e.g. 22, 23], produces results indicative of motion information from the cross-polarized data. Features which infer this attribute are based on natural ocean features for single [11] and polarimetric [10] data. However, a proper validation of this attribute is required through a moving target experiment. For this trial a moving target experiment was conducted in order to determine if velocity features are visible and in order to understand the SAR phenomena observed. Initial trial plans included the collection of an Along Track Insar data set for comparison with the PolSAR motion detection results.
4. A moving target experiment (associated with 3 above) was developed in order to ascertain the polarimetric information loss due to target motion. Of particular interest, is whether imaged target signatures with large target-to-clutter ratio (TCR), provide a memory of the motion (sampled in the SAR ‘slow time’ signal data) which can be used for target recognition and motion detection. This is obviously a multi-parameter study which is dependent on many items such as target size, speed, RCS, and the specifications of a SAR system. This pertains to the use of polarimetric decomposition methods since they are more relevant for recognizing military targets through the spatial detection of elemental structures. However, limitations to these

30 DRDC Ottawa TM 2003-142
methods require further analysis. Objections have been made that these polarimetric decomposition methods are not possible for maritime environments due to the motion of these vessels. The goals for this portion of the experiment is to determine and demonstrate the loss of polarimetric information with target motion, and alternatively to ascertain if the polarimetric information available in the signal data may assist the velocity analysis for conditions when a dominant feature can be tracked in time. This has relevance for moving target systems, since recognition of a structure type could assist and complement the velocity analysis as well as provide additional information for recognition analysis. An Along-Track InSAR flight line was scheduled for this trial in order to compare the velocity measurements with the PolSAR velocity results.
5. Another key consideration of this trial was to collect sufficient urban data for Pol InSAR applications. These urban areas are difficult areas to study since, unlike most topography, building edges have abrupt, discontinuous surface attributes, (i.e. Heaviside functions) which are difficult to analyze using conventional InSAR methods. The Earth’s topographic surface, in contrast, is typically characterized by continuous functions with relatively small gradients. Standard InSAR analysis methods, currently implemented, are appropriate for continuous surfaces often found in nature. The same analysis methods do not provide good estimates for the urban landscape, particularly since estimates are calculated from phase differences averaged over large areas (several pixels). New methods, such as studied for this TIF [1], incorporate the use of models for assisting these InSAR methods. Many urban environments in the Ottawa valley were imaged for these purposes.
6. Provide a database for studying recognition methods for military targets and the urban environment.
7. Study standard Pol InSAR methods in the urban environment, for applications which would benefit from this type of analysis.
8. Develop new Pol InSAR methods [1] for applications such as detecting tall obstructions like the antennas at Shirleys Bay, Ottawa.
4.1.1 Flight Plans The flight plan for this experiment was essentially the same line repeated several times which would capture data relevant for all the experiments described above. The flight parameters are described in Table 6. These two lines are essentially identical, except they are in different modes (i.e. PolSAR and Along-Track InSAR). This was to satisfy the 4th experiment defined in Section 4.1. The calibration parameters for these flight lines are recorded in Annex F.
DRDC Ottawa TM 2003-142 31
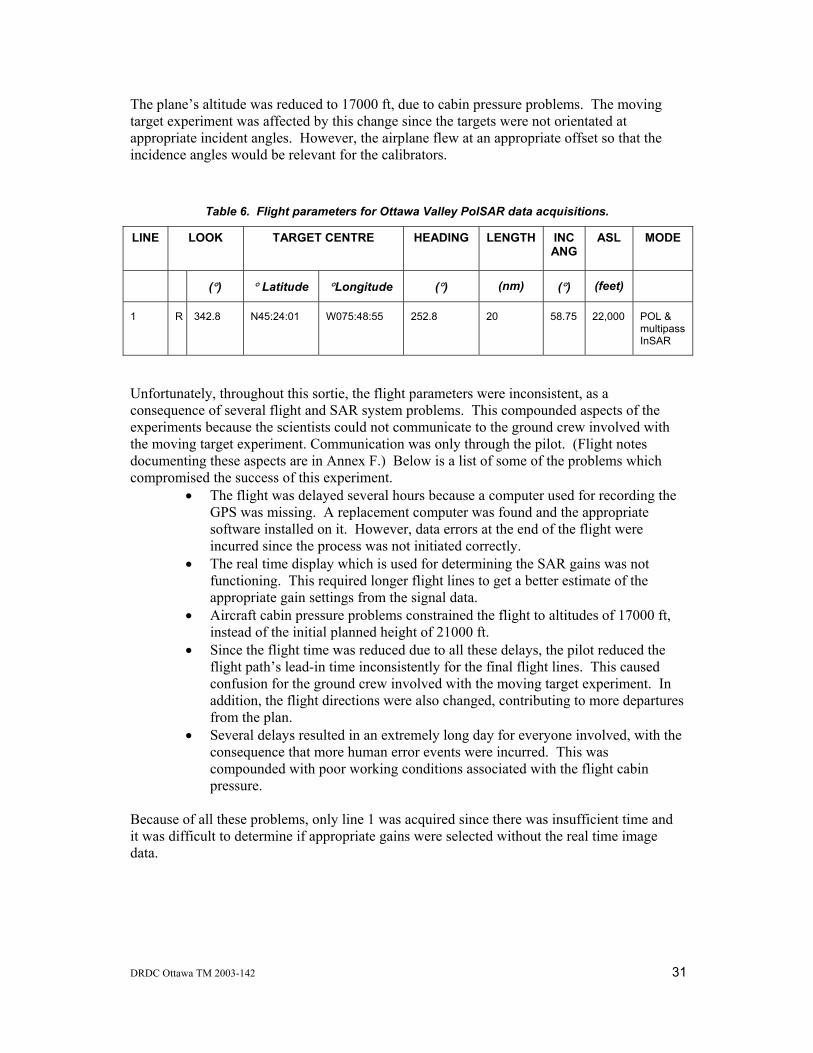
The plane’s altitude was reduced to 17000 ft, due to cabin pressure problems. The moving target experiment was affected by this change since the targets were not orientated at appropriate incident angles. However, the airplane flew at an appropriate offset so that the incidence angles would be relevant for the calibrators.
Table 6. Flight parameters for Ottawa Valley PolSAR data acquisitions.
LINE
LOOK TARGET CENTRE HEADING LENGTH INC ANG
ASL MODE
(°) ° Latitude °Longitude (°) (nm) (°) (feet)
1 R 342.8 N45:24:01 W075:48:55 252.8 20 58.75 22,000 POL & multipass InSAR
Unfortunately, throughout this sortie, the flight parameters were inconsistent, as a consequence of several flight and SAR system problems. This compounded aspects of the experiments because the scientists could not communicate to the ground crew involved with the moving target experiment. Communication was only through the pilot. (Flight notes documenting these aspects are in Annex F.) Below is a list of some of the problems which compromised the success of this experiment.
• The flight was delayed several hours because a computer used for recording the GPS was missing. A replacement computer was found and the appropriate software installed on it. However, data errors at the end of the flight were incurred since the process was not initiated correctly.
• The real time display which is used for determining the SAR gains was not functioning. This required longer flight lines to get a better estimate of the appropriate gain settings from the signal data.
• Aircraft cabin pressure problems constrained the flight to altitudes of 17000 ft, instead of the initial planned height of 21000 ft.
• Since the flight time was reduced due to all these delays, the pilot reduced the flight path’s lead-in time inconsistently for the final flight lines. This caused confusion for the ground crew involved with the moving target experiment. In addition, the flight directions were also changed, contributing to more departures from the plan.
• Several delays resulted in an extremely long day for everyone involved, with the consequence that more human error events were incurred. This was compounded with poor working conditions associated with the flight cabin pressure.
Because of all these problems, only line 1 was acquired since there was insufficient time and it was difficult to determine if appropriate gains were selected without the real time image data.

32 DRDC Ottawa TM 2003-142
4.1.2 Calibration The permanently stationed trihedral corner reflector calibrators Connaught Ranges, in Ottawa were used for calibration. At this site, the smaller corner reflectors were implemented since this size is more appropriate for airborne systems. Annex F contains documentation of the calibrators at this site. Two ARCs were also deployed. The GPS locations of these calibrators and the ARCs are documented in Annex F. Calibration orientation angles and logged notes are documented there also.
4.2 Ground Truthed Data The separate experiments conducted for this trial as well as the several forms of ground truthing are discussed here in separate sub-sections. As aforementioned, one flight line was repeated several times in order increase the chances of acquiring suitable InSAR pairs with small baseline distances (<40m). Other constraints for this analysis is flight stability, which is usually possible with mild wind conditions. Since the trial emphasis included capturing urban environments, the line was designed to image the following key urban sites :
• The parliament buildings, museum buildings and other buildings in downtown Ottawa. This environment offers a wide range of building shapes, sizes and densities.
• Tunney’s Pasture which is a district in Ottawa, where several federal government buildings of various sizes and shapes are located.
• Westboro district in Ottawa which is an older (early 20th century) urban area with modest sized office and commercial buildings of various ages and styles.
• DRDC-Ottawa site and CFB Connaught which are situated in the western part of the Greater Ottawa Region. This area contains both small buildings and several antennas that are suitable for studying image detection capabilities of high obstructions.
Unfortunately several aspects of the experiment were undermined due to the problems associated with the aircraft and SAR system. There are several reasons for this, but ultimately, many of the problems are due to insufficient funding of the SAR system. Its continued operation is largely due to the dedication of a handful of scientists and technicians.
4.2.1 DRDC ARC test The DRDC ARC was set up just north of Building T86 at Shirley’s Bay campus where DRDC-Ottawa is located. Its image signature (dash like feature in the Range dimension) can be observed in the PolSAR image (Figure 13) where Range is the vertical axis and azimuth is along the horizontal axis. The system set up for the experiment is shown in Figure 14. Logged notes during this test are documented in Annex F.

DRDC Ottawa TM 2003-142 33
The test was successful to the extent that its signature is observed in the finished calibrated SAR image. However, analyses of these data indicate that the HH polarization for the first recirculation is much larger than anticipated by theory. This is suggestive of a dipole effect that may be associated with diffraction effects from the crossbar brace. Alternatively, coupling effects or interference between the two horns may also be the source of this problem. Further experiments which isolate the source of this anomaly are required.
Figure 13. PolSAR image which contains ARC signature.
Future work will test this ARC with other SAR systems (RADARSAT 2 and ENVISAT) and for several environments.
This system was designed to be transportable so that : 1) independent calibration parameters may be determined at a given site and 2) the SAR beam pattern can be verified independently at several incident angles. Typically, calibration parameters are only relevant for the calibration location and do not represent the calibration well at other incidence angles unless the system’s range-dependent characteristics are well known and stable. This portable system provides a method for verifying and monitoring range dependent calibration parameters. A more sophisticated ARC developed at DRDC by Dr. Chuck Livingstone for RADARSAT 2 [23] which is not portable could complement experiments if used with these portable ARCs. Future developments require the development of software and hardware for storing a SAR beam pattern. In addition, the packaging of this equipment for easy deployment will be required.

34 DRDC Ottawa TM 2003-142
Figure 14. Testing of DRDC-Ottawa ARC.
4.2.2 Velocity Experiment This experiment was designed so that cued targets moving at a constant velocity would be captured in the PolSAR imagery. This requires coordination between the SAR platform and the ground crew driving the moving targets. Provided communication was adequate and the plans were not changed, these moving targets would be captured in the imagery. A straight road with a constant orientation and little traffic (Rifle Road, shown in Figure 12) was chosen so that it was nearly perpendicular to the flight path and sufficiently long enough so that if any minor errors occurred, the moving vehicles would still be imaged. Rifle Road is on the east side of CFB Connaught Range, near Shirleys Bay Campus (DRDC-Ottawa) on the west side of the Greater Ottawa Regional District. The heading of Rifle Road was ~338°. Four trucks were used in this experiment. Different elemental structures (e.g. dihedral, trihedral) were attached to each truck with a harness in order to keep these structures at a constant position relative to the truck while the trucks were in motion. This harness arrangement is described further in Annex F. Ground truthed photographs in Figure 15 and Figure 16 demonstrate aspects of the experiment. The elemental structures were orientated at angles optimal for the SAR acquisition as documented also in Annex F. However, as aforementioned, the SAR platform’s altitude change altered the incidence angle for these moving targets so that these orientations were suboptimal. GPS data were collected on each

DRDC Ottawa TM 2003-142 35
vehicle using Trimble Pathfinder systems so that position and velocity could be recorded as a function of time. The elemental structures on the back of the trucks were:
1. a dihedral at an orientation of 45° relative to a z-x plane where z is altitude and x is aligned with the rear of the truck and is parallel to the ground. Dihedrals orientated at +/-45° provide large cross polarized returns to the SAR. This was appropriate for determining if velocity information is available in PolSAR data (dependent on phase difference between the cross-polarized channels).
2. a dihedral at an orientation of -45° relative to the z-x plane. See 1 above. 3. a trihedral corner reflector was chosen since it is detected in the co-polarized channels
and provides large Radar Cross Section (RCS) values. 4. a grate (see Figure 15 and Figure 16) was chosen because it was observed that some
grates appeared to provide a dipole signature. However, for this experiment, the grate strips on this grid may have been too wide for the wavelength and might not have provided the anticipated effect. Nevertheless the effect from this grate is an example of a repeated small structure which is moving. In nature, other examples are, for instance, the effect of capillary surface tension waves on the ocean surface from which ocean currents have been determined using along track InSAR methods [22].
When the ground crew was cued, the convoy of vehicles, as described above, proceeded at a separation distance of about 50 m along Rifle Road (formerly Range Road) as shown by the front and back views on the left side of Figure 15. As aforementioned, the airborne platform and SAR system problems resulted in inconsistent flight paths as well as changes in the flight parameters. Since the communication between the scientists and the ground was limited, the timing of the moving targets with the SAR acquisition was much more difficult to obtain. For future experiments like this, it is recommended that the scientists have access to radio communication with the ground. A longer road may be another solution. However, if the road is too long, the incidence angle from the SAR may vary too much along the road for the moving targets’ configuration (i.e. elevation angle of elemental scatterer). Table 7 below, documents the convoy start and finish times as they proceeded down Rifle Road. The image acquisition times are also documented there. The effect of poor communication with the ground is evident since some of the scenes did not coincide with this moving vehicle convoy. In order to provide a backup to this experiment, targets of opportunity were also monitored at March Road, which is further west of Connaught Range. Two parts of the road were filmed at a measured distance apart. An estimate of a passing vehicle’s velocity could then be made based on the distance between the two filming stations and the time recorded on the video (see Figure 15, upper right photograph).

36 DRDC Ottawa TM 2003-142
Figure 15. Photographs documenting the moving target experiment.

DRDC Ottawa TM 2003-142 37
Figure 16. Examples of moving targets set up (dihedral and grate).
Table 7. Moving Target interval times relative to SAR image acquisition.
P SPEED LEAD VEHICLE DEPARTS
LEAD VEHICLE FINISH
LAST VEHICLE FINISH
SAR ACQUISITION TIMES
(kph) (LT) (LT) (LT) (UT) Test 20 12:40:42 12:46:18 1 30 13:05:58 13:10:08 13:10:33 17:09:44 17:14:13
2 35 13:37:48 13:41:20 13:41:49 17:39:10 17:43:12
3 20 14:09:18 14:14:53 14:15:18 18:10:50 18:15:35
4 30 14:37:48 14:41:48 14:42:15 18:37:38 18:42:32
5 35 15:04:43 15:08:16 15:08:48 19:05:07 19:09:25
6 20 15:31:03 15:36:33 15:37:13 19:30:58 19:35:50
7 30 15:54:53 15:58:50 15:59:21 19:54:39 19:59:20
8 35 16:20:18 16:23:48 16:24:18 20:20:50 20:25:43

38 DRDC Ottawa TM 2003-142
Note : P, LT and UT represent repectively Pass number, Local Time and Universal Time. At the time of the expeirment there was 4 hours between local and universal time.
During the experiment, vehicles unrelated to the moving target experiment passed the convoy. These occurrences are logged in Annex F.
4.2.3 Ground Truthed Photographs A major objective of this experiment was to collect image data of urban signatures so that Pol InSAR applications could be examined for urban environments. Key urban areas of interest were photographed that day in order to capture any events out of the ordinary for selected buildings and areas of interest, that were imaged. For instance, scaffolding on the side of a building that was selected for analysis, would be documented and photographed (e.g. Figure 17 and Figure 18). In addition, extensive photographs of primary buildings of interest, were photographed so that the surrounding environment, during the imaging time, could be captured in photographs (e.g. Figure 19 and Figure 20). In addition to the key areas listed in Section 4.1.1, photographs were taken of the calibration areas, tall antennas (e.g. Figure 21 ) and the other experiments such as the velocity experiment. DRDC photographs recorded during the experiment image acquisition are documented further in Annex F. Subsequent to the experiment, buildings of interest have been ground truthed further (e.g. Figure 22 and Figure 23) and these additional ground truthed photographs are documented also in Annex F. In particular, buildings at Tunney’s pasture are of interest and can be referred to from the map in Figure 24.
Figure 17. Ground truthed photographs of scaffolded building for urban analysis.

DRDC Ottawa TM 2003-142 39
Figure 18. Ground truthed photograph of construction in Ottawa urban area.

40 DRDC Ottawa TM 2003-142
Figure 19. Urban buildings in downtown Ottawa.
Figure 20. Ottawa urban areas of Westboro and Tunney's Pasture.

DRDC Ottawa TM 2003-142 41
Figure 21. Antennas at Shirley's Bay captured in PolSAR images.
Figure 22. An example of a moderate sized building at Tunney's Pasture.

42 DRDC Ottawa TM 2003-142
Figure 23. Tunney's Pasture Health Canada Building.

DRDC Ottawa TM 2003-142 43
Figure 24. Map of buildings at Tunney's Pasture.

44 DRDC Ottawa TM 2003-142
4.2.4 Environmental Data Environmental data were collected during the image acquisition and included weather data such as wind speed direction and speed, wind gust information. Soil moisture measurements were collected at the calibration site. These are documented in Annex F. Ashtek GPS data were collected for motion compensation analysis for the SAR processor. In addition, GPS data from the NRCAN stations were also ordered (Algonquin station was the only one received).
4.2.5 Lessons Learned from this experiment The velocity experiment is a key experiment which has been difficult to coordinate because the scientists on board the plane cannot communicate directly with the ground crew. It is advisable for future experiments like this, that the scientists have access to the communication in the air since the timing should be as precise as possible. Currently this is not achievable since the notification is a two stage process from the technicians to the pilot before ground communication is possible. Both technicians and pilot personnel have other duties which often take priority and conflict with this communication. Therefore it is essential that the scientists on board provide the communication. An alternative solution is that a longer road be found for these experiments. However, this has restrictions in terms of the incidence angle as a function of range. The road used in this experiment was about twice as long as required, but with poor communication and flight changes, it was difficult to coordinate everything correctly. In addition, the incidence angle was different than anticipated because of the SAR’s platform altitude change and inconsistent cuing times. It should also be noted that several other problems with the SAR and aircraft platform also affected the experiment outcome. In part, these problems are related to the lack of support for this SAR system.
4.3 Data Quality and Analysis An initial data quality concern was that the urban data acquisitions may be saturated. Usually the real time image data provides immediate image quality feedback which assists the scientists selection of signal gains in order to ameliorate the saturation levels for the target of interest. Unfortunately it was not known until the airplane was airborne that the real time image data was not available. Initial data quality analysis of the data indicate that there is modest saturation of the building signatures which should be appropriate for these applications. The unfortunate aspect of this is that the dynamic range is small for targets with smaller RCS returns. This artifact could be altered with minor improvements to the SAR’s data acquisition system. Baseline calculations are in Annex G. These indicate that there may be at least two or three possible Pol InSAR pairs available for analysis.

DRDC Ottawa TM 2003-142 45
Initial analysis of the velocity data also indicates that the selected road may not be appropriate for this type of velocity analysis since the road was adjacent to forests and the cross-channel data’s signal is often smaller than the other channels. The forest signatures can obscure the signal which is being analyzed. Future experiments like this should be conducted on roads where the landscape is flat and dry with little vegetation.
As previously mentioned, the platform’s altitude change had the ramification that the target orientations on the back of the pick-up trucks were no longer appropriate.
More details regarding motion analysis from PolSAR data are documented below.
4.3.1 Motion Analysis
As described in [10], there is evidence that motion may be detected from the two PolSAR cross-channels by determining a phase interferogram between the HV and VH polarizations. The phase interferogram provides a measure of velocity for Along Track InSAR methods, provided that the Signal to Noise Ratio (SNR) is sufficiently large. The objective of the motion detection experiment conducted for this trial, is to determine if velocity information is available in these cross-polarized channels. There is circumstantial evidence of motion from initial analysis of these data, and this is documented below. Further, more extensive work is required to validate these observations.
In general, the backscatter from cross-channel image data is generally smaller than from co-polarized channels. With small backscatter signatures, the SNR in the data can be small, resulting in large phase noise errors. These effects are observed in the PolSAR data collected for this Trial, as seen in Figure 25. In particular, observe the larger, speckly phases in the cross-channel phase interferogram, where backscatter levels are low (e.g. roads, flat fields).
In the image examples shown below, there are also signatures indicative of a moving target where the backscatter return is high and smeared in azimuth (Figure 26). This
signature was captured when the staged targets were far from this location. In addition, there appears to be a cross-channel phase interferogram signature at the same location. This circumstantial evidence is indicative of motion information that
may be available in the PolSAR data. The future challenge will be to determine what motion information is available (i.e. is it velocity in range or azimuth, is it
acceleration), or alternatively, what is the phenomenology observed in these images.
Figure 27 compares data without (pass 4 and 6) and with (pass 1 and 7) this motion signature. These observed signatures are near the intersection of Rifle Road and Carling Avenue, in Ottawa, ON. On Carling Avenue, the average vehicle speed is about 100 kph, while on Rifle Road the speed is about 60 kph. Since this signature was observed in several images, near this intersection, it is likely that the observed motion signatures are associated with velocities (in the SAR azimuthal direction), or acceleration (in the SAR radial direction) at the intersection of these two roads.
More extensive work will be required to fully understand this phenomenon.

46 DRDC Ottawa TM 2003-142
Figure 25. PolSAR image (upper) and phase interferogram (lower) for pass 6, Sept 24.

DRDC Ottawa TM 2003-142 47
Figure 26. PolSAR and phase interferogram for pass 1, September 24.

48 DRDC Ottawa TM 2003-142
Figure 27. Phase interferograms (left) and images for passes 1, 6, 7, and 4 (from top).

DRDC Ottawa TM 2003-142 49
References
1. Yeremy, M. L. (2003). Polarimetric Interferometric SAR: Literature Review and an Assessment of its utility for DND. DRDC Ottawa TM 2003-xxx. Defence R&D Canada – Ottawa.
2. Papathanassiou, K. P., (1999). Polarimetric SAR Interferometry, Doctoral Thesis, University Graz, 1999, pp 131.
3. Papathanassiou, K. P. and Cloude, S., (2001). Single-baseline Polarimetric SAR Interferometry, IEEE Trans. Geosc. & Rem. Sens., Vol 39, No 11. pp. 2352—2363.
4. Cloude, S. R. and Papathanassiou, S. R., (1998). Polarimetric SAR Interferometry, IEEE Trans. Geosc. & Rem. Sens., Vol 36, No 5, pp. 1551—1565.
5. Cloude, S. R. and Pottier, E., (1997). An Entropy based classification scheme for land applications of Polarimetric SAR, IEEE Trans. Geosc. & Rem. Sens., Vol 35, No 1, pp.68—78.
6. Cloude S. R. and Pottier, E., (1996). A Review of target decomposition theorems in radar polarimetry, IEEE Trans. Geosc. & Rem. Sens., Vol 34, No 2, pp.498—518.
7. Ryerson, R.A., Ed. (1998). Principles and Applications of Imaging Radar, Vol 2 of Manual of Remote Sensing. 3rd Ed. John Wiley and Sons, NY.
8. Mott, R. (1992). Antennas for Radar and Communications, A Polarimetric Approach. John Wiley and Sons, NY.
9. Franceschetti, G. and Lanari, R.(1999). Synthetic Aperture Radar Processing. CRC Press LLC.
10. Yeremy M. L., “Velocity estimates from fully polarimetric SAR”, IGARSS02 Proceedings, Toronto, ON, (2002), pp. 3.
11. Fitch, J.P., (1991). The single antenna interferometer, IEEE Conference on Acoustics, Speed, and Signals, Toronto, ON, pp 2573- 2576.
12. Cameron, W.L., Youssef, N.N. and Leung, L.K., (1996). Simulated polarimetric signatures of primitive geometric shapes, IEEE Transactions on Geoscience and Remote Sensing, Vol. 34, No. 5, pp. 793-803.
13. Cameron, W.L. and Leung, L.K. (1992). Identification of elemental scatter responses in high-resolution ISAR and SAR signature measurements Secondes Journees Internationales de la Polarimetrie Radar, IRESTE, Nantes, France, Sept 8-10, 1992, pp. 196-212.
14. Secker, J., English, R. A., Yeremy, M. L., and Levesque, J., (2002). CAMEVAL-2002 Land forces signature reduction trial : Ground truthing, calibration and multi-sensor data acquisition for DRDC experiments, DRDC-Ottawa Technical Memorandum 2002-121, pp 68.
15. Livingstone, C.E., Gray, A.L., Hawkins, R.K., Vachon, P., Lukowski, T.I., and Lalonde, M. (1995). The CCRS Airborne SAR Systems: Radar for Remote Sensing Research. Canadian Jr. of Rem. Sens., vol 21, no 4, pp 468—491.
16. Ulander, L. M. H., Hawkins, R. K. and Livingstone, C. E., (1991). Absolute calibration of the CCRS SAR, IEEE Trans. Geosc. & Rem. Sens., Vol 29, No 6, pp. 992-933.
17. Dragosevic, M., (2001). New procedure for generating calibration constants for Convair C-band Polarimetric data, for DRDC-Ottawa contract by D. Thorp Consultants, Ottawa, ON,

50 DRDC Ottawa TM 2003-142
18. Murnaghan, K. (2001). Convair 580 C-Band PolSAR Data Processing. For DRDC-Ottawa contract by Integrated Computation, Ottawa, ON, pp 67.
19. Hawkins, R. K., Percy, D., Murnaghan, K. P., Charbonneau, F., (2001). Flight notes and ground calibration from September 2001 SAR-580 Deployments: Quebec, PEI, New Brunswick, Halifax, CCRS Technical Note 2001-017,
20. Seymour, M. D., (2002). Combining calibration parameters from multiple SAR passes for the CV-580, for DRDC-Ottawa contract w7714-01-0510 byVantage Point International, Ottawa, ON, pp 7.
21. Walter, G. and Yeremy, M., (2002). Comparison of several polarimetric classification methods for several environments, DREO document in review.
22. Campbell, J. W. M., Gray, A. L., Mattar, K. E., Clarke, J. H., and van der Kooij, M. W. A., (1997). Ocean Surface Feature Detection with the CCRS Along-Track InSAR. Canadian Jr. of Rem. Sens., vol 23, no 1, pp. 24-37.
23. Livingstone, C., Sikaneta, I., Gierull, C., Chiu, S., Beaudoin, A., Campbell, J. and Beaudoin, J., (2002). An airborne SAR experiment to support RADARSAT-2 GMTI, in review, Canadian Journal of Remote Sensing, pp 36.

DRDC Ottawa TM 2003-142 51
Annex A : CFB Valcartier Ground Truth
Several types of ground truthed information are arranged below by different categories: target positions, logged events and environmental information.
POSITIONAL MEASUREMENTS
Below is a pictorial map (Figure 28) of the CFB Valcartier experiment referencing the calibrators and targets with numbers that are documented in Table 8.
Figure 28. Pictorial map of experiment layout at CFB Valcartier.

52 DRDC Ottawa TM 2003-142
Table 8. Reference numbers for experiment set up map in Figure 28.
WAYPT ITEM DEPLOYED TIME DEPLOYED
25 ARC Serafina 08:47
26 ARC 12542 09:00
27 Cor Athena 09:25
28 Cor Andromeda 09:55
29 Cor Anastasia 11:37
30 ARC Gemini 09:15
31 Cor Allison 10:04
32 Lav 23B (Grove of trees) 08:45
33 Cor Charlie N (Disp) 09:39
34 Cor Charlotte E (Disp) 09:43
35 Lav 2B (Scrub bush) 08:45
42 Cor Bertha 10:17
43 GPS Base Stn
44 Weather Stn
45 DREO Van
46 Lav 21B (open field) 08:45; 1500 departed
The positions of many of the calibrators and targets are found in Table 9. These are based on measurements from a Trimble Pathfinder system. In this table, HAG represents Height Above Ground, HAE represents Height Above the Ellipse, and UTM represents Universal Transverse Mercator (for Zone 19). The geographic coordinates are in the World Geodetic System (WGS) 1984.

DRDC Ottawa TM 2003-142 53
Table 9. GEO-Positions of calibrators and targets at CFB Valcartier.
TARGET ID EASTING NORTHING HAE LATITUDE LONGITUDE HAG
(UTM, m) (UTM, m) ( m) (° ′ ″ N) (° ′ ″ W) ( m)
ARC 1-2542 309995.878 5199486.454 142.52 46 55 18.1225 71 29 44.2382 0.35
ARC GEMINI 309969.406 5199494.003 143.61 46 55 18.3396 71 29 45.5001 0.35
ARC SERAFINA 309978.734 5199422.98 143.48 46 55 16.0505 71 29 44.9526 0.3
COR ANDROMEDA 309969.61 5199371.381 143.02 46 55 14.3711 71 29 45.3060 1.2
COR ALISON 309870.352 5199583.92 143.48 46 55 21.1476 71 29 50.3146 1.05
COR ANASTASIA 309888.845 5199412.674 142.76 46 55 15.6243 71 29 49.1833 1.1
COR ATHENA 310034.15 5199536.856 143.79 46 55 19.7932 71 29 42.5061 1.3
COR BERTHA 309935.397 5199279.161 142.77 46 55 11.3511 71 29 46.7835 1.22
COR CHARLOTTE 309652.093 5199391.548 142.87 46 55 14.6963 71 30 0.3351 0
COR CHARLIE 309652.251 5199379.292 142.99 46 55 14.2998 71 30 0.3092 0
OTHER AIRSOCK 309991.286 5199459.499 143.89 46 55 17.2454 71 29 44.4146 0
OTHER GPS 309877.403 5199645.503 142.8 46 55 23.1480 71 29 50.0742 1.33
OTHER MET 309927.587 5199459.275 143.39 46 55 17.1725 71 29 47.4233 0
OTHER SHACK 309995.535 5199458.41 145.02 46 55 17.2145 71 29 44.2123 N/A
VEH FOCUS CAR 309668.368 5199371.901 143.13 46 55 14.0772 71 29 59.5367 1.6
VEH FOCUS CAR 309913.917 5199371.83 142.86 46 55 14.3282 71 29 47.9375 1.6
VEH LAV-BUSH 309826.352 5199443.461 145.86 46 55 16.5563 71 29 52.1817 2.6
VEH LAV-PINE 309647.38 5199344.491 144.64 46 55 13.1685 71 30 0.4869 2.6
VEH LAV-SAND 309998.06 5199632.787 146.28 46 55 22.8609 71 29 44.3552 2.6
VEH DREO VAN 309772.242 5199675.113 144.86 46 55 23.9979 71 29 55.0865 1.9

54 DRDC Ottawa TM 2003-142
CALIBRATION INFORMATION
The calibrators orientation angles for the different lines are recorded in Table 10. Here, the compass measurements are referred to in True (T) and Magnetic (M) directions. All calibrators remained stationary for all the passes. Only two calibrators were moved throughout the trial as documented in Table 11.
Table 10. Calibration angles (measured and required) at CFB Petawawa.
CALIBRATOR CALIBRATOR BORESIGHT
ANGLE
CALIBRATOR ELEVATION ANGLE
CALIBRATOR COMPASS ANGLE *
SAR LOOK
ANGLE
(T/M) Required (M)
Measured (M)
Required (M)
Measured (M)
(T)
Serafina 90 / 108 +32.0 +31.5 198 / 18 198° 180
I-2542 90 / 108 +54.0 +54.0 198 / 18 198° 180
Gemini 0 / 18 +60.8 +60.6 / 60.3 108 / 288 108° 90
Athena 90 / 108 +23.0 +23.1 198 / 18 198° 180
Charlie 0 / 18 -6.0 -6.0 108 / 288 108° 90
Charlotte 90 / 108 +10.0 +9.8 198 / 18 198° 180
Andromeda 90 / 108 +0.74 +0.8 198 / 18 198° 180
Alison 90 / 108 +23.0 +23.0 198 / 18 198° 180
Bertha 90 / 108 +0.74 +0.8 198 / 18 198° 180
Anastasia 0 / 18 -6.0 -6.1 108 / 288 108° 90
* Sighting Arrow to the left/right; SAR is right looking for all passes
For Table 11, in the Scene column, “L” and “P” refer to Line and Pass numbers. Also, it should be noted that the ARC documents two elevation measurements which refer to the left and right arc horn.

DRDC Ottawa TM 2003-142 55
Table 11. Calibration Angle changes with each scene at CFB Valcartier.
SCENE ARC 1-2542 ATHENA CORNER COMMENTS
L P Requried Elevation (°)
Measured Elevation
(°)
Time Completed
Requried Elevation
(°)
Measured Elevation
(°)
Time Completed
1 1 +54 54 / 54 11:40 +0.74 +0.8 11:43 May have been too late
2 2 +32 31.6 / 31.6 12:11 +23 +23.1 12:12:30 start 12:12 end 12:39
3 3 +54 54.1 / 54.0 12:44 +0.74 +0.7 12:41 start East 12:52:30 end 13:03
1 4 +54 +0.74 13:12 abort13:24 repeat 13:32
2 5 +32 31.9 / 31.6 13:51:33 +23 +22.9 13:53:46 13:59:50 start
14:12 set up line 3
3 6 +54 53.6 / 53.8 14:18:54 +0.74 +0.8 14:16:30 14:26:45
1 7 +54 54 / 54 +0.74
1 8 +54 54/ 54 +0.74
1 9 +54 54 / 54 +0.74
1 10 +54 54 / 54 +0.74

56 DRDC Ottawa TM 2003-142
ENVIRONMENTAL INFORMATION
Here wind and soil moisture measurements are recorded.
The wind information is encapsulated in the following figure.
Figure 29. Wind measurements at CFB Valcartier.
Soil moisture measurements are documented below for each Cougar. Several measuements were collected on the North (N), South (S), East (E) and West (W) sides of the vehicle which was facing True East. These are all recorded here.
15:16:40 16:40:00 18:03:20 19:26:40 20:50:000
1
2
3
4
5
6
7
8
9
10
11
12
0
50
100
150
200
250
300
350
Wind Speed /
Wind Gust /
Wind Dir deg
W i n d S p e e d
m / s
WindDir
DegM
Time (GPS) HH:MM:SS

DRDC Ottawa TM 2003-142 57
SOIL MOISTURE NEAR COUGAR IN OPEN FIELD
The cougar in the open field was above a sandy dry soil which had some damp areas. Sparsely distributed, small herbal vegetation grew in the area. The soil was hard and compacted making it difficult to make measurements since when the probe was inserted, it would break in clumps. This may have introduced air pockets reducing the accuracy of the measurements.
Table 12. Soil Moisture measurements for cougar in the open at CFB Valcartier.
SOIL MOISTURE (%) # COMMENTS N E (Front) S W (Rear)
30.2 12.3 21.8 16.0 1
30.5 18.1 23.3 18.1 2
27.3 12.2 15.3 17.1 3
32.4 9.9 18.8 14.6 4
30.1 13.13 19.8 16.45 AVERAGE
17.3 15.6 1
11.9 17.7 2
6.3 16.7 3
14.6 16.4 4
12.53 16.65 AVERAGE
SOIL MOISTURE NEAR COUGAR IN DECIDUOUS BRUSH
The brush was moderately dense and the area was covered entirely with herbaceous vegetation except for a trail. The soil was firmly packed and hard.
Table 13. Soil moisture measurements for cougar in brush at CFB Valcartier.
SOIL MOISTURE (%) # COMMENTS N E (Front) S W (REAR)
31.1 30 33.6 16.4 1
34.6 31.2 29.1 24.2 2

58 DRDC Ottawa TM 2003-142
39.8 33.5 29.3 20.4 3
35.8 33.6 26.2 20.1 4
35.33 32.08 29.55 20.28 AVERAGE
43.8 33.1 1
36.5 32.2 2
41.6 36.5 3
35.5 30.8 4
39.35 33.15 AVERAGE
SOIL MOISTURE NEAR COUGAR IN PINE FOREST STAND
This Cougar was under the canopy of a mature pine forest, where there was little vegetation. On the forest floor there was a layer of desiccated pine needles. The readings on the south side of the vehicle were difficult to take because of a tree’s roots.
Table 14. Soil moisture measurements for cougar under forest CANOPY at CFB Valcartier.
SOIL MOISTURE (%) # COMMENTS N E (Front) S W (Rear)
20.6 33.8 33.8 34.1 1
21.6 21.6 34.2 33.8 2
23 26.9 31.7 34.1 3
12.5 38 15.6 32.9 4
19.43 30.08 28.83 33.73 AVERAGE
37.3 35.5 1
28 35.5 2
28.7 27.8 3
12.5 30.2 4
26.63 32.25 AVERAGE
LOGS and PHOTOGRAPH NOTES
Here, logs documenting events during the experiment are recorded. Also the photographer’s (Janice Lang) notes document both events and the photographs taken on both September 6 and 7, 2001.
A Log of the deployment sequence on September 7, 2001 follows. Here, VEH refers to a vehicle, and COR refers to a trihedral corner reflector.
TIME (LT)
TARGET ID EVENT

DRDC Ottawa TM 2003-142 59
08:45 VEH 3 LAV deployed on 3 different terrain patches 08:45 VEH FOCUS CAR deployed by pine patch 08:45 VEH VAN deployed by pine patch between focus and 2
corners 09:48 VEH VAN VAN left lidar position 10:20 VEH CAR left lidar position 11:30 VEH FOCUS CAR positioned for SAR 11:40 VEH VAN positioned for SAR 14:35 VEH FOCUS CAR left position for CFB transportation 14:35 VEH VAN left position for CFB transportation 14:55 VEH FOCUS CAR Back and deployed by the shack on SE side,
exact position unknown 14:55 VEH VAN Back but not same place; position unknown but
same orientation 15:00 VEH 3 LAV 3 LAV left for CFB 08:47 ARC SERAFINA Deployment 09:00 ARC 1-2542 Deployment 09:15 ARC GEMINI Deployment 09:25 COR ATHENA Deployment 09:39 COR CHARLIE Deployment 09:43 COR CHARLOTTE Deployment 09:55 COR ANDROMEDA Deployment 10:04 COR ALISON Deployment 10:17 COR BERTHA Deployment 11:37 COR ANASTASIA Deployment
Below the following Table documents all photographs (Negative and Digital). The table is separated for each roll number. Here DIR represents direction that the photographer is facing when the photograph was taken. Also, EDT represents Eastern Daylight Time.
Table 15. Photographer's log and photograph notes.
DRDC REFERENCE # COMMENTS FOR ROLL 1, SEPTEMBER 6, 2001 DIR Negative Image (°) 01-2641 Janice Lang, Lloyd Gallop, Terry Potter, and André Beaudoin checking out
location at DROP ZONE SECTOR 3
01-2642 Janice Lang, Lloyd Gallop, Terry Potter, and André Beaudoin unloading van at DROP ZONE SECTOR 3
01-2643 Terrain details looking North/Northeast at DROP ZONE SECTOR 3
01-2644 Janice Lang, Lloyd Gallop, Terry Potter, and André Beaudoin checking out location at DROP ZONE SECTOR 3

60 DRDC Ottawa TM 2003-142
01-2645 Terrain details looking North/Northeast at DROP ZONE SECTOR 3
01-2646 Janice Lang, Lloyd Gallop, Terry Potter, and André Beaudoin checking out location at DROP ZONE SECTOR 3
01-2647 Janice Lang, Lloyd Gallop, Terry Potter, and André Beaudoin checking out location at DROP ZONE SECTOR 3
01-2648 Janice Lang, Lloyd Gallop, Terry Potter, and André Beaudoin checking out location at DROP ZONE SECTOR 3
01-2649 Terrain details - sand at DROP ZONE SECTOR 3
01-2650 D1-01-2650 Terrain details - sand at DROP ZONE SECTOR 3
01-2651 D3-01-2651 Terrain details - sand with gravel at DROP ZONE SECTOR 3
01-2652 D4-01-2652 Terrain details - sand with gravel at DROP ZONE SECTOR 3
01-2653 D5-01-2653 Terrain details at DROP ZONE SECTOR 3
01-2654 D6-01-2654 Terrain details at DROP ZONE SECTOR 3
01-2655 D8-01-2655 Terrain details at DROP ZONE SECTOR 3
01-2656 D9-01-2656 Terrain details at DROP ZONE SECTOR 3
D11-01-2656a Terrain details - scrub brush with moss
01-2657 Terrain details - scrub brush with moss
01-2658 D10-01-2658 Terrain details - scrub brush with moss
01-2659 D12-01-2659 Terrain details - trees and hills in distance
01-2660 D13-01-2660 Terrain details - trees and hills in distance
01-2661 D17-01-2661 Road at DROP ZONE SECTOR 3
01-2662 Janice Lang, Lloyd Gallop, Terry Potter, and André Beaudoin checking out location at DROP ZONE SECTOR 3
01-2663 D18-01-2663 Road at DROP ZONE SECTOR 3
01-2664 Road at DROP ZONE SECTOR 3
01-2665 Road at DROP ZONE SECTOR 3
01-2666 Panoramic view at DROP ZONE SECTOR 3, turning every 45° starting from north
N
01-2667 Panoramic view at DROP ZONE SECTOR 3, turning every 45° starting from north
N
01-2668 D20-01-2668 Panoramic view at DROP ZONE SECTOR 3, turning every 45° starting from north
N
01-2669 Panoramic view at DROP ZONE SECTOR 3, turning every 45° starting from north
N
01-2670 D21-01-2670 Panoramic view at DROP ZONE SECTOR 3, turning every 45° starting from north
NE
01-2671 Panoramic view at DROP ZONE SECTOR 3, turning every 45° starting from north
E
01-2672 D22-01-2672 Panoramic view at DROP ZONE SECTOR 3, turning every 45° starting from north
N
01-2673 D23-01-2673 Panoramic view at DROP ZONE SECTOR 3, turning every 45° starting from north
S
01-2674 D24-01-2674 Panoramic view at DROP ZONE SECTOR 3, turning every 45° starting from north
SW
01-2675 D25-01-2675 Panoramic view at DROP ZONE SECTOR 3, turning every 45° starting from north
W
01-2676 D26-01-2676 Panoramic view at DROP ZONE SECTOR 3, turning every 45° starting from north
NW

DRDC Ottawa TM 2003-142 61
DRDC REFERENCE # COMMENTS FOR ROLL 2, SEPTEMBER 6, 2001 DIR Negative Image (°) 01-2677 Panoramic view at DROP ZONE SECTOR 3, turning every 45° starting from
north NW
01-2678 Panoramic view at DROP ZONE SECTOR 3, turning every 45° starting from north
N
01-2679 Forest – vertical 250
01-2680 D28-01-2680 Forest – vertical 250
01-2681 D29-01-2681 Forest – ditch 315
01-2682 D30-01-2682 Forest – overall 290
01-2683 D31-01-2683 Forest near orange flag and Lloyd Gallop doing GPS
01-2684 Warning sign at DROP ZONE SECTOR 3
01-2685 D32-01-2685 Overall view of Shannon Sand pit 180
D33-01-2685a Overall view of Shannon Sand pit 180
D36-01-2685a Overall view of Shannon Sand pit 180
01-2686 D37-01-2686 Overall view of Shannon Sand pit 115
01-2687 D34-01-2687 Overall view of Shannon Sand pit 115
01-2688 D35-01-2688 Overall view of Shannon Sand pit 230
01-2689 ARC Gemini position flag at Shannon Sand pit 170
01-2690 D38-01-2690 ARC Gemini position flag at Shannon Sand pit 330
01-2691 D39-01-2691 Vegetation near ARC Serafina position flag at Shannon Sand pit
01-2692 D40-01-2692 Vegetation near ARC Serafina position flag at Shannon Sand pit
01-2693 Lloyd Gallop and Cor Athena sign (Maureen Yeremy marking sign) at Shannon Sand pit
01-2694 D41-01-2694 Slope at back of Shannon Sand pit - Maureen Yeremy, Lloyd Gallop and André Beaudoin
124
DRDC REFERENCE # COMMENTS FOR ROLL 3, ON SEPTEMBER 7, 2001 D EDT Negative Image (°) 01-2710 Lloyd and Maureen setting up ARC 12542 20
01-2711 Lloyd and Maureen setting up ARC 12542 20
01-2712 Lloyd and Maureen setting up ARC 12542 20
01-2713 Lloyd and Maureen setting up ARC 12542 20
01-2714 Lloyd and Maureen setting up ARC 12542 20
01-2715 Lloyd and Maureen setting up ARC 12542 20
01-2716 Lloyd and Maureen setting up ARC 12542 20
01-2717 D45-01-2717 View standing on top of LAV 21B (open field) in area at Drop Zone Sector III
110
01-2718 D46-01-2718 View standing on top of LAV 21B (open field) in area at Drop Zone Sector III
10
01-2719 D47-01-2719 View standing on top of LAV 21B (open field) in area at Drop Zone Sector III
260
01-2720 D48-01-2720 View standing on top of LAV 21B (open field) in area at Drop Zone Sector III
290
01-2721 D49-01-2721 View standing on top of LAV 21B (open field) in area at Drop Zone Sector III
105

62 DRDC Ottawa TM 2003-142
01-2722 Terry Potter (front, left), Lloyd Gallop (front, right), Maureen Yeremy (back, left) and André Beaudoin (back, right) set up Cor Charlie N (Disp)
01-2723 Terry Potter (front, left), Lloyd Gallop (front, right), Maureen Yeremy (back, left) and André Beaudoin (back, right) set up Cor Charlie N (Disp)
01-2724 D50-01-2724 LIDAR plane flying over Drop Zone Sector III 9:40 (film) 9:46 (digital)
01-2725 Terry Potter, Lloyd Gallop, and Maureen Yeremy set up Cor Charlotte E (Disp)
01-2726 André Beaudoin's Ford Focus car while being imaged by LIDAR passes
88
01-2727 André Beaudoin's Ford Focus car while being imaged by LIDAR passes
88
01-2728 D51-01-2728 André Beaudoin's Ford Focus car while being imaged by LIDAR passes
228
01-2729 D53-01-2729 André Beaudoin's Ford Focus car while being imaged by LIDAR passes with Cor Charlie N (Disp), Cor Charlotte E (Disp), and LAV 23B (grove of trees) in the trees
240
01-2730 D54-01-2730 Cor Charlie N (Disp) 247
01-2731 D55-01-2731 Cor Charlie N (Disp) 197
01-2732 D56-01-2732 Cor Charlie N (Disp) 18
01-2733 D57-01-2733 Cor Charlie N (Disp) 128
01-2734 Cor Charlotte E (Disp) 275
01-2735 Cor Charlotte E (Disp) 275
01-2736 D58-01-2736 Cor Charlotte E (Disp) 192
01-2737 D59-01-2737 Cor Charlotte E (Disp) 108
01-2738 Cor Charlotte E (Disp) 108
01-2739 D60-01-2739 Cor Charlotte E (Disp) 14
01-2740 D61-01-2740 LAV 23B (grove of trees) - view of foliage looking straight up from top centre of vehicle.
67 at photo top edge
01-2741 D62-01-2741 LAV 23B (grove of trees) - view of foliage looking up at front of vehicle
140
01-2742 D63-01-2742 LAV 23B (grove of trees) - view of foliage looking up at right side of vehicle.
209
01-2743 D64-01-2743 LAV 23B (grove of trees) - view of foliage looking up at right side of vehicle.
209
01-2744 D65-01-2744 LAV 23B (grove of trees) - view of foliage looking up at back of vehicle.
300
01-2745 D66-01-2745 LAV 23B (grove of trees) - view of foliage looking up at back of vehicle.
300
DRDC REFERENCE # COMMENTS FOR ROLL 4, SEPTEMBER 7, 2001 DIR EDT Negative Image (°)
01-2746 D67-01-2746 Vehicle LAV 23B (grove of trees) - foliage at top of vehicle, back direction
300

DRDC Ottawa TM 2003-142 63
01-2747 D68-01-2747 Vehicle LAV 23B (grove of trees) - foliage at top of vehicle, back direction
300
01-2748 D69-01-2748 Vehicle LAV 23B (grove of trees) - foliage at top of vehicle, left side
60
01-2749 D70-01-2749 Vehicle LAV 23B (grove of trees) - foliage at top of vehicle, left side
60
01-2750 Area surrounding LAV 23B (Grove of trees) - photo taken from the front of vehicle
140
01-2751 Area surrounding LAV 23B (Grove of trees) - photo taken from the right of vehicle
209
01-2752 Area surrounding LAV 23B (Grove of trees) - photo taken from the back of vehicle
300
01-2753 Area surrounding LAV 23B (Grove of trees) - photo taken from the left of vehicle
60
01-2754 D71-01-2754 Cor Allison
01-2755 Lloyd Gallop and Terry Potter set up Relative GPS Base station
01-2756 Lloyd Gallop and Terry Potter set up Relative GPS Base station
01-2757 Janice Lang and Terry Potter at GPS Base station
01-2758 Lloyd Gallop and Terry Potter set up Relative GPS Base station
01-2759 Lloyd Gallop and Terry Potter set up Relative GPS Base station
01-2760 Lloyd Gallop and Terry Potter set up Relative GPS Base station 01-2761 Lloyd Gallop and Terry Potter set up Relative GPS Base station 01-2762 André Beaudoin with Trimble GPS, Terry Potter measures
antenna height
01-2763 André Beaudoin with Trimble GPS, Lloyd Gallop sets up Relative GPS Base Station
01-2764 André Beaudoin with Trimble GPS, Terry Potter and Lloyd Gallop set up Relative GPS Base Station
01-2765 André Beaudoin with Trimble GPS - beside is Lloyd Gallop setting up Relative GPS Base Station.
01-2766 Helicopter with no load flying over Drop Zone Sector III, Cor Allison in foreground
10:55
01-2767 André Beaudoin with Trimble GPS at Cor Allison 01-2768 André Beaudoin with Trimble GPS at Cor Allison 01-2769 D72-01-2769 Cor Allison 265 01-2770 D73-01-2770 Cor Allison 185 01-2771 D74-01-2771 Cor Allison 120 01-2772 Cor Allison 21
01-2773 Low flying GRIFFIN, stopped flying about 11:20 a.m. or 11:25 a.m.
11:05 - 11:08
01-2774 Vehicle on road 11:05 - 11:08
01-2775 Low flying GRIFFIN, stopped flying over Drop Zone Sector III about 11:20 a.m. or 11:25 a.m.
11:05 - 11:08
01-2776 Low flying GRIFFIN, stopped flying about 11:20 a.m. or 11:25 a.m.
11:05 - 11:08
01-2777 CF vehicle on road 11:05 - 11:08

64 DRDC Ottawa TM 2003-142
01-2778 Low flying GRIFFIN, stopped flying about 11:20 a.m. or 11:25 a.m.
11:05 - 11:08
01-2779 CF vehicle on road 11:05 - 11:08
01-2780 ARC Gemini 266
D75-01-2780a ARC Gemini 266
01-2781 ARC Gemini 0 D76-01-2781a ARC Gemini 0
DRDC REFERENCE # COMMENTS FOR ROLL 5, SEPTEMBER 7, 2001 DIR EDT Negative Image (°) 01-2782 ARC Gemini 128
D77-01-2782a ARC Gemini 128
01-2783 D78-01-2783 ARC Gemini 190
01-2783a Gravel truck on road 11:29
01-2784 Sedan car on road 11:30
01-2785 Weather Station
01-2786 Weather Station
01-2787 Armored vehicle (tow truck on road)
01-2788 D79-01-2788 ARC 12542 (near shack) 68
01-2789 ARC 12542 (near shack) 12
D80-01-2789a ARC 12542 (near shack) 12
01-2790 ARC 12542 (near shack), view from back of ARC 258
D81-01-2790a ARC 12542 (near shack), view from back of ARC 258
01-2791 D82-01-2791 ARC 12542 (near shack) 190
01-2792 D83-01-2792 Weather Station
01-2793 Van on road 11:48
01-2794 Sedan car on road 11:48
01-2795 Dump truck and car on road 11:49
01-2796 Dump truck and car on road 11:49
01-2797 Large blue van heading down trail towards LAV area 11:51
No image no image Car travelling down road 11:51
01-2798 Yellow dump truck on road 11:55
01-2799 Small army truck on road 11:56
01-2800 Two sedans on road 11:57
01-2801 André Beaudoin (DREV) with Trimble GPS
01-2802 Army wrecker tow truck on road 12:03
01-2803 Mobile crane vehicle on road 12:04
01-2804 Blue full size van coming out of our site and travelling down road southwest - This is the same van that went into the site at 11:51 (01-2797)
12:15 -12:30
01-2805 Equipment and lunch
01-2806 D86-01-2806 Cor Athena 112
01-2807 D87-01-2807 Cor Athena 47

DRDC Ottawa TM 2003-142 65
01-2808 Mobile crane vehicle travelling on road 12:33
01-2809 Small SUV travelling on road 12:40
01-2810 André Beaudoin (DREV) with Trimble, calibrating GPS at ARC 12542
01-2811 D88-01-2811 LAV 21B (open field) right side 12
01-2812 D89-01-2812 Overall view of LAV 21B (open field), right side
01-2813 Jeep travelling on road 12:47
01-2814 D90-01-2814 LAV 21B (open field), front side of vehicle 275
01-2815 D91-01-2815 LAV 21B (open field), front side of vehicle 275
01-2816 D92-01-2816 LAV 21B (open field), left side of vehicle 205
DRDC REFERENCE # COMMENTS FOR ROLL 6, SEPTEMBER 7, 2001 DIR EDT Negative Image (°)
01-2817 Terry Potter and Andre Beaudoin with LAV 21B (open field), soil moisture and GPS heading
01-2818 Terry Potter and Andre Beaudoin with LAV 21B (open field), soil moisture and GPS heading
01-2819 Terry Potter and Andre Beaudoin with LAV 21B (open field), soil moisture and GPS heading
01-2820 Terry Potter and Andre Beaudoin with LAV 21B (open field), soil moisture and GPS heading
01-2821 Terry Potter with LAV 21B (open field), recording soil moisture
01-2822 Sedan travelling fast on road, station wagon 12:58
01-2823 Sedan travelling fast on road, station wagon
01-2824 Terry Potter with LAV 21B (open field), recording soil moisture
01-2825 Terry Potter with LAV 21B (open field), recording soil moisture
01-2826 Terry Potter with LAV 21B (open field), recording soil moisture
01-2827 Terry Potter with LAV 21B (open field), recording soil moisture
01-2828 D93-01-2828 LAV 21B (open field), back 107
01-2829 Two LAV vehicles travelling on road 13:02
01-2830 Two LAV vehicles travelling on road 13:03
01-2831 White sedan on road 13:03
01-2832 Blue sedan on road travelling fast 13:05
(No photo) Ford Explorer 13:06
(No photo) Recovery tow truck 13:06
01-2833 D94-01-2833 LAV 21B (open field), back left, ¾ view 168
D95-01-2833a LAV 21B (open field), back left, ¾ view 168
01-2834 D96-01-2834 LAV 21B (open field), back right, 3/4 view 78
01-2835 D97-01-2835 LAV 21B (open field), front right, 3/4 view 280
01-2836 D98-01-2836 LAV 21B (open field), front left, ¾ view 240
01-2837 Yellow catepillar road grader travelling on road 13:15
01-2838 Terry Potter recording soil moisture beside LAV 21B
01-2839 D99-01-2839 Around LAV 21B (open field), looking from right side 182
01-2840 D100-01-2840 View from back of LAV 21B (open field) 280
01-2841 Grey cube van and car travelling on road 13:20

66 DRDC Ottawa TM 2003-142
01-2842 1/4 ton truck DND military travelling on road 13:20
01-2843 D101-01-2843 LAV 21B (open field), view from left side 24
01-2844 D102-01-2844 LAV 21B (open field), view from front 107
01-2845 Two pickup trucks on road 13:23
01-2846 D103-01-2846 ARC Athena 204
no image no image Pickup truck on road 13:26
01-2847 D104-01-2847 ARC Athena 260
01-2848 D105-01-2848 LAV 2B (Scrub bush), left side 185
01-2849 LAV 2B (Scrub bush), 3/4 back left 136
D106-01-2849a LAV 2B (Scrub bush), 3/4 back left 136
D106-01-2849b LAV 2B (Scrub bush), 3/4 back left 136
01-2850 LAV 2B (Scrub bush), 3/4 back left 136
01-2851 LAV 2B (Scrub bush), 3/4 back left 136
01-2852 LAV 2B (Scrub bush), back 103
D108-01-2852a LAV 2B (Scrub bush), back 103
DRDC REFERENCE # COMMENTS FOR ROLL 7, SEPTEMBER 7, 2001 D Negative Image (°) 01-2853 LAV 2B (Scrub bush), back 103
01-2854 D109-01-2854 LAV 2B (Scrub bush), 3/4 back right 84
01-2855 D110-01-2855 LAV 2B (Scrub bush), right 08
01-2856 D111-01-2856 LAV 2B (Scrub bush), 3/4 front right 330
01-2857 D112-01-2857 LAV 2B (Scrub bush), front 262
01-2858 D113-01-2858 LAV 2B (Scrub bush), 3/4 front left 217
01-2859 D114-01-2859 LAV 2B (Scrub bush), view looking from front
01-2860 D115-01-2860 LAV 2B (Scrub bush), view looking from right side
01-2861 D116-01-2861 LAV 2B (Scrub bush), view looking from back
01-2862 LAV 2B (Scrub bush), view looking from left side
D117-01-2862a LAV 2B (Scrub bush), view looking from left side
01-2863 D118-01-2863 LAV 2B (Scrub bush), view looking north
01-2864 D119-01-2864 LAV 2B (Scrub bush), view looking north
01-2865 D120-01-2865 Overall view of pine trees surrounding LAV 23B (Grove of trees)
01-2866 Porta John truck passing pine trees at 13:58 EDT
01-2867 D121-01-2867 LAV 23B (Grove of trees), left side 200
01-2868 D122-01-2868 LAV 23B (Grove of trees), left side 200
01-2869 D123-01-2869 LAV 23B (Grove of trees), back view 120
01-2870 LAV 23B (Grove of trees), back view 120
01-2871 D124-01-2871 LAV 23B (Grove of trees), back view 120
01-2872 D126-01-2872 LAV 23B (Grove of trees), right side 06
01-2873 D127-01-2873 LAV 23B (Grove of trees), right side 06
01-2874 D128-01-2874 LAV 23B (Grove of trees), right side 06
01-2875 D129-01-2875 LAV 23B (Grove of trees), front 277
01-2876 D130-01-2876 LAV 23B (Grove of trees), front 277

DRDC Ottawa TM 2003-142 67
01-2877 D131-01-2877 LAV 23B (Grove of trees), front 277
01-2878 LAV 23B (Grove of trees), front 277
01-2879 Sky from nose of LAV 23B (Grove of trees)
01-2880 D132-01-2880 Overall sky from nose (front) of LAV 23B (Grove of trees)
01-2881 Overall front view of LAV 23B (Grove of trees)
01-2882 D133-01-2882 Overall view of LAV 2B (Scrub bush)
01-2883 Janice Lang, DREO Photographer
01-2884 Janice Lang, DREO Photographer
01-2885 D135-01-2885 Overall view of area near shack
01-2886 DREO van on road inside Drop Zone Sector III 325
D136-01-2886a Car and DREO van on road inside Drop Zone Sector III
01-2887 Maureen Yeremy and Lloyd Gallop document area around LAV 21B
01-2888 Maureen Yeremy and Lloyd Gallop document area around LAV 21B
DRDC REFERENCE # COMMENTS FOR ROLL 8, SEPTEMBER 7, 2001 DIR EDT Negative Image (°) 01-2889 D140-01-2889 Grid (every 30cm marked with yellow tape) on LAV 21B (open
field), right side 12
01-2890 D141-01-2890 Grid (every 30cm marked with yellow tape) on LAV 21B (open field), right side
12
01-2891 D142-01-2891 Grid (every 30cm marked with yellow tape) on LAV 21B (open field), front
275
01-2892 Grid (every 30cm marked with yellow tape) on LAV 21B (open field), front
275
01-2893 D143-01-2893 Grid (every 30cm marked with yellow tape) on LAV 21B (open field), left side
205
01-2894 D144-01-2894 Grid (every 30cm marked with yellow tape) on LAV 21B (open field), left side
205
01-2895 D145-01-2895 Grid (every 30cm marked with yellow tape) on LAV 21B (open field), back
107
01-2896 LAV 23B and LAV 2B driving around our site 14:58
01-2897 LAV 23B and LAV 2B driving around our site 14:58
01-2898 LAV 21B leaving our site 15:00
01-2899 LAV 21B leaving our site 15:00
01-2900 LAV 21B leaving our site 15:00
01-2901 LAV 21B leaving our site 15:00
01-2902 LAV 21B leaving our site 15:00
01-2903 LAV 21B leaving our site 15:00
01-2904 LAV 21B leaving our site 15:00
01-2905 Overall view of site after LAV vehicle departure 234
01-2906 Maureen Yeremy and Lloyd Gallop dismantle ARC Serafina 20
D146-01-2906a Maureen Yeremy and Lloyd Gallop dismantle ARC Serafina 20
01-2907 Maureen Yeremy and Lloyd Gallop dismantle ARC Serafina 275
D147-01-2907a Maureen Yeremy and Lloyd Gallop dismantle ARC Serafina 275
D148-01-2908a Maureen Yeremy and Lloyd Gallop dismantle ARC Serafina 195

68 DRDC Ottawa TM 2003-142
01-2909 Maureen Yeremy and Lloyd Gallop dismantle ARC Serafina 108
D149-01-2909a Maureen Yeremy and Lloyd Gallop dismantle ARC Serafina 108
01-2910 Panorama taken from centre of road, looking straight N 360
01-2911 D150-01-2911 Panorama taken from centre of road, looking straight N 360
01-2912 D151-01-2912 Panorama taken from centre of road, looking straight NE 45
D152-01-2912a Panorama taken from centre of road, looking straight NE 45
01-2913 D153-01-2913 Panorama taken from centre of road, looking straight E 90
01-2914 D154-01-2914 Panorama taken from centre of road, looking straight E 90
01-2915 D155-01-2915 Panorama taken from centre of road, looking straight E 90
01-2916 D156-01-2916 Panorama taken from centre of road, looking straight SE 135
01-2917 D157-01-2917 Panorama taken from centre of road, looking straight S 180
01-2918 D158-01-2918 Panorama taken from centre of road, looking straight S 180
01-2919 D160-01-2919 Panorama taken from centre of road, looking straight SW 225
01-2920 D159-01-2920 Panorama taken from centre of road, looking straight SW 225
01-2921 D161-01-2921 Panorama taken from centre of road, looking straight W 270
01-2922 D162-01-2922 Panorama taken from centre of road, looking straight NW 315
01-2923 Location of reflector in middle of "Y" in road on Drop Zone Site
01-2924 D163-01-2924 View looking down dirt road with 2 corner reflectors, Cor Andromeda
DRDC REFERENCE # COMMENTS FOR ROLL 9, SEPTEMBER 7, 2001 DIR Negative Image (°)
01-2925 D164-01-2925 Cor Andromeda 145
01-2926 D165-01-2926 Cor Andromeda 20
01-2927 D166-01-2927 Cor Andromeda 275
01-2928 D166-01-2928 Cor Andromeda 187
01-2929 D167-01-2929 Cor Bertha 115
01-2930 D168-01-2930 Cor Bertha 21
01-2931 D169-01-2931 Cor Bertha 250
01-2932 D170-01-2932 Cor Bertha 180
01-2933 Range control shack at Drop Zone Sector 3, Maureen Yeremy, Lloyd Gallop and Terry Potter lead equipment into DREO van
01-2934 Range control shack at Drop Zone Sector 3, Maureen Yeremy, Lloyd Gallop and Terry Potter lead equipment into DREO van
01-2935 Range control shack at Drop Zone Sector 3, Maureen Yeremy, Lloyd Gallop and Terry Potter lead equipment into DREO van
01-2936 Range control shack at Drop Zone Sector 3
01-2937 Range control shack at Drop Zone Sector 3
01-2938 Range control shack at Drop Zone Sector 3
01-2939 Range control shack at Drop Zone Sector 3
01-2940 Range control shack at Drop Zone Sector 3
01-2941 Range control shack at Drop Zone Sector 3
01-2942 Range control shack at Drop Zone Sector 3
01-2943 Range control shack at Drop Zone Sector 3

DRDC Ottawa TM 2003-142 69
01-2944 Range control shack at Drop Zone Sector 3
01-2945 Range control shack at Drop Zone Sector 3
D2-01-2946 Range control shack at Drop Zone Sector 3
D14-01-2947 Lloyd Gallop records GPS location before setting up corner reflectors near road
D15-01-2948 Maureen Yeremy and Andre Beaudoin discuss placement of corner reflectors
D16-01-2949 Maureen Yeremy and Andre Beaudoin discuss placement of corner reflectors
D19-01-2950 Lloyd Gallop and Terry Potter scout locations for placement of corner reflectors.
D27-01-2951 View looking northwest towards hills at Drop Zone Sector 3
D42-01-2952 Lloyd Gallop and Maureen Yeremy set up ARC at Drop Zone Sector 3
D43-01-2953 Lloyd Gallop and Maureen Yeremy set up ARC at Drop Zone Sector 4
D44-01-2954 Maureen Yeremy prepares for trail
D84-01-2955 Terry Potter, Lloyd Gallop, Maureen Yeremy and Andre Beaudoin are surrounded by test trail equipment
D85-01-2956 Terry Potter, Lloyd Gallop, Maureen Yeremy and Andre Beaudoin are surrounded by test trail equipment
D134-01-2957 Terry Potter, Lloyd Gallop, Maureen Yeremy and Andre Beaudoin are surrounded by test trail equipment
D137-01-2958 Traffic on road - car - at Drop Zone Sector 3
D138-01-2959 Traffic on road - dumptruck - at Drop Zone Sector 3
D139-01-2960 Traffic on road - dumptruck - at Drop Zone Sector 3

70 DRDC Ottawa TM 2003-142
Annex B : Baselines for CFB Valcartier InSAR Pairs
The following figures show the calculated baselines for all image pair combinations from the CFB Valcartier Trial. The baseline is the distance between the phase centres of the two antennas that form an interferogram. The component of the baseline perpendicular to the line-of-site is of critical importance in interferometry. If it is too large the interferometric pair will be decorrelated and all phase information will be lost. With the Convair the perpendicular baseline should be around 30 meters or less.
In each figure, calculated baselines from two scenes labelled as “lxpy” (refers to line x and pass y) are shown. The upper left plot shows the flight paths of the InSAR pairs. The upper right, lower left, lower right plots show respectively the absolute, ground and height baseline distances. Note that the analysis region is denoted in all figures.

DRDC Ottawa TM 2003-142 71
(12a)
Figure 30. Calculated baseline distances for all combinations of InSAR pairs (12a-g) .

72 DRDC Ottawa TM 2003-142
(12b)
(12c)

DRDC Ottawa TM 2003-142 73
(12d)
(12e)

74 DRDC Ottawa TM 2003-142
(12f)
(12g)

DRDC Ottawa TM 2003-142 75
Annex C : CAMEVAL (CFB Petawawa) Ground Truth
Ground truth logged notes follow. Refer to [14] for more ground truthed information.
Ground truth logs – Moving Target
Lloyd Gallop’s logged notes below describe aspects of the moving target experiment.
On Wednesday 05 Jun 02 the CV580 flew a number of flight lines to SAR image the CamEval trial in a PolSAR mode for three prepared sites at CFB Petawawa. This exercise also included the imaging of a low speed GMTI experiment. The moving target consisted of a ½-ton truck with the load bed fitted with a wooden saddle that supported a radar corner reflector. The saddle was installed perpendicular to the truck bed and track axis of the vehicle, the saddle mounts ~ 1.7 meters rearward of the truck cab. The corner then mounts on the protractor base of the saddle with a 360° azimuth and a ±45° elevation capability. The corner installed on the vehicle for this deployment was Athena (Hypotenuse = 0.986 m and Side = 0.696 m). Given the magnetic compass sensitivity to the metallic structure of the truck the compass was not used. The corner was set up by using the knowledge of the road’s bearing (332°T) and adjusting the corner’s azimuth with a protractor mounted on the saddle’s interface to the corner.
220°T Aircraft Heading Radar Right Looking
N
130°T
Mean azimuth of road = 332°T
Therefore the corner was set to 158° on the saddle base protractor.

76 DRDC Ottawa TM 2003-142
The GMTI experiment was setup to run along CFB Petawawa Clement Lake Road in a northerly direction for each CV580 flight line. The selected road section started at UTM position N-5093050.9 ±0.5 m, E-0319270.2 ± 0.5m and an elevation of 94.5 ±1 m height above ellipse (HAE) on a mean bearing of 333.5°T for a distance of 2.314 km. There are two prominent features along this portion of the road; first is Clement Lake that parallels the West Side of this section of road. Secondly there is the Parachute Training Tower (PTT) also on the West Side of the road. The PTT is north of the start point at N-5093989.0 ±0.6 m, E-0318822.8 ± 0.6m (road position) and an elevation of 93.0 ±1.7 m (HAE) on a bearing of 332.5°T at a distance of 1.041 km. A Trimble Beacon Differential GPS Receiver kit (antenna height = 2.730 m) was also installed aboard the vehicle to record position, velocity, and time for later processing with the radar image. The unit was set in line mode and was toggled between resume and pause for each flight line. The communication protocol with the aircraft to coordinate the vehicle movement was for the aircraft to state “Lead In Auto Pilot On” ~5 minutes from start of line, “Start of Line” line was 10 NM or ~ 2.5 minutes, “End of Line – Target Acquired”. Vehicle speed for this experiment was 5 to 15 kph. The June 5 data are collected in referenced file R060522A. Due to the difficulties encountered on the 05 June GMTI flight, the experiment was repeated on 08 June 02, using the same procedure. Reference files for June 8 are R0608 12B and Trimble Pathfinder file R060522A.ssf. Below are further logged notes during the June 5, 2002 moving target experiment. Line # Comments 1 No two-minute warning. No declared targets. 2 No declared targets. 3 Wrong heading declared (Connaught flight lines). CV580 reprogramed for the
Petawawa flight lines. 4 5 Good data set. 6 Good data set. 7 Declared targets acquired at 21:16:03. Good data set. State of battery charge 22%, fresh batteries installed charge state now 85%. Receiver PDOP now at 9.2, only 4 sv’s available, no data recorded when PDOP is
above 6.0. (sv’s = 14, 20, 25, 30) 8 GPS data dropping in and out (PDOP > 6). Sv’s bouncing between 4 and 5. Data
improved at ~21:40:00, PDOP = 2.48. May have valid data for this line. Velocity appears closer to 20, than 15 kph.
9 21:51 CV580 declared a problem and head for home. 21:52:30 Trimble data capture was turned off.

DRDC Ottawa TM 2003-142 77
Logged notes for June 8, 2002 follow. Note that the Blue Dodge Ram crew cab 4x4 was parked at the GMTI start point. Waypoint #63 N45 58 01.0 W077 19 57.4 Elevation 133 m (MSL), EPE = ±5.0 m and that CLR refers to Clement Lake Road. 09:21:30 CV580 first contact (10NM to lead-in). 09:32:20 3-helos heading west across clearing. 09:34:20 at PTT. 09:36:05. Start line #1, light rain. 22 ton east across CLR. 09:38:25 Image acquired (IA). 09:39:00 3-22 ton trucks pass north on CLR; 2 vehicles parked near PTT. 09:41:00 end of line 1. 09:44:20 22 ton, north on CLR. 09:59:05 start of line #2, light rain. 10:00:15 Image acquired. 10:03:35 end of line #2. 10:20:503 - helos west across CLR. 10:23:15 - Start of line #3, very light rain at PTT. 10:25:50 - Image acquired. 10:28:45 - end of line #3. In first gear. 10:49:20 – at PTT. 10:49:35 – Star of line #4, light rain. 10:51:55 – Image acquired. 11:15:15 – Start of line #5, light rain. 11:16:45 – Image acquired. 11:36:25 – Start of line #6, moderate rain. 11:38:20 – Image acquired. 11:40:15 – Report, North ARC fading. It turned out that the horn was accumulating water. 11:40 Red 4x4 arrived at CLR. 11:46 Red 4x4 return to Cal Site to change out battery on North ARC. 11:56:50 - 22 ton south on CLR. 12:00:10 – Start of line #7, steady rain. 12:00:15 – at PTT. 12:02:35 – Image acquired. 12:24:15 – Start of line #8, light rain. 12:27:03 – Image acquired. 12:43:30 – at PTT. 12:45:55 Start of line #9, light rain. 12:47:45 – Image acquired. Most of the Trimble Pathfinder GPS data sets require further post processing. Figures of processed GPS positions and velocities for two flight lines on June 5 follow.

78 DRDC Ottawa TM 2003-142
Figure 31. Positional information for moving target on pass 4, June 5.
Figure 32. Velocity information for moving target, for pass 4, June 5.
0.34 0.36 0.38 0.40 0.42 0.44 0.46 0.48 0.50 0.52 0.54 0.56 0.58 0
2
4
6
8
10
12
14
0
50
100
150
200
250
300
350
400
Vel mean = 9.8 +/- 1.0
Vel mean = 4.86 +/- 0.76
Azm mean = 330.2 +/- 1.6 Deg Azm mean = 337.1 +/- 2.8 Deg
Petawawa CamEval Trial - 05 Jun 02 - GMTI Line
V e l o c i t y
K p h
A z i m u t h T r u e
D D . d d
GPS Time
0.34 0.36 0.38 0.40 0.42 0.44 0.46 0.48 0.50 0.52 0.54 0.56 0.58 45.967 45.968 45.969 45.970 45.971 45.972 45.973 45.974 45.975 45.976 45.977 45.978
-77.341 -77.340
-77.339 -77.338 -77.337
-77.336 -77.335 -77.334
-77.333 -77.332
Lat
Lon
Petawawa CamEval Trail - 05 Jun 02 - GMTI Line
L a t D D . d d
L o n D D . d d
GPS Time [HH.hh]

DRDC Ottawa TM 2003-142 79
Figure 33. Altitude of moving target as a function of time for pass 4, June 5.
0.855 0.860 0.865 0.870 0.875 0.880 0.885 0.890 0.895 0.900 0.905 0.910 0.915 45.967
45.967
45.967
45.967
45.967
45.968
45.968
45.968
45.968
45.968
45.969
45.969
45.969
-
-
-
-
-
-
-
-
-
-
Lat
Lon
Petawawa CamEval Trial - 05 June 02 - GMTI
L a t D D . d d
L o n D D . d d
GPS Time [HH.hh] (06 June
Figure 34. Moving target positions for pass 5, June 5.
0.34 0.36 0.38 0.40 0.42 0.44 0.46 0.48 0.50 0.52 0.54 0.56 0.58 90
92
94
96
98
100
102
104
106
108
110 Petawawa CamEval Trail - 05 Jun 02 - GMTI
A l t i t u d e H A E
m
GPS Time

80 DRDC Ottawa TM 2003-142
0.86 0.87 0.88 0.89 0.90 0.91 0.92 0.93 0
2
4
6
8
10
12
14
0
50
100
150
200
250
300
350
400
Azimuth mean = 330.7 +/- 3.3 Deg T
Velocity mean = 4.98 +/- 0.79 h
Petawawa CamEval Trial - 05 June 02 - GMTI Line 6
V e l o c i t y
K p h
A z i m u t h T r u e
D D . d d
GPS Time [HH.hh] (06 June 02)
Figure 35. Velocity for moving target on pass 5, June 5.
0.855 0.860 0.865 0.870 0.875 0.880 0.885 0.890 0.895 0.900 0.905 0.910 0.915 90 92 94 96 98 100 102 104 106 108 110
Petawawa CamEval Trial - 05 June 02 - GMTI
A l t i t u d e H A E m
GPS Time [HH.hh] (06 June
Figure 36. Elevation as a function of time for moving target on pass 5, June 5.

DRDC Ottawa TM 2003-142 81
Annex D : CAMEVAL Baselines for June 5, 2002
Here all InSAR pair baselines for the CAMEVAL Trial on June 5, 2002 are provided. They are presented in the same format as in Annex B.
(19a)
Figure 37. Baselines for all June 5 InSAR pair combinations (a-f).

82 DRDC Ottawa TM 2003-142
(19b)
(19c)

DRDC Ottawa TM 2003-142 83
(19d)
(19e)

84 DRDC Ottawa TM 2003-142
(19f)

DRDC Ottawa TM 2003-142 85
Annex E : CAMEVAL Baselines for June 8, 2002
The baselines for all InSAR pairs on June 8 are presented in the following figures. The format is the same as documented in Annex B.
(20a)
Figure 38. The baselines for all InSAR pairs on June 8, 2002 (a-aa).

86 DRDC Ottawa TM 2003-142
(20b)
(20c)

DRDC Ottawa TM 2003-142 87
(20d)
(20e)

88 DRDC Ottawa TM 2003-142
(20f)
(20g)

DRDC Ottawa TM 2003-142 89
(20h)
(20i)

90 DRDC Ottawa TM 2003-142
(20j)
(20k)

DRDC Ottawa TM 2003-142 91
(20l)
(20m)

92 DRDC Ottawa TM 2003-142
(20n)
(20o)

DRDC Ottawa TM 2003-142 93
(20p)
(20q)

94 DRDC Ottawa TM 2003-142
(20r)
(20s)

DRDC Ottawa TM 2003-142 95
(20t)
(20u)

96 DRDC Ottawa TM 2003-142
(20v)
(20w)

DRDC Ottawa TM 2003-142 97
(20x)
(20y)

98 DRDC Ottawa TM 2003-142
(20z)
(20aa)

DRDC Ottawa TM 2003-142 99
(20bb)

100 DRDC Ottawa TM 2003-142
Annex F : Ottawa Valley Urban Trial Ground Truth
Here, several sections follow which discuss Calibration, Positions, Moving Target Experiment, ARC Experiment, Ground Truth Logs.
CALIBRATION Below, in Table 16 are the calibration settings for the corner reflectors and ARCs for both lines.
Table 16. Calibration orientation angles for Sept 24 PolSAR acquisitions.
CALIBRATOR CALIBRATOR ORIENTATION **
(MAGNETIC) CALIBRATOR ELEVATION
ANGLE CALIBRATOR
BORESITE ANGLE (TRUE/MAGNETIC)
AIRPLANE HEADING
(TRUE), LOOK DIRECTION
Corner Reflector 267. -4.0 162.8 / 177. 252.8 / Right ARC 267. 58.75 162.8 / 177. 252.8 / Right ** Compass as measured along lower face of corner reflector with sighting arrow (i.e. mirror) towards the left. Magnetic declination is –14.2°.
The calibrators used on September 24, 2002, and the measured calibration orientations are found in the following table. Not that the Left (L) and Right (R) horns are measured separately here.
Table 17. Measured calibration angles on September 24.
CALIBRATOR TYPE IDENTIFIER ORIENTATION ELEVATION (°) (°)
Corner S3 267 -4.0 Corner S4 267 -4.0 Corner S5 267 -4.0 Corner S6 267 -4.0 Corner S7 267 -4.0 Corner S8 267 -4.0 ARC PowerHog 267 L 58.7 / R 58.6 ARC SeraFina 267 L 58.9 / R 58.7
In the calibration field a wagon was parked about 25 m southwest of Cr-S7. There were several bales of hay in the fields (1.5 m wide cylinders).

DRDC Ottawa TM 2003-142 101
GEOGRAPHIC POSITIONS Trimble Pathfinder GPS positions for targets and equipment locations were collected at the Trial. This information is documented in the following Table 18.
Table 18. Positions of Targets and Calibrators on Sept 24.
ITEM LATITUDE LONGITUDE ALTITUDE
ARC 1-2542 Connaught N 45° 22’ 34.13557” ± 0.6 m W 75° 55’ 55.89234” ± 0.6 m 65.001 ±1.0 m
ARC 1-2756 Connaught N 45° 22’ 15.28761” ± 0.7 m W 75° 55’ 32.71245” ± 0.7 m 65.323 ±1.3 m
Aircraft in Connaught field. Tail
N 45° 22’ 15.87873” ± 0.7 m W 75° 55’ 24.72912” ± 0.7 m 65.944 ±1.3 m
Aircraft in Connaught field. Starboard Wing
N 45° 22’ 16.06722” ± 0.7 m W 75° 55’ 24.47822” ± 0.7 m 65.760 ±1.3 m
Aircraft in Connaught field. Nose
N 45° 22’ 16.15040” ± 0.7 m W 75° 55’ 24.74397” ± 0.7 m 65.763 ±1.3 m
Aircraft in Connaught field. Port Wing
N 45° 22’ 16.05093” ± 0.7 m W 75° 55’ 24.97740” ± 0.7 m 65.526 ±1.3 m
Corner 75 cm Near Kennedy Dish
N 45° 20’ 53.15504” ± 0.5 m W 75° 53’ 22.18418” ± 0.5 m 80.277 ±0.9 m
DREO Development ARC N 45° 20’ 51.82853” ± 0.5 m W 75° 53’ 23.60364” ± 0.5 m 79.929 ±1.0 m
T86 parking lot field North N 45° 20’ 50.6492” ± 0.5 m W 75° 53’ 23.62523” ± 0.5 m 80.254 ±0.9 m
T86 parking lot field South N 45° 20’ 49.12045” ± 0.5 m W 75° 53’ 23.41050” ± 0.5 m 80.333 ±0.8 m
Weather Station Parking lot field
N 45° 20’ 50.15485” ± 0.6 m W 75° 53’ 21.87887” ± 0.6 m 81.634 ±1.0 m
Corner 75 cm DREO entrance lawn west
N 45° 20’ 41.72130” ± 0.8 m W 75° 52’ 58.32823” ± 0.8 m 75.102 ±1.5 m
Corner 75 cm DREO entrance lawn north
N 45° 20’ 43.63613” ± 0.6 m W 75° 52’ 58.57770” ± 0.6 m 74.311 ±1.2 m
Corner 75 cm DREO entrance lawn east
N 45° 20’ 44.07025” ± 0.6 m W 75° 52’ 54.82500” ± 0.6 m 72.899 ±1.2 m
Documentation for the permanently located trihedral corner reflectors at Connaught Range follows below (Lloyd Gallop).
The positions of the CCRS corners at Connaught Ranges were measured using the Trimble Pathfinder Coast Guard Beacon Receiver. The corner reflectors location is 4.0 km North of
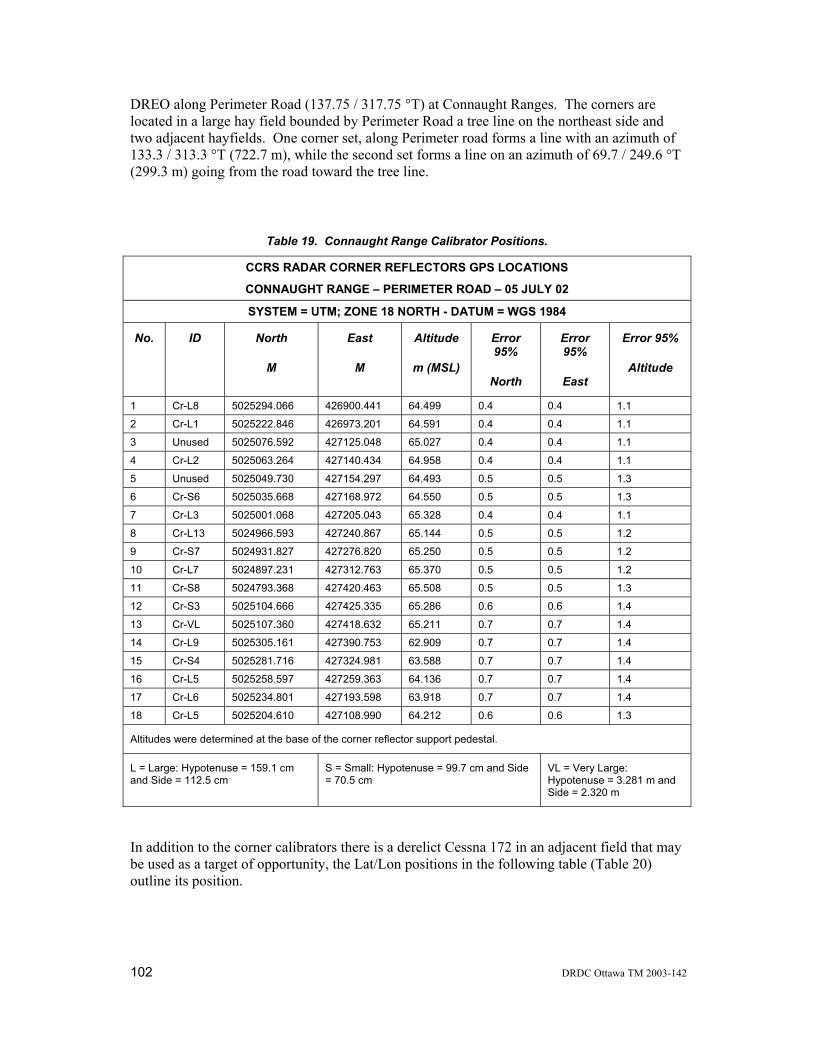
102 DRDC Ottawa TM 2003-142
DREO along Perimeter Road (137.75 / 317.75 °T) at Connaught Ranges. The corners are located in a large hay field bounded by Perimeter Road a tree line on the northeast side and two adjacent hayfields. One corner set, along Perimeter road forms a line with an azimuth of 133.3 / 313.3 °T (722.7 m), while the second set forms a line on an azimuth of 69.7 / 249.6 °T (299.3 m) going from the road toward the tree line.
Table 19. Connaught Range Calibrator Positions.
CCRS RADAR CORNER REFLECTORS GPS LOCATIONS
CONNAUGHT RANGE – PERIMETER ROAD – 05 JULY 02 SYSTEM = UTM; ZONE 18 NORTH - DATUM = WGS 1984
No.
ID North
M
East
M
Altitude
m (MSL)
Error 95%
North
Error 95%
East
Error 95%
Altitude
1 Cr-L8 5025294.066 426900.441 64.499 0.4 0.4 1.1 2 Cr-L1 5025222.846 426973.201 64.591 0.4 0.4 1.1 3 Unused 5025076.592 427125.048 65.027 0.4 0.4 1.1 4 Cr-L2 5025063.264 427140.434 64.958 0.4 0.4 1.1 5 Unused 5025049.730 427154.297 64.493 0.5 0.5 1.3 6 Cr-S6 5025035.668 427168.972 64.550 0.5 0.5 1.3 7 Cr-L3 5025001.068 427205.043 65.328 0.4 0.4 1.1 8 Cr-L13 5024966.593 427240.867 65.144 0.5 0.5 1.2 9 Cr-S7 5024931.827 427276.820 65.250 0.5 0.5 1.2 10 Cr-L7 5024897.231 427312.763 65.370 0.5 0.5 1.2 11 Cr-S8 5024793.368 427420.463 65.508 0.5 0.5 1.3 12 Cr-S3 5025104.666 427425.335 65.286 0.6 0.6 1.4 13 Cr-VL 5025107.360 427418.632 65.211 0.7 0.7 1.4 14 Cr-L9 5025305.161 427390.753 62.909 0.7 0.7 1.4 15 Cr-S4 5025281.716 427324.981 63.588 0.7 0.7 1.4 16 Cr-L5 5025258.597 427259.363 64.136 0.7 0.7 1.4 17 Cr-L6 5025234.801 427193.598 63.918 0.7 0.7 1.4 18 Cr-L5 5025204.610 427108.990 64.212 0.6 0.6 1.3
Altitudes were determined at the base of the corner reflector support pedestal.
L = Large: Hypotenuse = 159.1 cm and Side = 112.5 cm
S = Small: Hypotenuse = 99.7 cm and Side = 70.5 cm
VL = Very Large: Hypotenuse = 3.281 m and Side = 2.320 m
In addition to the corner calibrators there is a derelict Cessna 172 in an adjacent field that may be used as a target of opportunity, the Lat/Lon positions in the following table (Table 20) outline its position.

DRDC Ottawa TM 2003-142 103
Table 20. Positions of Cessna at Connaught Range.
TARGET LATITUDE LONGITUDE ALTITUDE Aircraft in Connaught field. Tail
N 45° 22’ 15.87873” ± 0.7 m W 75° 55’ 24.72912” ± 0.7 m 65.944 ±1.3 m
Aircraft in Connaught field. Starboard Wing
N 45° 22’ 16.06722” ± 0.7 m W 75° 55’ 24.47822” ± 0.7 m 65.760 ±1.3 m
Aircraft in Connaught field. Nose
N 45° 22’ 16.15040” ± 0.7 m W 75° 55’ 24.74397” ± 0.7 m 65.763 ±1.3 m
Aircraft in Connaught field. Port Wing
N 45° 22’ 16.05093” ± 0.7 m W 75° 55’ 24.97740” ± 0.7 m 65.526 ±1.3 m
Below (Figure 39) the calibrator positions are overlaid on the Connaught Range map.
Figure 39. Calibrator positions at Connaught Range.
MOVING TARGET GROUND TRUTHING

104 DRDC Ottawa TM 2003-142
For the velocity experiment, the elemental structures attached by harness to the back of the truck were positioned at the angles described below in Table 21. However, because of the SAR platform’s change in altitude, the elevation angles were no longer appropriate.
Table 21. Moving target orientation angles.
TARGET CALIBRATION ANGLES
ELEVATION ORIENTATION POINTING ROTATION
Dihedral a -13.75 +45 162.8 4.8
Dihedral b -13.75 -45 162.8 4.8
Trihedral -4 0 162.8 4.8
Note, that the grid was difficult to elevate and therefore was elevated on the back deck of a pick up truck to the maximum angle possible which was 38.3 degrees. Video also recorded targets of opportunity at the north end of March Road in Kanata, ON.
This video is available for analysis to determine velocities. The positions of the two video stations are recorded in the photographer’s log in this Annex.
Below are notes documenting other vehicles in the vicinity of the convoy on Rifle Road during the experiment. Note that references are in Local Time.
Line 1; last vehicle followed by large dump truck at less than 50 m distance 14:09:42; truck passes lead vehicle in same direction 14:09:53; dump truck passes lead vehicle in opposite direction 14:12:27; dump truck passes lead vehicle in opposite direction 14:13:50; car passes lead vehicle in opposite direction 14:14:06; car passes lead vehicle in opposite direction 15:35:20; car passes lead vehicle in same direction 16:56:43; dump truck passes lead vehicle in opposite direction
GROUND TRUTH LOGS AND REPORTS
David Schlingmeier notes The convoy for this trial consisted of four trucks with targets mounted. The convoy target sequence was grid, corner reflector (75 cm), dihedral left, and dihedral right. After numerous delays the aircraft was ready to commence the trial shortly after 12:30. The preflight trial protocol to initiate the vehicle motion was confirmation from the aircraft that the “lead-in started”. The balance of commutation calls were “recording data” and

DRDC Ottawa TM 2003-142 105
ending with “data recording off”. The test flight line was flown from east to west at 17,000 feet, onboard aircraft offsets were made to adjust for the lower altitude. The next significant flight change was that the flight line pass number 1 through 8 would be flown from west to east. Following the completion of line 1, the end of the road was reached at the same time recording data was declared; it became obvious that the start protocol would require adjustment. The west to east change meant that the targets would be at the beginning of the flight line rather than at the end of the line. This change forced the moving protocol to be adjusted on the fly, a delay of 3 minutes was add to the “start of lead-in” declaration for line 3. The delay times for the remaining lines were adjusted with a best efforts estimation based on our recorded times of communications with the aircraft. Given that lead-in times vary from 3 to5 minutes and the image record window ranged from 0 to 5 ½ minutes, there is a very significant chance that important data will not be recorded. This fact leads to two recommendations. First, the commutations protocol would have to be followed more religiously so that the vehicle movement could be timed to be inside the recording window. The alternative is to design the road coarse so that the length would generate a transit time greater than the aircraft flight line transit time.
Lloyd Gallop Notes One component of this trial was to setup four vehicles as moving targets. The vehicles used were ½ -trucks with various targets mounted on the truck beds and instrumented with logging GPS kits to determine position, time and velocity. The 4-targets included one 75-cm corner reflector, two 36” dihedrals one set 45° to port and the other to starboard and the final unit was a steel grid mounted at 38.3°. The over all dimensions of the grid was 91.2 wide by 183.5 cm long; the vertical grid spacing was 3.2 cm with a depth of 2.5 cm and a horizontal stabilizing bar was welded on the bottom side at 10.5-cm intervals. The trucks were deployed on a 2 km stretch of Rifle road near the DRDC-O site, sequenced in the following order Grid, Corner, Dihedral Left, and Dihedral Right. The protocol for vehicle travel was to have vehicle 1 depart on the appropriate signal from the aircraft with each vehicle following at a minimum of 50 meters at one of three velocities (20, 30, 35 kph) depending on the line number. Nine line were executed with line one been scrubbed by the aircraft very early into the run, the vehicles completed the pass anyway. The flight line were to be flown from east to west, but due to wind conditions lines 2 through 9 were flown from west to east and the line two format was not flown. Vehicle Target Trimble GPS kit Driver // Passenger Ford ½ ton Gray 337 2KY
Grid DREO A#21616 Gallop / Schlingmier
Dodge Dakota Black 241 2KY
Corner Cansel s/n 00017134 B. Boyle
Dodge Dakota Red 264 1KY
Dihedral Left Cansel s/n 022025196
K. Mattar
Dodge Dakota Black 264 0KY
Dihedral Right Cansel s/n 0220259159
Craig Williams // Fred Fletcher
The downloaded GPS data for each vehicle is referenced to the s/n of the GPS kit used.

106 DRDC Ottawa TM 2003-142
In the figure below (Figure 40), an example of the velocity and heading information from the GPS data is shown for the truck with the trihedral on Pass 1.
1.11 1.12 1.13 1.14 1.15 1.16 1.17 1.18 0
5
10
15
20
25
30
35
40
335
336
337
338
339
340
341
342
343
344
345
Velocity = 28.5 +/- 1.8
Heading = 337.9 +/- 0.4 deg
V e l o c i t y k p h
H e a d i n g
Time
Figure 40. Velocity and heading information for pass 1.
ARC EXPERIMENT Below are the log notes of Mike Boyle during the experiment. Local Time is referenced here. Time Event 08:00 started moving equipment to site Levelling tripod was difficult. Eventually got it to within 3 deg of level Unthreaded parts of bolts for separation arms were too long - shimmed with washers
Setting Azimuth went well. Sighting between separation arms allowed precision AZ measurement Elevation was difficult to adjust (Impossible for one person) Need elevation marks on mount.
A counter balance/lever arm behind separation arms would help Elevation was established within 1/2 deg according to level. Az was within about 1 degree
Azimuth limit set by resolution of compass.

DRDC Ottawa TM 2003-142 107
9:42 Power on 12.33 V DC 10:15 12.33 V DC 10:35 12.31 V DC ,Train moving S-N 10:48 informed 1/2 hour from start GPS Position 45d 20m 35sec N, 75d 52m 48s W 18 430 962 E 50 21520 N UTM Janice says 18 T 043 02 87 5021965 11:18 Power on 12.29 V DC 11:22 15 min from takeoff, 25 min from overhead 11:40 12.27 V DC 11:52 8-9 minutes from start 11:55 7 minutes out, 12.27 V DC 12:10 12.27 V DC 12:11 Car on road 12:37 12.27 V DC 12:40 Starting E-W run 12:40 Scrubbing run. Will re-start W to E at 17000 ft 12:53 12.27 V DC 12:57 7 minutes to start 13:06 starting lead in 13:10 starting line #1 13:11 Pulses seen 13:15 finished line #1, 12.27 V DC 13:30 12.27 V DC 13:34 starting lead in #2 13:39 starting line #2 13:40 Pulses seen 13:41 Truck on field moving along fence 13:45 finished line 2 13:47 12.27 V DC 14:06 starting run in #3 14:11 starting line #3 14:12 Pulses seen 14:17 finished line #3 14:20 12.26 V DC, oscilloscope battery low 14:34 starting run in #4 14:37 starting line #4 14:43 finished line #4 No pulses seen 12.26V DC, Scope battery low 15:02 starting run in #5 15:04 starting line #5 15:10 finished line #5, no pulses seen 15:11 12.25 V DC, scope battery low 15:31 starting line #6 (no report of start of run in?) 15:33 small aircraft flying overhead SE-NW 15:35 12.25 V DC, scope battery low, 10 V DC on GAL-3 Zener 15:37 finished line 6, no pulses seen 15:52 starting run in #7 15:55 starting line #7

108 DRDC Ottawa TM 2003-142
15:58 scope shut down 16:00 finished line #7, no pulses seen 16:18 starting run in #8 16:21 starting line #8 16:22 scope shut down 16:27 finished line #8, finished for the day, battery 12.25 V DC Pre Teardown elevation measurements: TX antenna 56.8 deg RX antenna 56.9 deg 17:15 equipment dismantled and inside.
ENVIRONMENTAL DATA Environmental data consisted of meteorological information and soil moisture measurements. These data follow.
SOIL MOISTURE The soil moisture measurements were taken by Terry Potter. Below, are his logged notes followed by his soil moisture measurements. A set of soil moisture measurements were taken about 20 – 25 m northwest of Cr-S7. The time was 10:30. Another set of soil moisture measurements were taken 1 – 2 m away from the original site. These measurements were taken at 14:30. In general, the surface was very dry, but 4 – 6 cm down there was visible evidence of moisture. There appeared to be a moisture gradient from the surface on down. Taking the soil moisture measurements was a very difficult task. The surface was covered with a 1 cm layer of live and dead vegetation. The soil underneath was dry and very hard. A great deal of effort was needed just to get the shovel into the ground. A shovel full of earth was pried up and extracted so soil moisture measurements could be made by sliding the probe horizontally into the ground. There were very few places where this could be done successfully. The dry soil often cracked around the probe, thereby reducing the accuracy of the measurements. The results are given, but I don’t know what the accuracy would be. 10:30 Measurements % Soil Moisture Depth 8.8 2 cm 15.8 3-4 cm 13.9 3 cm

DRDC Ottawa TM 2003-142 109
14.9 3 cm 13.7 2–3 cm 12.6 2–3 cm Average with outlier (8.8) removed: 14.2% 14:30 Measurements % Soil Moisture Depth 9.2 2–3 cm 11.8 2 cm 7.8 3 cm 16.4 2 cm 10.9 2 cm Average: 11.2%
PHOTOGRAPHER’S LOG GPS waypoints taken by DRDC photographer Janice Lang. Time indicated is GMT (see photo 02-10038 for reference) Waypoint 002 24-SEP-02 13:43 N45 22 03.3 W75 56 55.6 Mirielle Quinton’s video position at St. Isadore’s school Photos 02-9951 to 02-9953 Waypoint 003 24-SEP-02 13:54 N45 21 51.8 W75 56 40.9 Bob Gervais’ video position at 1035 March Road, Kanata Waypoint 004 24-SEP-02 14:59 N45 20 51.8 W75 53 23.7
Mike Kelly with Arcs in field near T-86 Photos 02-9985 to 02-9995
Waypoint 005 24-SEP-02 15:10 N45 20 52.5 W75 53 21.1 Three antennas on top of Midas shelter near parking lot Photos 02-10002 to 02-10003
Waypoint 006 24-SEP-02 15:27 N45 21 01.7 W75 53 22.3 CRC Midas antenna not extended on covered trailer, with antenna array lying on ground
beside it, at back of site east of DRDC satcom antenna farm. 11:27 am local time
Photos 02- 10013 to 02-10014

110 DRDC Ottawa TM 2003-142
Waypoint 007 24-SEP-02 15:36 N45 21 33.6 W75 53 05.9
Midas shelter with antenna extended, at back of the “loop” at the back of the site at Shirleys Bay. 11:36 am local time Photos 02-10015 to 02-10019
Waypoint 008 24-SEP-02 16:52 N45 21 04.5 W75 52 31.7 My car (Ford Escort station wagon) off Rifle Road near back side gate to Shirleys Bay. It was parked there while I took photos of the trucks with targets driving by during the first run. 12:52 pm local time Photo of car: 02-10033 Photos of trucks on road: 02-9954 to 02-9984 and 02-10020 to 02-10060
Waypoint 009 24-SEP-02 17:56 N45 25 18.2 W75 42 07.1
Crane at Sparks St., near corner of Bank and Wellington. At 1:50pm it had been there for at least an hour, and was packing up to leave when I took the photos. At 2:50 pm local time, it was gone. Photos 02-10061 to 02-10062
Waypoint 010 24-SEP-02 18:22 N45 25 32.9 W75 42 01.1
Parliament Hill library. GPS waypoint taken at scissor lift at scaffolding at back of library with fence around it (wood fence about 10’ high) Photos 02-10080, 02-10081, 02-10085, 02-10089 to 02-10093
Waypoint 011 24-SEP-02 18:30 N45 25 32.1 W75 42 03.5
Behind Parliament hill library. Bell in concrete circle. (bearing 322°) Photo 02-10094
Waypoint 012 24-SEP-02 18:33 N45 25 30.8 W75 42 04.8 Pagoda behind Parliament Buildings (bearing 35°) with copper roof. Photo 02-10095 Waypoint 013 24-SEP-02 19:20 N45 24 27.7 W75 44 18.8 Tunney’s pasture.
Photo series 02-10105 to 02- 10109 The bearing of the street was 240 °. The photos were taken from the road median opposite Butler Hut, Bldg. No.11. Image 02-10105 shows old Health Canada building west of modern Health Canada Bldg. 9.
Waypoint 014 24-SEP-02 19:29 N45 24 30.6 W75 44 20.9
Tunney’s Pasture. At the back of the old Health Canada building (west of building #9) a large crane was tearing down the back north side of the building that faced the river. There was a wood fence surrounding the building, and a pile of construction debris. Photos 02-10110 to 02-10111
Waypoint 015 24-SEP-02 19:40 N45 24 23.5 W75 44 32.3

DRDC Ottawa TM 2003-142 111
Tunney’s Pasture (beside Bldg.22 – Frederick banting Building) Parking lot at west end of Tunney’s Pasture, looking in all directions. Photo series 02-10112 to 02-10118
Waypoint 016 24-SEP-02 19:57 N45 24 12.3 W75 44 13.9
Tunney’s Pasture. Buildings on Yarrow St. near Goldenrod (National Defence building 16) Waypoint taken near chain link fence with row of trees. Photos 02-10124 to 02-10126
Waypoint 017 24-SEP-02 20:11 N45 24 18.0 W75 44 12.9 Tunney’s Pasture. Scaffolding on side of building on south side. Sorrel St. near Du Charron. (Looking straight on at scaffolding would be bearing of 158°) Photos 02-10127 to 10134
Waypoint 018 24-SEP-02 20:16 N45 24 21.2 W75 44 08.2 Photo series 02-10135 to 02-10142 Tunney’s Pasture
In the middle of the median near Sorrel and Holland Ave. Construction scaffolding at Building 5, Jean talon building, east side of Holland Ave.
Waypoint 019 24-SEP-02 20:22 N45 24 22.4 W75 44 06.4
Tunney’s Pasture, Building 5 Jean Talon Bldg. Waypoint taken about 15’ to 20’ west of side of building where scaffolding is. Photos 02-10143 to 02-10145
Waypoint 020 24-SEP-02 20:42 N45 23 56.6 W75 44 07.2
Westboro corner of Smirle and Wellington. Wellington runs 71° looking west and 255° looking east. Photo series 02-10152 to 02-10157 looks down Wellington St. and Smirle St.)
Waypoint 021 24-SEP-02 20:57 N45 23 52.2 W75 44 27.3
Corner of Wellington and Carleton St. in Westboro. (Loeb, car dealerships and auto centre, and small stripmall.) Wellington runs 60° looking west. Photos 02-10158 to 02-10161
Waypoint 022 24-SEP-02 21:04 N45 23 50.6 W75 44 31.7 Westboro corner of Wellington and Island Park, looking in all directions. Photos 02-10162 to 02-10168 Waypoint 023 24-SEP-02 21:12 N45 23 40.1 W75 44 55.9
Westboro corner of Richmond and McRae. Powerline tower beside Bushtakah store. Photo series 02-10169 to 02-10173, looking in all directions, clockwise.
Waypoint 024 24-SEP-02 21:27 N45 23 36.2 W75 45 03.6 Westboro corner of Richmond and Athlone. Construction on south side face of building on Richmond Road. Photo 02- 10174 is construction. Photos 02-10175 to 02-10177 show the rest of the street corner.

112 DRDC Ottawa TM 2003-142
PHOTOS TAKEN IN JAN, 2003 OF OTTAWA URBAN AREAS Image 03-0035 Photo of U.S. Embassy, taken from Major’s Hill Park looking at building with a bearing of 65 ° true. This side of the building (the back) runs along Mackenzie St. Image 03-0037, 03-0038 Same as above, but detail views of the roof peaks. Image 03-0039, 03-0040, 03-0041 Same info as image 03-0035, but these 3 shots show details of the middle, north, and south sections of the back (west) wall of the embassy. Image 03-0044, 03-0045, 03-0046, 03-0052 The U.S. Embassy, detail views taken at a bearing of approx. 100° true. (taken from the sidewalk of the road between major’s Hill Park and the national Gallery.) These detail views show the northwest corner of the building and fence. Image 03-0055, 03-0056 These views of the U.S. Embassy show the northwest short end of the building, and you are looking at a bearing of approximately 155°. 03-0055 shows the part of the back end that runs parallel to MacKenzie St., and 03-0056 shows part of the front side of the building that runs parallel to Sussex. Image 03-0057, 03-0058 This shows the front face of the U.S. Embassy building that faces northeast. Therefore these photos were taken (looking southwest to the building) at a bearing of approximately 245° Image 03-0060, 03-0062 This shows the south corner of the U.S. Embassy. 03-0060 shows the lower level (front) on Sussex Drive, where there is a garage and guardhouse, and 03-0062 shows the higher level (back) on MacKenzie Ave. This was taken from the pedestrian staircase that runs beside the building linking the 2 street levels. There is also an angular metal abstract sculpture at this end of the building, as seen in 03-0062. If you were looking at this southeast end of the building you would be facing about 335°.
Tunney’s Pasture: DND Building 16 Image 03-0066 This is the front of the building, at the main entrance. When you are looking at the front of the building you are facing 250° true. Waypoint E1 was taken at the entrance at this fence: Lat / Lon Waypoint E1 17-JAN-03 19:34 N45 24 13.2 W75 44 17.9 UTM Waypoint E1 17-JAN-03 19:34 18 T 442221 5028059 The person standing beside the fence is 5’ 9”. This fence is electrified with low voltage at all times. Image 03-0067 to 03-0072 Same info as above. These were all taken at the front of the building, looking to the left and the right showing the fence surrounding the building.

DRDC Ottawa TM 2003-142 113
Image 03-0073 This is the fence at the northwest corner of the building. There is a small guardhouse inside the fence. Image 03-0074 This is the fence running along the northwest end of the building. Image 03-0075 to 03-0078 These images show the northwest side of the building. You are looking 160° when straight on toward the building. Image 03-0079 to 03-0082 This is the southwest, back of the building. When looking straight on to the back, you are looking at a bearing of 70°. Image 03-0083, 03-0084 This satellite dish is at the south back corner of the building. (See previous overall shots of back of building). Image 03-0085 to 03-0088 This shows the west side of the building. When looking straight on toward this side you are looking at a bearing of 340°. Image 03-0089, 03-0090 This shows the southest corner (side and front) of the building. Image 03-0091 to 03-0094 This shows the front of the building looking from the southeast corner. Image 03-0095, 03-0096 This is a ramp, handrail and interior section of fence between the perimeter fence and the front entrance of the building. The man in the photo is 5’ 9”.
Tunney’s Pasture, Health Canada Brooke Claxton Building 9 Image 03-0097 to 03-0103 This is the front entrance and southeast face of the building In the detail views you can see people at the front entrance which gives you a sense of scale. The waypoint E2 was taken at the front entrance of this building: Lat / Lon Waypoint E2 17-JAN-03 20:41 N45 24 31.5 W75 44 14.3 UTM Waypoint E2 17-JAN-03 20:41 18 T 442303 5028624 Image 03-0104 This is the front, southwest corner of the building (detail) Image 03-0105, 03-0106 This shows the now vacant lot southwest of the building where they were tearing down a 2-3 storey old building during the September trial. Image 03-0107, 03-0108 This is the southwest corner of the building (front and side).

114 DRDC Ottawa TM 2003-142
Image 03-0109 to 03-0113 This is the southwest side of the building . Looking straight on to this side would be looking in a bearing of 68° Image 03-0114 to 03-0117 This is the northwest back corner of the building. The land along the side of the building slopes down to a service road below at the level of the “basement” of the building. The concrete “block” foundation that extends wider than the main highrise part is at sidewalk/patio level at the front of the building, and is revealed as a garage entrance at the back. Looking toward this back corner would be a bearing of 115°. Image 03-0118 The construction site southwest of Building 9 as previously described. Image 03-0119 to 03-0121 The back, northwest side of the building. Looking towards this side would be a bearing of 158°. Image 03-0122 The back northeast corner of the building. Image 03-0123 to 03-0125 The northeast side of the building. Facing this side would be a bearing of 248° Image 03-0126 Bicycle racks under the building near the front. These may have been in a different place in September. Image 03-0127 to 03-0129 Detail views of the concrete pillars and front entrance area of the building.

DRDC Ottawa TM 2003-142 115
Annex G : BASELINES FOR OTTAWA TRIAL
From the experiment in the Ottawa valley on Sept 24, 2002, several baselines were calculated and are documented here. The format is the same as in Annex B.
(a)
Figure 41. Baselines for the Ottawa valley Trial (a-bb).

116 DRDC Ottawa TM 2003-142
(b)
(c)

DRDC Ottawa TM 2003-142 117
(d)
(e)

118 DRDC Ottawa TM 2003-142
(f)
(g)

DRDC Ottawa TM 2003-142 119
(h)
(i)

120 DRDC Ottawa TM 2003-142
(j)
(k)

DRDC Ottawa TM 2003-142 121
(l)
(m)

122 DRDC Ottawa TM 2003-142
(n)
(o)

DRDC Ottawa TM 2003-142 123
(p)
(q)

124 DRDC Ottawa TM 2003-142
(r)
(s)

DRDC Ottawa TM 2003-142 125
(t)
(u)

126 DRDC Ottawa TM 2003-142
(w)
(x)

DRDC Ottawa TM 2003-142 127
(y)
(z)

128 DRDC Ottawa TM 2003-142
(aa)
(bb)

DRDC Ottawa TM 2003-142 129
List of Symbols/abbreviations/acronyms/initialisms
CCRS Canada Centre Remote Sensing
CF Canadian Forces
CFB Canadian Forces Base
CSA Canadian Space Agency
CLR Clement Lake Road
CR Corner Reflector
dGPS Differential Global Positioning System
DND Department of National Defence
DRDC Defence Research and Development Canada
DREO Defence Research and Establishment Ottawa
DREV Defence Research and Establishment ValCartier
HAE Height above the ellipse
HAG Height above the ground
InSAR Interferometric SAR
LAV Light Armoured Vehicle
MSL Mean Sea Level
PFC Pacific Forestry Centre
Pol InSAR Polarimetric Interferometric SAR
POC
RCS Radar Cross Section
SAR Synthetic Aperture Radar

130 DRDC Ottawa TM 2003-142
TCR Target-to-Clutter Ratio
UTM Universal Transverse Mercator
WGS World Geodetic System

UNCLASSIFIED SECURITY CLASSIFICATION OF FORM
(highest classification of Title, Abstract, Keywords)
DOCUMENT CONTROL DATA (Security classification of title, body of abstract and indexing annotation must be entered when the overall document is classified)
1. ORIGINATOR (the name and address of the organization preparing the document. Organizations for whom the document was prepared, e.g. Establishment sponsoring a contractor’s report, or tasking agency, are entered in section 8.)
Defence R&D Canada - Ottawa Ottawa, Ontario, Canada K1A 0Z4
2. SECURITY CLASSIFICATION (overall security classification of the document,
including special warning terms if applicable) UNCLASSIFIED
3. TITLE (the complete document title as indicated on the title page. Its classification should be indicated by the appropriate abbreviation (S,C or U) in parentheses after the title.)
Polarimetric Interferometry Experiment Trials for years 2001 and 2002: Experiment Design, Ground Truthing, Data
Quality and Analysis (U)
4. AUTHORS (Last name, first name, middle initial)
Yeremy, Maureen; Livingstone, Chuck; Mattar, Karim E.; Gallop, Lloyd; Lang, Janice; Beaudoin, Andre
5. DATE OF PUBLICATION (month and year of publication of document)
September 2003
6a. NO. OF PAGES (total containing information. Include Annexes, Appendices, etc.)
142
6b. NO. OF REFS (total cited in document)
23
7. DESCRIPTIVE NOTES (the category of the document, e.g. technical report, technical note or memorandum. If appropriate, enter the type of report, e.g. interim, progress, summary, annual or final. Give the inclusive dates when a specific reporting period is covered.)
Technical Memorandum
8. SPONSORING ACTIVITY (the name of the department project office or laboratory sponsoring the research and development. Include the address.)
RAST, DRDC Ottawa, DND, Ottawa ON K1A 0Z4
9a. PROJECT OR GRANT NO. (if appropriate, the applicable research and development project or grant number under which the document was written. Please specify whether project or grant)
15es21
9b. CONTRACT NO. (if appropriate, the applicable number under which the document was written)
10a. ORIGINATOR’S DOCUMENT NUMBER (the official document number by which the document is identified by the originating activity. This number must be unique to this document.)
DRDC Ottawa TM 2003-142
10b. OTHER DOCUMENT NOS. (Any other numbers which may be assigned this document either by the originator or by the sponsor)
11. DOCUMENT AVAILABILITY (any limitations on further dissemination of the document, other than those imposed by security classification) ( x ) Unlimited distribution ( ) Distribution limited to defence departments and defence contractors; further distribution only as approved ( ) Distribution limited to defence departments and Canadian defence contractors; further distribution only as approved ( ) Distribution limited to government departments and agencies; further distribution only as approved ( ) Distribution limited to defence departments; further distribution only as approved ( ) Other (please specify):
12. DOCUMENT ANNOUNCEMENT (any limitation to the bibliographic announcement of this document. This will normally correspond to
the Document Availability (11). However, where further distribution (beyond the audience specified in 11) is possible, a wider announcement audience may be selected.)
UNCLASSIFIED
SECURITY CLASSIFICATION OF FORM DDCCDD0033 22//0066//8877

UNCLASSIFIED SECURITY CLASSIFICATION OF FORM
13. ABSTRACT ( a brief and factual summary of the document. It may also appear elsewhere in the body of the document itself. It is highly desirable that the abstract of classified documents be unclassified. Each paragraph of the abstract shall begin with an indication of the security classification of the information in the paragraph (unless the document itself is unclassified) represented as (S), (C), or (U). It is not necessary to include here abstracts in both official languages unless the text is bilingual).
Synthetic Aperture Radar (SAR) theory has several disciplines which includes Polarimetric SAR (PolSAR) and Interferometric SAR (InSAR). Recent research in the past decade has introduced a new method which utilizes both of these disciplines and is called Polarimetric Interferometric SAR (Pol InSAR). Research to date has been focussed on determining forest heights from interferograms constructed from PolSAR data which has been decomposed so that the data can be preferentially weighted with respect to dominant environmental scattering mechanisms associated with a forest. In this way, phase difference interferograms can be constructed utilizing forest foliage scattering and ground interaction near the forest floor information, in order to estimate forest heights. While these applications are of some interest to Department of National Defence (DND) Canada (i.e. Mapping and Charting), the Experimental Trials, documented here, were designed for utilizing both conventional Pol InSAR methods and developing new Pol InSAR methods specifically for military applications. Three Trials collected repeat pass Pol InSAR data for several experiments. The data were collected by Environmental Canada’s SAR C/X system which has similar properties to the future RADARSAT 2. Key areas of Pol InSAR research associated with this study include : (i) motion effects and motion detection with PolSAR and Pol InSAR data, and (ii) the utilization of propagation models for inversion of military targets such as tall obstructions, maritime vessels, internal and external building attributes. The experiment design and ground truthing are documented here in reference to the objectives. Some preliminary results and comments regarding lessons learned are also documented. This technical memorandum is a companion to another DRDC report which documents a Pol InSAR literature review and DND objectives for the Pol InSAR project experiments, and simulation results.
14. KEYWORDS, DESCRIPTORS or IDENTIFIERS (technically meaningful terms or short phrases that characterize a document and could be helpful in cataloguing the document. They should be selected so that no security classification is required. Identifiers such as equipment model designation, trade name, military project code name, geographic location may also be included. If possible keywords should be selected from a published thesaurus. e.g. Thesaurus of Engineering and Scientific Terms (TEST) and that thesaurus-identified. If it is not possible to select indexing terms which are Unclassified, the classification of each should be indicated as with the title.)
SAR Polarimetry PolSAR Pol-InSAR Polarimetric Interferometry Polarimetric Radar Interferometry
UNCLASSIFIED
SECURITY CLASSIFICATION OF FORM


Defence R&D Canada
Canada’s leader in defenceand national security R&D
Chef de file au Canada en R & Dpour la défense et la sécurité nationale
R & D pour la défense Canada
www.drdc-rddc.gc.ca