Embed Size (px)
Citation preview
© Yann Arthus-Bertrand / Altitude
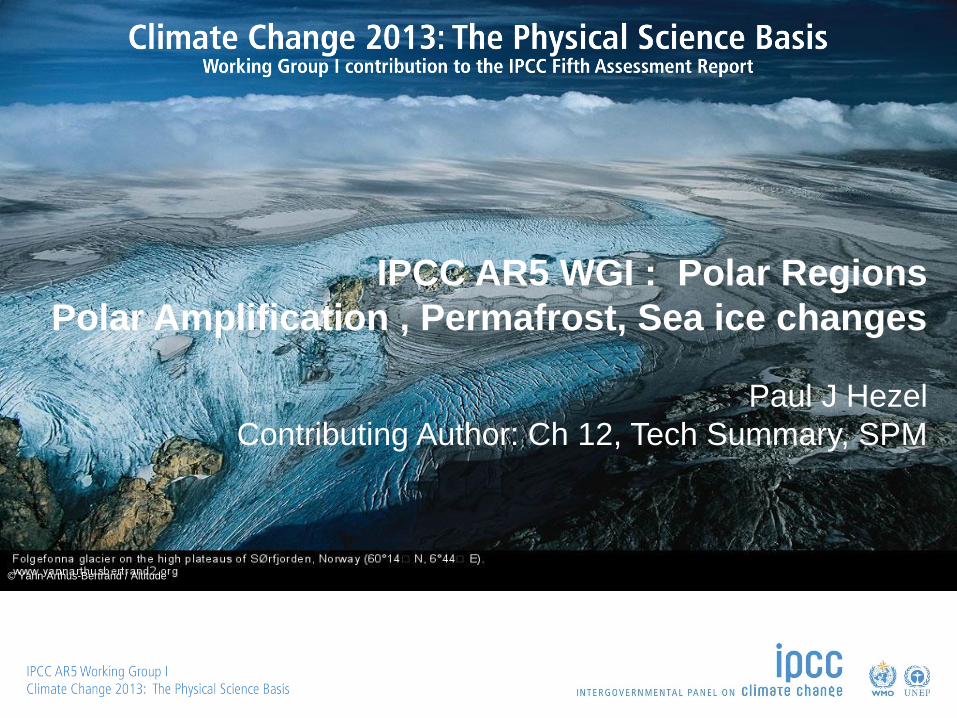
IPCC AR5 WGI : Polar Regions
Polar Amplification , Permafrost, Sea ice changes
Paul J Hezel
Contributing Author: Ch 12, Tech Summary, SPM

Summary for Policymakers (SPM): All Figures © IPCC 2013
Over the last two decades, the Greenland and Antarctic ice
sheets have been losing mass, glaciers have continued to
shrink almost worldwide, and Arctic sea ice and Northern
Hemisphere spring snow cover have continued to decrease in
extent (high confidence).
It is very likely that the Arctic sea ice cover will continue to
shrink and thin and that Northern Hemisphere spring snow
cover will decrease during the 21st century as global mean
surface temperature rises. Global glacier volume will further
decrease.

IPCC AR5 WGI
Polar Amplification

Polar amplification All Figures © IPCC 2013
Polar Amplification – zonal mean surface temperature warming at
high latitudes exceeds global average temperature change.
New temperature reconstructions and simulations of past climates
show with high confidence polar amplification in response to
changes in atmospheric CO2 concentration.
In the absence of a strong reduction in the Atlantic Meridional
Overturning, the Arctic region is projected to warm most (very high
confidence)

Box 5.1, Fig. 1; Fig. 12.41
Polar amplification
All Figures © IPCC 2013

IPCC AR5 WGI
Permafrost

Permafrost and frozen ground All Figures © IPCC 2013
There is high confidence that
permafrost temperatures have increased in most regions since the
early 1980s. Observed warming was up to 3°C in parts of Northern
Alaska (early 1980s to mid-2000s) and up to 2°C in parts of the
Russian European North (1971 to 2010). In the latter region, a
considerable reduction in permafrost thickness and areal extent has
been observed over the period 1975 to 2005 (medium confidence).

Figure 12.33
Near surface permafrost area (frozen ground up to 3.5 m depth)
All Figures © IPCC 2013

Permafrost and frozen ground All Figures © IPCC 2013
It is virtually certain that near-surface permafrost extent at high
northern latitudes will be reduced as global mean surface
temperature increases. By the end of the 21st century, the area
of permafrost near the surface (upper 3.5 m) is projected to
decrease by between 37% (RCP2.6) to 81% (RCP8.5) for the
model average (medium confidence).

IPCC AR5 WGI
Arctic sea ice

The annual mean Arctic sea ice extent decreased over the period 1979
to 2012 with a rate that was very likely in the range 3.5 to 4.1% per decade
(range of 0.45 to 0.51 million km2 per decade), and very likely in the range
9.4 to 13.6% per decade (range of 0.73 to 1.07 million km2 per decade) for
the summer sea ice minimum (perennial sea ice).
The average decrease in decadal mean extent of Arctic sea ice has been
most rapid in summer (high confidence); the spatial extent has decreased
in every season, and in every successive decade since 1979 (high
confidence)
There is medium confidence from reconstructions that over the past three
decades, Arctic summer sea ice retreat was unprecedented and sea
surface temperatures were anomalously high in at least the last 1,450
years.
Arctic sea ice

Figure 4.3
Annual and seasonal Arctic sea ice extent, 1979-2012
All Figures © IPCC 2013

Figure 4.2
Spatial trends in Arctic sea ice concentration, 1979-2012
All Figures © IPCC 2013

Figure 9.24a
Modeled Arctic sea ice extent, 1900-1912
All Figures © IPCC 2013

Figure 9.24c
Distribution of observed Arctic sea ice extent trends
All Figures © IPCC 2013

Figure 12.28ab
Projected Arctic sea ice extent changes
All Figures © IPCC 2013

Figure 12.29a,c
Maps of multimodel mean Arctic sea ice concentration
All Figures © IPCC 2013
1986-2005 (39 models)
RCP 8.5, 2081-2100 (37 models)

It is very likely that the Arctic sea ice cover will continue to
shrink and thin and that Northern Hemisphere spring snow cover
will decrease during the 21st century as global mean surface
temperature rises.
Year-round reductions in Arctic sea ice extent are projected by the end of
the 21st century from multi-model averages. These reductions range
from 43% for RCP2.6 to 94% for RCP8.5 in September and from 8% for
RCP2.6 to 34% for RCP8.5 in February (medium confidence).
A nearly ice-free Arctic Ocean (sea ice extent less than 106 km2 for at
least five consecutive years) in September is likely before mid-century
under RCP8.5 (medium confidence).
SPM: Cryosphere

© Yann Arthus-Bertrand / Altitude
www.climatechange2013.org
Full Report and Background Information

IPCC AR5 WGI
Extra slides

Figure SPM.7b
Northern Hemisphere September sea ice extent
All Figures © IPCC 2013

Figure SPM.8c
Maps of CMIP5 multi-model mean Arctic sea ice
All Figures © IPCC 2013
RCP 2.6 RCP 8.5

Figure 4.2a
Arctic sea ice seasonal cycle, by decade, 1979-2012
All Figures © IPCC 2013

Antarctic sea ice
All Figures © IPCC 2013
A decrease in Antarctic sea ice extent is expected
during the 21st century, but with low confidence
It is very likely that the annual mean Antarctic sea ice extent increased at a
rate in the range of 1.2 to 1.8% per decade (range of 0.13 to 0.20 million
km2 per decade) between 1979 and 2012. There is high confidence that
there are strong regional differences in this annual rate, with extent
increasing in some regions and decreasing in others.

Figure 4.7
Spatial trends in Antarctica (1979-2012)
All Figures © IPCC 2013

Figure 12.28cd
Projected Antarctic sea ice extent change
All Figures © IPCC 2013

Figure 12.31e RCP8.5 Arctic sea ice extent CMIP5 projections (2010-2100)
All Figures © IPCC 2013

Figure SPM.8a,b Maps of CMIP5 multi-model mean results
All Figures © IPCC 2013


![OFFSHORE PERMAFROST IN THE KARA SEA · 2018. 3. 14. · 61 OFFSHORE PERMAFROST IN THE KARA SEA 2007], specifically, to be controlled by taliks [Rokos et al., 2001; Rekant et al.,](https://img.dokumen.tips/doc/110x75/60071aff6732d72746038e95/offshore-permafrost-in-the-kara-sea-2018-3-14-61-offshore-permafrost-in-the.jpg)


![OFFSHORE PERMAFROST IN THE KARA SEA · 2012-11-22 · 61 OFFSHORE PERMAFROST IN THE KARA SEA 2007], specifically, to be controlled by taliks [Rokos et al., 2001; Rekant et al., 2009]](https://img.dokumen.tips/doc/110x75/5f5e28fddd2223084f34af54/offshore-permafrost-in-the-kara-2012-11-22-61-offshore-permafrost-in-the-kara.jpg)