Embed Size (px)
Citation preview

Regional Project on Labour Relations and Social Dialogue
Annual Review 2014
Poland - Labour Relations and Social Dialogue
Author: Michał Polakowski1,
Executive Summary
Poland’s economy belongs to one of the fastest and steady developing in the EU. While unemployment rate
has declined, the dire social situation continues, especially in terms of youth unemployment. Along very
small dynamics of jobs creation, the real growth of wages is marginal. The labour market restructuring
continues as the atypical employment is maintained, especially among the youngest workers.
As in the previous years the public spending is driven by the paradigm of fiscal consolidation, strongly
supported by the EU agenda. The labour market policy remains limited. On the taxation side, the tax-free
amount and taxation thresholds have been frozen and the higher VAT levels have been maintained.
However, the new tax deductions have been introduced for families with children.
Importantly, the unions left the Tripartite Commission in the mid-2013, but also regional commissions for
social dialogue and very little progress has been done also in 2014. The unionisation remains low, especially
in the private sector. However, a slight growth in the membership has been noted.
© Friedrich-Ebert-Stiftung
Regional Project for Labour Relations and
Social Dialogue in Central and Eastern Europe
Maróthyho 6
SK-811 06 Bratislava
The text is available online:
www.fesmoe.eu
The views expressed in this publication are
not necessarily those of the Friedrich-Ebert-
Stiftung or of the organization for which the
author works.
1 Dr. Michał Polakowski (35) holds PhD in Public Policy and Policy Analysis from Maastricht University
(Netherlands). He is a public policy analyst dealing with social policy, labour market and labour relations,
affiliated to International Centre for Research and Analysis in Warsaw.
2
1. Report
1.1. Executive Summary
Poland’s economy belongs to one of the fastest
and steady developing in the EU. However, the
dire social situation continues, especially in terms
of youth unemployment. Along very small
dynamics of job creation, the real growth of wages
is marginal. The labour market restructuring is
apparent as the atypical employment is
maintained, especially among the youngest
workers.
Also in 2013-2014, the public spending is driven
by the paradigm of fiscal consolidation. The
spending from the Labour Found is significantly
restricted. On the taxation side, the tax-free
amount and taxation thresholds have been frozen
and the higher VAT levels have been maintained.
Such measures hit the poorest
Importantly, the unions have left the Tripartite
Commission in the mid-2013, but also regional
commissions for social dialogue, which hampers
the social dialogue in Poland. The unionisation
remains low, especially in the private sector.
However, some signs of growing membership are
visible, which is a positive development
1.2. Socio-economic developments
Compared to the previous year, the GDP in 2013
increased by 1,6%, means that its dynamics, still
high by international standards, is declining. The
estimations for 2014 are 3,3-3,4%. As for the
contribution of different factors to the growth, the
significant role in the end of 2013 and 2014 was
played by domestic demand. As in previous years,
an important factor behind the GDP growth was
the increased consumption. The role of export
diminished, also due the Ukrainian conflict and
Russia’s trade sanctions. The GDP per capita for
2013 amounted to approximately 8,500 Euro.
Polish GDP per capita in Purchasing Parity
Standard improved marginally compared to 2012
from 66% to 67% of the EU average, higher than,
among others, Hungary and Latvia.
The Foreign Direct Investment inflow in 2013 saw
another significant drop. The net FDI equalled to
2,208 billion Euro in 2013, compared to 4,72
billion in the previous year.
When it comes to balance of payments, 2012 saw
a decline of deficit from -5% of GDP in 2011 to
-3,7% of GDP in 2012. Quarterly data for the first
half of 2013 illustrates the improvement of the
balance of payment.
As far as the trade balance is concerned, it
remained negative in 2012. While the balance in
2011 equalled to 15,9 billion Euro, in 2012 it
dropped to 10,5 billion Euro. A further drop was
noted in 2013, to 2 billion Euro. The driver behind
this change was the surge in exports. The main
trade partners are Germany (both imports and
exports), the Czech Republic and the Great
Britain (exports), and Russia and China (imports).
For the period first three quarters of 2014, the
balance continued to improve.
Even though the fiscal deficit was decreasing
during the analysed period, it still remained above
the EU benchmark of 3% of GDP in 2013 (4,3%).
As in previous years, Poland remained in the
Procedure of Excessive Deficit. According to the
Eurostat definition of public debt, it declined from
56,2% to 55,6% of GDP between 2011 and 2012.
By the end of 2013 the level of debt increased
again to 57%, of GDP. Importantly, the level of
public debt was approx. 30pp (percentage points)
lower than the average for the EU-28 countries.
For the purposes of the Polish law on public
finances, the public debt is calculated differently.
According to the domestic methodology, in 2011,
the level of debt was 53,7% of GDP, while in 2012
– 52,7% of GDP. After the pension reform
modification, mainly moving state bonds from a
second pension pillar to the first pillar and
subsequently, writing them off, a significant drop
of the debt in the first quarter of 2014 was noted.
The law on public finances indicates the national
debt levels which trigger the fiscal measures. The
thresholds are stipulated by the debt levels of
50%, 55% and 60% (with the growth of debt, the
budgetary measures must be more severe).

3
Importantly, the lowest threshold was suspended
in July 2013 by the government, so that the
negative measures would not have taken place.
This change has been maintained also in the
following years.
The privatisation process in Poland significantly
slowed down compared with the pre-2011/2012
period. The total revenue from different forms of
privatisation was approximately 4,40 billion PLN in
2013, and 1 billion PLN in 2014. However, the
process more and more often affects public
services.
The inflation rate noted for 2013 was 0,9%, which
was a decrease from 3,7%, observed in 2012. In
the second half of 2014, deflation was noted, and
the estimated inflation rate for 2014 is 0,9%
Since the mid-2013, the growth of average
monthly gross real wages has been relatively
limited. In the second quarter of 2013, the change
was - compared to the previous quarter - 96,2%
(which meant the decline of wages), in the third
quarter 101,1%, while in the fourth quarter –
104,6%. In the beginning of 2014, the meagre
growth of the wages was continued, as in the first
quarter the real change was 101,7%, in the
second, the wages dropped to the level of 96,%
compared to the previous quarter. As in previous
years, the minimum wage increase was a major
topic in the activities of the social partners, though
the activities took place outside the Tripartite
Commission. While in 2014, the minimum wage
was set at the level of 1,681 PLN gross, from
January 1 2015, it increased to 1,750 PLN gross.
As in previous years, the gross minimum wage
was below the social minima for households with
more than one individual defined by the Institute
for Labour and Social Studies (Instytut Pracy i
Spraw Socjalnych). Also in the case of single
person households, in 2014 the minimum wage
surpassed the social minimum by approx. 159
PLN (increase compared to the previous year).
Measured as 60% of the median income, the
percentage of population at risk of poverty
increased from 17,1% in 2012 to 17,3% in 2013.
The extent of poverty in Poland is slightly higher
than the EU-28 average (16,8%). Also, the scale
of extreme poverty has been continuously
growing: while in 2012 it was 6,8% of the
population, in 2013, the rate grew to 7,4%. Those
at risk were especially individuals with low work
intensity households and those with low education
attainment.
The situation in the Polish market remains
moderately bad, though some insights suggest
that especially atypical employment of younger
workers remains a significant problem. The overall
employment rate (note: Poland’s Labour Force
Survey (LFS) results are calculated on different
basis and therefore, lost the comparability) in the
third quarter of 2014 was 51,9% and increase by
1,2 percentage points year-to-year. In the 3rd
quarter of 2014, the employment rate of women
was 44,1%, while of men – 60,3%. Accordingly,
the employment gap exceeded 16 percentage
points in the 3rd quarter of 2014. When it comes to
unemployment, the overall rate was 8,2%, which
was a significant decline compared to the third
quarter of 2013 (9,8%). Women suffer from
unemployment more than men (9% in 3rd quarter
2014 and 7,5%, respectively), but in the 2nd to 3rd
quarter comparison, the unemployment rate of
men dropped more significantly than of women (-
1,2pp versus -0,7 pp). The problems in the labour
market remain the same as in the previous years.
First, the level of youth unemployment is relatively
high. The general employment level in Poland
locates Poland at the bottom of the EU. However,
the trend that had developed in the 2000s is the
temporary employment. It remains quite stable at
the level of 28-29% of the total employment
against the EU average of 14,5%. In the third
quarter of 2014, the temporary workers
constituted 28,8% of all employed, which
compared to second quarter of 2013, increased
by 1,5 pp. Importantly, other forms of atypical
employment are widespread as well: it is agency
work and Civil Code contracts, which give much
less social and labour rights and employment
stability. This phenomenon is especially
widespread among young Poles, of whom 72%
were employed based on fixed-term contracts.
The income inequality (Gini) between 2012 and
2013 declined from, respectively, 30,9 to 30,7. As
in previous years, the biggest inequality is being

4
noted among farmers, the smallest - among
retirees.
When it comes to the size of population in Poland,
according to the 2011 Census, as of March it was
38,511 million. As of June 30, 2013, the
population of Poland was 38,483 million. The
estimates of the CSO indicate that more than 2
million Poles reside abroad. For year 2013, the
approximate number of migrants was 2,196
million persons, which meant the increase of 50
thousand as compared to the previous year. The
main countries of emigration are the UK (approx.
642 thousand), Germany (560 thousand) and
Ireland (115 thousand). As for the immigration,
there are approximately 300-400.000 immigrants
mainly from Ukraine, Belarus and Russia working
in Poland.
Poland is characterized by a strong concentration
of innovation or relatively developed industry.
Such centres are located in the western part of
Poland and/or are concentrated around big cities
like Poznań, Wrocław or Gdańsk (with IT, car
manufacturing etc). An interesting case is Górny
Śląsk, relying heavily on coal extraction. It used to
be a centre of heavy industry in Poland, now its
role is diminishing. The very recent (beginning of
2015) plans of E. Kopacz government aim at
restructuring the sector-closing some mines. The
parts of Poland which remain economically
underdeveloped are located in the eastern part of
the country. There is a lack of industry, especially
in the towns of smaller sizes. Here the centres of
new technologies are missing, with a notable
exception of Rzeszów (south-east), where some
Research and Development on aviation as well as
aircraft production is centred.
The estimates regarding the shadow economy
vary. Conventionally it is assumed around 20% of
the GDP.
1.3. State policies
Since 2007 the government in Poland has been
composed of two political parties – Civic Platform
(PO) and PSL and the coalition was re-elected in
2011. There were major changes in the personal
composition of the government in 2014. First of
all, this was due to the elections to the European
Parliament (EP) that took place in May 2014 and
some of the ministers have been elected the
members of the EP. The most important change
was the resignation of Donald Tusk from the
Prime Minister’s office in September 2014, as
Tusk was elected the President of the Council of
the European Union. Ewa Kopacz (PO), a
Speaker of the Sejm, was appointed a new Prime
Minister and introduced substantial personal
changes in the government. Elżbieta Bieńkowska,
that was the Minister of the Regional
Development, became the Commissioner for
Internal Market, Industry, Entrepreneurship and
SMEs.
In particular, and apart from the office of the Prime
Minister, changes took place with regard to the
following Ministries:
- the Ministry of Foreign Affairs: Radosław
Sikorski (PO), who became the speaker
of the Sejm, was replaced by Grzegorz
Schetyna (PO);
- the Ministry of Interior: Bartłomiej
Sienkiewicz was replaced by Teresa
Piotrowska (PO);
- the Ministry of Regional Development:
Elżbieta Bieńkowska (PO) was replaced
by Maria Wasiak;
- the Ministry of Administration and
Digitalization: Rafał Trzaskalski was
replaced by Andrzej Halicki (PO);
- the Ministry of Justice: Marek Biernacki
(PO) was replaced by Cezary Grabarczyk
(PO).
Ewa Kopacz has presented her exposé in the
Parliament on the 1st of October 2014. Main policy
goals that were declared by the new Prime
Minister regarded:
- preparation to joining the Eurozone, as
meeting the criteria set by the European
Monetary Union are “good for Polish
economy”;
- strengthening of the energy policy with
the purpose to form an energy union;
- increase in military spending – up to 2%
of the GDP in 2016;

5
- increase in spending on childcare
services and introduction of the new cash
benefits for mothers outside of the labour
market;
- introduction of the two policy packages
with regard to health care (a “queue”
package and oncology package)
- making the public culture institutions more
accessible for children and students;
- strengthening transport infrastructure.
The so-called second anti-crisis package
(November 2013) is still at place. The major
assumption behind the package is that the
situation of employed workers can be temporarily
worsened if a company faces economic
difficulties. The instruments which can be
introduced in such situation by employers consist
of stoppage or limitation of the working hours,
followed by a decrease of salaries (with a
minimum salary as a lower limit), with a partial
subsidy from the Guaranteed Employee Benefits
Fund. The change in the conditions of
employment must be accepted by trade unions
existing in a company, and in case such
representation is missing, others form of workers’
representation existing in a company. The change
in the condition of employment applies to all
workers, so it is impossible for a single worker to
discard them.
An important reform which concerns labour
market was introduced in May 2014. The reform,
according to the government, is aimed at
increasing efficiency of Public Employment
Services. The major components include profiling
unemployed (with targeted assistance), possibility
to outsource services, stronger cooperation
between PES and social assistance agencies,
instruments supporting return to the labour market
(grants, etc.), as well as facilitating entering the
labour market by youth (subsidies). The change is
accompanied by increased sanctions for those
who refuse to cooperate with PES and the
introduction of the National Training Fund.
Following the expose of E. Kopacz and some
earlier statements by D. Tusk, changes in the
social security coverage are introduced. In 2015,
the income of companies’ supervisory board’s
members will be subject to social security
contributions. From 2016, Civil Code contracts
(umowa zlecenie) will be subject to contributions.
Also, since 2015, more favourable children-related
tax deductions will be available to parents.
An important, unresolved issue concerns carers of
disabled individuals – their rights to state support
is differentiated depending on which stage of live
disability occurred. The reforms of the government
which took place in previous years left carers of
individuals who became disabled during
adulthood without support. Constitutional Tribunal
judged such policy unconstitutional, but the
unequal treatment of carers remains.
One of the major reforms, legislated in 2013, but
executed in 2014 deals with further modifications
of the pension reform from the 1990s. The 1998
reform introduced pension funds, operated by
private companies. The reform encountered
significant problems with financing, and
subsequently contributed to increased public debt.
The government transfer 51,5% of assets
accumulated in the pension funds to accounts
operated by ZUS (public Social Insurance
Institution). Further changes include the default
option for transferring contributions only to the first
pillar, as well as transfer of contributions from the
second to the first pillar 10 years before
retirement. The reforms were objected by several
actors, who submitted the case to the
Constitutional Tribunal.
Contrary to the governmental promises, the
increased VAT rate (23%) has been maintained.
The Personal Income Tax rates remained as in
previous years (18% and 32%). However,
continuing the trend from previous period, the
income thresholds used for taxation purpose
remained unchanged which meant that in the real
terms the tax burden increased.
The main line of the economic and fiscal policy is
based on the paradigm of fiscal consolidation.
This approach mostly means restriction of social
spending, especially by Labour Fund, whose
resources are meant to alleviate the labour
market. The Fund displays significant surplus,

6
however, additional resources are negotiated
between Ministry of Finance and Ministry of
Labour and Social Policy, which leads to limited
use of the Fund. The further constraint on the
public spending is expected by introduction of an
expenditure rule. First signs of such developments
have been observed already.
The impact of the European Union on the political
and social developments remain rather limited.
The membership in the EU has an indirect impact
through requirements of fiscal discipline.
However, in spite of the governmental promises,
the Youth Guarantee has been implemented with
some delays. Also, the government transposes
EU Directives regarding social policy or labour
market in a minimalistic way, so that their impact
on the domestic legislation is reduced.
The analysed period is characterised by some ‘hot
spots’, such as the reforms of healthcare,
reducing labour standards for teachers (change of
the Teacher Charter), or attempts to reform coal
mining. The union protests regarding coal mining
erupted in the first half of 2014, but were
suppressed due to the engagement of PM Donald
Tusk. Very recent plans of coal mining
restructuring reinvigorated the crisis in the
government-unions relations. Also, the reforms in
the healthcare sector sparked conflicts between
medical doctors and the governments. Finally,
representatives of ‘uniformed’ services (military
etc.), protested against the reform which reduced
the level of sickness benefits, introduced in the
beginning of 2014.
1.4 Industrial Relations
The industrial relations in Poland are strongly
affected by a weak representation of workers,
especially in the private sector. Partially, the
reason for this lies in the legal framework, which
stipulates that the basic trade union unit is a
company organization, which only can be
established by at least 10 workers of the same
company. As around 39% of workers are
employed in companies with 9 workers and less
this regulation results in direct exclusion of that
big group. Other forms of representation
(information and consultation bodies) are possible
to establish in even bigger entities - employing
more than 50 workers. Primarily, however, the
private sector managers are characterised by
strong anti-union attitudes.
Polish labour market is characterised by a strong
asymmetry of labour relations and, consequently,
several violations of labour law and related
standards. The issues which have been indicated
by the Labour Inspection included growing delays
in salary payment, increasing scale of illegal
employment, forced self-employment and forced
civil-contract employment, avoiding payment for
overtime hours and working conditions below
stipulated standards.
According to the most recent representative
survey (conducted in 2014), 12% of workers
belong to a trade union. This means the reversal
of the negative dynamics – in 2012, around 12%
of workers declared membership in the union. The
split for the confederations is the following:
NSZZ Solidarność – 4% of workers,
OPZZ – 4% of workers,
FZZ - 2% workers, and
other unions – 2% of workers.
Union density and consequently, the bargaining
power of TU vary depending on the sector of
polish economy. Public sector is the most
unionised (19% of workers, 2012 survey), and this
includes healthcare, education and science (23%)
and state-owned companies. Also former state-
owned companies, especially in the heavy
industry, belong to the most unionised (16% of
workers belong to a trade union in mining and
production, 2014 survey). The private sector is
significantly less unionised, which seems a
function of companies’ size (they are much
smaller) and the negative attitude of employers
towards unions. Accordingly, in the retail trade 7%
of employees are unionised (significant increase
from 3%), while in transport and construction -
12%. In the companies employing more than 250
workers, 28% are unionised, while in small
companies (less than 50 workers) – only 6%.
Polish trade union movement has been
characterised by the split along political lines. It
means relatively rare cooperation at the national
level between unions, especially NSZZ

7
Solidarność and OPZZ. An example of such
cooperation could be the joint actions against the
government in the field of education in 2014, or in
the beginning of 2015 in relation to coal mining
restructuring. The agenda of unions remains
relatively stable: reduction of atypical
employment, re-lowering the retirement age,
increasing the minimum wage to 50% of the
average salary and the hourly minimum wage.
Additional actions are targeted against
Government´s disregard of social dialogue. 2014
saw a re-election of all three confederation
leadership.
At the company level, cooperation between
unions of different confederations is seen more
often, however, the competition between unions is
visible there as well, especially coming from
smaller, independent trade unions.
Currently, there are four employers’ associations
which have a representative status in the
Tripartite Commission: Business Centre Club,
Polish Crafts Association (Związek Rzemiosła
Polskiego), Employers of Poland (Pracodawcy
RP) and Polish Confederation of Private
Employers ‘Lewiatan’ (Polska Konfederacja
Pracodawców Prywatnych Lewiatan). Their
situation remains stable. Their number and their
estimated coverage do not change over time and
revolves around 20% of employees (according to
the available estimations). In contrary to Unions
employers´ organizations are very active in the
political sphere and in the media. This imbalance
contributes guides to an underrepresentation of
the labour movement in public discourse. But in
fact, the voice of the unions and their support by
the public became stronger since the summer of
2013 and continued throughout 2014.
After the developments in 2012/2013, when the
unions left the Tripartite Commission, the
government cooperates with employers’
organisations. At the same time, the unions and
employers’ organisations promote the so-called
autonomous dialogue, without the involvement of
the government. Also, unions want to discuss a
new framework in which the Ministry of Labour
and Social Policy would be an equal partner,
rather than organiser of the dialogue and its
participant at the same time. In a new institutional
arrangement, social partners would be given a
wider scope of consultation powers. Also, the
social dialogue would be moved from Ministry to
other constitutional body.
Both the industrial disputes and strikes are limited
in Poland. According to the available statistics, in
2012, there were only 17 strikes, while in 2013 –
93 strikes
1.5 Youth unemployment and its
background
As in other countries, the unemployment rate for
youth is higher than the average unemployment
rate. In the third quarter of 2014, the
unemployment rate for youth 15-24 equalled to
23,1% (against 8,2% for the total population 15-
74), which compared to 2013 meant a decrease
by 3,5pp. A similar trend is observed in the case
of youth aged 25 to 29, though to a smaller extent.
In this group age the unemployment in the third
quarter of 2013 was 10,6%.
The overall problem of the Polish labour market is
limited labour demand. Unemployment of the
youngest Poles finds its peak in the transition from
school to work (school graduates) as in this
category it was 29,3% during second quarter of
2014. The unemployment in this group declines
significantly with the level of education, but still the
level of unemployment for the university
graduates is 19,5%, while almost half of
graduates with basic vocational education
remains unemployed (43,9%). This partially has to
do with the skill mismatch on the side of youth, but
main reason is limited demand for new workers.
Therefore, while the measures regarding training
and retraining should be important, and the limited
spending on this item is a major labour market
policy problem, the labour demand remains the
main challenge. Generally, young Poles suffer
from the crisis significantly more than other
workers.
1.6 Forecasts
It is expected that Polish economy will be one of
the fastest growing in the EU. Also, it is expected

8
that unemployment will remain relatively stable,
with a slight increase of the employment rate (the
result of increasing the retirement age).

9
2.0 Annex
2.1 Structure of the economy
Structure of the economy by the employment size
in non-financial entities* (2013)
employment category
%of
compa
nies
% of
employment
up to 9 employees 95,6 40
From 9 to 49 employees 3,4 13
From 50 to 249 employees 0,8 17
Above 250 employees 0,17 30
Sum 100 100
Source: GUS, 4/2014, own calculations and
representative sample
* Economic activity excluding: agriculture, forestry,
fishing, financial and insurance activity, public
administration, national defence, social security.
2.2 Collective Bargaining System
Given mainly advisory role of the social dialogue
institutions at national, branch and regional level,
the major level of bargaining is located at the level
of companies. Collective agreements regulate the
conditions of work, pay, health and safety and
other work-related issues given the agreed
conditions are not worse than stipulated by law. A
collective agreement can be introduced only in
companies where trade union organisations exist.
There is no exact data on a number of collective
agreements-they need to be registered with the
Regional Labour Inspection (it is estimated at
around 2500 for 2011). The only available data
concerns newly registered collective agreements
and annexes to agreements. According to the
Labour Inspection annual report, in 2012 92 new
collective agreements were registered. For
annexes the number was 1265. The report states,
that the protocols modified the already existing
agreements so that only minimum requirements
are met. Altogether, the agreements and protocols
registered in 2012 covered around 62 thousand
workers.
Also in 2012, as in the previous years, the Labour
Inspection noted that when new additional
protocols are registered, they rather reduce the
scope of the agreements already in place. Also,
the noted tendency is the decline of standards in
newly registered collective agreements.
Accordingly, most of the new collective
agreements are the repetition of the existing
minimum standards.
2.3 System of tripartite social dialogue
At the national level, the tripartite social dialogue
takes place in the Tripartite Commission,
established in 1994 and then reshaped in 2001.
The Commission’s role is mainly advisory: such
role is especially visible in the preparation of a
budget bill and changes in social benefits and
minimum wages. There are also 16 regional
bodies (Wojewódzka Komisja Dialogu
Społecznego, Voivodship Committee for Social
Dialogue) for social dialogue (one per voivodship).
The bodies gather social partners, local and
central government representatives. Their role is
also advisory with respect to developments taking
place at the local level. When it comes to
branch/sectoral dialogue, one can point out
Tripartite Sectoral Committees (Trójstronne
Zespoły Branżowe). They function outside of the
Tripartite Commission, and a majority of them is
affiliated with the Ministry of Labour and Social
Policy. In 2013 there were 14 such Committees,
focusing mainly on industrial production.
2.4 Social security systems
In principle, all workers employed on the basis of
the Labour Code regulations are covered by the
healthcare, old-age pensions, unemployment and
against other social risks.
But in the case of healthcare insurance there is no
reliable data: the number of insured in the
registered is higher than the population of Poland,
plus the family members of an insured person are
also covered. Anyhow, it is estimated, that one
million of Poles is not covered by the health
insurance, which is being confirmed by a newly
introduced system of insurance evidence.
The observed problem is the inferior social
security coverage under more and more
widespread Civil Code agreements as the non-
wage labour costs are smaller for the employer.

10
However, the healthcare insurance and
unemployment compensation are rarely financed
in the case of such contracts.
2.5 Education and vocational training
Since the mid-1990s, an outflow from vocational
education towards general education has been
observed. This trend especially affected basic
vocational schools. At the same time, graduates
from these schools experienced significant
problems with finding a job in spite of their profiled
education, which in other cases increases the
probability of a successful transition to the labour
market. The diplomas from vocational education
are not widely recognised by employers, as during
final examinations the emphasis is put on
theoretical knowledge. Employers often raise the
argument that school and university leavers do
not have sufficient work experience; however, as
the section below demonstrates, employers have
only a limited interest in participating in training
and vocational certification as well as in indicating
demand for the skills needed. In 2010, less than
23% of Polish companies cooperated with a
school or a centre for practical training. Out of the
companies which did cooperate, 63% engage in
practical training, 60% in in-company training,
50% sponsor schools and another 48% provide
both practical and theoretical training. A
significantly lower number of companies (5–6%)
take part in other forms of cooperation with
schools such as preparing curricula, training
teachers, or providing materials and equipment.
Importantly, larger companies were 10 times more
often involved in training than small or micro
companies. The government plans to increase the
role and attractiveness of vocational education
and training, also due to the establishment of the
National Training Fund.
Employment Year/ Group 2008Q2 2009Q2 2010Q2 2011Q2 2012Q2 2013Q2 2013Q3 2013Q4 2014Q1 2014Q2 2014Q3
Total 15-64 58,9 59,3 59 59,4 59,7 59,8 60,7 60,8 60,3 61,3 62,5
Men 15-64 66 66 65,2 66 66,4 66,5 67,5 67,2 66,3 67,9 69,4
Women 15-64 52,1 52,7 52,8 52,8 53,1 53,0 53,9 54,4 54,3 54,8 55,6
Total 15-24 26,8 26,6 26,3 25,3 24,9 24,4 24,9 24,3 24,8 26,2 26,3
Men 15-24 30,1 30,0 30,2 29,7 29,1 28,7 29,4 28,6 28,7 29,9 30,9
Women 15-24 23,3 23,1 22,1 20,6 20,6 19,8 20,2 19,8 20,6 22,2 21,5
Total 25-49 79,4 79,9 79,1 78,7 78,4 77,9 78,9 78,9 78 79,1 80,4
Men 25-49 85,8 86,2 84,7 85,0 84,6 84,3 85,1 84,6 83,5 85,3 86,8
Women 25-49 73,0 73,6 73,6 72,3 72,2 71,3 72,6 73 72,4 72,7 73,8
Total 50-59 53,9 55,1 57,4 60,2 61,8 62,5 63,3 63,2 63 64 65,1
Men 50-59 64,3 65,2 65,8 68,1 69,5 68,9 70,3 69,5 68,3 70,1 71,8
Women 50-59 44,3 45,9 49,6 53,0 54,7 56,4 56,7 57,2 58,1 58,2 58,8
Source: Eurostat LFS

11
2.6 Unemployment rate
Year/ age group 2008Q2 2009Q2 2010Q2 2011Q2 2012Q2 2013Q2 2013Q3
2013Q4
2014Q1
2014Q2
2014Q3
Total 20-24 17,1 19,2 23,1 24,6 24,2 25,1 25,3 26,3 25,8 21,9 21,7
Total 25-49 6,1 6,8 8,3 8,3 8,8 9,5 8,7 8,6 9,6 8,2 7,2
Total 50-59 5,8 6,8 8,1 7,4 8,7 8,3 7,4 7,4 8,3 7,6 6,5
Source: Eurostat LFS
The choice of the data was driven by the comparability reasons. The register data (referring to individuals
registered with Public Employment Services) remains higher by about 1-2 percentage points. The difference
is due to the different definitions regarding unemployment.
2.7 Net average monthly salaries (estimations)
Net Salaries 2012Q2 2012Q3 2012Q4 2013Q1 2013Q2 2013Q3 2013Q4 2014Q1 2014Q2 2014Q3
in PLN 2502 2512 2690 2672 2583 2609 2730 2780 2672 2700
in EUR 588 607 654 644 615 612 630 642 617 623
2.8 Gender pay gap
The unadjusted gender pay gap for the hourly gross wages in Poland was well below the EU average (in
2012 it was one of the lowest in the EU – approx. 6,4% of the male wages). However, when one looks at
adjusted wage gap, it is significantly higher, at the level of 20%.
2.9 Net monthly minimum wage
Minimum salary January 2012 January 2013 January 2014 January 2015
in PLN 1111 1181 1237 1286
in EUR* 265 281 285 297
Source: CSO, own calculations *average exchange rate for a given year
2.10 Actual monthly working hours
Year/ indicator
2012
Q1
2012
Q2
2012
Q3
2012
Q4
2013
Q1
2013
Q2
2013
Q3
2013
Q4
2014
Q1
2014
Q2
2014
Q3
Actual average weekly
hours in work 40,5 40,7 40,9 40,6 40,4 40,8
40,9
40,7
40,6
40,7
40,9
Source: Eurostat
As seen in the table, the number of actual working hours remains relatively stable, which is an indication that
the labour market restructuring has taken a different form during the economic slowdown. Given the
declining dynamics of real wages growth, the adjustment took mostly a form of a real wage change.
12
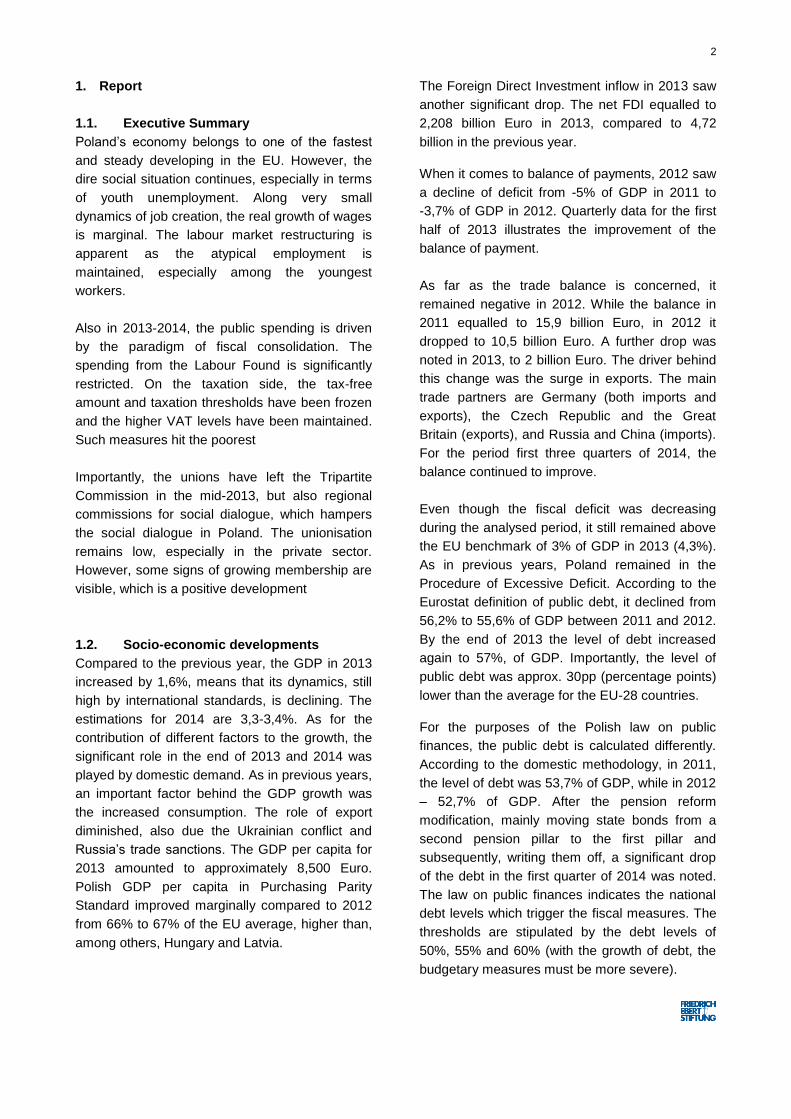
2.11 Normal work / atypical work
Year/
indicator
2012Q
1
2012Q
2
2012Q
3
2012Q
4
2013Q
1
2013Q
2
2013Q
3
2013Q
4
2014Q
1
2014Q
2
2014Q
3
Fixed- term
empl* 26,5 27,3 26,7 26,5 26,3 26,9
26,8
27,1
27,1
28,4
28,8
Part- time
empl* 7,4
7,2
6,9
7,2
7,4
7
6,9
7,1
7,1
7,3
6,9
Source: Eurostat LFS *As percentage of total employment.
So-called Civil Code contracts gain more and more importance in the labour market (umowy cywilno-
prawne). These contracts have significantly reduced social protection rights. In contrast to contracts
observing the Labour Code, sickness, maternity or unemployment are not compulsorily covered under the
bulk of civil law contracts. Also, in some cases healthcare insurance is not mandatory which means that a
significant number of workers are not insured. Moreover, employment based on the Civil Code does not
follow regulations regarding minimum wage, working time, holidays and overtime remuneration, and a record
of years of service is also not included. The controls by the Labour Inspection in 2012 revealed that approx.
20% of workers in the controlled companies were employed on the basis of the Civil Code contracts
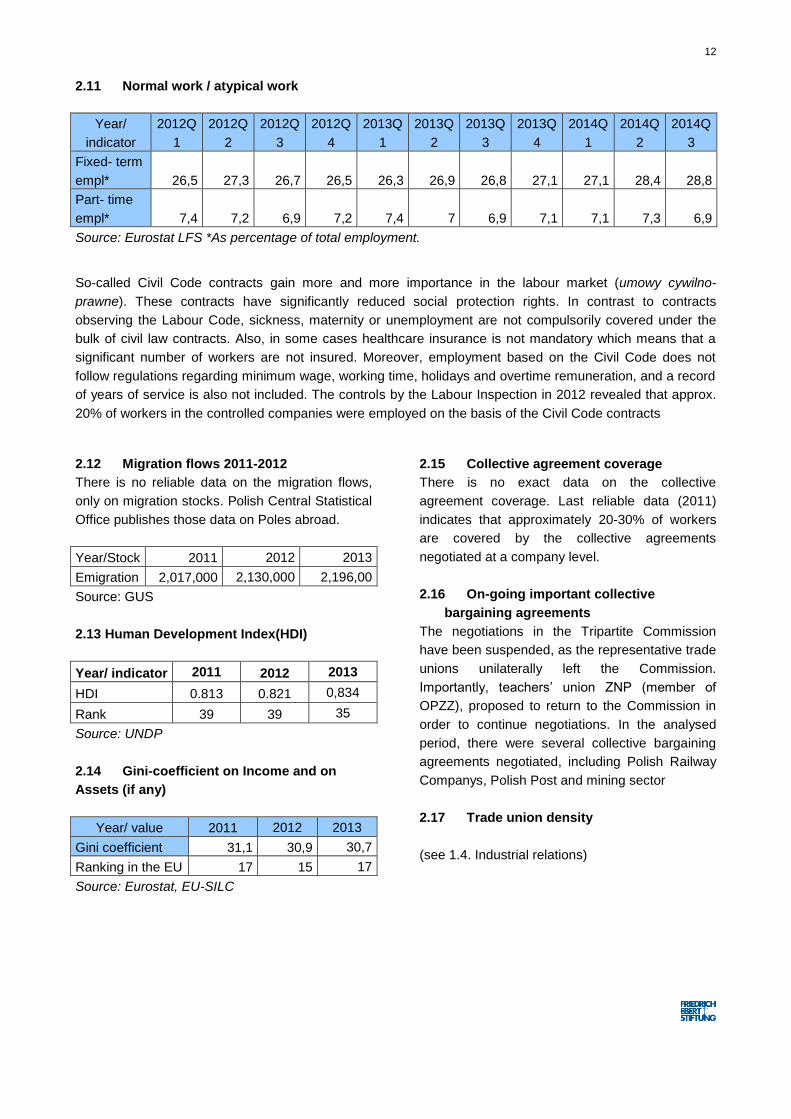
2.12 Migration flows 2011-2012
There is no reliable data on the migration flows,
only on migration stocks. Polish Central Statistical
Office publishes those data on Poles abroad.
Year/Stock 2011 2012 2013
Emigration 2,017,000 2,130,000 2,196,00
Source: GUS
2.13 Human Development Index(HDI)
Year/ indicator 2011 2012 2013
HDI 0.813 0.821 0,834
Rank 39 39 35
Source: UNDP
2.14 Gini-coefficient on Income and on
Assets (if any)
Year/ value 2011 2012 2013
Gini coefficient 31,1 30,9 30,7
Ranking in the EU 17 15 17
Source: Eurostat, EU-SILC
2.15 Collective agreement coverage
There is no exact data on the collective
agreement coverage. Last reliable data (2011)
indicates that approximately 20-30% of workers
are covered by the collective agreements
negotiated at a company level.
2.16 On-going important collective
bargaining agreements
The negotiations in the Tripartite Commission
have been suspended, as the representative trade
unions unilaterally left the Commission.
Importantly, teachers’ union ZNP (member of
OPZZ), proposed to return to the Commission in
order to continue negotiations. In the analysed
period, there were several collective bargaining
agreements negotiated, including Polish Railway
Companys, Polish Post and mining sector
2.17 Trade union density
(see 1.4. Industrial relations)

13
2.17 Employer’s organizations density
There is no exact data on the strength of
employers’ organizations, it is estimated that they
cover no more than 40% of workers in the
economy. Given the dominance of very small
companies, employing less than 9 workers, the
employers are very fragmented and their interests
diversified.
2.18 Workplace representation
Apart from TU, the representation of employees
can take the form of workers’ councils in state-
owned enterprises (introduced in 1981) and works
councils whose functioning is regulated by the Act
on the Information and Consultation of Employees
(triggered by EU-legislation in 2006). 10
employees are required to establish a trade union
at a company level. If a TU membership exceeds
10% of workers in a company, the TU is
considered representative for the purpose of the
collective bargaining. Another way of gaining
representativeness of a company’s TU is
membership in a TU confederation eligible to
participate in the Tripartite Commission on Socio-
Economic Affairs - in such case the membership
of 7% of workers is required. TUs representatives
at a company level have the right for office space
and are protected against a dismissal.
It is possible to establish a works council in a
company employing more than 50 workers (before
2008 – 100). Also before 2008, one of the ways of
selecting representatives to the council was the
direct nomination by a trade union. Currently, all
representatives must be elected by employees of
the respective company. In November 2013, there
were 3400 works councils present in Poland.
2.19 Trade union mapping
2.20 in National Language in English
Name of TU Federation/
Confederation/Trade Union
Ogólnopolskie
Porozumienie Związków
Zawodowych
All-Poland Alliance of Trade Unions
Founding Year 1984
Sector/Branch Nation-wide, All sectors
Cycle of Congresses/
Last Congress
OPZZ congresses take place every four years. Last congress took
place in 2014, current president re-elected.
Important Functionaries
(Chairman, President, International
Secretary, Youth Leader, etc.)
Name Function Homepage
Jan Guz Chairman http://opzz.org.pl/english/structure
Joanna
Bieńkowska
Terlecka
Youth
Committee
http://opzz.org.pl/portal/komisje_prob
lemowe/komisja_mlodych_opzz.html
Piotr
Ostrowski
International
Commitee
http://opzz.org.pl/portal/komisje_prob
lemowe/miedzynarodowe.html
Number of Members (please
comment on the official number
applying a sensitive approach)
Reported: 792,500 (2011), Survey: 621,000
Finance (major sources of finance,
please comment on the official
figures applying a sensitive
approach)
The data on financing sources is not available. As with other Polish
trade union confederations/major unions, the economic activity
(renting properties) seems important
Number of staff (estimated if
necessary) Around 35 full-time staff
Political Orientation It is a left-wing leaning confederation, with close link with Sojusz

14
(short story in three lines) Lewicy Demokratycznej. OPZZ has its members elected to the
Parliament
Cooperation in national committees
Memberships
Regional Umbrella
Associations Global Umbrella Associations
ETUC ITUC
2.20 in National Language in English
Name of TU Federation/
Confederation/Trade Union
Niezależny Samorządny
Związek Zawodowy
Solidarność
Independent Self-governing Trade
Union "Solidarity"
Founding Year 1980 (illegal between 1982 and 1989)
Sector/Branch Unitary trade union, encompassing all sectors of the economy
Cycle of Congresses/
Last Congress
For the purposes of electing president and National Council,
National Delegates’ Assembly meets every four years. The current
president was re-elected in 2014.
Important Functionaries
(Chairman, President, International
Secretary, Youth Leader, etc.)
Name Function Homepage
Piotr Duda President
http://www.solidar
nosc.org.pl/pl/pre
zydium-komisji-
krajowej.html
Number of Members (please comment
on the official number applying a
sensitive approach)
Reported: 667,500 (2011), Survey 621,000 (2012)
Finance (major sources of finance,
please comment on the official figures
applying a sensitive approach)
The data on financing sources is not available. As with other Polish
trade union confederations/major unions, the economic activity
(property rental) seems important. Solidarność is successful in
attracting European funds.
Number of staff (estimated if
necessary) Not available
Political Orientation
(short story in three lines)
Politically, NSZZ Solidarność It is a center-right (or Christian-
democratic) leaning union. The closest collaborator is Prawo i
Sprawiedliwość, though formally Solidarność stresses political
indifference.
Cooperation in national committees Representative member of the Tripartite Commission
Memberships
Regional Umbrella
Associations Global Umbrella Associations
ETUC ITUC, TUAC

15
2.20 in National Language in English
Name of TU Federation/
Confederation/Trade Union Forum Związków Zawodowych Trade Unions Forum
Founding Year 2002
Sector/Branch All-branch encompassing trade union confederation
Cycle of Congresses/
Last Congress
FZZ Congress meets every four years and elects leaders. The last
congress took place in 2014
Important Functionaries
(Chairman, President, International
Secretary, Youth Leader, etc.)
Name Function Homepage
Tadeusz
Chwałka President
http://www.fzz.org.pl/index.php?option
=com_content&view=article&id=6&Ite
mid=5
Number of Members (please comment
on the official number applying a
sensitive approach)
Reported: 408,000 members (2012), Survey: around 310,000
(2012)
Finance (major sources of finance,
please comment on the official figures
applying a sensitive approach)
The data on financing sources is not available. As with other Polish
trade union confederations/major unions, the economic activity
(renting properties) seems important
Number of staff (estimated if
necessary) Less than 10 full-time staff members
Political Orientation
(short story in three lines)
Forum Związków Zawodowych seems least politicised among
major trade unions, it is seen as moderately left-wing.
Cooperation in national committees Representative member of the Tripartite Commission
Memberships
Regional Umbrella Associations Global Umbrella Associations
ETUC
2.20 Employer Association Mapping
2.21 in National Language in English
Name of the association
Polska Konfederacja
Pracodawców Prywatnych
Lewiatan
Polish Confederation of Private
Employers - Lewiatan
Founding Year 1999
Sector/Branch Mainly private sector, all-encompassing
Cycle of Congresses/
Last Congress
General Assembly meets every year. Last meeting took place in
May 2012
Important Functionaries
(Chairman, President, Director, etc.)
Name Function Homepage
Henryka Bochniarz President
http://pkpplewiatan.p
l/o_nas/o_lewiatanie
/wladze/zarzad
Justyna Politańska Youth Forum http://pkpplewiatan.p
l/o_nas/forum_mlod

16
ych
Number of Members 62 regional and branch associations-altogether 3750 companies
employing approx. 750,000 workers
Finance (major sources of finance,
please comment on the official figures
applying a sensitive approach)
Financing comes from regional and branch associations, and
individual companies associated directly. It is maximum 0.2% of the
payroll. Also, PKPP Lewiatan runs many project co-financed from
the European funds.
Political Orientation
(short story in three lines)
PKPP Lewiatan is leaning towards liberal-centre. Henryka
Bochniarz stood for the elections of President of Poland in 2005
Cooperation in national committees Representative member of the Tripartite Commission
Memberships
Regional Umbrella Associations Global Umbrella Associations
BusinessEurope BIAC
2.21 in National Language in English
Name of the association Pracodawcy Rzeczpospolitej
Polskiej
Founding Year 1989
Sector/Branch Nation-wide
Cycle of Congresses/
Last Congress
General Assembly meets every year, the term of the President last
five years. Last assembly: 2012
Important Functionaries
(Chairman, President, Director, etc.)
Name Function Homepage
Andrzej
Malinowski President
http://www.pracodawcyrp.pl/o-
nas/struktura-organizacyjna/prezydent-i-
wiceprezydenci/
Number of Members 7500 companies, employing approx. 4,000,000 workers (85%
private sector)
Finance (major sources of finance,
please comment on the official figures
applying a sensitive approach)
The sources of financing unknown.
Political Orientation
(short story in three lines)
Probably the most centre-oriented employers’ organisations which
are members of the Tripartite Commission
Cooperation in national committees Representative member of the Tripartite Commission
Memberships Regional Umbrella Associations Global Umbrella Associations
CEEP IOE, ILO, BIAC
2.21 in National Language in English
Name of the association Business Centre Club Business Centre Club
Founding Year 1989
Sector/Branch Nation-wide
Cycle of Congresses/
Last Congress
This information is not available – President of BCC is also a
founder of the Club
Important Functionaries Name Function Homepage

17
(Chairman, President, Director, etc.)
Marek Goliszewski President
Number of Members 2500 companies, employing approx. 600,000 workers
Finance (major sources of finance,
please comment on the official figures
applying a sensitive approach)
The organization does not publish financial reports, therefore the
sources of financing are not available.
Political Orientation
(short story in three lines)
Business Centre Club has a clear profile of a lobbying organisation.
Perhaps it is the most liberal among employers’ association which
are affiliated with the Tripartite Commission
Cooperation in national committees Representative member of the Tripartite Commission
Memberships Regional Umbrella Associations Global Umbrella Associations
CEEP IOE, ILO, BIAC
2.21 in National Language in English
Name of the association Związek Rzemiosła Polskiego Polish Crafts Association
Founding Year 1933
Sector/Branch Nation-wide, represents small and medium enterprises, eligible for
conducting vocational tests
Cycle of Congresses/
Last Congress
Congress meets every year, while electoral Congress takes place
every four years. Last congress: November 2012
Important Functionaries
(Chairman, President, Director, etc.)
Name Function Homepage
Jerzy Bartnik President http://www.zrp.pl/AboutZRP/tabid/31
6/language/en-US/Default.aspx Maciej
Prószyński
General
Director
Number of Members Approximately 300,000 companies
Finance (major sources of finance,
please comment on the official figures
applying a sensitive approach)
The organization does not publish financial reports, therefore the
sources of financing are not available.
Political Orientation
(short story in three lines) The political profile of Związek Rzemiosła Polskiego is unclear.
Cooperation in national committees Representative member of the Tripartite Commission
Memberships Regional Umbrella Associations Global Umbrella Associations
NORMAPME, EBC, UEAPME