Embed Size (px)
Citation preview
Analysis results on infants born in 2005 III-1/
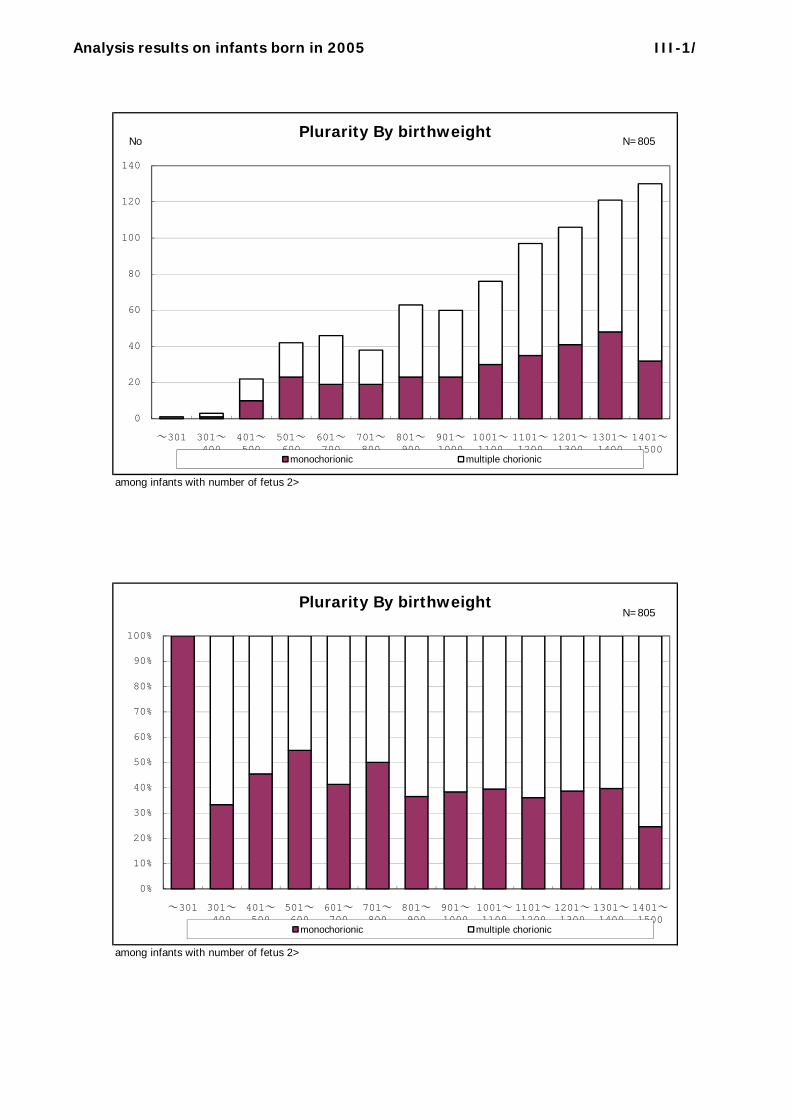
NoPlurarity By birthweight
N=805
among infants with number of fetus 2>
0
20
40
60
80
100
120
140
~301 301~400
401~500
501~600
601~700
701~800
801~900
901~1000
1001~1100
1101~1200
1201~1300
1301~1400
1401~1500
monochorionic multiple chorionic
Plurarity By birthweightN=805
among infants with number of fetus 2>
0%
10%
20%
30%
40%
50%
60%
70%
80%
90%
100%
~301 301~400
401~500
501~600
601~700
701~800
801~900
901~1000
1001~1100
1101~1200
1201~1300
1301~1400
1401~1500
monochorionic multiple chorionic
Analysis results on infants born in 2005 III-2/
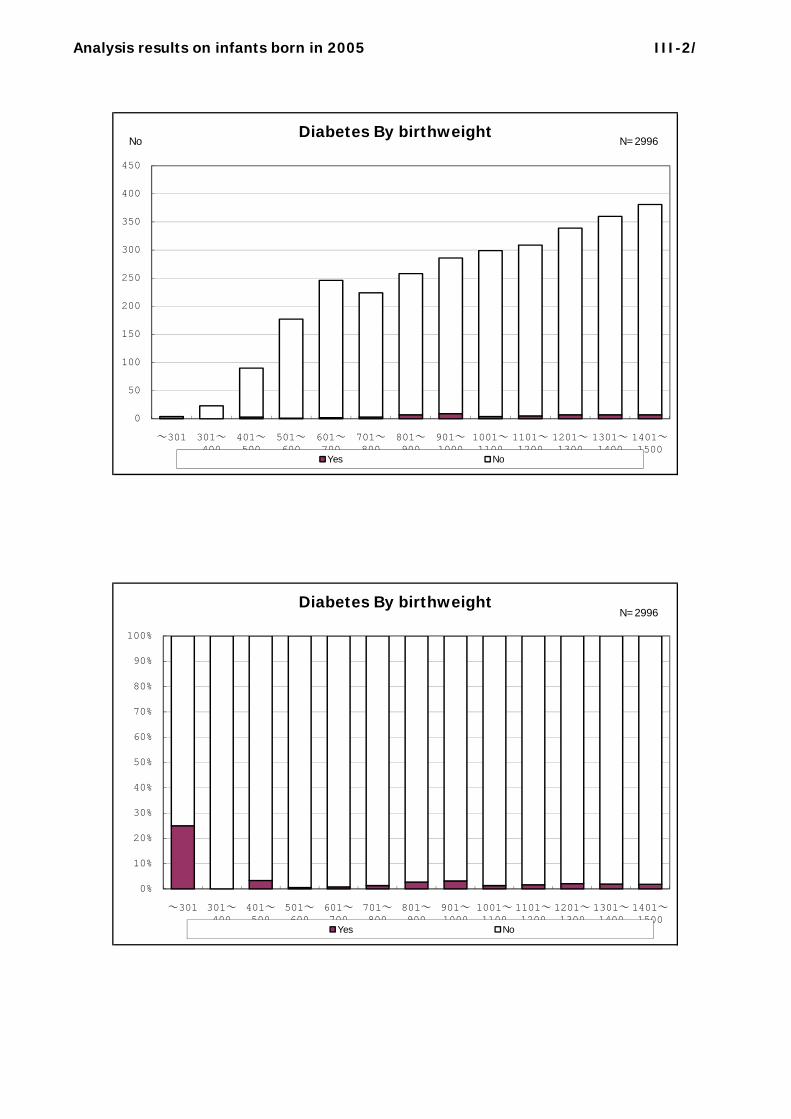
NoDiabetes By birthweight
N=2996
0
50
100
150
200
250
300
350
400
450
~301 301~400
401~500
501~600
601~700
701~800
801~900
901~1000
1001~1100
1101~1200
1201~1300
1301~1400
1401~1500
Yes No
Diabetes By birthweightN=2996
0%
10%
20%
30%
40%
50%
60%
70%
80%
90%
100%
~301 301~400
401~500
501~600
601~700
701~800
801~900
901~1000
1001~1100
1101~1200
1201~1300
1301~1400
1401~1500
Yes No
Analysis results on infants born in 2005 III-3/
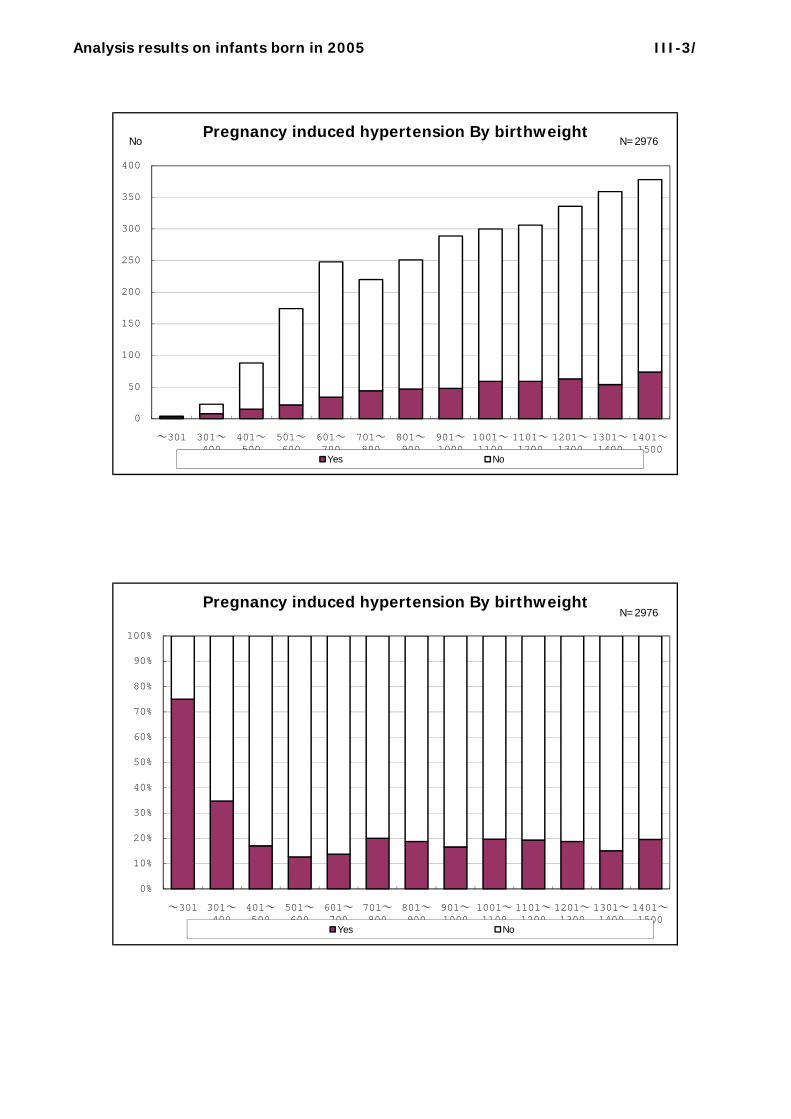
NoPregnancy induced hypertension By birthweight
N=2976
0
50
100
150
200
250
300
350
400
~301 301~400
401~500
501~600
601~700
701~800
801~900
901~1000
1001~1100
1101~1200
1201~1300
1301~1400
1401~1500
Yes No
Pregnancy induced hypertension By birthweightN=2976
0%
10%
20%
30%
40%
50%
60%
70%
80%
90%
100%
~301 301~400
401~500
501~600
601~700
701~800
801~900
901~1000
1001~1100
1101~1200
1201~1300
1301~1400
1401~1500
Yes No
Analysis results on infants born in 2005 III-4/
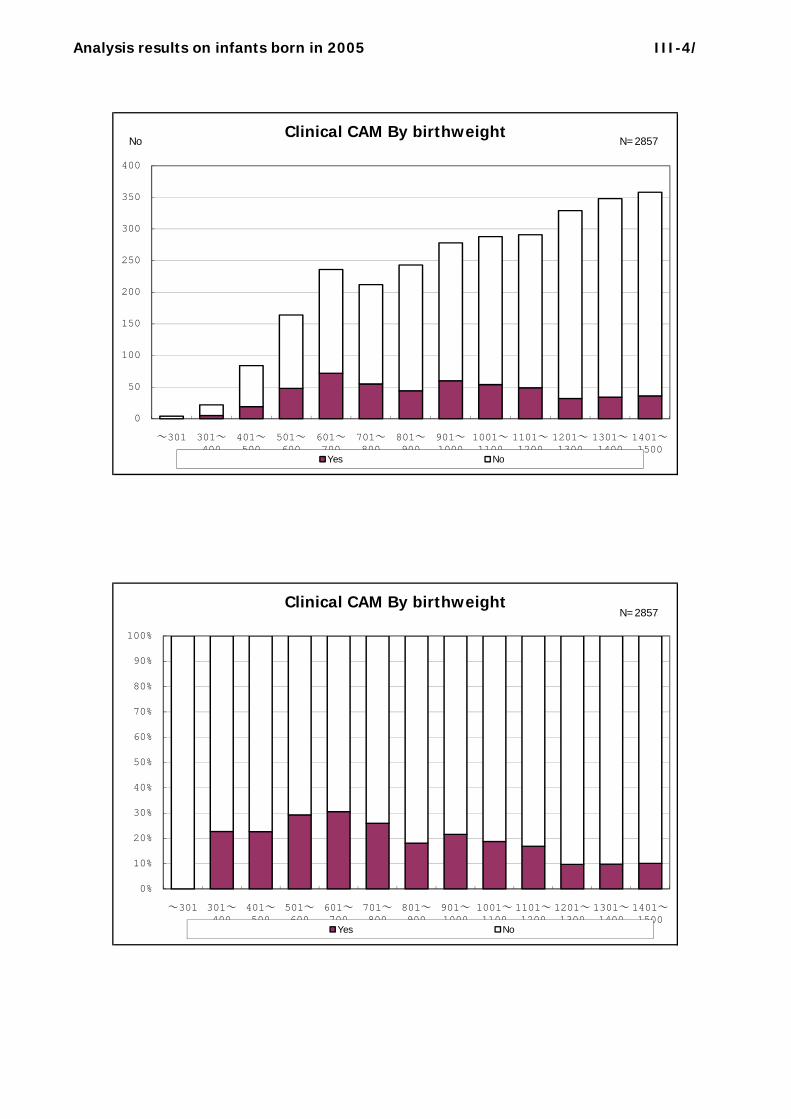
NoClinical CAM By birthweight
N=2857
0
50
100
150
200
250
300
350
400
~301 301~400
401~500
501~600
601~700
701~800
801~900
901~1000
1001~1100
1101~1200
1201~1300
1301~1400
1401~1500
Yes No
Clinical CAM By birthweightN=2857
0%
10%
20%
30%
40%
50%
60%
70%
80%
90%
100%
~301 301~400
401~500
501~600
601~700
701~800
801~900
901~1000
1001~1100
1101~1200
1201~1300
1301~1400
1401~1500
Yes No
Analysis results on infants born in 2005 III-5/
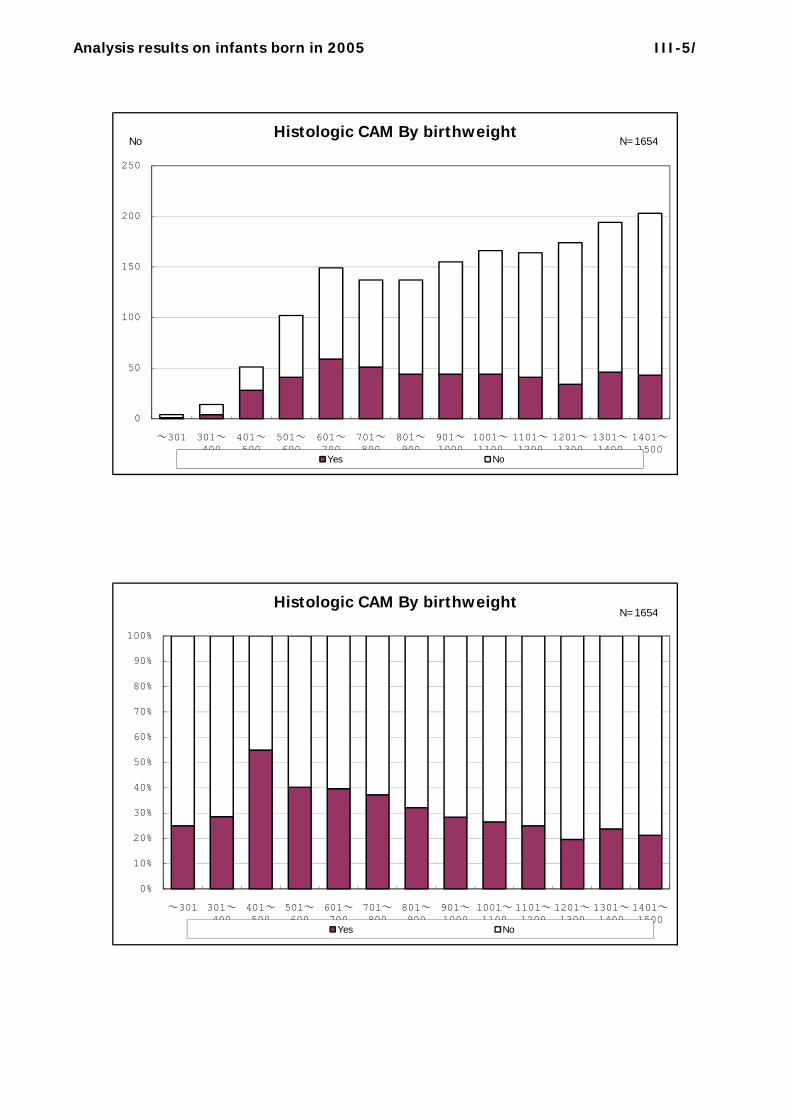
NoHistologic CAM By birthweight
N=1654
0
50
100
150
200
250
~301 301~400
401~500
501~600
601~700
701~800
801~900
901~1000
1001~1100
1101~1200
1201~1300
1301~1400
1401~1500
Yes No
Histologic CAM By birthweightN=1654
0%
10%
20%
30%
40%
50%
60%
70%
80%
90%
100%
~301 301~400
401~500
501~600
601~700
701~800
801~900
901~1000
1001~1100
1101~1200
1201~1300
1301~1400
1401~1500
Yes No
Analysis results on infants born in 2005 III-6/
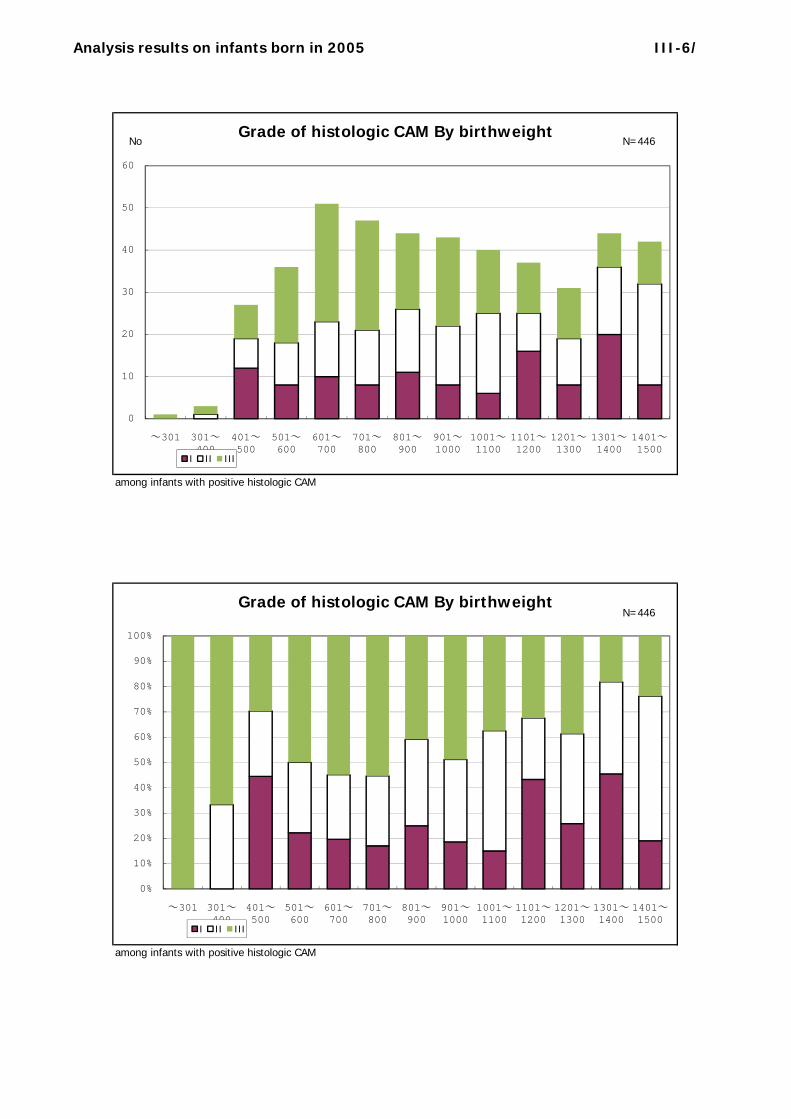
NoGrade of histologic CAM By birthweight
N=446
among infants with positive histologic CAM
0
10
20
30
40
50
60
~301 301~400
401~500
501~600
601~700
701~800
801~900
901~1000
1001~1100
1101~1200
1201~1300
1301~1400
1401~1500
I II III
Grade of histologic CAM By birthweightN=446
among infants with positive histologic CAM
0%
10%
20%
30%
40%
50%
60%
70%
80%
90%
100%
~301 301~400
401~500
501~600
601~700
701~800
801~900
901~1000
1001~1100
1101~1200
1201~1300
1301~1400
1401~1500
I II III
Analysis results on infants born in 2005 III-7/
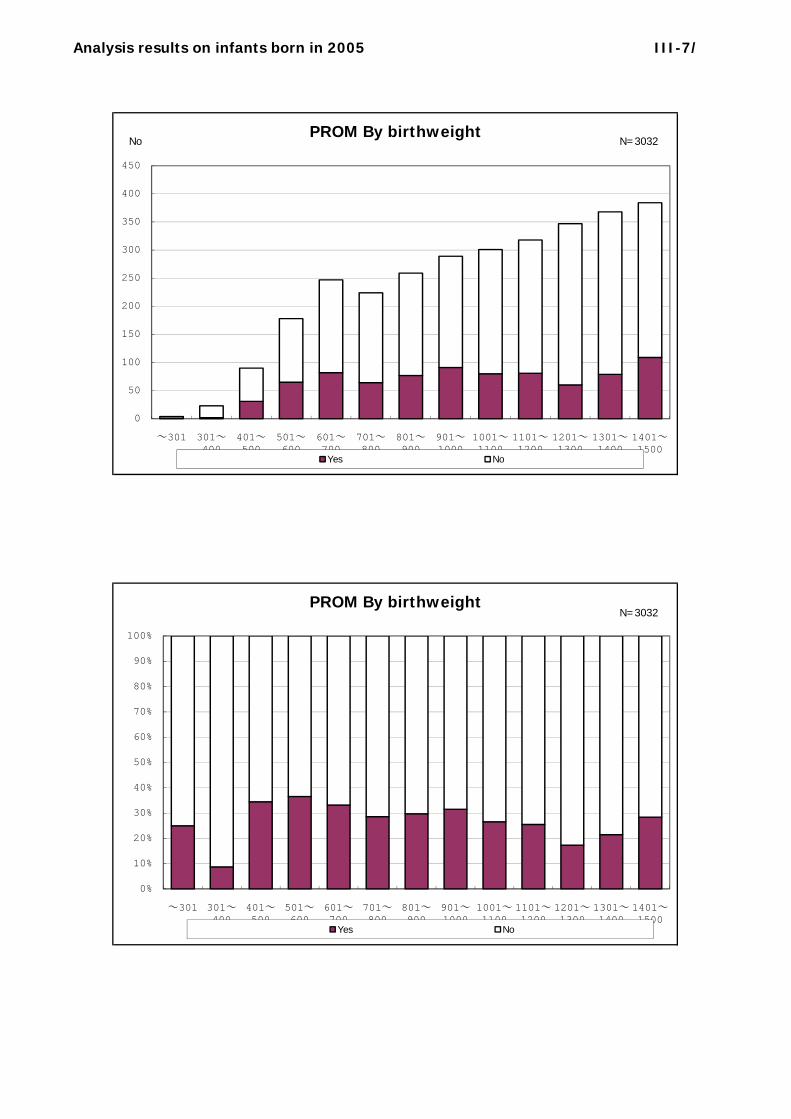
NoPROM By birthweight
N=3032
0
50
100
150
200
250
300
350
400
450
~301 301~400
401~500
501~600
601~700
701~800
801~900
901~1000
1001~1100
1101~1200
1201~1300
1301~1400
1401~1500
Yes No
PROM By birthweightN=3032
0%
10%
20%
30%
40%
50%
60%
70%
80%
90%
100%
~301 301~400
401~500
501~600
601~700
701~800
801~900
901~1000
1001~1100
1101~1200
1201~1300
1301~1400
1401~1500
Yes No
Analysis results on infants born in 2005 III-8/
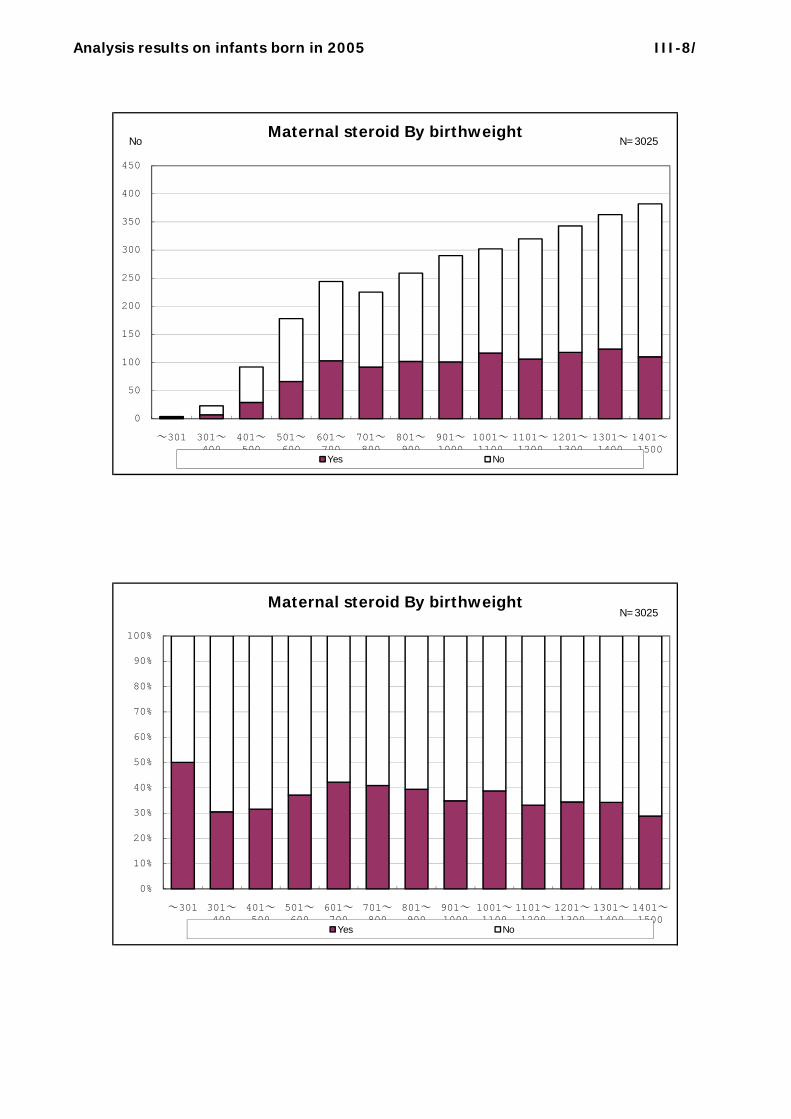
NoMaternal steroid By birthweight
N=3025
0
50
100
150
200
250
300
350
400
450
~301 301~400
401~500
501~600
601~700
701~800
801~900
901~1000
1001~1100
1101~1200
1201~1300
1301~1400
1401~1500
Yes No
Maternal steroid By birthweightN=3025
0%
10%
20%
30%
40%
50%
60%
70%
80%
90%
100%
~301 301~400
401~500
501~600
601~700
701~800
801~900
901~1000
1001~1100
1101~1200
1201~1300
1301~1400
1401~1500
Yes No
Analysis results on infants born in 2005 III-9/
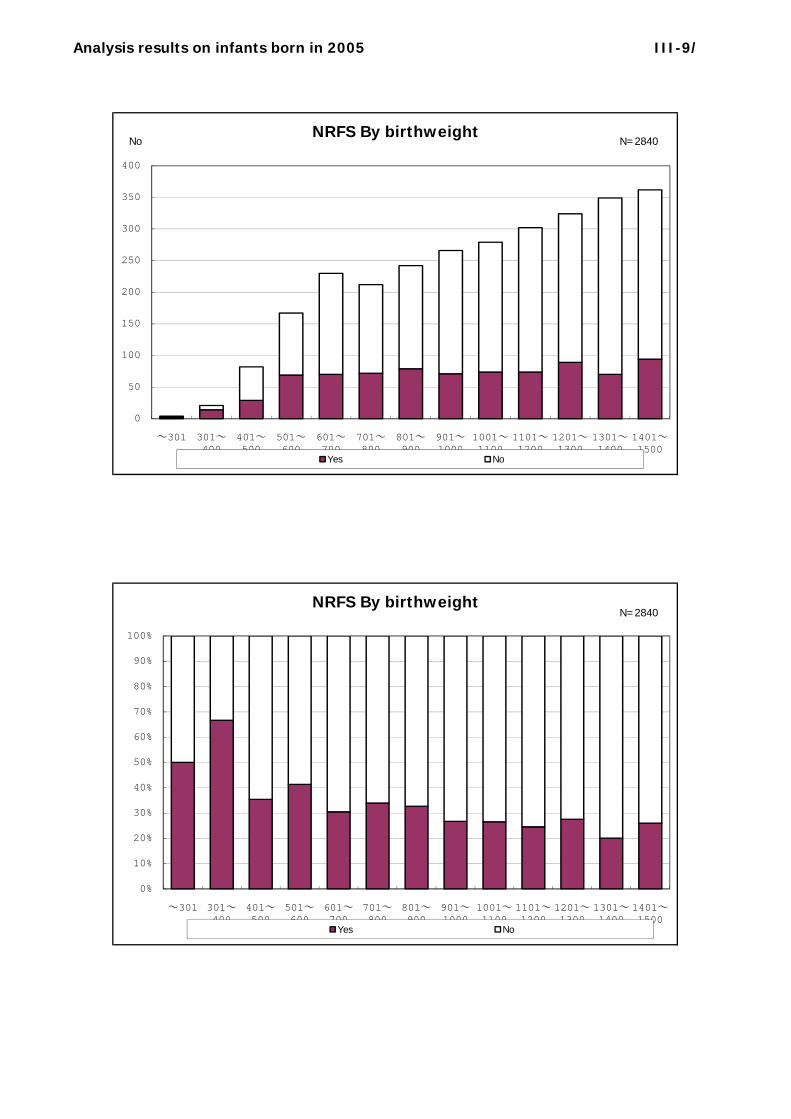
NoNRFS By birthweight
N=2840
0
50
100
150
200
250
300
350
400
~301 301~400
401~500
501~600
601~700
701~800
801~900
901~1000
1001~1100
1101~1200
1201~1300
1301~1400
1401~1500
Yes No
NRFS By birthweightN=2840
0%
10%
20%
30%
40%
50%
60%
70%
80%
90%
100%
~301 301~400
401~500
501~600
601~700
701~800
801~900
901~1000
1001~1100
1101~1200
1201~1300
1301~1400
1401~1500
Yes No
Analysis results on infants born in 2005 III-10/
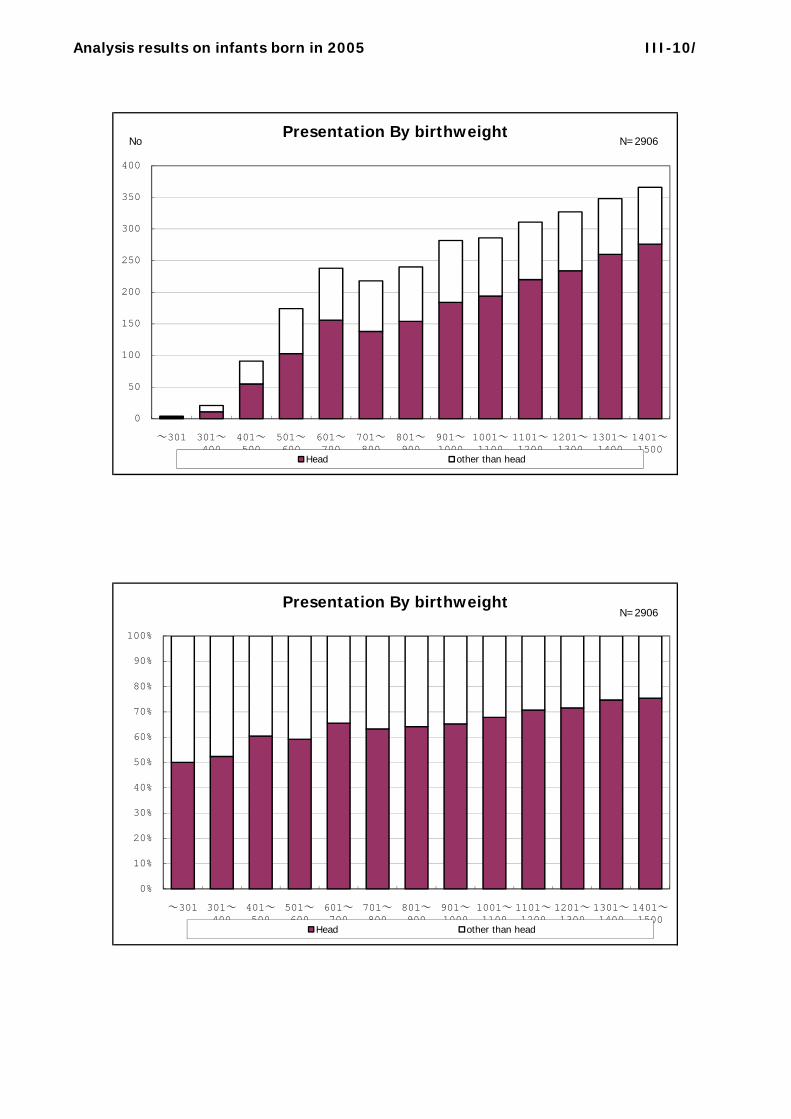
NoPresentation By birthweight
N=2906
0
50
100
150
200
250
300
350
400
~301 301~400
401~500
501~600
601~700
701~800
801~900
901~1000
1001~1100
1101~1200
1201~1300
1301~1400
1401~1500
Head other than head
Presentation By birthweightN=2906
0%
10%
20%
30%
40%
50%
60%
70%
80%
90%
100%
~301 301~400
401~500
501~600
601~700
701~800
801~900
901~1000
1001~1100
1101~1200
1201~1300
1301~1400
1401~1500
Head other than head
Analysis results on infants born in 2005 III-11/
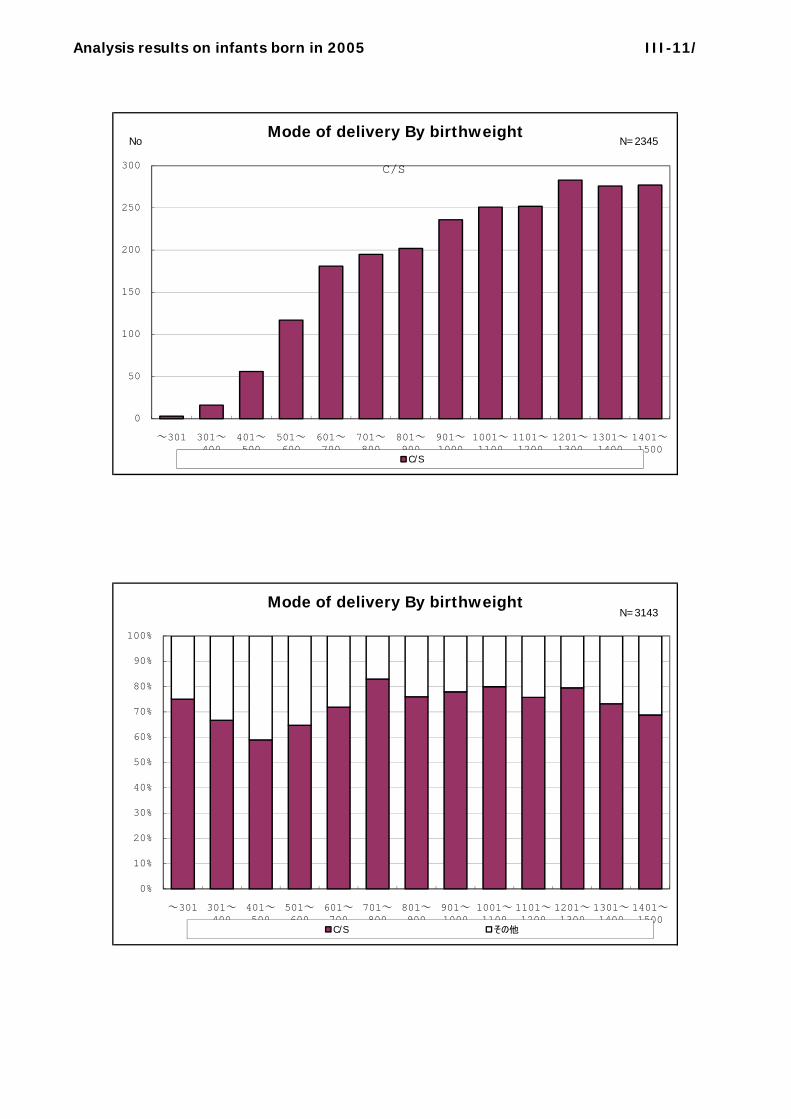
NoMode of delivery By birthweight
N=2345
0
50
100
150
200
250
300
~301 301~400
401~500
501~600
601~700
701~800
801~900
901~1000
1001~1100
1101~1200
1201~1300
1301~1400
1401~1500
C/S
C/S
Mode of delivery By birthweightN=3143
0%
10%
20%
30%
40%
50%
60%
70%
80%
90%
100%
~301 301~400
401~500
501~600
601~700
701~800
801~900
901~1000
1001~1100
1101~1200
1201~1300
1301~1400
1401~1500
C/S その他
Analysis results on infants born in 2005 III-12/
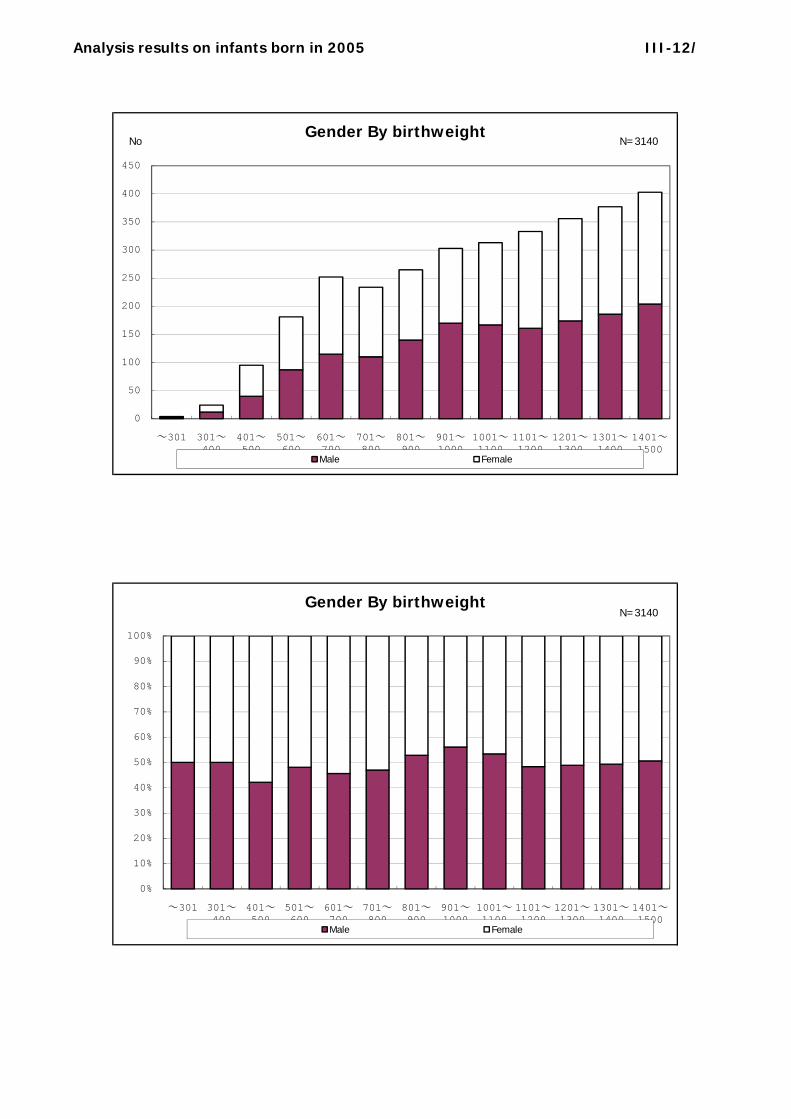
NoGender By birthweight
N=3140
0
50
100
150
200
250
300
350
400
450
~301 301~400
401~500
501~600
601~700
701~800
801~900
901~1000
1001~1100
1101~1200
1201~1300
1301~1400
1401~1500
Male Female
Gender By birthweightN=3140
0%
10%
20%
30%
40%
50%
60%
70%
80%
90%
100%
~301 301~400
401~500
501~600
601~700
701~800
801~900
901~1000
1001~1100
1101~1200
1201~1300
1301~1400
1401~1500
Male Female
Analysis results on infants born in 2005 III-13/
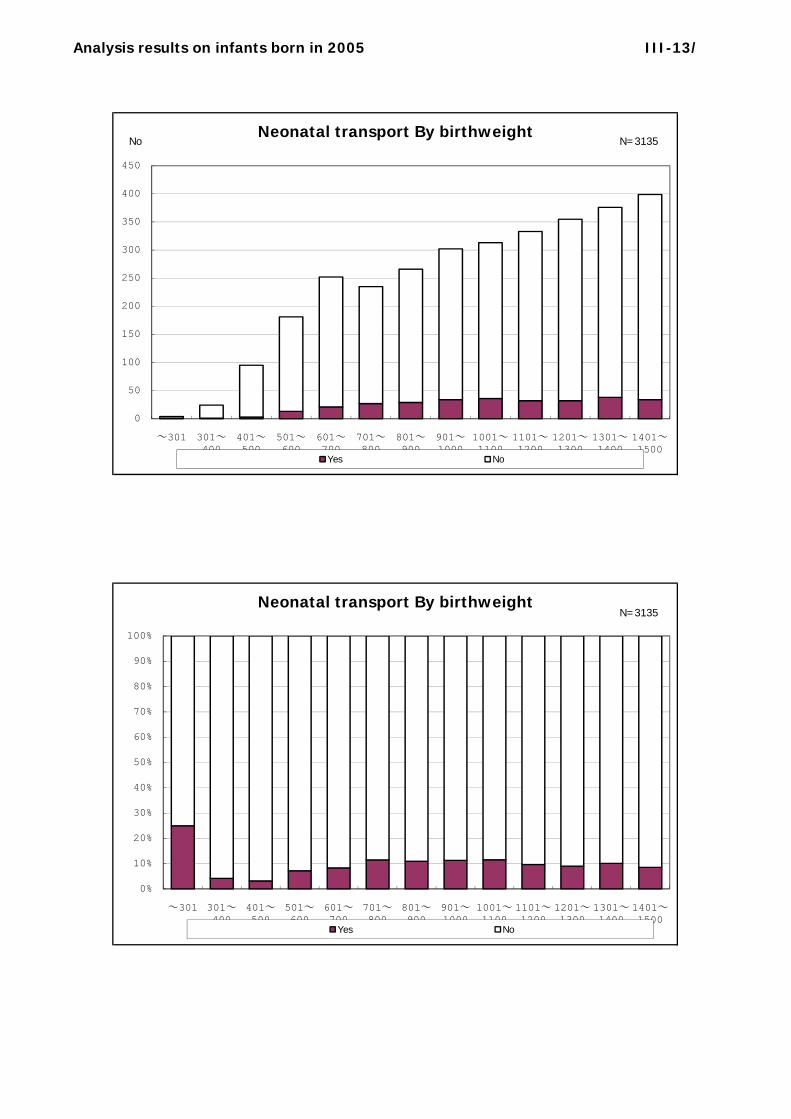
NoNeonatal transport By birthweight
N=3135
0
50
100
150
200
250
300
350
400
450
~301 301~400
401~500
501~600
601~700
701~800
801~900
901~1000
1001~1100
1101~1200
1201~1300
1301~1400
1401~1500
Yes No
Neonatal transport By birthweightN=3135
0%
10%
20%
30%
40%
50%
60%
70%
80%
90%
100%
~301 301~400
401~500
501~600
601~700
701~800
801~900
901~1000
1001~1100
1101~1200
1201~1300
1301~1400
1401~1500
Yes No
Analysis results on infants born in 2005 III-14/
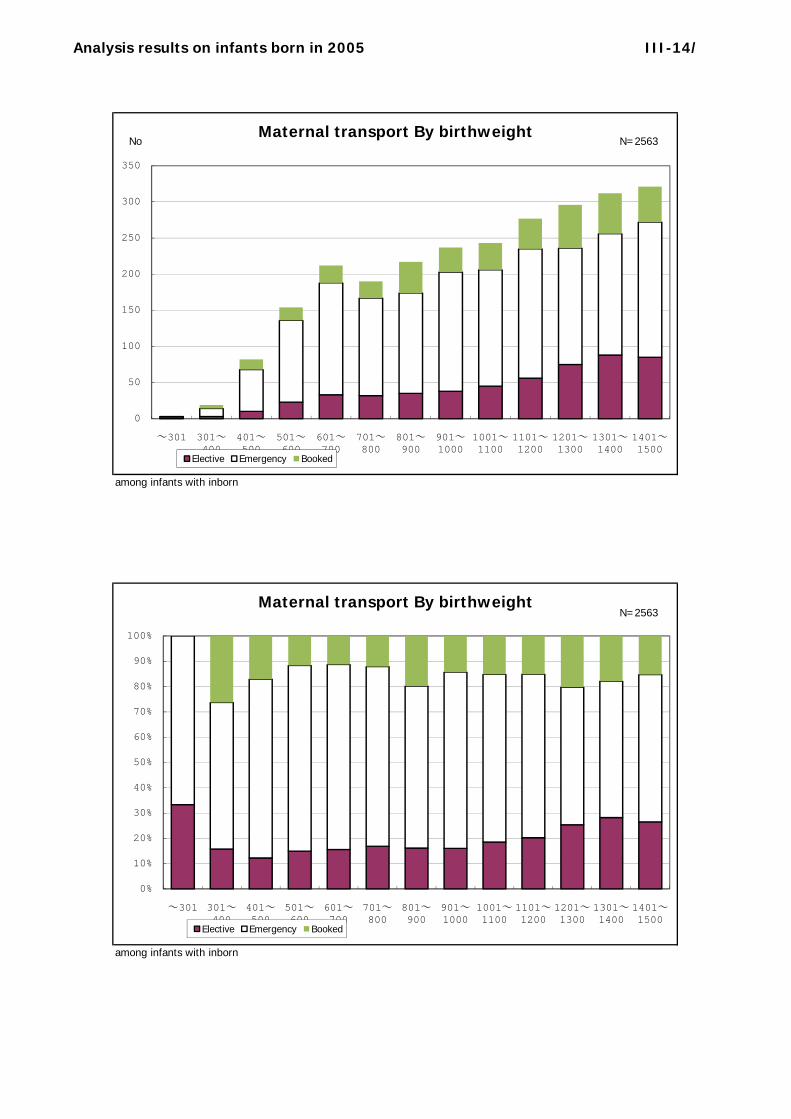
NoMaternal transport By birthweight
N=2563
among infants with inborn
0
50
100
150
200
250
300
350
~301 301~400
401~500
501~600
601~700
701~800
801~900
901~1000
1001~1100
1101~1200
1201~1300
1301~1400
1401~1500
Elective Emergency Booked
Maternal transport By birthweightN=2563
among infants with inborn
0%
10%
20%
30%
40%
50%
60%
70%
80%
90%
100%
~301 301~400
401~500
501~600
601~700
701~800
801~900
901~1000
1001~1100
1101~1200
1201~1300
1301~1400
1401~1500
Elective Emergency Booked
Analysis results on infants born in 2005 III-15/
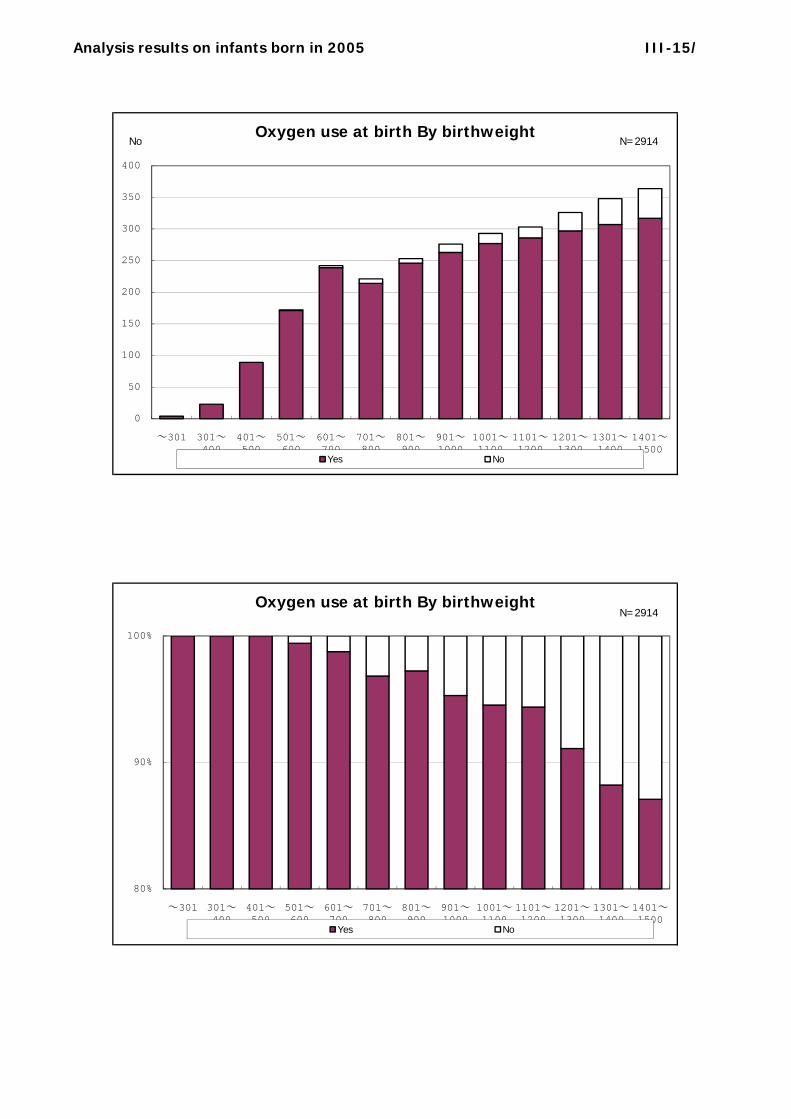
NoOxygen use at birth By birthweight
N=2914
0
50
100
150
200
250
300
350
400
~301 301~400
401~500
501~600
601~700
701~800
801~900
901~1000
1001~1100
1101~1200
1201~1300
1301~1400
1401~1500
Yes No
Oxygen use at birth By birthweightN=2914
80%
90%
100%
~301 301~400
401~500
501~600
601~700
701~800
801~900
901~1000
1001~1100
1101~1200
1201~1300
1301~1400
1401~1500
Yes No
Analysis results on infants born in 2005 III-16/
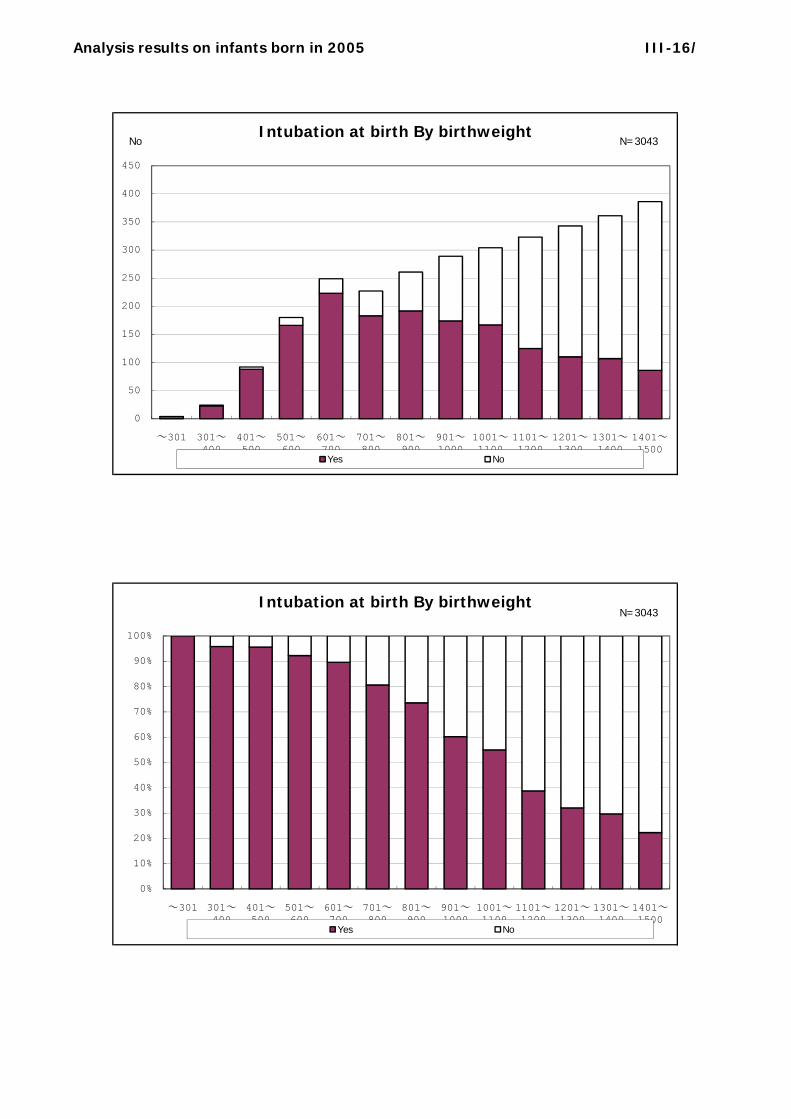
NoIntubation at birth By birthweight
N=3043
0
50
100
150
200
250
300
350
400
450
~301 301~400
401~500
501~600
601~700
701~800
801~900
901~1000
1001~1100
1101~1200
1201~1300
1301~1400
1401~1500
Yes No
Intubation at birth By birthweightN=3043
0%
10%
20%
30%
40%
50%
60%
70%
80%
90%
100%
~301 301~400
401~500
501~600
601~700
701~800
801~900
901~1000
1001~1100
1101~1200
1201~1300
1301~1400
1401~1500
Yes No
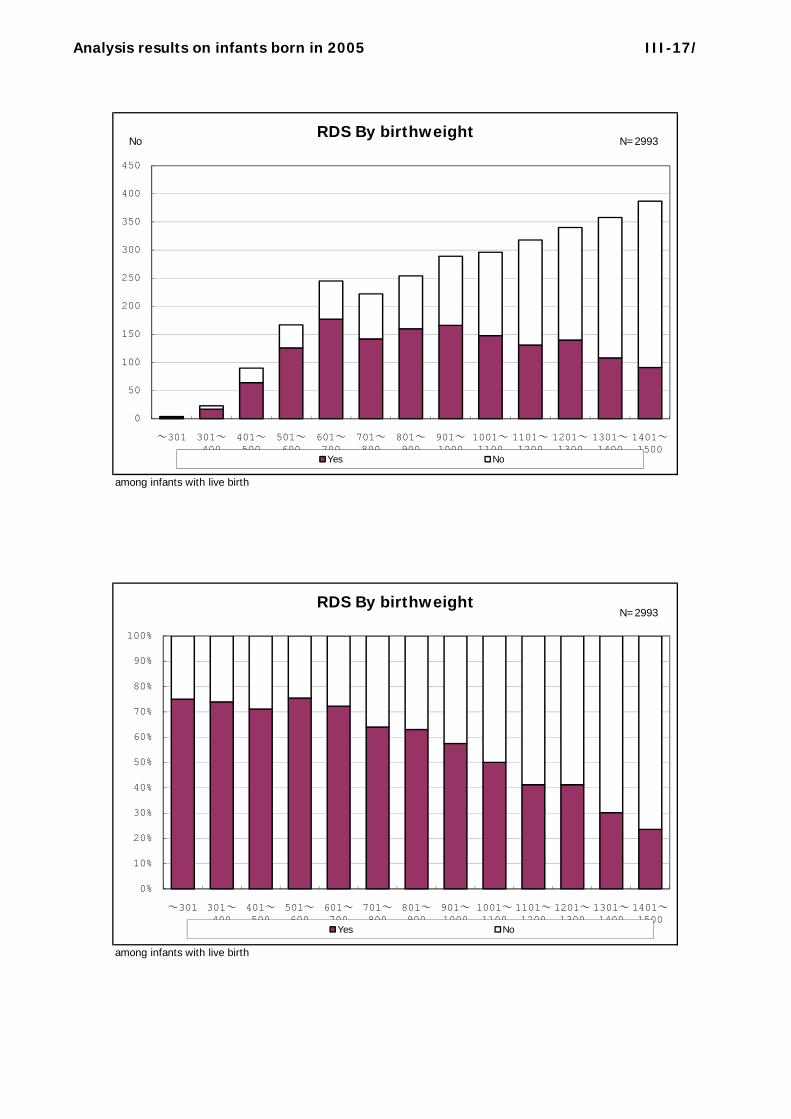
Analysis results on infants born in 2005 III-17/
NoRDS By birthweight
N=2993
among infants with live birth
0
50
100
150
200
250
300
350
400
450
~301 301~400
401~500
501~600
601~700
701~800
801~900
901~1000
1001~1100
1101~1200
1201~1300
1301~1400
1401~1500
Yes No
RDS By birthweightN=2993
among infants with live birth
0%
10%
20%
30%
40%
50%
60%
70%
80%
90%
100%
~301 301~400
401~500
501~600
601~700
701~800
801~900
901~1000
1001~1100
1101~1200
1201~1300
1301~1400
1401~1500
Yes No
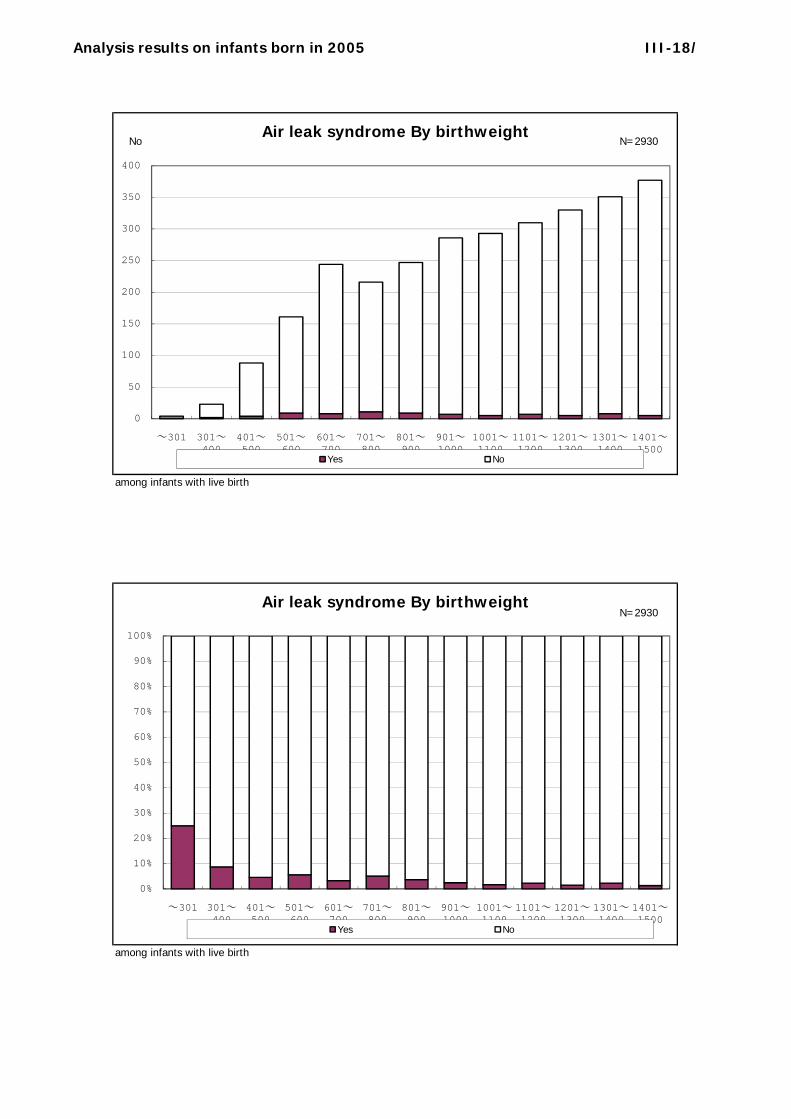
Analysis results on infants born in 2005 III-18/
NoAir leak syndrome By birthweight
N=2930
among infants with live birth
0
50
100
150
200
250
300
350
400
~301 301~400
401~500
501~600
601~700
701~800
801~900
901~1000
1001~1100
1101~1200
1201~1300
1301~1400
1401~1500
Yes No
Air leak syndrome By birthweightN=2930
among infants with live birth
0%
10%
20%
30%
40%
50%
60%
70%
80%
90%
100%
~301 301~400
401~500
501~600
601~700
701~800
801~900
901~1000
1001~1100
1101~1200
1201~1300
1301~1400
1401~1500
Yes No
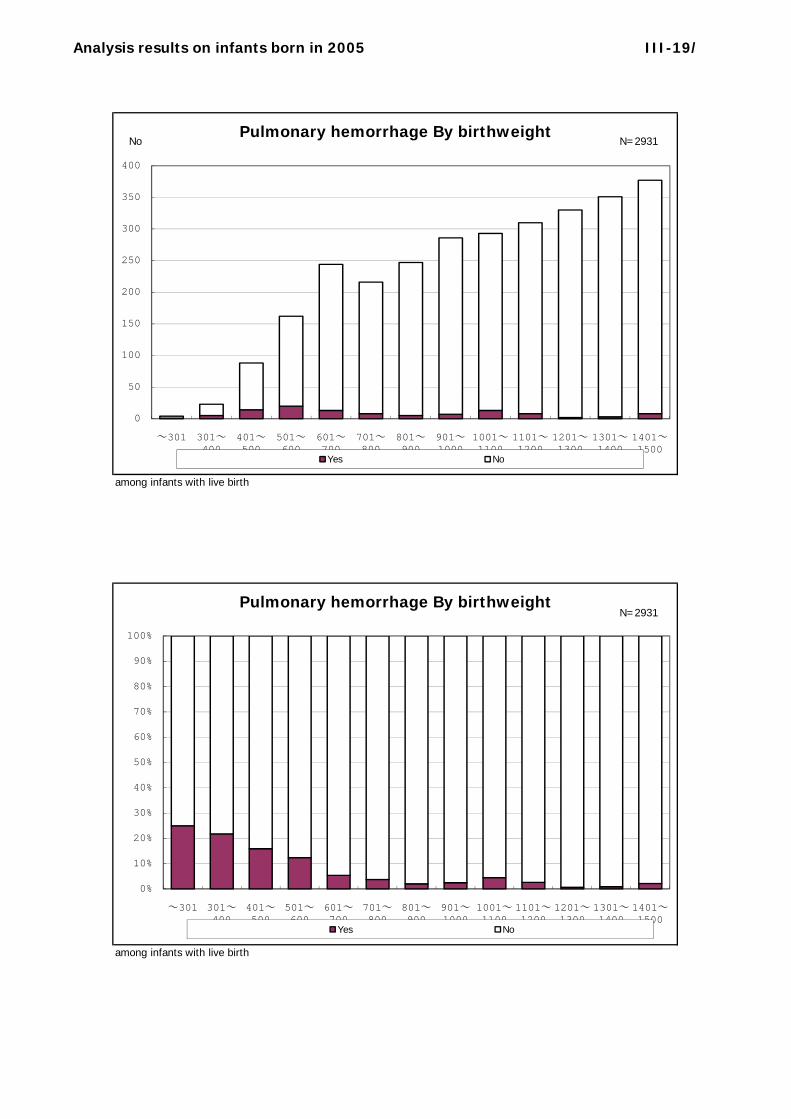
Analysis results on infants born in 2005 III-19/
NoPulmonary hemorrhage By birthweight
N=2931
among infants with live birth
0
50
100
150
200
250
300
350
400
~301 301~400
401~500
501~600
601~700
701~800
801~900
901~1000
1001~1100
1101~1200
1201~1300
1301~1400
1401~1500
Yes No
Pulmonary hemorrhage By birthweightN=2931
among infants with live birth
0%
10%
20%
30%
40%
50%
60%
70%
80%
90%
100%
~301 301~400
401~500
501~600
601~700
701~800
801~900
901~1000
1001~1100
1101~1200
1201~1300
1301~1400
1401~1500
Yes No
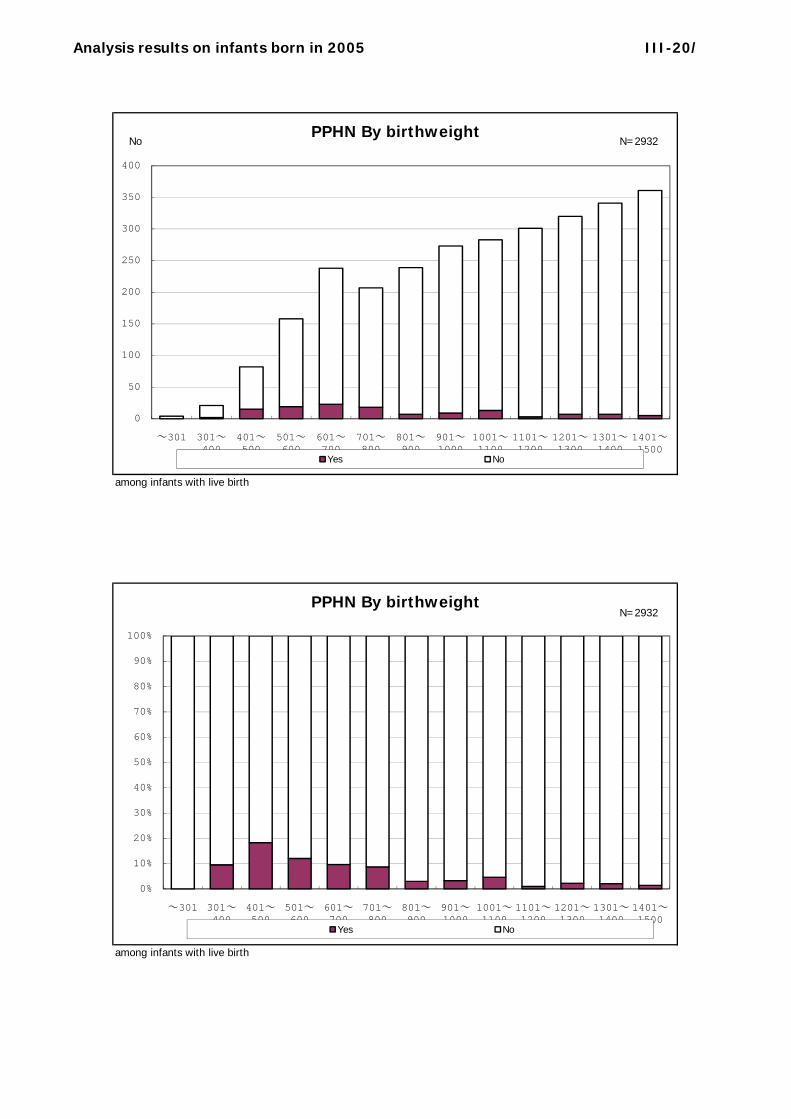
Analysis results on infants born in 2005 III-20/
NoPPHN By birthweight
N=2932
among infants with live birth
0
50
100
150
200
250
300
350
400
~301 301~400
401~500
501~600
601~700
701~800
801~900
901~1000
1001~1100
1101~1200
1201~1300
1301~1400
1401~1500
Yes No
PPHN By birthweightN=2932
among infants with live birth
0%
10%
20%
30%
40%
50%
60%
70%
80%
90%
100%
~301 301~400
401~500
501~600
601~700
701~800
801~900
901~1000
1001~1100
1101~1200
1201~1300
1301~1400
1401~1500
Yes No
Analysis results on infants born in 2005 III-21/
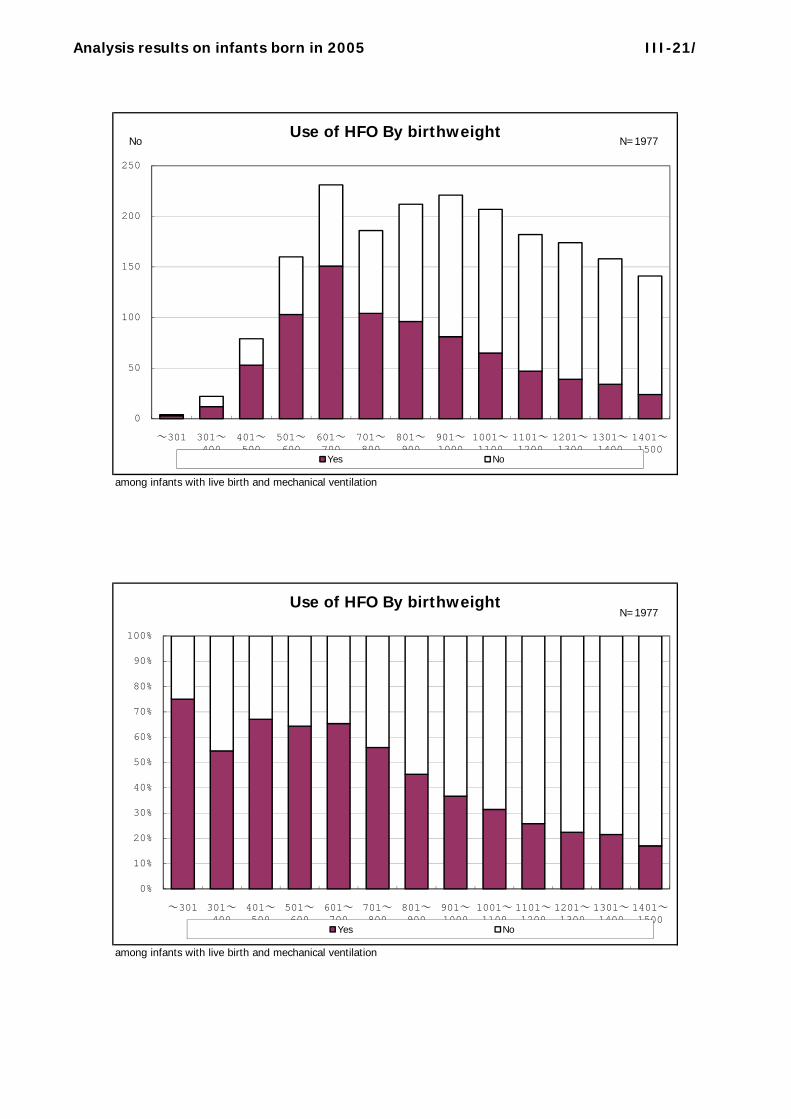
NoUse of HFO By birthweight
N=1977
among infants with live birth and mechanical ventilation
0
50
100
150
200
250
~301 301~400
401~500
501~600
601~700
701~800
801~900
901~1000
1001~1100
1101~1200
1201~1300
1301~1400
1401~1500
Yes No
Use of HFO By birthweightN=1977
among infants with live birth and mechanical ventilation
0%
10%
20%
30%
40%
50%
60%
70%
80%
90%
100%
~301 301~400
401~500
501~600
601~700
701~800
801~900
901~1000
1001~1100
1101~1200
1201~1300
1301~1400
1401~1500
Yes No
Analysis results on infants born in 2005 III-22/
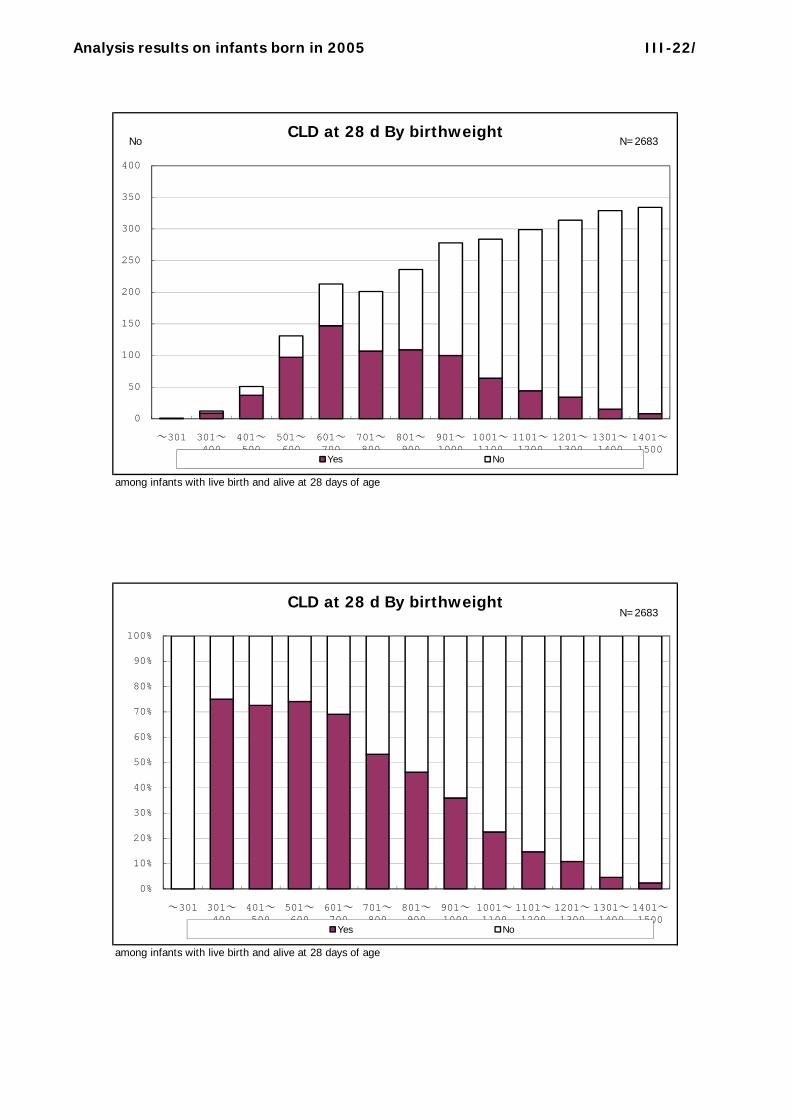
NoCLD at 28 d By birthweight
N=2683
among infants with live birth and alive at 28 days of age
0
50
100
150
200
250
300
350
400
~301 301~400
401~500
501~600
601~700
701~800
801~900
901~1000
1001~1100
1101~1200
1201~1300
1301~1400
1401~1500
Yes No
CLD at 28 d By birthweightN=2683
among infants with live birth and alive at 28 days of age
0%
10%
20%
30%
40%
50%
60%
70%
80%
90%
100%
~301 301~400
401~500
501~600
601~700
701~800
801~900
901~1000
1001~1100
1101~1200
1201~1300
1301~1400
1401~1500
Yes No
Analysis results on infants born in 2005 III-23/
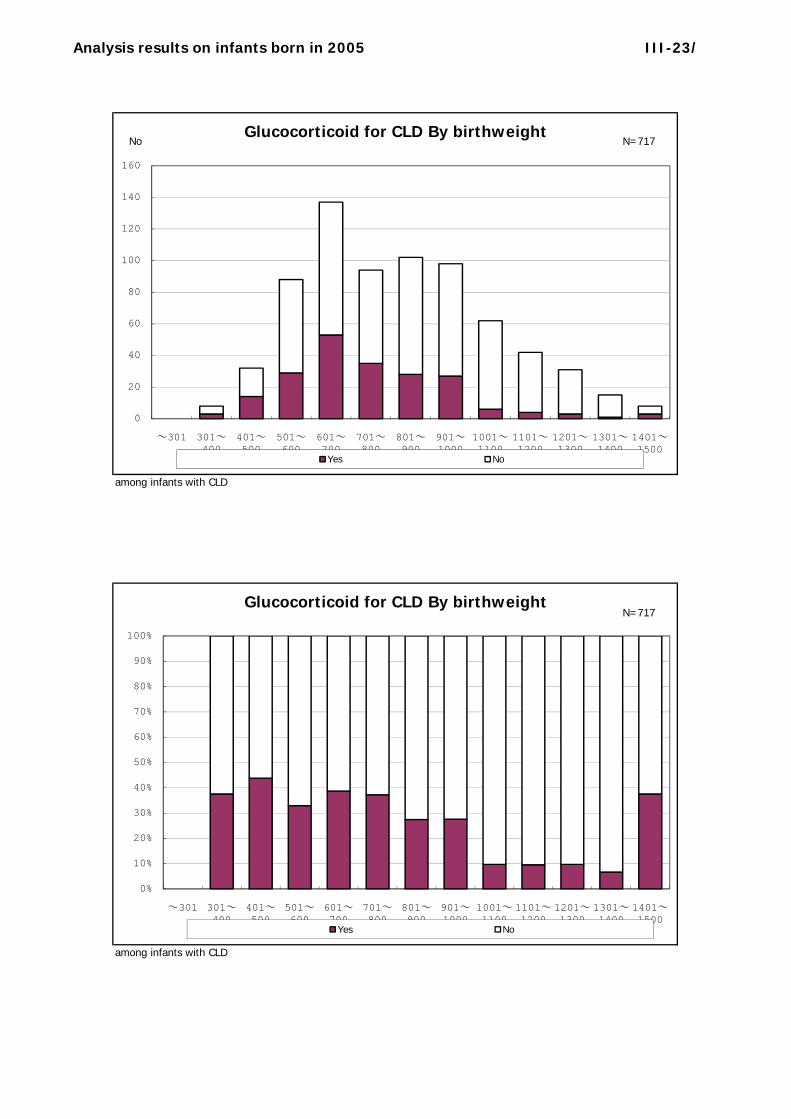
NoGlucocorticoid for CLD By birthweight
N=717
among infants with CLD
0
20
40
60
80
100
120
140
160
~301 301~400
401~500
501~600
601~700
701~800
801~900
901~1000
1001~1100
1101~1200
1201~1300
1301~1400
1401~1500
Yes No
Glucocorticoid for CLD By birthweightN=717
among infants with CLD
0%
10%
20%
30%
40%
50%
60%
70%
80%
90%
100%
~301 301~400
401~500
501~600
601~700
701~800
801~900
901~1000
1001~1100
1101~1200
1201~1300
1301~1400
1401~1500
Yes No
Analysis results on infants born in 2005 III-24/
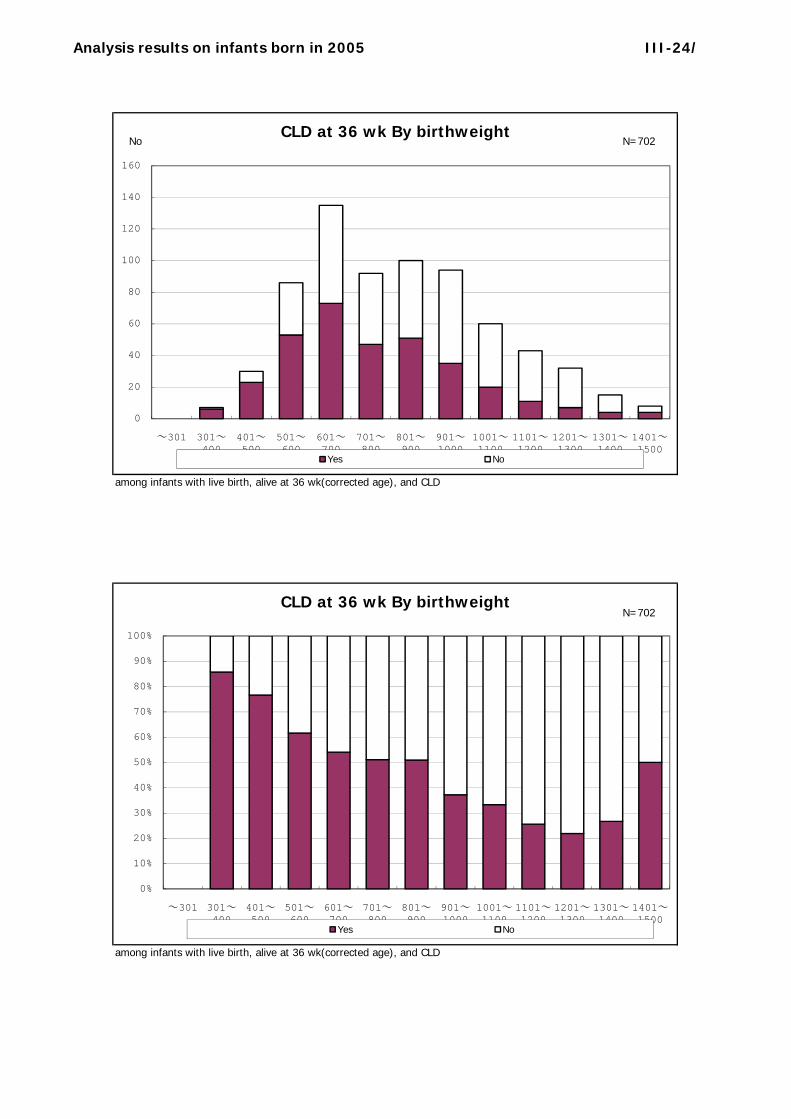
NoCLD at 36 wk By birthweight
N=702
among infants with live birth, alive at 36 wk(corrected age), and CLD
0
20
40
60
80
100
120
140
160
~301 301~400
401~500
501~600
601~700
701~800
801~900
901~1000
1001~1100
1101~1200
1201~1300
1301~1400
1401~1500
Yes No
CLD at 36 wk By birthweightN=702
among infants with live birth, alive at 36 wk(corrected age), and CLD
0%
10%
20%
30%
40%
50%
60%
70%
80%
90%
100%
~301 301~400
401~500
501~600
601~700
701~800
801~900
901~1000
1001~1100
1101~1200
1201~1300
1301~1400
1401~1500
Yes No
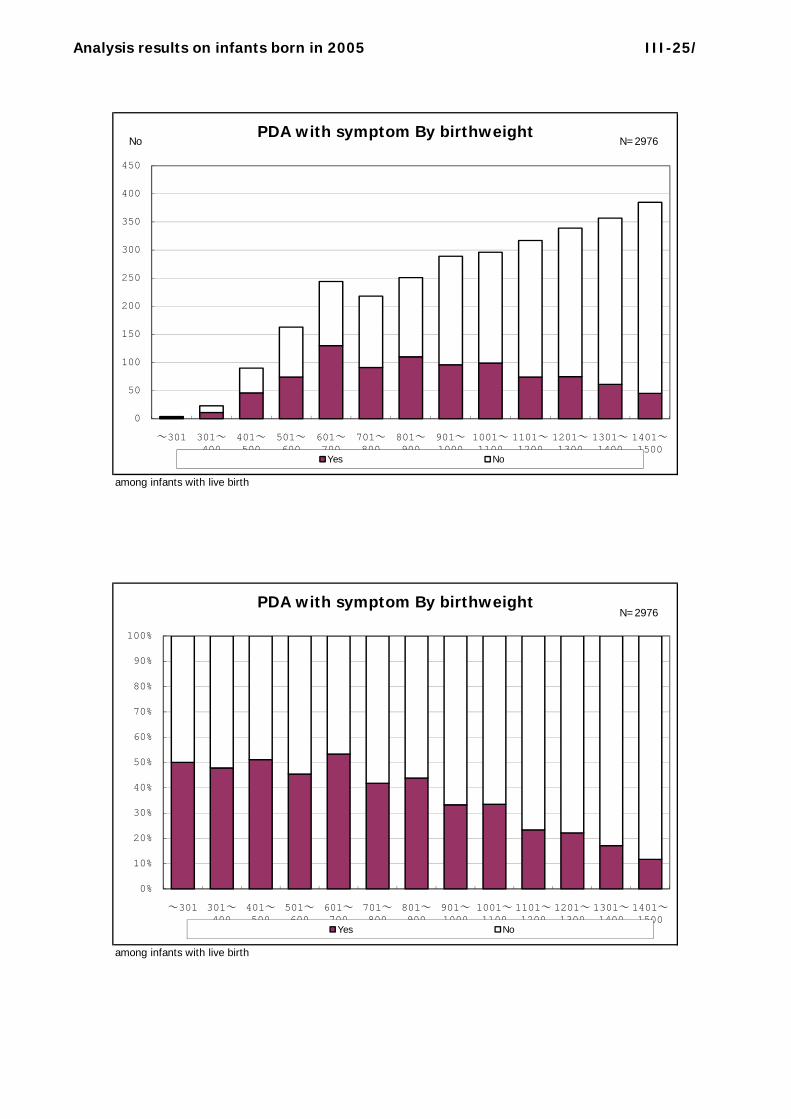
Analysis results on infants born in 2005 III-25/
NoPDA with symptom By birthweight
N=2976
among infants with live birth
0
50
100
150
200
250
300
350
400
450
~301 301~400
401~500
501~600
601~700
701~800
801~900
901~1000
1001~1100
1101~1200
1201~1300
1301~1400
1401~1500
Yes No
PDA with symptom By birthweightN=2976
among infants with live birth
0%
10%
20%
30%
40%
50%
60%
70%
80%
90%
100%
~301 301~400
401~500
501~600
601~700
701~800
801~900
901~1000
1001~1100
1101~1200
1201~1300
1301~1400
1401~1500
Yes No
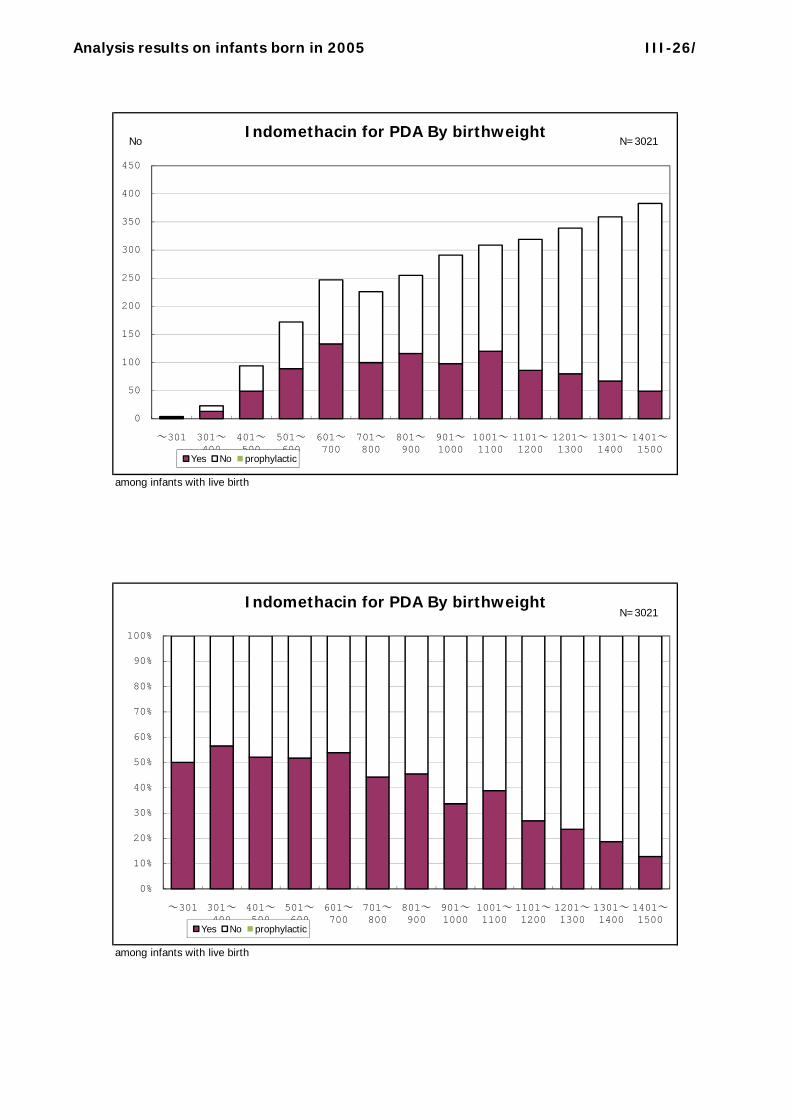
Analysis results on infants born in 2005 III-26/
NoIndomethacin for PDA By birthweight
N=3021
among infants with live birth
0
50
100
150
200
250
300
350
400
450
~301 301~400
401~500
501~600
601~700
701~800
801~900
901~1000
1001~1100
1101~1200
1201~1300
1301~1400
1401~1500
Yes No prophylactic
Indomethacin for PDA By birthweightN=3021
among infants with live birth
0%
10%
20%
30%
40%
50%
60%
70%
80%
90%
100%
~301 301~400
401~500
501~600
601~700
701~800
801~900
901~1000
1001~1100
1101~1200
1201~1300
1301~1400
1401~1500
Yes No prophylactic
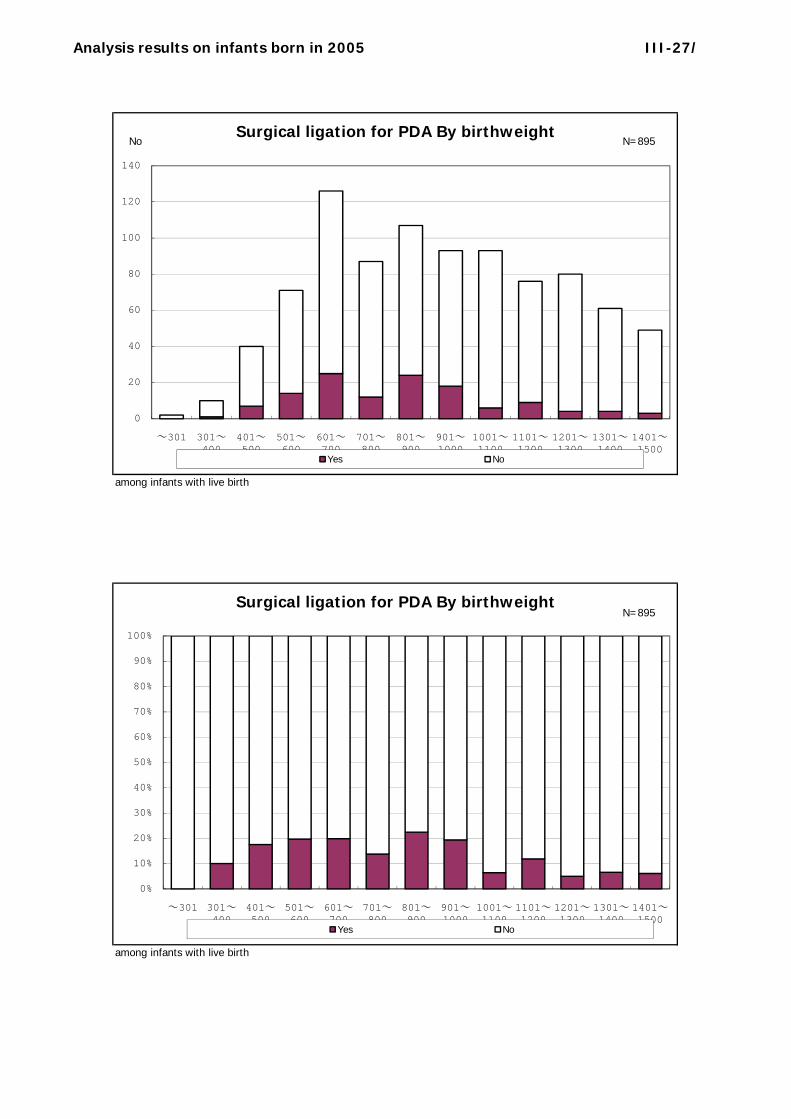
Analysis results on infants born in 2005 III-27/
NoSurgical ligation for PDA By birthweight
N=895
among infants with live birth
0
20
40
60
80
100
120
140
~301 301~400
401~500
501~600
601~700
701~800
801~900
901~1000
1001~1100
1101~1200
1201~1300
1301~1400
1401~1500
Yes No
Surgical ligation for PDA By birthweightN=895
among infants with live birth
0%
10%
20%
30%
40%
50%
60%
70%
80%
90%
100%
~301 301~400
401~500
501~600
601~700
701~800
801~900
901~1000
1001~1100
1101~1200
1201~1300
1301~1400
1401~1500
Yes No
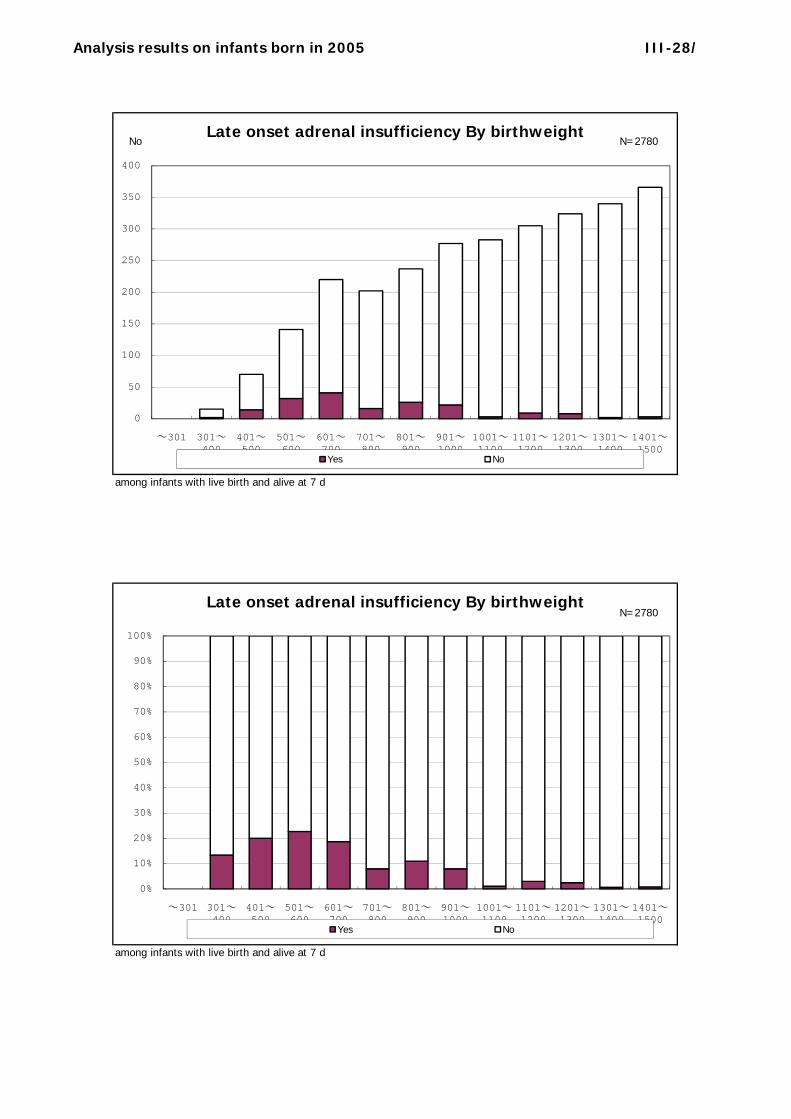
Analysis results on infants born in 2005 III-28/
NoLate onset adrenal insufficiency By birthweight
N=2780
among infants with live birth and alive at 7 d
0
50
100
150
200
250
300
350
400
~301 301~400
401~500
501~600
601~700
701~800
801~900
901~1000
1001~1100
1101~1200
1201~1300
1301~1400
1401~1500
Yes No
Late onset adrenal insufficiency By birthweightN=2780
among infants with live birth and alive at 7 d
0%
10%
20%
30%
40%
50%
60%
70%
80%
90%
100%
~301 301~400
401~500
501~600
601~700
701~800
801~900
901~1000
1001~1100
1101~1200
1201~1300
1301~1400
1401~1500
Yes No

Analysis results on infants born in 2005 III-29/
NoSeizure By birthweight
N=2930
among infants with live birth
0
50
100
150
200
250
300
350
400
~301 301~400
401~500
501~600
601~700
701~800
801~900
901~1000
1001~1100
1101~1200
1201~1300
1301~1400
1401~1500
Yes No
Seizure By birthweightN=2930
among infants with live birth
0%
10%
20%
30%
40%
50%
60%
70%
80%
90%
100%
~301 301~400
401~500
501~600
601~700
701~800
801~900
901~1000
1001~1100
1101~1200
1201~1300
1301~1400
1401~1500
Yes No
Analysis results on infants born in 2005 III-30/
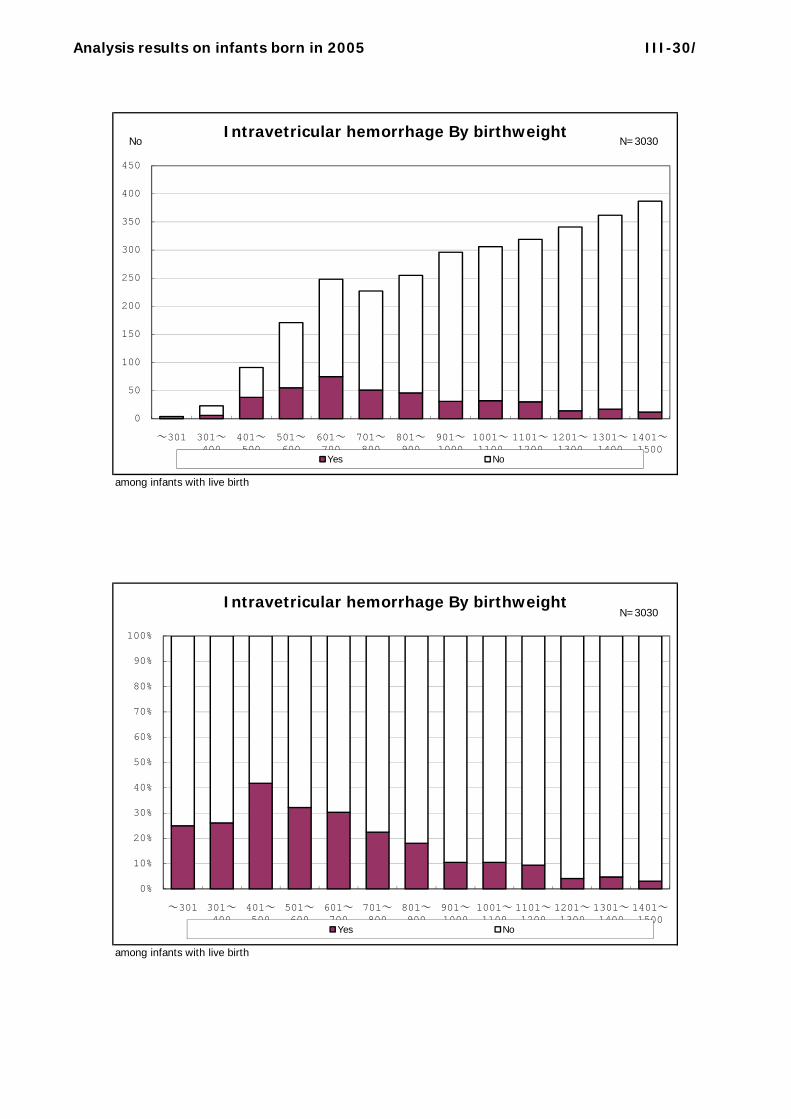
NoIntravetricular hemorrhage By birthweight
N=3030
among infants with live birth
0
50
100
150
200
250
300
350
400
450
~301 301~400
401~500
501~600
601~700
701~800
801~900
901~1000
1001~1100
1101~1200
1201~1300
1301~1400
1401~1500
Yes No
Intravetricular hemorrhage By birthweightN=3030
among infants with live birth
0%
10%
20%
30%
40%
50%
60%
70%
80%
90%
100%
~301 301~400
401~500
501~600
601~700
701~800
801~900
901~1000
1001~1100
1101~1200
1201~1300
1301~1400
1401~1500
Yes No
Analysis results on infants born in 2005 III-31/
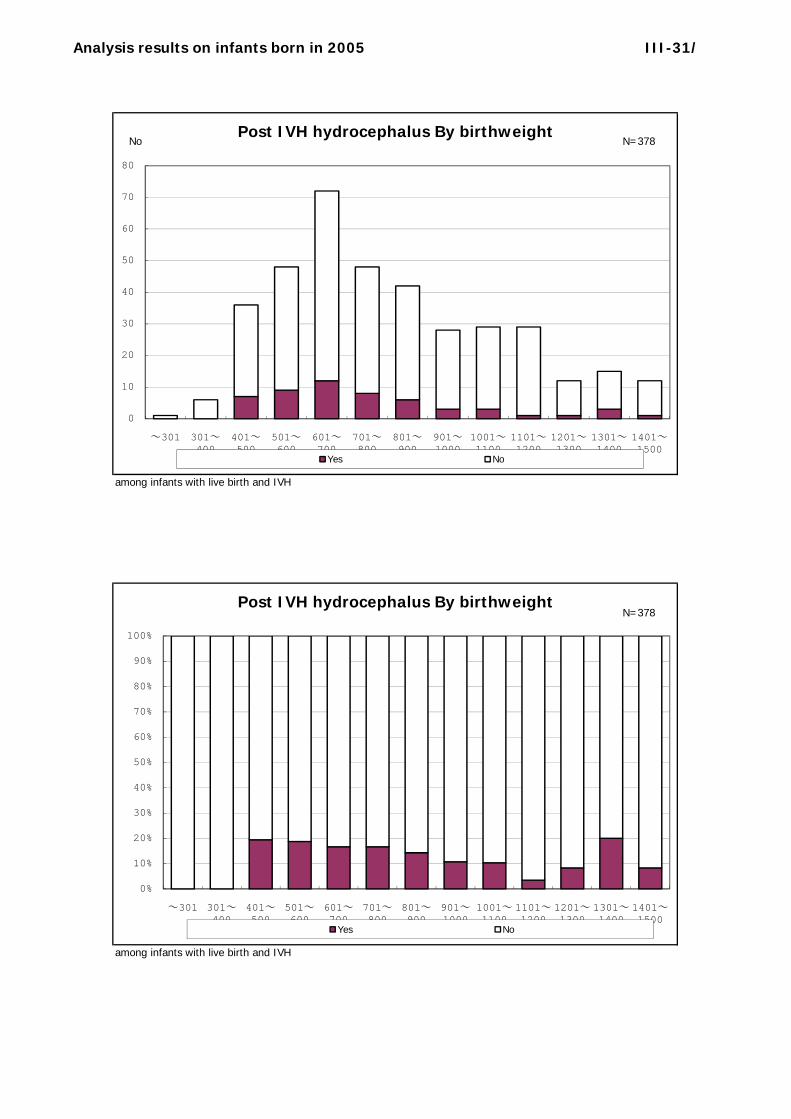
NoPost IVH hydrocephalus By birthweight
N=378
among infants with live birth and IVH
0
10
20
30
40
50
60
70
80
~301 301~400
401~500
501~600
601~700
701~800
801~900
901~1000
1001~1100
1101~1200
1201~1300
1301~1400
1401~1500
Yes No
Post IVH hydrocephalus By birthweightN=378
among infants with live birth and IVH
0%
10%
20%
30%
40%
50%
60%
70%
80%
90%
100%
~301 301~400
401~500
501~600
601~700
701~800
801~900
901~1000
1001~1100
1101~1200
1201~1300
1301~1400
1401~1500
Yes No

Analysis results on infants born in 2005 III-32/
NoPVL By birthweight
N=2990
among infants with live birth
0
50
100
150
200
250
300
350
400
450
~301 301~400
401~500
501~600
601~700
701~800
801~900
901~1000
1001~1100
1101~1200
1201~1300
1301~1400
1401~1500
Yes No
PVL By birthweightN=2990
among infants with live birth
0%
10%
20%
30%
40%
50%
60%
70%
80%
90%
100%
~301 301~400
401~500
501~600
601~700
701~800
801~900
901~1000
1001~1100
1101~1200
1201~1300
1301~1400
1401~1500
Yes No
Analysis results on infants born in 2005 III-33/
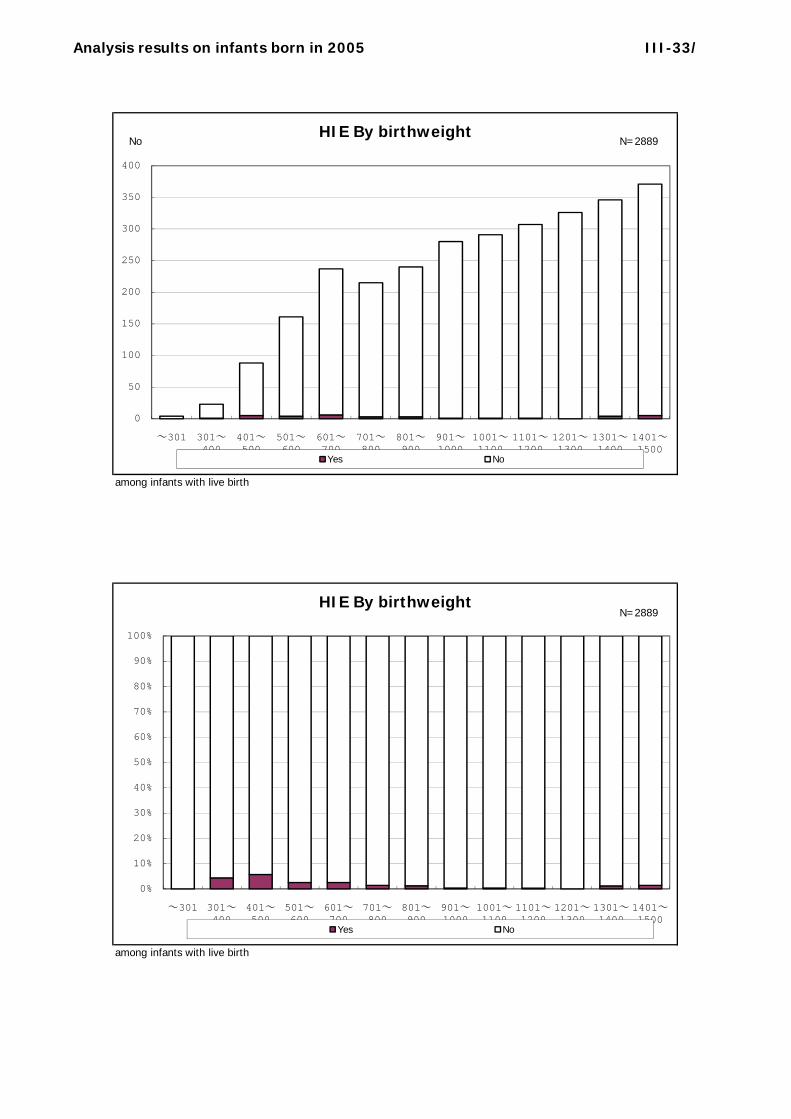
NoHIE By birthweight
N=2889
among infants with live birth
0
50
100
150
200
250
300
350
400
~301 301~400
401~500
501~600
601~700
701~800
801~900
901~1000
1001~1100
1101~1200
1201~1300
1301~1400
1401~1500
Yes No
HIE By birthweightN=2889
among infants with live birth
0%
10%
20%
30%
40%
50%
60%
70%
80%
90%
100%
~301 301~400
401~500
501~600
601~700
701~800
801~900
901~1000
1001~1100
1101~1200
1201~1300
1301~1400
1401~1500
Yes No
Analysis results on infants born in 2005 III-34/
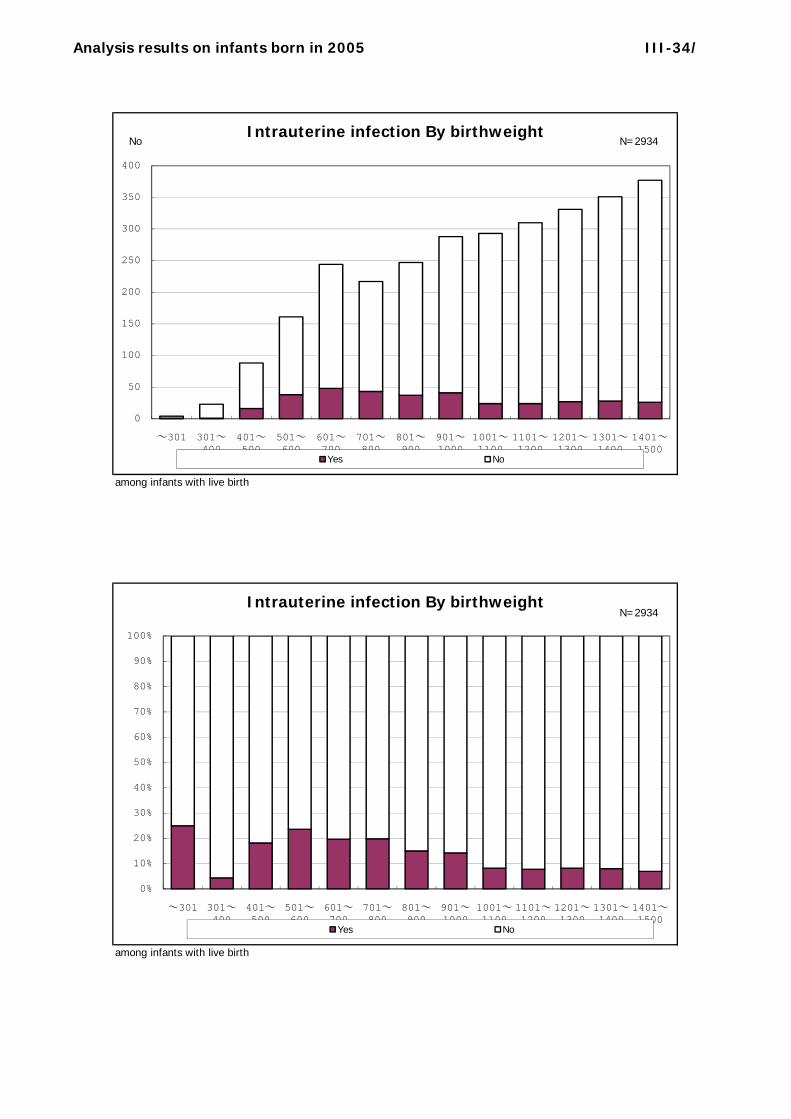
NoIntrauterine infection By birthweight
N=2934
among infants with live birth
0
50
100
150
200
250
300
350
400
~301 301~400
401~500
501~600
601~700
701~800
801~900
901~1000
1001~1100
1101~1200
1201~1300
1301~1400
1401~1500
Yes No
Intrauterine infection By birthweightN=2934
among infants with live birth
0%
10%
20%
30%
40%
50%
60%
70%
80%
90%
100%
~301 301~400
401~500
501~600
601~700
701~800
801~900
901~1000
1001~1100
1101~1200
1201~1300
1301~1400
1401~1500
Yes No
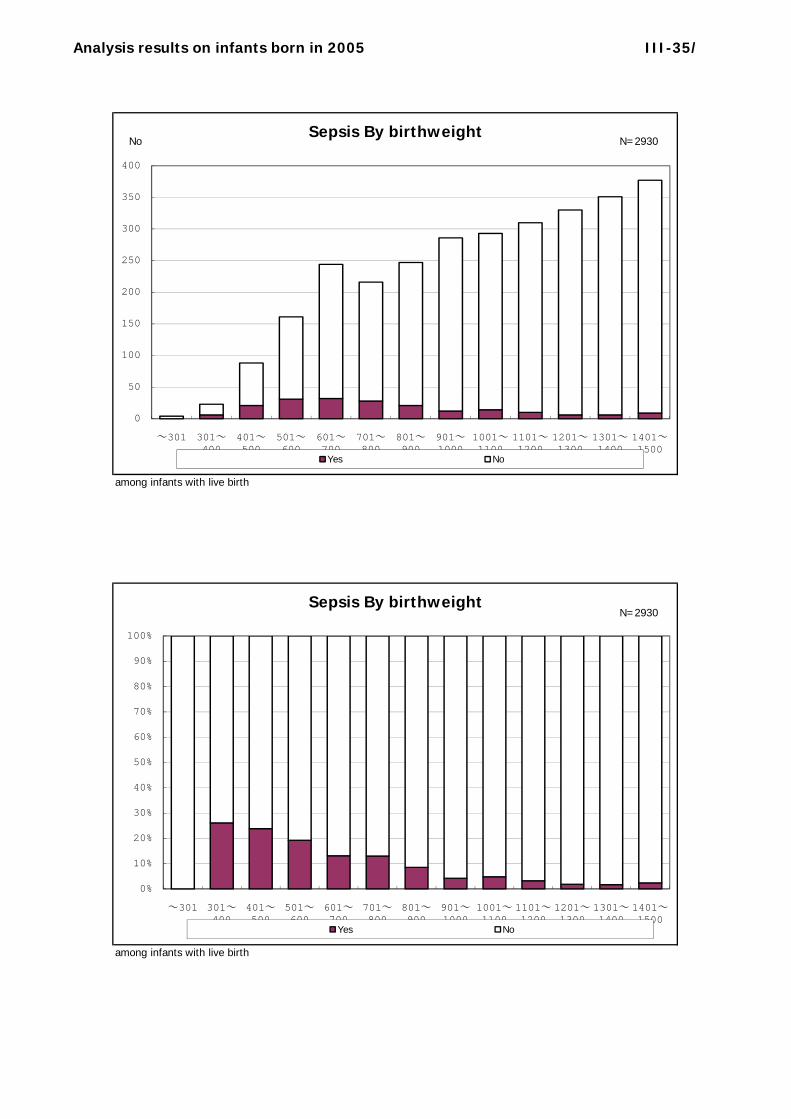
Analysis results on infants born in 2005 III-35/
NoSepsis By birthweight
N=2930
among infants with live birth
0
50
100
150
200
250
300
350
400
~301 301~400
401~500
501~600
601~700
701~800
801~900
901~1000
1001~1100
1101~1200
1201~1300
1301~1400
1401~1500
Yes No
Sepsis By birthweightN=2930
among infants with live birth
0%
10%
20%
30%
40%
50%
60%
70%
80%
90%
100%
~301 301~400
401~500
501~600
601~700
701~800
801~900
901~1000
1001~1100
1101~1200
1201~1300
1301~1400
1401~1500
Yes No

Analysis results on infants born in 2005 III-36/
NoUse of antibiotics By birthweight
N=2331
among infants with live birth
0
50
100
150
200
250
300
350
~301 301~400
401~500
501~600
601~700
701~800
801~900
901~1000
1001~1100
1101~1200
1201~1300
1301~1400
1401~1500
Yes No
Use of antibiotics By birthweightN=2331
among infants with live birth
0%
10%
20%
30%
40%
50%
60%
70%
80%
90%
100%
~301 301~400
401~500
501~600
601~700
701~800
801~900
901~1000
1001~1100
1101~1200
1201~1300
1301~1400
1401~1500
Yes No
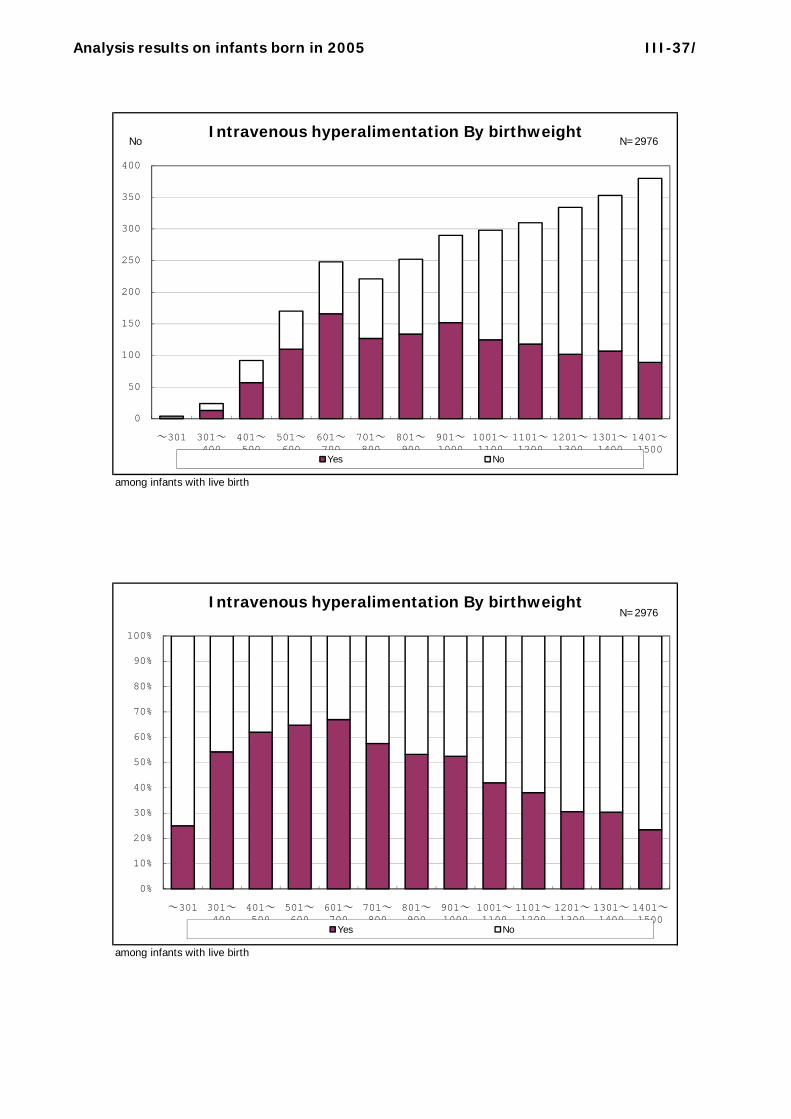
Analysis results on infants born in 2005 III-37/
NoIntravenous hyperalimentation By birthweight
N=2976
among infants with live birth
0
50
100
150
200
250
300
350
400
~301 301~400
401~500
501~600
601~700
701~800
801~900
901~1000
1001~1100
1101~1200
1201~1300
1301~1400
1401~1500
Yes No
Intravenous hyperalimentation By birthweightN=2976
among infants with live birth
0%
10%
20%
30%
40%
50%
60%
70%
80%
90%
100%
~301 301~400
401~500
501~600
601~700
701~800
801~900
901~1000
1001~1100
1101~1200
1201~1300
1301~1400
1401~1500
Yes No
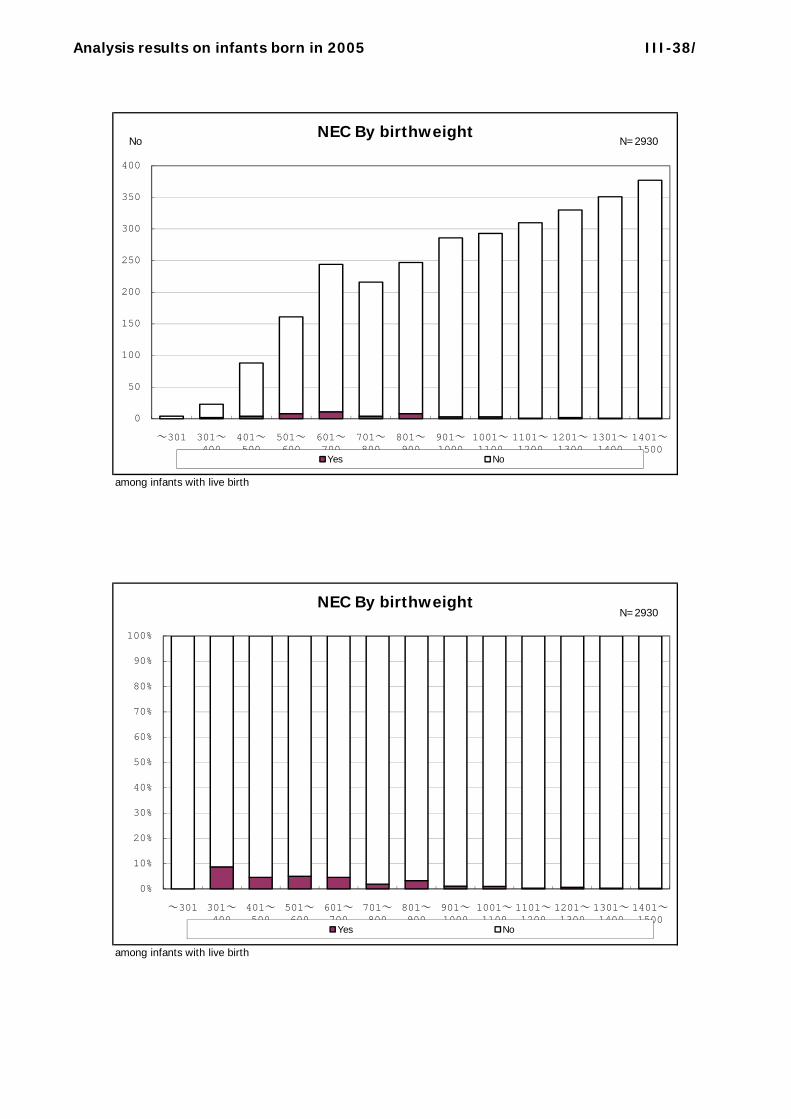
Analysis results on infants born in 2005 III-38/
NoNEC By birthweight
N=2930
among infants with live birth
0
50
100
150
200
250
300
350
400
~301 301~400
401~500
501~600
601~700
701~800
801~900
901~1000
1001~1100
1101~1200
1201~1300
1301~1400
1401~1500
Yes No
NEC By birthweightN=2930
among infants with live birth
0%
10%
20%
30%
40%
50%
60%
70%
80%
90%
100%
~301 301~400
401~500
501~600
601~700
701~800
801~900
901~1000
1001~1100
1101~1200
1201~1300
1301~1400
1401~1500
Yes No

Analysis results on infants born in 2005 III-39/
NoIdiopathic intestinal perforation By birthweight
N=3000
among infants with live birth
0
50
100
150
200
250
300
350
400
450
~301 301~400
401~500
501~600
601~700
701~800
801~900
901~1000
1001~1100
1101~1200
1201~1300
1301~1400
1401~1500
Yes No
Idiopathic intestinal perforation By birthweightN=3000
among infants with live birth
0%
10%
20%
30%
40%
50%
60%
70%
80%
90%
100%
~301 301~400
401~500
501~600
601~700
701~800
801~900
901~1000
1001~1100
1101~1200
1201~1300
1301~1400
1401~1500
Yes No
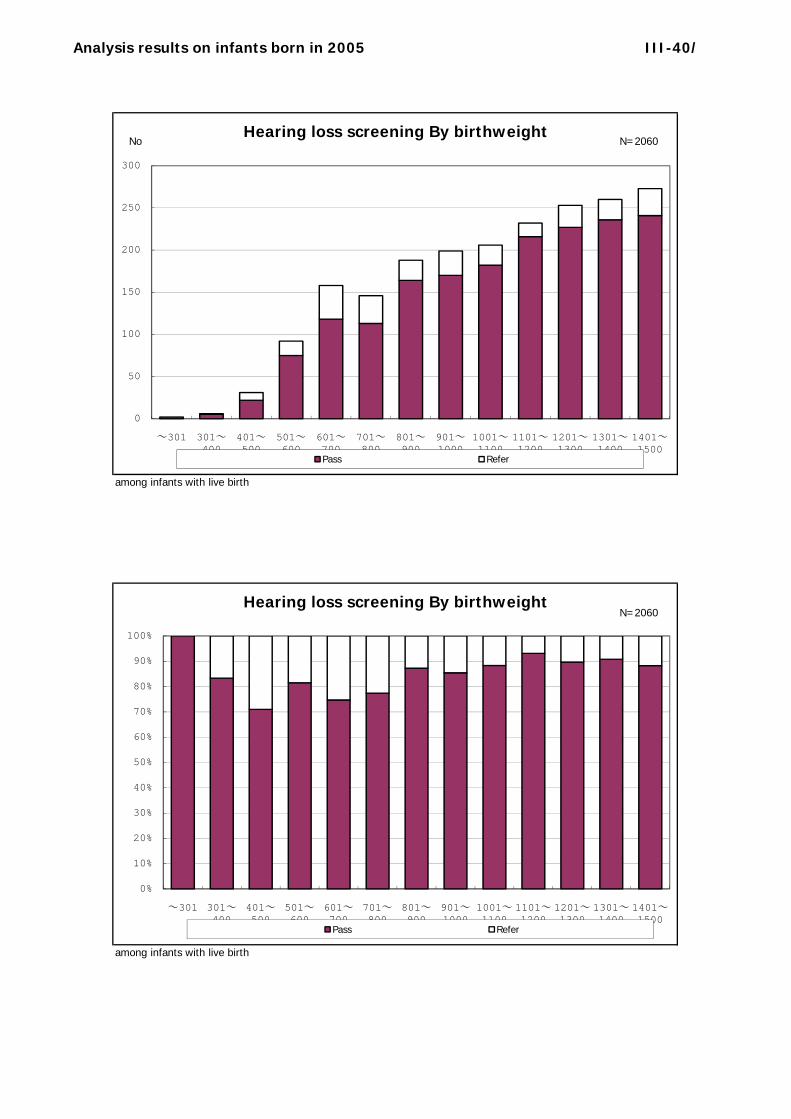
Analysis results on infants born in 2005 III-40/
NoHearing loss screening By birthweight
N=2060
among infants with live birth
0
50
100
150
200
250
300
~301 301~400
401~500
501~600
601~700
701~800
801~900
901~1000
1001~1100
1101~1200
1201~1300
1301~1400
1401~1500
Pass Refer
Hearing loss screening By birthweightN=2060
among infants with live birth
0%
10%
20%
30%
40%
50%
60%
70%
80%
90%
100%
~301 301~400
401~500
501~600
601~700
701~800
801~900
901~1000
1001~1100
1101~1200
1201~1300
1301~1400
1401~1500
Pass Refer
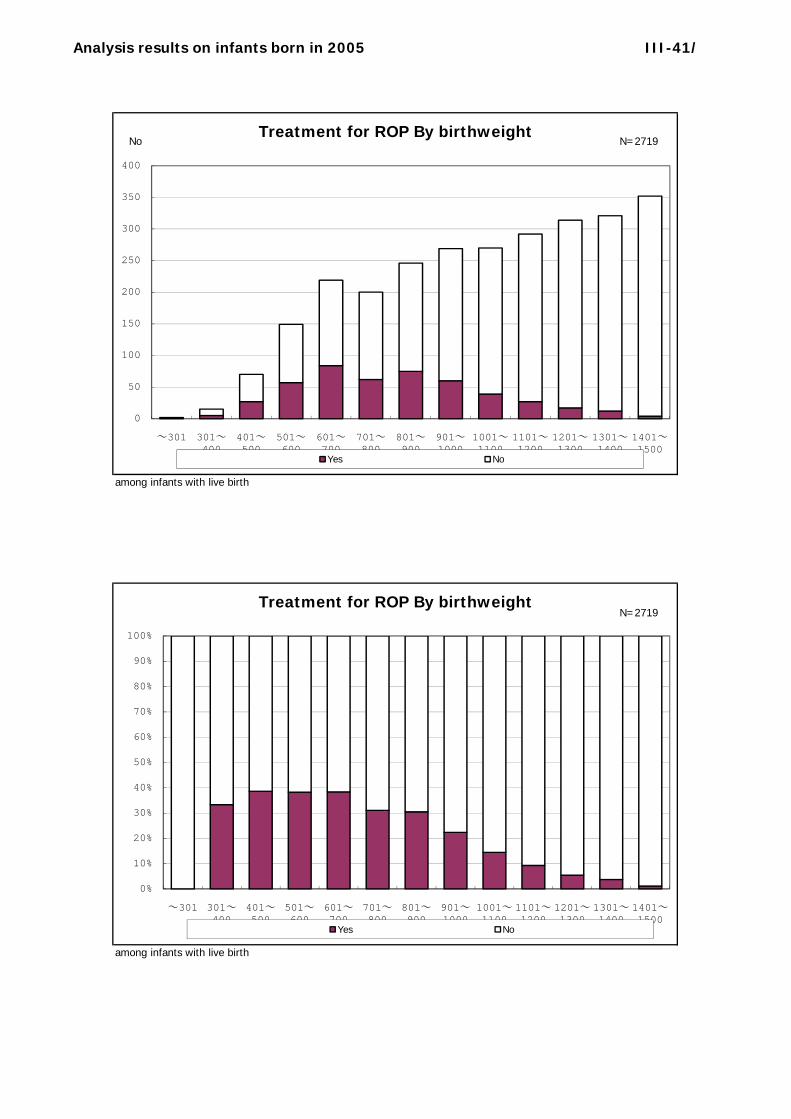
Analysis results on infants born in 2005 III-41/
NoTreatment for ROP By birthweight
N=2719
among infants with live birth
0
50
100
150
200
250
300
350
400
~301 301~400
401~500
501~600
601~700
701~800
801~900
901~1000
1001~1100
1101~1200
1201~1300
1301~1400
1401~1500
Yes No
Treatment for ROP By birthweightN=2719
among infants with live birth
0%
10%
20%
30%
40%
50%
60%
70%
80%
90%
100%
~301 301~400
401~500
501~600
601~700
701~800
801~900
901~1000
1001~1100
1101~1200
1201~1300
1301~1400
1401~1500
Yes No
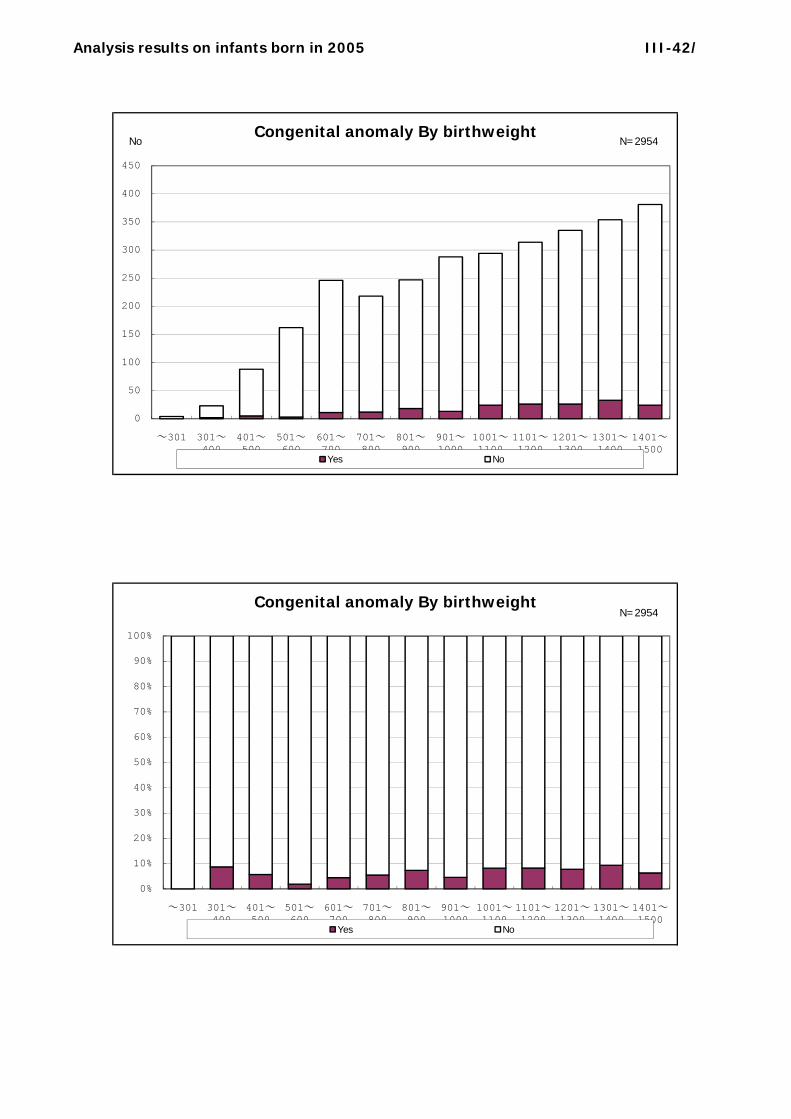
Analysis results on infants born in 2005 III-42/
NoCongenital anomaly By birthweight
N=2954
0
50
100
150
200
250
300
350
400
450
~301 301~400
401~500
501~600
601~700
701~800
801~900
901~1000
1001~1100
1101~1200
1201~1300
1301~1400
1401~1500
Yes No
Congenital anomaly By birthweightN=2954
0%
10%
20%
30%
40%
50%
60%
70%
80%
90%
100%
~301 301~400
401~500
501~600
601~700
701~800
801~900
901~1000
1001~1100
1101~1200
1201~1300
1301~1400
1401~1500
Yes No

Analysis results on infants born in 2005 III-43/
NoOperation for congenital anomaly By birthweight
N=171
among infants with live birth and congenital anomaly
0
5
10
15
20
25
30
~301 301~400
401~500
501~600
601~700
701~800
801~900
901~1000
1001~1100
1101~1200
1201~1300
1301~1400
1401~1500
Yes No
Operation for congenital anomaly By birthweightN=171
among infants with live birth and congenital anomaly
0%
10%
20%
30%
40%
50%
60%
70%
80%
90%
100%
~301 301~400
401~500
501~600
601~700
701~800
801~900
901~1000
1001~1100
1101~1200
1201~1300
1301~1400
1401~1500
Yes No
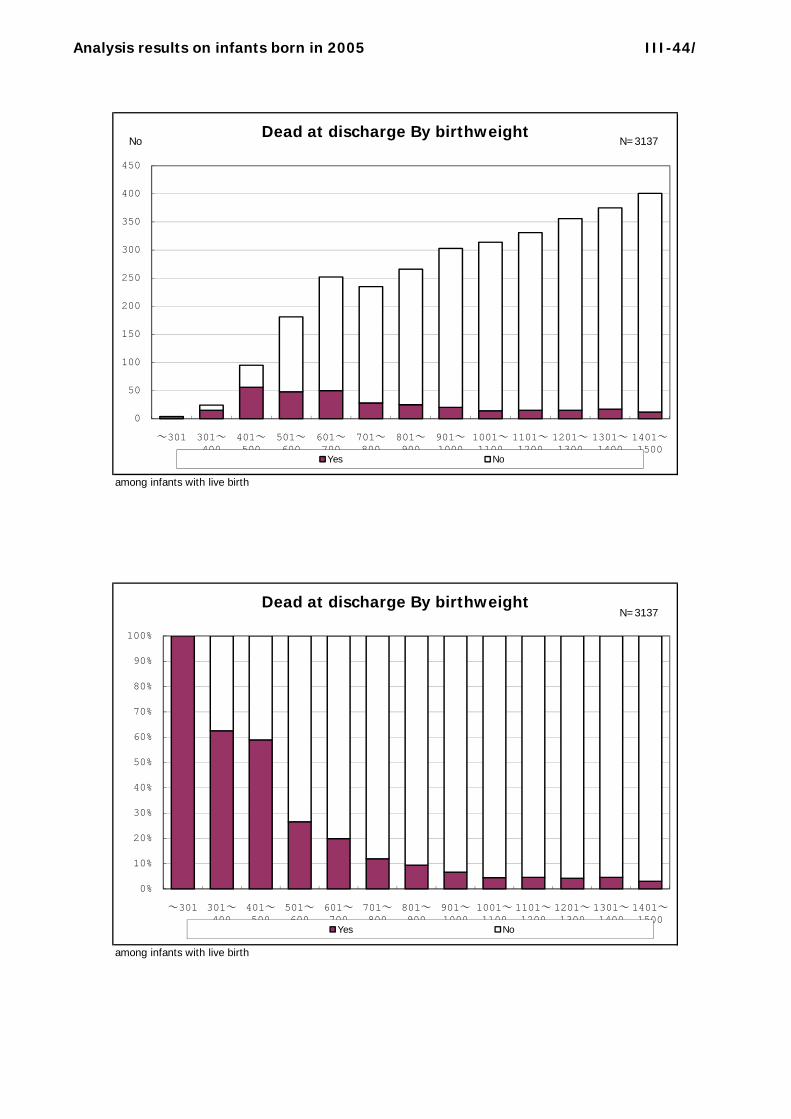
Analysis results on infants born in 2005 III-44/
NoDead at discharge By birthweight
N=3137
among infants with live birth
0
50
100
150
200
250
300
350
400
450
~301 301~400
401~500
501~600
601~700
701~800
801~900
901~1000
1001~1100
1101~1200
1201~1300
1301~1400
1401~1500
Yes No
Dead at discharge By birthweightN=3137
among infants with live birth
0%
10%
20%
30%
40%
50%
60%
70%
80%
90%
100%
~301 301~400
401~500
501~600
601~700
701~800
801~900
901~1000
1001~1100
1101~1200
1201~1300
1301~1400
1401~1500
Yes No
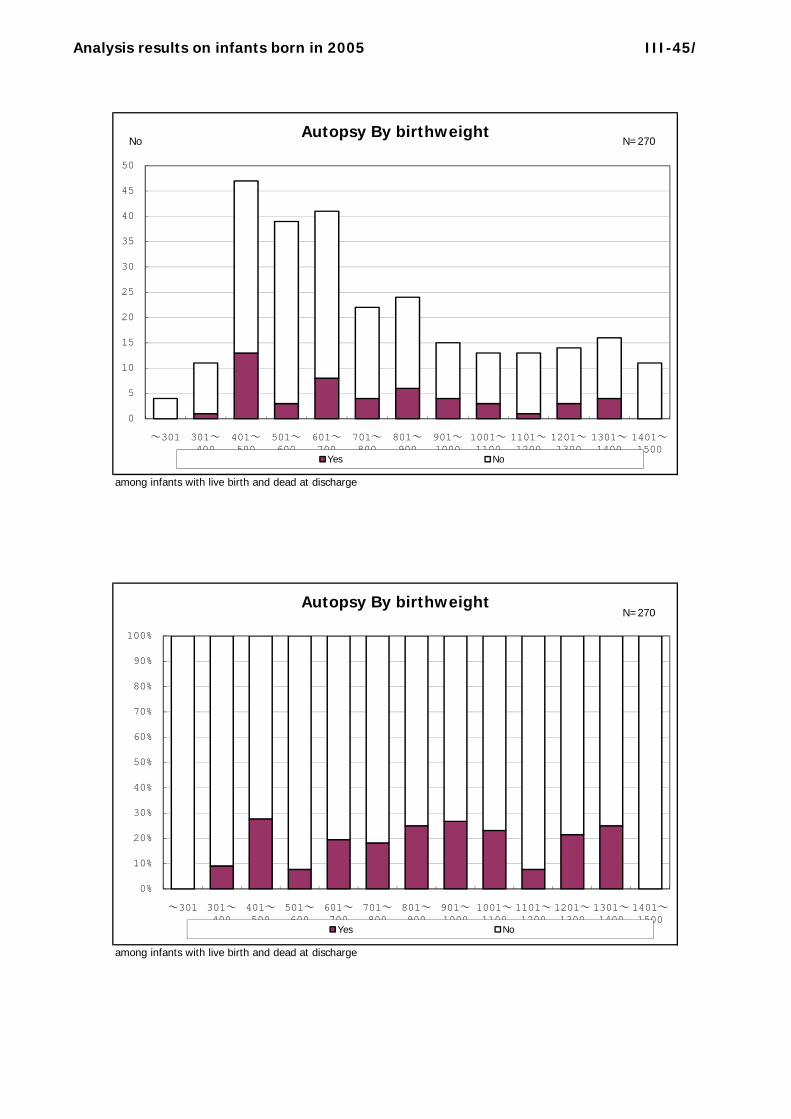
Analysis results on infants born in 2005 III-45/
NoAutopsy By birthweight
N=270
among infants with live birth and dead at discharge
0
5
10
15
20
25
30
35
40
45
50
~301 301~400
401~500
501~600
601~700
701~800
801~900
901~1000
1001~1100
1101~1200
1201~1300
1301~1400
1401~1500
Yes No
Autopsy By birthweightN=270
among infants with live birth and dead at discharge
0%
10%
20%
30%
40%
50%
60%
70%
80%
90%
100%
~301 301~400
401~500
501~600
601~700
701~800
801~900
901~1000
1001~1100
1101~1200
1201~1300
1301~1400
1401~1500
Yes No
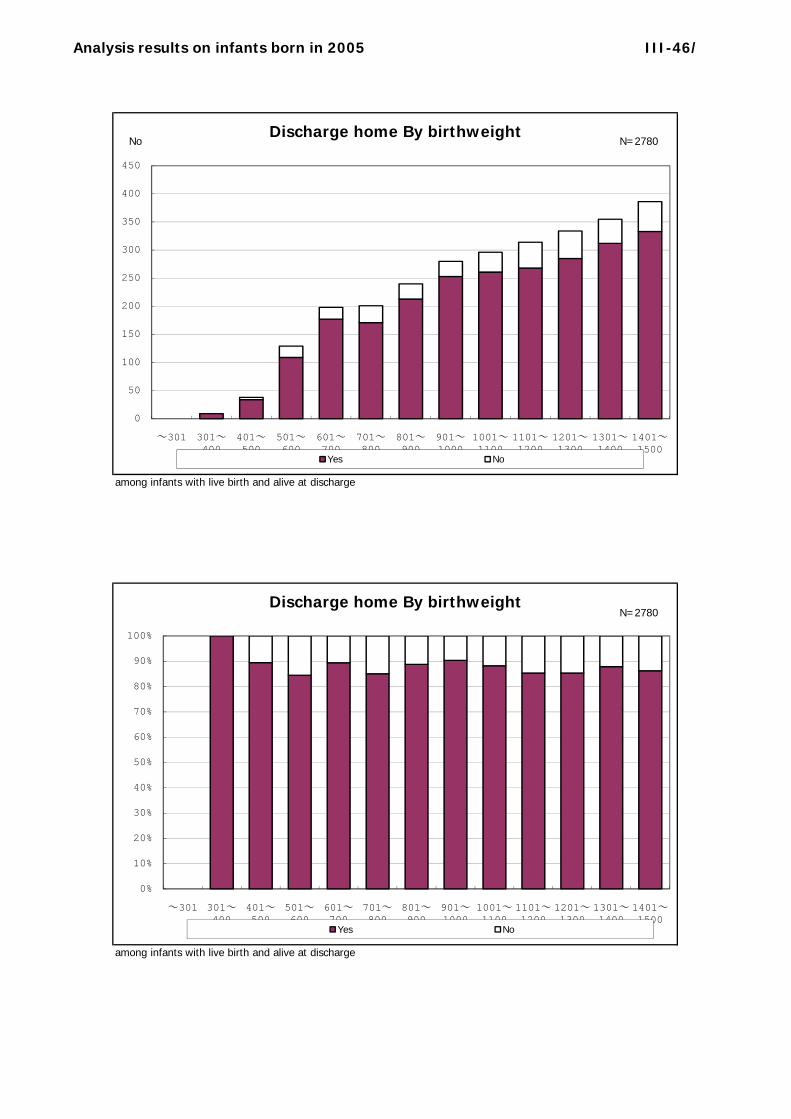
Analysis results on infants born in 2005 III-46/
NoDischarge home By birthweight
N=2780
among infants with live birth and alive at discharge
0
50
100
150
200
250
300
350
400
450
~301 301~400
401~500
501~600
601~700
701~800
801~900
901~1000
1001~1100
1101~1200
1201~1300
1301~1400
1401~1500
Yes No
Discharge home By birthweightN=2780
among infants with live birth and alive at discharge
0%
10%
20%
30%
40%
50%
60%
70%
80%
90%
100%
~301 301~400
401~500
501~600
601~700
701~800
801~900
901~1000
1001~1100
1101~1200
1201~1300
1301~1400
1401~1500
Yes No
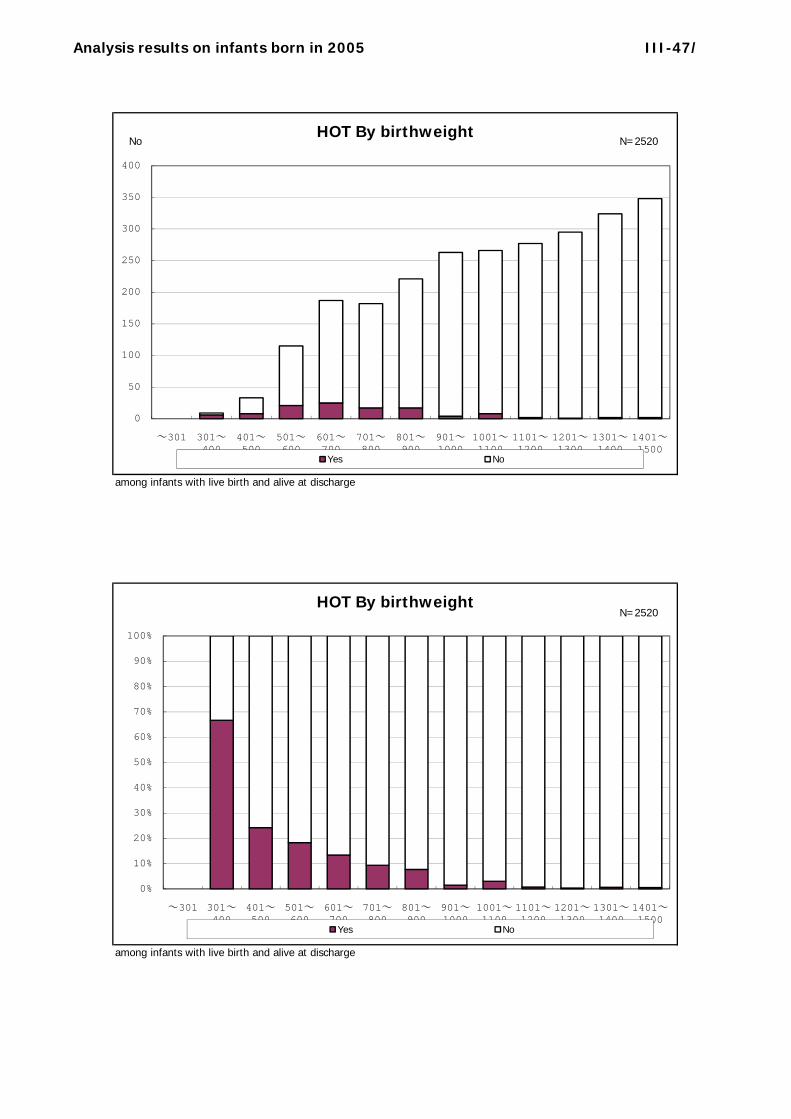
Analysis results on infants born in 2005 III-47/
NoHOT By birthweight
N=2520
among infants with live birth and alive at discharge
0
50
100
150
200
250
300
350
400
~301 301~400
401~500
501~600
601~700
701~800
801~900
901~1000
1001~1100
1101~1200
1201~1300
1301~1400
1401~1500
Yes No
HOT By birthweightN=2520
among infants with live birth and alive at discharge
0%
10%
20%
30%
40%
50%
60%
70%
80%
90%
100%
~301 301~400
401~500
501~600
601~700
701~800
801~900
901~1000
1001~1100
1101~1200
1201~1300
1301~1400
1401~1500
Yes No
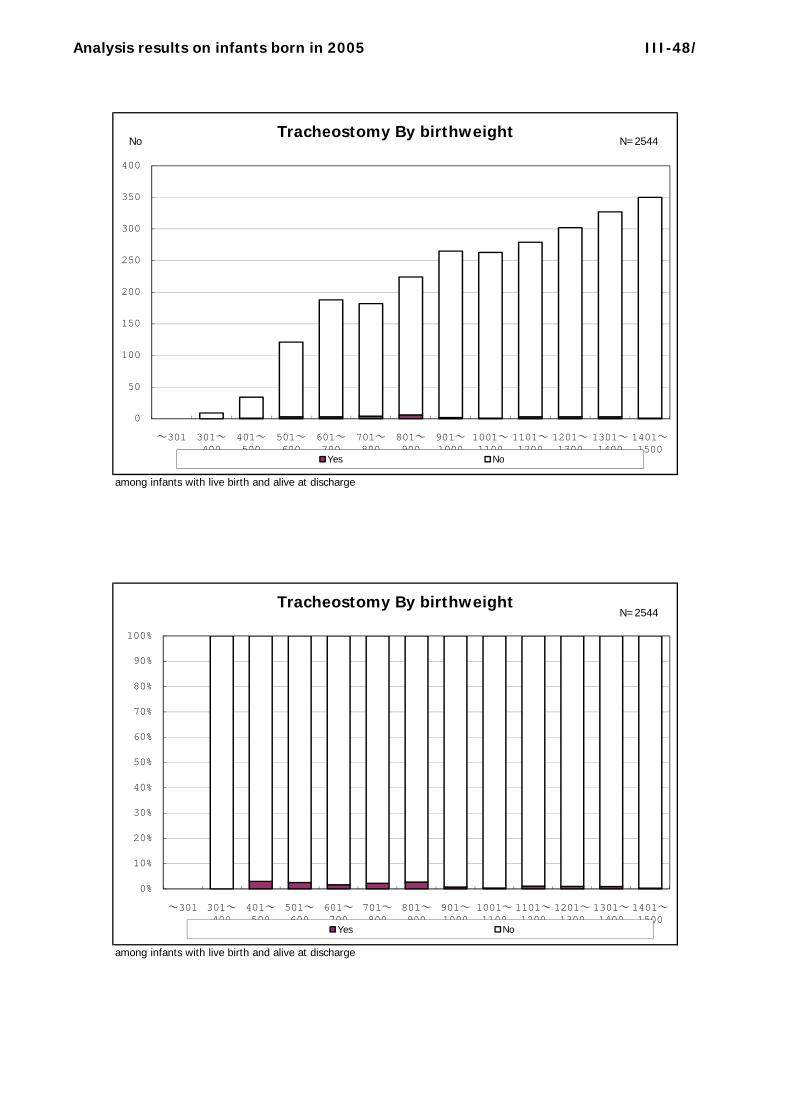
Analysis results on infants born in 2005 III-48/
NoTracheostomy By birthweight
N=2544
among infants with live birth and alive at discharge
0
50
100
150
200
250
300
350
400
~301 301~400
401~500
501~600
601~700
701~800
801~900
901~1000
1001~1100
1101~1200
1201~1300
1301~1400
1401~1500
Yes No
Tracheostomy By birthweightN=2544
among infants with live birth and alive at discharge
0%
10%
20%
30%
40%
50%
60%
70%
80%
90%
100%
~301 301~400
401~500
501~600
601~700
701~800
801~900
901~1000
1001~1100
1101~1200
1201~1300
1301~1400
1401~1500
Yes No