Embed Size (px)
Citation preview
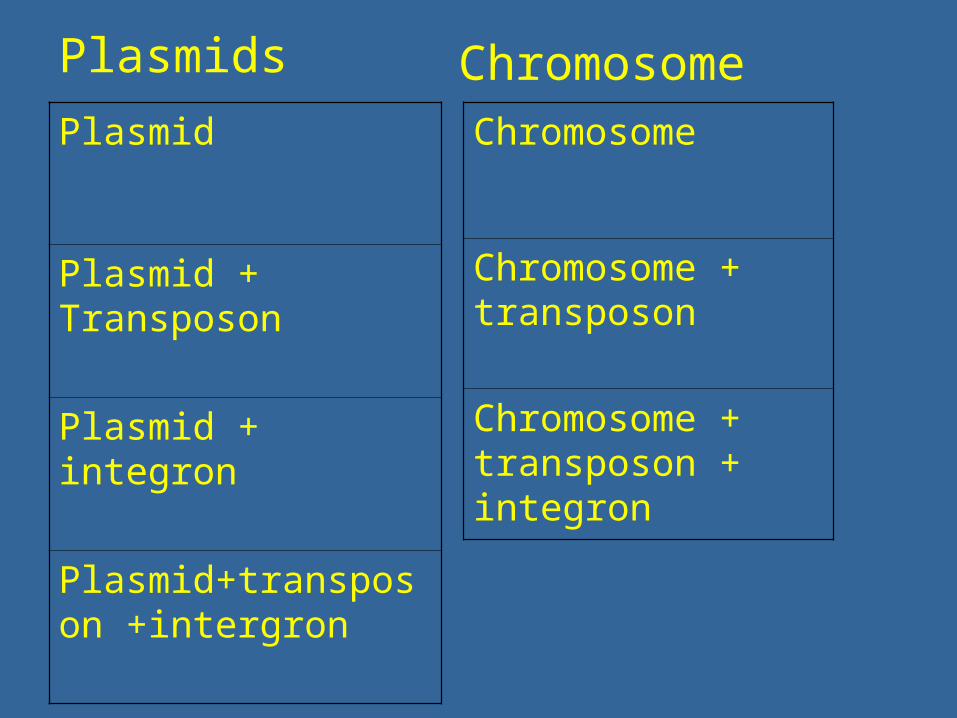
Plasmids ChromosomePlasmid
Plasmid + Transposon
Plasmid + integron
Plasmid+transposon +intergron
Chromosome
Chromosome + transposon
Chromosome + transposon + integron
Antimicrobials 4: Testing and Selection
Dr Fiona Walsh
Role of Antibiotic Therapy
• Prevention or Cure
• Cure or control
• Benefits outweigh disadvantages
• Efficient treatment– Test bacteria sensitivity– Understand antibiotic in human body
Objectives of lecture
• Sensitivity/Resistance testing methods
• Pharmacokinetics– Science of time course of drug in body– Increase effectiveness/reduce toxicity
• Pharmacodynamics– Relationship between drug concentration at site of
infection and pharmacological response
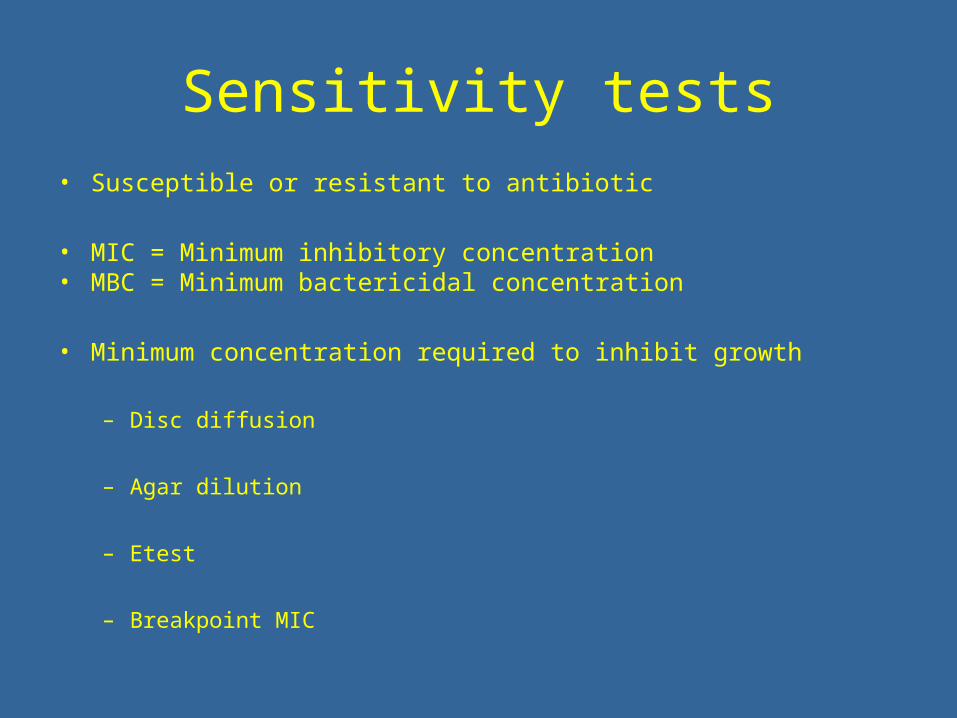
Sensitivity tests• Susceptible or resistant to antibiotic
• MIC = Minimum inhibitory concentration• MBC = Minimum bactericidal concentration
• Minimum concentration required to inhibit growth
– Disc diffusion
– Agar dilution
– Etest
– Breakpoint MIC

Diffusion of antibiotic from a paper disc
After Incubation
Zone of Sensitivity
Concentration of antibiotic at
periphery of zone equals the MIC
Disc
Area of Bacterial growth
Disc
Concentration Gradient
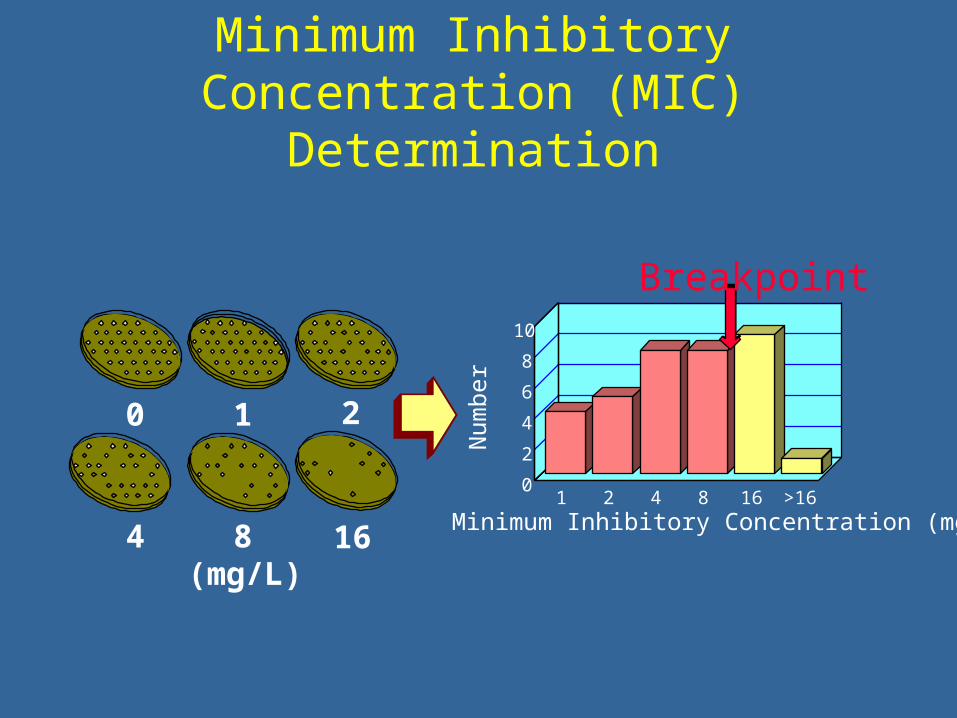
1 2 4 8 16 >16Minimum Inhibitory Concentration (mg/L)
0
2
4
6
8
10
Num
ber
Breakpoint
(mg/L)
0
4
1
8
2
16
Minimum Inhibitory Concentration (MIC) Determination
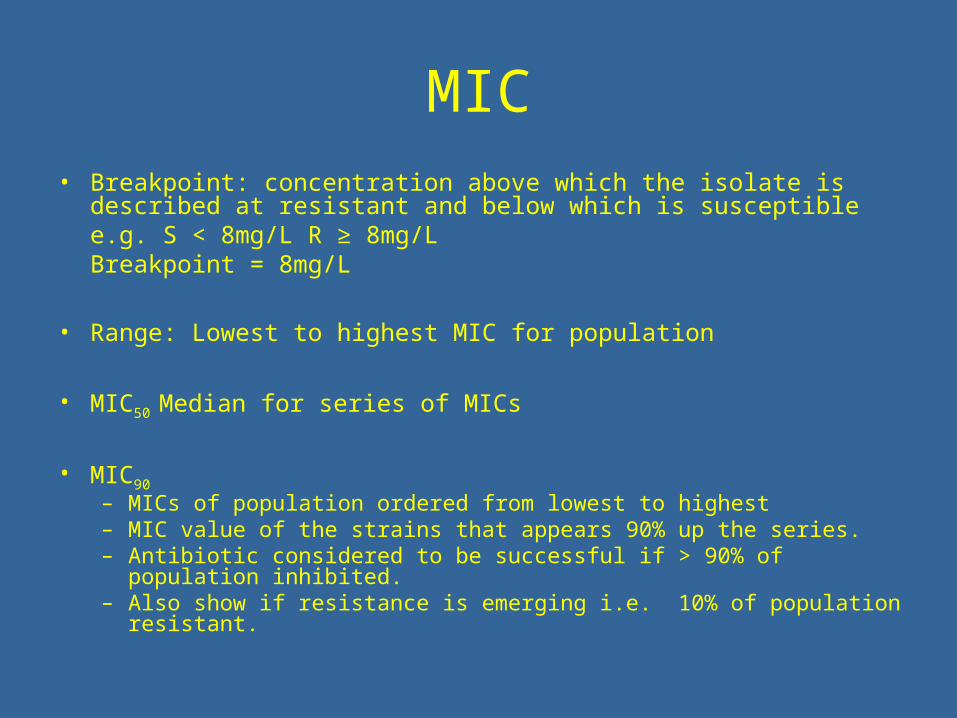
MIC• Breakpoint: concentration above which the isolate is described at
resistant and below which is susceptible e.g. S < 8mg/L R ≥ 8mg/L Breakpoint = 8mg/L
• Range: Lowest to highest MIC for population
• MIC50 Median for series of MICs
• MIC90 – MICs of population ordered from lowest to highest– MIC value of the strains that appears 90% up the series. – Antibiotic considered to be successful if > 90% of population inhibited. – Also show if resistance is emerging i.e. 10% of population resistant.

Minimum Inhibitory ConcentrationsMIC 50, MIC90 and Range
MIC series
0
2
4
6
8
10
12
14
16
1 11 21 31 41 51 61 71 81 91
Bacteria 1 to 100
MIC (mg/L)
Series1
MIC50
MIC90
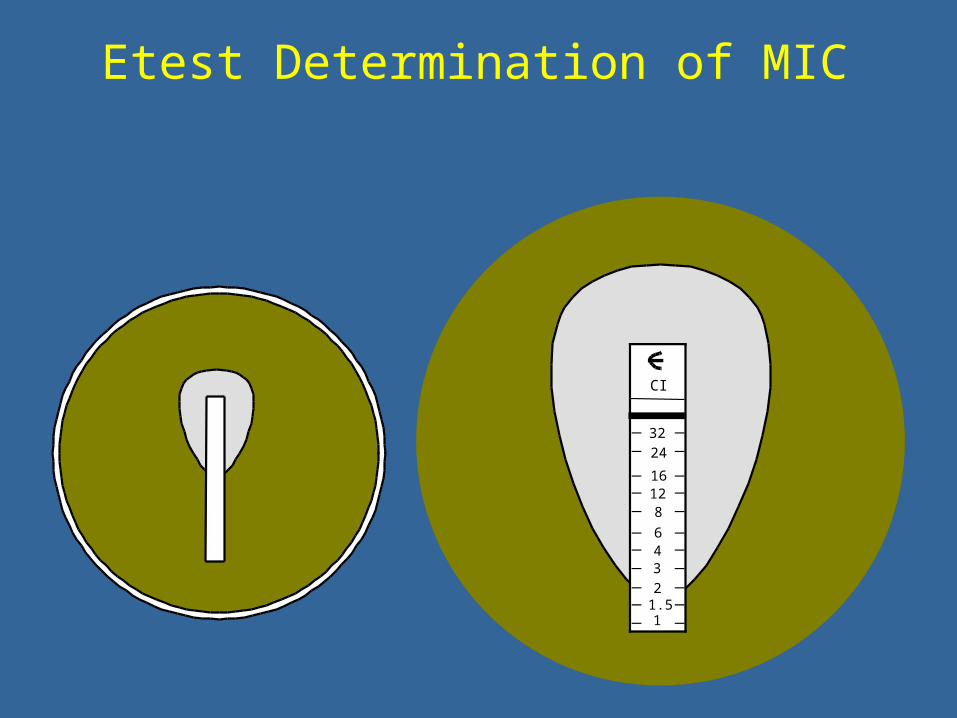
Etest Determination of MIC
16
8
4
32
24
12
6
3
21.51
CI
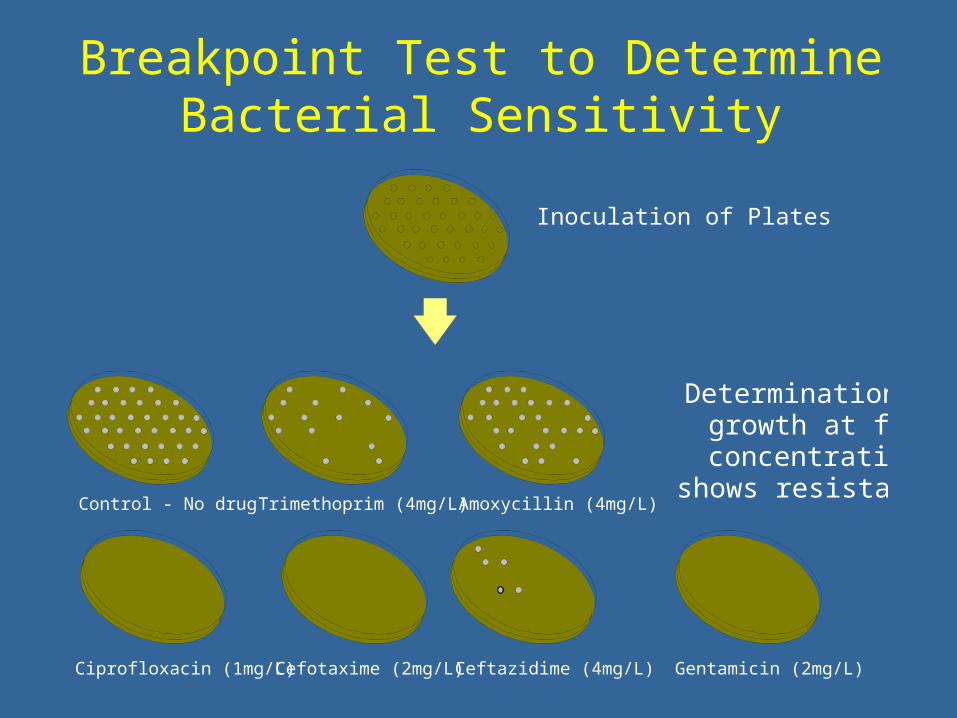
Breakpoint Test to Determine Bacterial Sensitivity
Trimethoprim (4mg/L)
Inoculation of Plates
Determination of growth at fixed concentrations
shows resistanceAmoxycillin (4mg/L)
Gentamicin (2mg/L)Ciprofloxacin (1mg/L) Cefotaxime (2mg/L) Ceftazidime (4mg/L)
Control - No drug
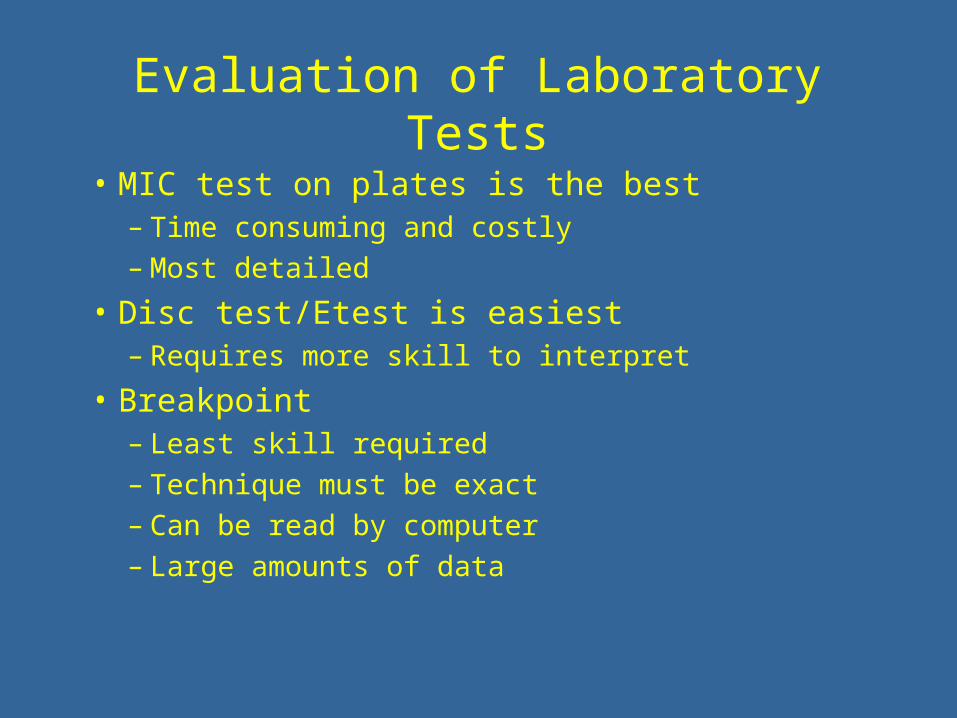
Evaluation of Laboratory Tests
• MIC test on plates is the best– Time consuming and costly– Most detailed
• Disc test/Etest is easiest– Requires more skill to interpret
• Breakpoint– Least skill required– Technique must be exact– Can be read by computer– Large amounts of data
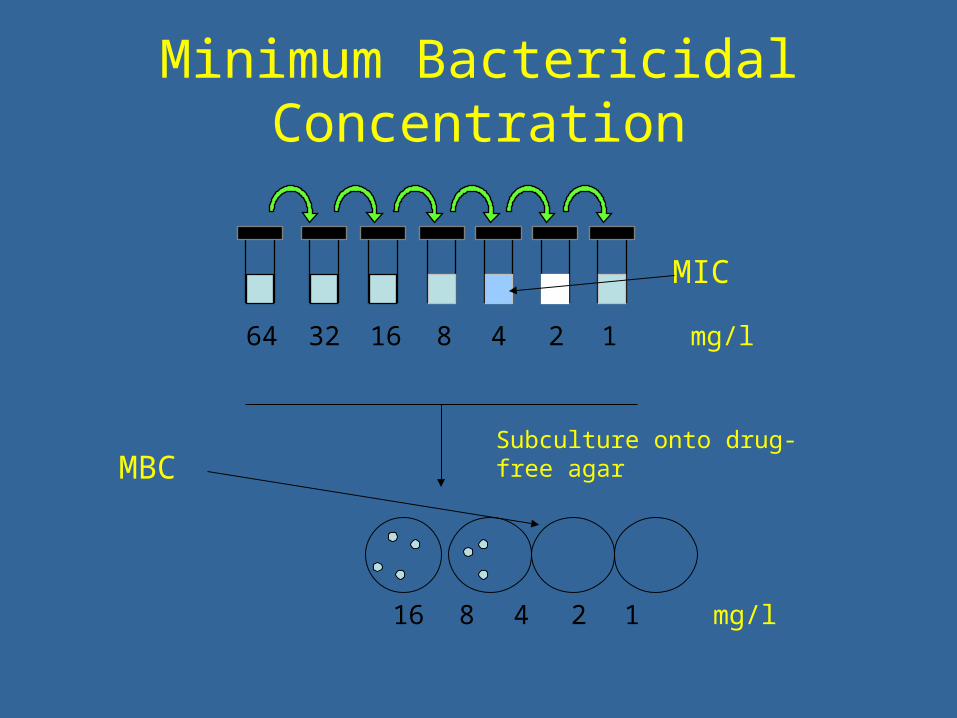
Minimum Bactericidal Concentration
MIC
64 32 16 8 4 2 1 mg/l
Subculture onto drug-free agar
16 8 4 2 1 mg/l
MBC
Pharmacokinetics/Pharmacodynamics
• General terms for any drug, not antibiotic specific
• The term pharmacokinetics is used to define the time course of drug absorption, distribution, metabolism and excretion.
• The term pharmacodynamics refers to the relationship between drug concentration at the site of action and pharmacologic response.
– However, when we apply these principles to antimicrobial therapy there are a number of factors that can alter the predicted outcome of therapy.
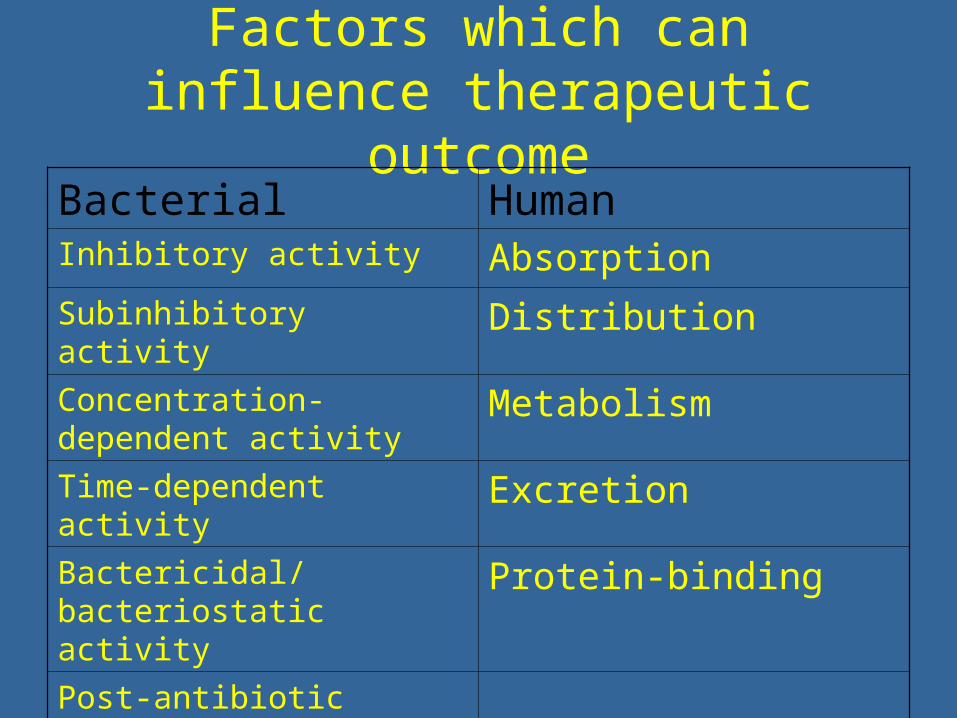
Factors which can influence therapeutic outcome
Bacterial HumanInhibitory activity Absorption
Subinhibitory activity Distribution
Concentration-dependent activity
Metabolism
Time-dependent activity Excretion
Bactericidal/bacteriostatic activity
Protein-binding
Post-antibiotic effect
Resistance
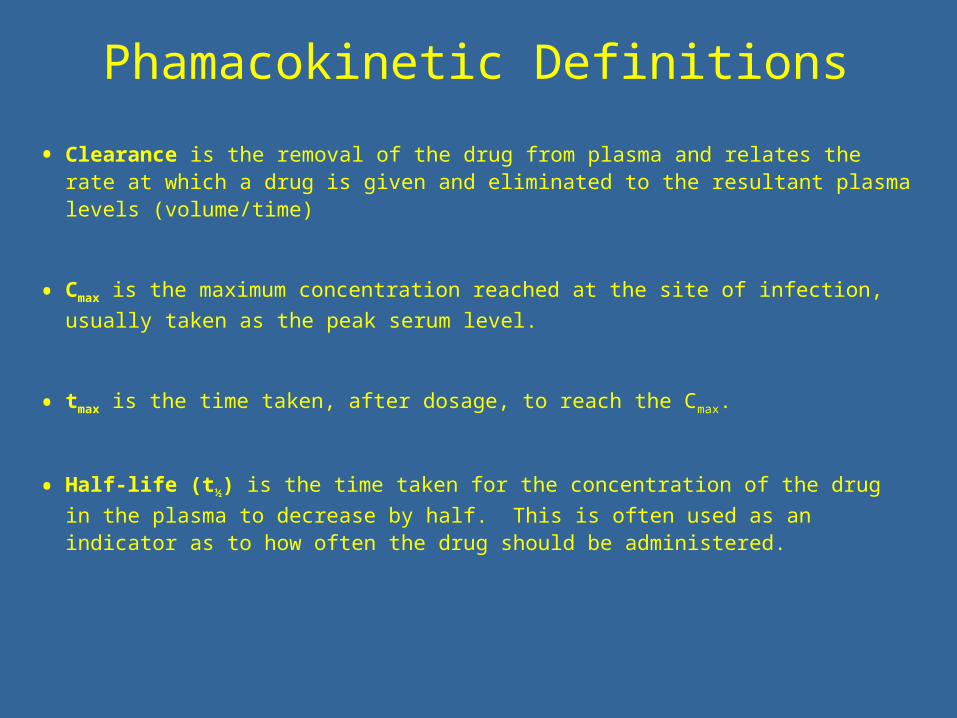
Phamacokinetic Definitions
• Clearance is the removal of the drug from plasma and relates the rate at which a drug is given and eliminated to the resultant plasma levels (volume/time)
• Cmax is the maximum concentration reached at the site of infection, usually
taken as the peak serum level.
• tmax is the time taken, after dosage, to reach the Cmax.
• Half-life (t½) is the time taken for the concentration of the drug in the plasma to
decrease by half. This is often used as an indicator as to how often the drug should be administered.

Phamacokinetic Definitions
• Area Under the Curve (AUC) is the parameter that links clearance to dosing. It is easily calculated: Initial concentration / Elimination rate constant.
• Area Under the Inhibitory Curve (AUIC) is an antimicrobial adaptation of AUC, it refers to the concentration of the drug which is able to exert antibacterial activity over a given organism for a specific time. The AUIC is the drug concentration (AUC) divided by the MIC90 for a specific bacterial species.
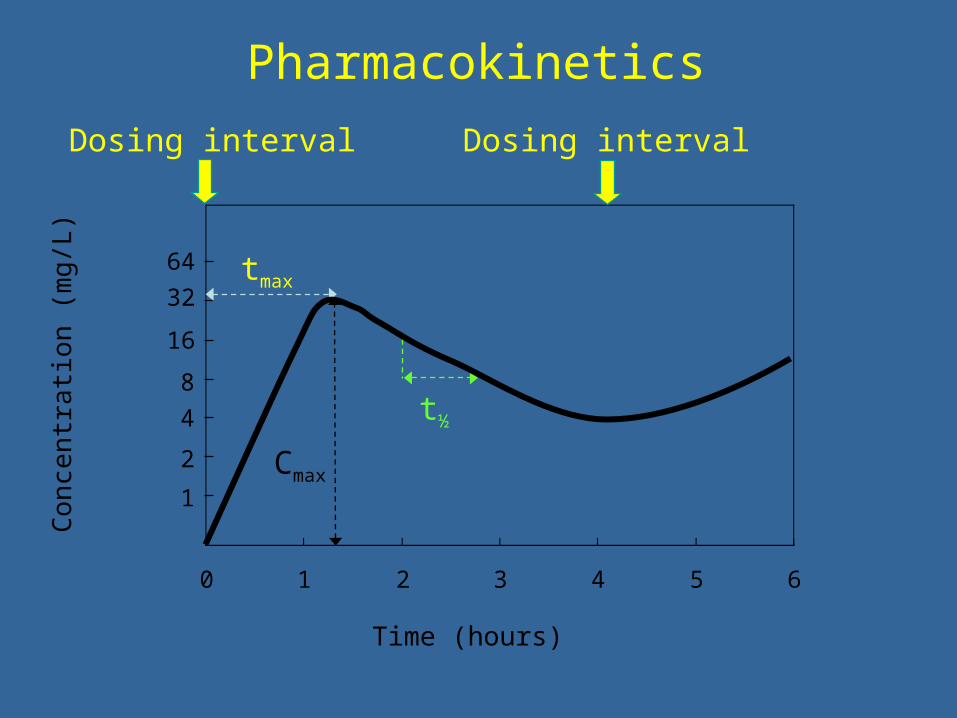
PharmacokineticsC
on
cen
tra
tion
(m
g/L
)
0 1 2 3 4 5 6
Time (hours)
tmax
t½
Dosing interval Dosing interval
64
8
16
32
4
2
1Cmax
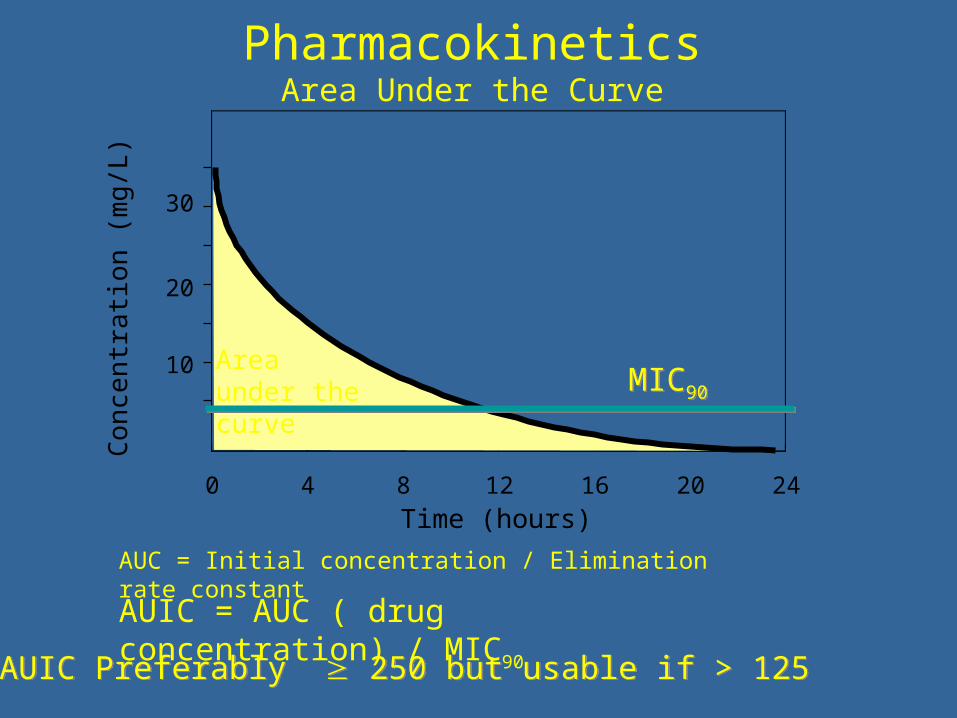
PharmacokineticsArea Under the Curve
Co
nce
ntr
atio
n (
mg
/L)
0 4 8 12 16 20 24
Time (hours)
20
30
10 Area under the curve MIC90MIC90
AUIC Preferably 250 but usable if > 125AUIC Preferably 250 but usable if > 125
AUC = Initial concentration / Elimination rate constant
AUIC = AUC ( drug concentration) / MIC90

Half-lives
• The half-life of the early antibiotics were quite short, perhaps only one hour or so. Therefore the antibiotic had to be administered many times per day.
• With oral versions, this causes problems with patient compliance and with parenteral versions, this becomes expensive in resources.
• Increasingly, the newer antibiotics have much longer half-lives, some up to 33 hours.
• This means that the patient needs to be dosed just once a day in order to maintain sufficient drug concentrations.
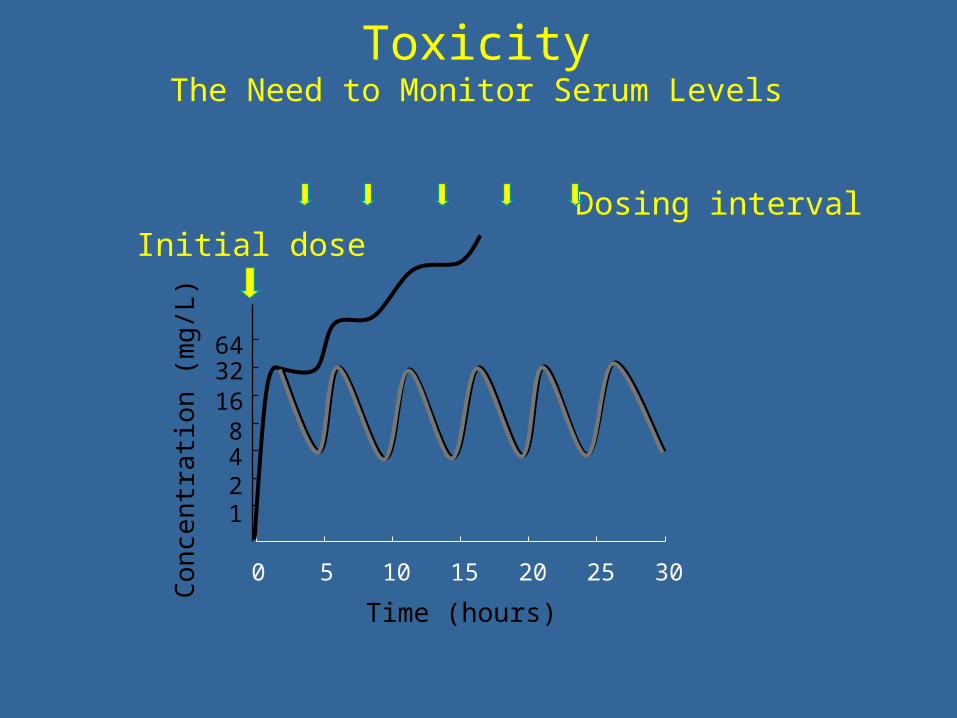
ToxicityThe Need to Monitor Serum Levels
Co
nce
ntr
atio
n (
mg
/L)
0 5 10 15 20 25 30
Time (hours)
Initial dose
64
81632
421
Dosing interval
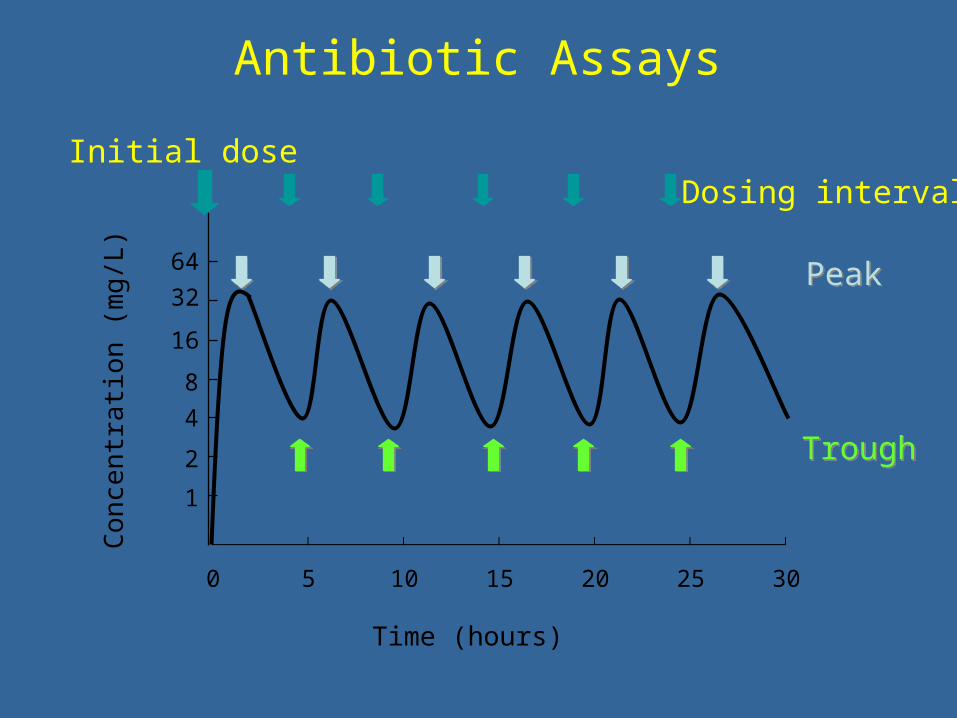
Antibiotic AssaysC
on
cen
tra
tion
(m
g/L
)
0 5 10 15 20 25 30
Time (hours)
64
8
16
32
4
2
1
Initial doseDosing interval
TroughTrough
PeakPeak
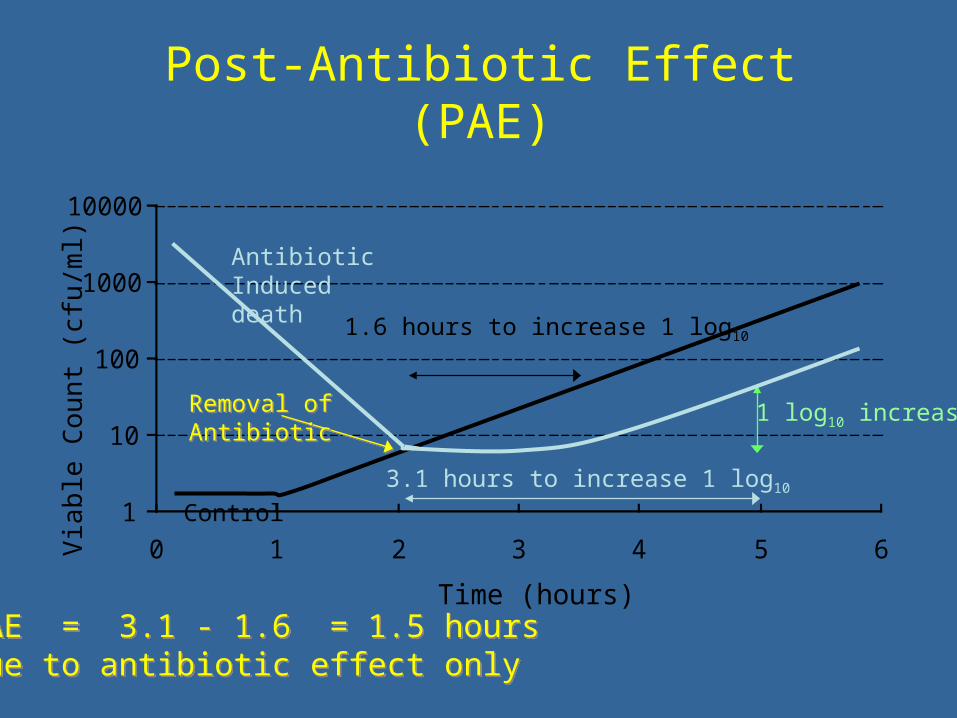
Post-Antibiotic Effect (PAE)
1
10
100
1000
10000
0 1 2 3 4 5 6
Time (hours)
Removal of AntibioticRemoval of Antibiotic
Via
ble
Co
unt
(cf
u/m
l)
Control
1.6 hours to increase 1 log10
1 log10 increase
3.1 hours to increase 1 log10
Antibiotic Induced death
PAE = 3.1 - 1.6 = 1.5 hours Due to antibiotic effect only PAE = 3.1 - 1.6 = 1.5 hours Due to antibiotic effect only
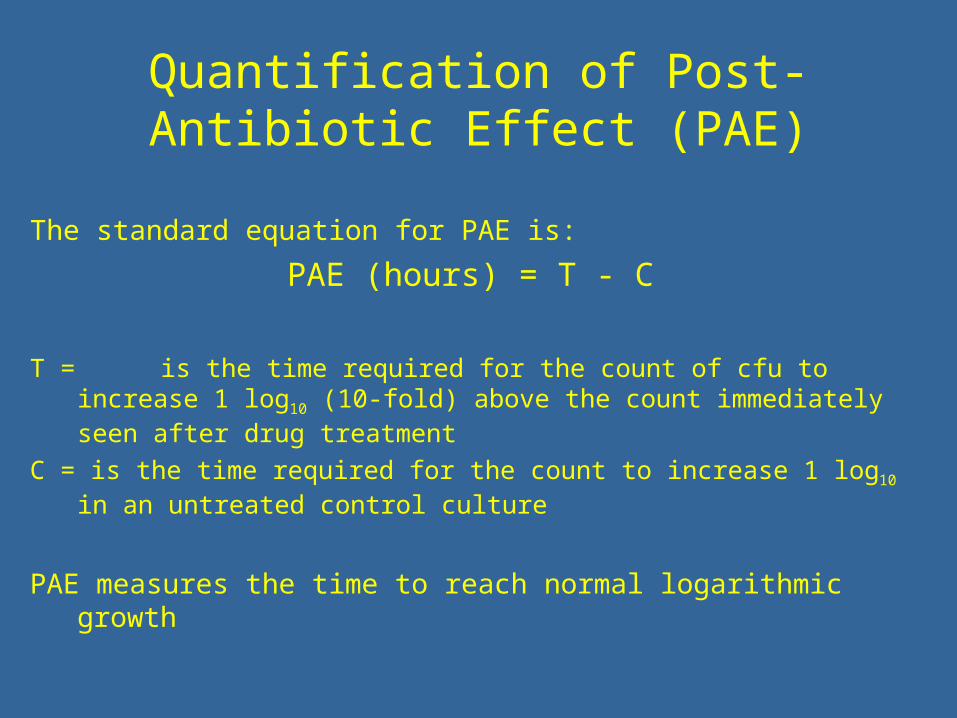
Quantification of Post-Antibiotic Effect (PAE)
The standard equation for PAE is:
PAE (hours) = T - C
T = is the time required for the count of cfu to increase 1 log10 (10-fold) above the count immediately seen after drug treatment
C = is the time required for the count to increase 1 log10 in an untreated control culture
PAE measures the time to reach normal logarithmic growth
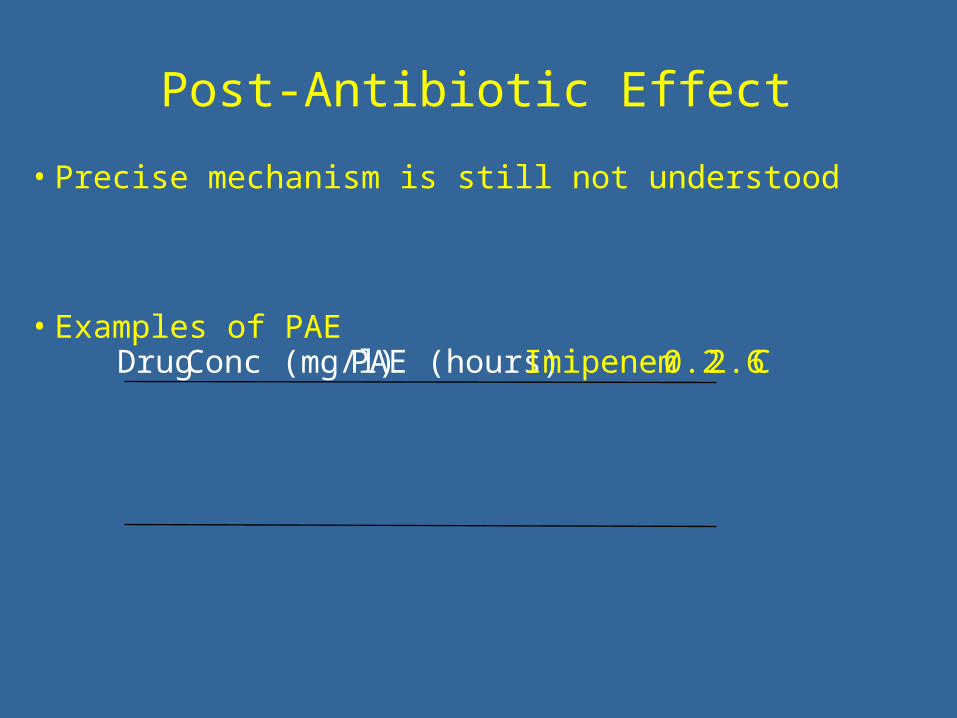
Post-Antibiotic Effect
• Precise mechanism is still not understood
• Examples of PAE
DrugConc (mg/l)PAE (hours)Imipenem0.22.6Ciprofloxacin0.52Gentamicin52Penicillin0.051.5
Summary
• Sensitivity testing– Advantages – Disadvantages
• Pharmacological action of antibiotics– Ideal drug – Influence of factors on performance
• Drug choice– Cheap– Most Effective– Least toxic